


Introduction
Major depressive disorder (MDD) is a highly prevalent disorder, associated with high disability (Murray et al., Reference Murray, Vos, Lozano, Naghavi, Flaxman, Michaud and Lopez2012). It often has a chronic course (Verduijn et al., Reference Verduijn, Verhoeven, Milaneschi, Schoevers, van Hemert, Beekman and Penninx2017) and a third of the patients experience poor treatment outcomes (Gaynes et al., Reference Gaynes, Warden, Trivedi, Wisniewski, Fava and Rush2009). Despite the challenges in finding consensus regarding classification, diagnosis and treatment, there has been a recent and significant increase in research to identify novel methods to measure, unravel aetiology, and treat depressive disorders. Actigraphy, an ecologically valid method to objectively measure disturbances in sleep, circadian rhythm (CR) and physical activity (PA), has become widely used in depression research.
Several studies, including the systematic review of Burton et al. (Reference Burton, McKinstry, Szentagotai Tǎtar, Serrano-Blanco, Pagliari and Wolters2013) and our previous work (Difrancesco et al. Reference Difrancesco, Lamers, Riese, Merikangas, Beekman, van Hemert and Penninx2019; Minaeva et al. Reference Minaeva, Booij, Lamers, Antypa, Schoevers, Wichers and Riese2020), have shown that depressive disorders and symptoms are associated with the lower daily activity (Helgadóttir, Forsell, & Ekblom, Reference Helgadóttir, Forsell and Ekblom2015; Hori et al., Reference Hori, Koga, Hidese, Nagashima, Kim, Higuchi and Kunugi2016; Stubbs et al., Reference Stubbs, Koyanagi, Schuch, Firth, Rosenbaum, Veronese and Vancampfort2016) and CR amplitude (Lyall et al., Reference Lyall, Wyse, Graham, Ferguson, Lyall, Cullen and Smith2018). The association between actigraphy measures of sleep and depression is less clear. Although night-time activity level appears to be higher in patients with depression (Burton et al., Reference Burton, McKinstry, Szentagotai Tǎtar, Serrano-Blanco, Pagliari and Wolters2013), this is not always reflected in actigraphy measures of sleep duration (SD) and sleep efficiency (SE). Despite studies assessing sleep with self-reported questionnaires have shown that both insomnia and hypersomnia are associated with depression (Nutt, Wilson, & Paterson, Reference Nutt, Wilson and Paterson2008; van Mill, Hoogendijk, Vogelzangs, Van Dyck, & Penninx, Reference van Mill, Hoogendijk, Vogelzangs, Van Dyck and Penninx2010), our previous results with actigraphy have found that higher severity of depressive symptom is associated with longer (but not shorter) SD (Difrancesco et al., Reference Difrancesco, Lamers, Riese, Merikangas, Beekman, van Hemert and Penninx2019). Depression is however heterogeneous in its presentation and these results may not be generalizable to all patients.
Symptoms vary substantially in patients with depression and opposite clinical presentations occur. For instance, both insomnia and hypersomnia (Nutt et al., Reference Nutt, Wilson and Paterson2008) and psychomotor retardation and agitation (Avery & Silverman, Reference Avery and Silverman1984) are symptoms of depression. Considering that 1030 unique Diagnostic and Statistical Manual of Mental Disorders-Fifth Edition (DSM-5) symptom profiles have been found among 3703 patients with MDD (Fried & Nesse, Reference Fried and Nesse2015), substantial symptom variation occurs among individuals who all qualify for the same DSM-5 diagnosis. Thus, as the ‘depression’ label provides limited information about the particular problems experienced by a patient, some researchers have moved away from traditional methods of diagnosis such as the DSM-5 and have focused on symptom dimensions (Fried, Reference Fried2017). Although approaches to identify symptom dimensions vary, empirical methods such as factor analyses have been employed to identify symptoms dimensions or factor structures underlying self-reported questionnaires on depressive symptoms in a population-based sample, such as the often used Inventory of Depressive Symptomatology (IDS) (Hegeman et al., Reference Hegeman, Wardenaar, Comijs, de Waal, Kok and van der Mast2012; Rush, Gullion, Basco, Jarrett, & Trivedi, Reference Rush, Gullion, Basco, Jarrett and Trivedi1996; Wardenaar et al., Reference Wardenaar, Van Veen, Giltay, Den Hollander-Gijsman, Penninx and Zitman2010). Most studies illustrate the existence of three major symptom dimensions: mood/cognition, somatic, and sleep symptom dimensions (Hegeman et al., Reference Hegeman, Wardenaar, Comijs, de Waal, Kok and van der Mast2012; Rush et al., Reference Rush, Gullion, Basco, Jarrett and Trivedi1996; Wardenaar et al., Reference Wardenaar, Van Veen, Giltay, Den Hollander-Gijsman, Penninx and Zitman2010).
Although it is clear that depression is heterogeneous, little research has focused on the role of symptoms dimensions assessed with severity measures in sleep and CR disturbances and physical inactivity as assessed objectively with actigraphy. As cognitive impairments have been linked to sleep problems (Mantua & Simonelli, Reference Mantua and Simonelli2019) and physical inactivity has been related to somatic/energy-related symptoms (Puetz, Reference Puetz2006), a differential association with symptom dimensions may be expected. However, this has not properly been investigated so far. A better understanding would be of benefit for the diagnosis and treatment of depression. For instance, pharmacological treatment, psychotherapy and chronotherapies to treat sleep and CR problems can be especially administered to patients with specific symptom dimensions.
The aim of this study was to examine the association between actigraphy-based PA, sleep, and CR with symptom dimensions (i.e. cognition/mood, somatic, sleep). The association with individual depressive symptoms was also explored to further check on the consistency of findings for symptoms within dimensions. To address these questions, we used data from the Netherlands Study of Depression and Anxiety (NESDA) which includes persons without and with current or remitted depressive and/or anxiety disorders. As depression and anxiety are highly comorbid disorders (Lamers et al., Reference Lamers, Van Oppen, Comijs, Smit, Spinhoven, Van Balkom and Penninx2011; Rodney et al., Reference Rodney, Prior, Cooper, Theodores, Browning, Steinberg and Evans1997) with the previously mentioned limitations in traditional diagnosis method and using the full sample gives the opportunity to investigate the associations on a larger spectrum of severity.
Method
Sample
Participants from the NESDA were selected to participate in the Ecological Momentary Assessment (EMA) and Actigraphy sub-study (NESDA-EMAA). Details about NESDA have been provided extensively before (Penninx et al., Reference Penninx, Beekman, Smit, Zitman, Nolen, Spinhoven and van Dyck2008). NESDA was designed to investigate the course of depressive and anxiety disorders over a period of several years and the factors that influence the development and prognosis of such disorders. NESDA participants were initially included at the baseline assessment in 2004–2007 (n = 2981) and seen for the fifth time at the 9-year follow-up assessment wave (2014-2017, n=1776) for a follow-up interview, during which 367 siblings of NESDA participants were added, bringing the 9-year follow-up sample to 2143 subjects. At this wave, 384 participants enrolled for the EMAA sub-study. The NESDA study, including NESDA-EMAA, was approved by the VUmc ethical committee (reference number 2003/183) and all respondents gave informed consent for both the regular interview and the EMAA sub-study. See for a flowchart of the NESDA-EMAA in our previous work (Difrancesco et al., Reference Difrancesco, Lamers, Riese, Merikangas, Beekman, van Hemert and Penninx2019). Participants were eligible if they had a smartphone or were willing to use a smartphone provided by the study, and were willing to wear a wrist-worn actigraphy device. Participants to the EMAA-sub-study were provided with a GENEActiv device (Activinsights Ltd, Kimbolton, UK). Participants wore the wrist-worn GENEActiv actigraphy device for 14 days on their non-dominant wrist. Of the 384 participants included in the NESDA-EMAA study, 14 had no available actigraphy data for several reasons, such as technical failure, resulting in 370 (96.4%) participants with available data. According to previously published criteria (da Silva et al., Reference da Silva, van Hees, Ramires, Knuth, Bielemann, Ekelund and Hallal2014), participant's actigraphy data were included in analyses if at least 1-week day and one weekend day of usable data was available, with at least 16 h recorded per day and per night. The final sample was composed of 359 (93.5%) participants with an average 13.68 ± s.e. 1.26 valid days, of whom 90% completed the protocol for 14 days.
Depressive symptoms and symptom dimensions
The Dutch version of the 30-item IDS, self-report (Rush et al., Reference Rush, Gullion, Basco, Jarrett and Trivedi1996) was used to assess depressive symptoms (0 = no problems to 3 = severe problems) in the previous 7 days. A total sum score can be calculated (range, 0–84), with higher scores indicating higher levels of depressive symptomatology. Validity and reliability have been shown before, with Cronbach's alpha ranging from 0.92 to 0.94 (Rush et al., Reference Rush, Gullion, Basco, Jarrett and Trivedi1996). We used three-dimensional depression symptom sum scores based in prior factor analyses in NESDA (Wardenaar et al., Reference Wardenaar, Van Veen, Giltay, Den Hollander-Gijsman, Penninx and Zitman2010): mood/cognition, somatic/vegetative, and sleep. The mood/cognition dimension consisted of the 16 items: feeling irritable, interpersonal sensitivity, feeling sad, diminished quality of mood, feeling anxious or tense, diminished capacity of pleasure/enjoyment, diminished reactivity of mood, diminished interest in people/activities, suicidal thoughts, future pessimism, concentration/decision-making problems, self-criticism and blame, psychomotor retardation, reduced interest in sex, low energy level/fatigability, leaden paralysis. The somatic/vegetative domain included nine items: panic/phobic symptoms, psychomotor agitation, decreased weight, increase in appetite, other bodily symptoms, decrease in appetite, increased weight, constipation/diarrhoea, aches, and pains. Finally, the sleep domain included four items: early morning awakening, problems sleeping during the night, problems falling asleep, sleeping too much. The item ‘diurnal variation (worse in the morning)’ did not belong to any domain in the factor analyses and was therefore used only in our exploratory analyses with individual symptoms.
Actigraphy estimates of sleep, CR, and PA
In this study, the accelerometer was set to sample at 30 Hz and raw actigraphy data were analysed using an open source R package, GGIR (version 1.5–18). Actigraphy data were gathered after the depressive symptoms assessment with a median number of 23 days between the two assessments. As described before (Difrancesco et al., Reference Difrancesco, Lamers, Riese, Merikangas, Beekman, van Hemert and Penninx2019), we used objective indicators of sleep, CR, and PA. Sleep was assessed as total SD per night [in hh:mm] and SE per night [%]. CR was assessed by the relative amplitude (RA) between daytime and night-time activity per day and sleep midpoint [clock time]. RA describes the amplitude between the activity during the day and the night; lower RA means a dampened CR amplitude suggesting lower activity during the day and higher activity during the night. Sleep midpoint is a proxy of chronotype or preference for morningness/eveningness; later sleep midpoint means a preference for evening chronotype. Exploratory analyses showed that RA and sleep midpoint have low correlation and therefore they describe different aspects of CR (online Supplementary material Table S1). PA is indexed/expressed given as gross motor activity (GMA) per day [milli-gravity (mg), 1 g = 9.81 m/s2]. Daily estimates of each variable were used in the current study.
Covariates and descriptive variables
Covariates were age, sex, and education level expressed in years at the time of the NESDA EMAA sub-study. These covariates were selected as they have an established theoretical association with depression and with sleep, CR and PA levels, and have been regularly used in similar studies (Droomers, Schrijvers, & Mackenbach, Reference Droomers, Schrijvers and Mackenbach2001; Stamatakis, Kaplan, & Roberts, Reference Stamatakis, Kaplan and Roberts2007).
DSM-IV based diagnoses of depressive disorders (dysthymia and MDD) and anxiety (social anxiety disorder, panic disorder with and without agoraphobia, agoraphobia, and generalized anxiety disorder) were established with the Composite International Diagnostic Interview (CIDI, version 2.1) (Wittchen, Reference Wittchen1994). The interviews were conducted at the regular interview by specially trained clinical research staff. Participants were divided into three groups for descriptive purposes only: (1) a group with no lifetime depressive and/or anxiety disorders, (2) a group with remitted depressive and/or anxiety disorders (having a lifetime, but not current (6-month) diagnosis), and (3) a group with current depressive or anxiety disorder in the past 6 months.
Antidepressant use was based on drug container inspection, and medications were coded according to the World Health Organization Anatomical Therapeutic Chemical (ATC) classification. Antidepressant use was considered present if participants reported using it more than 50% of the time. Antidepressants included were selective serotonin reuptake inhibitors (SSRIs, ATC code N06AB), tricyclic antidepressant (TCA, ATC code N06AA) and other antidepressants (ATC codes N06AF, N06AG, N06AX).
Statistical analyses
Distributions of all variables were checked on normality with QQ plots. Non-normally distributed outcomes were transformed with Log-transformation (GMA) or with Box-Cox transformation (SD, SE, RA between daytime and night-time activity level and sleep midpoint). Correlation of symptom dimensions was explored using Pearson correlation coefficient to assess the degree of intercorrelation of symptom dimensions. The association of actigraphy estimates with symptom dimensions and individual symptoms was tested in separate models using Generalized Estimating Equations (GEE) corrected for covariates and with each actigraphy estimate as an outcome. GEE was used to account for correlations between repeated days per person. Separate models were run for each symptoms dimension and each individual symptoms; each model was adjusted for age, sex, and education level. As having a current/remitted diagnosis of depression and/or anxiety is highly correlated with the severity of symptoms, adjustment for diagnostic groups was not performed.
All analyses were performed with the statistical software R (version 1.0.143). A p value < 0.05 was considered statistically significant. Correction for multiple testing by using false discovery rate was applied when testing the association with symptom dimensions adjusting for the number of outcomes (n = 5) and symptom dimensions (n = 3). This was not done for individual symptoms, as our aim was to visually explore overall patterns to help understand whether symptoms follow the same patterns as the dimension they belong to or not. Specifically, we visually assessed the univariate associations of individual symptoms with actigraphy measures by using a forest plot presenting the standardised coefficients and the 95% confidence intervals. In this way, it was possible to visualise whether the associations with individual symptoms followed the same direction as the dimension they belong to and whether some symptoms were outliers.
Results
Demographics and descriptive
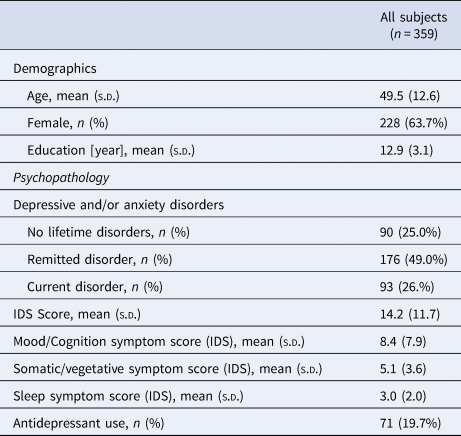
Table 1 shows demographics and descriptive in our sample. The average age of the sample was 49.5 ± 12.6 years, of whom 63.7% was female and with a duration of education of 12.9 ± 3.1 years. Most of the persons included had a lifetime diagnosis of depressive and/or anxiety disorders: 93 (26.0%) persons had current depressive and/or anxiety disorders, 176 (49.0%) persons had remitted depressive and/or anxiety disorders and only 90 (25.0%) persons had no depressive and/or anxiety disorders. The average severity of depressive symptoms in the sample was 14.2 ± 11.7 on the IDS total score.
Demographics and psychopathology in the NESDA sample
Symptoms dimensions were moderately to strongly correlated (correlation ranged from 0.41 for the somatic/vegetative and sleep dimensions, to 0.75 for mood/cognition and somatic/vegetative dimensions, not tabulated and available upon request).
Association of sleep, CR, and PA with dimensions
A 14-day lower GMA and RA between daytime and night-time activity level were significantly associated with all three symptom dimensions (Table 2, all p < 0.05). The associations with actigraphy-based sleep were more pronounced for two dimensions. Longer SD was significantly associated with higher somatic/vegetative symptom dimension score (Table 2; β = 0.113, p = 0.021) but not with mood/cognition and sleep symptom dimension scores. Lower SE was associated with higher sleep symptom dimension score (Table 2; β = −0.101, p = 0.011) but not with mood/cognition and somatic/vegetative symptom dimension scores.
Univariate associationa between symptom dimensions and sleep, circadian rhythm, and physical activity (n = 359)
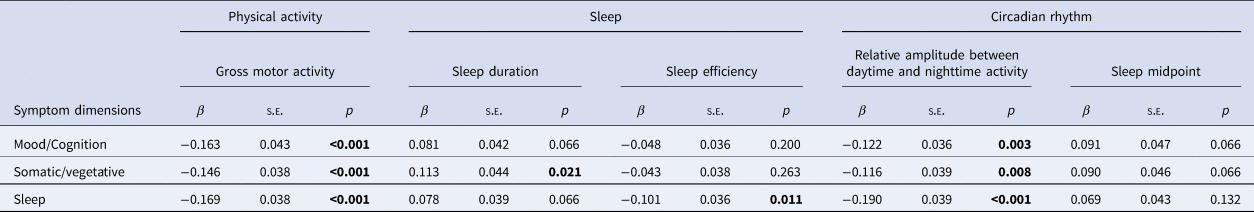
Correction for multiple testing by using false discovery rate (FDR).
Significance of bold values = p < 0.05.
a GEE model (outcomes = sleep, circadian rhythm, and physical activity) adjusted for age, sex, and education level.
Patterns of sleep, CR, and PA in individual symptoms
Figure 1 shows the association of individual symptoms with 14-day PA, sleep, and CR patterns. Associations of GMA and RA between daytime and night-time activity level showed more significant associations with individual symptoms compared to other actigraphy variables.
Univariate association between individual IDS symptoms and the actigraphy measures: physical activity (i.e. gross motor activity), sleep (i.e. sleep duration, sleep efficiency), and circadian rhythm (i.e. relative amplitude, sleep midpoint) in all sample (n = 359). Error bars represent 95% confidence intervals. Adjusted for age, sex, and education.
Note: ● = mood/cognition, ▴ = somatic/vegetative, ■ = sleep, І = no dimension; black = p < 0.05, grey = p ≥ 0.05.
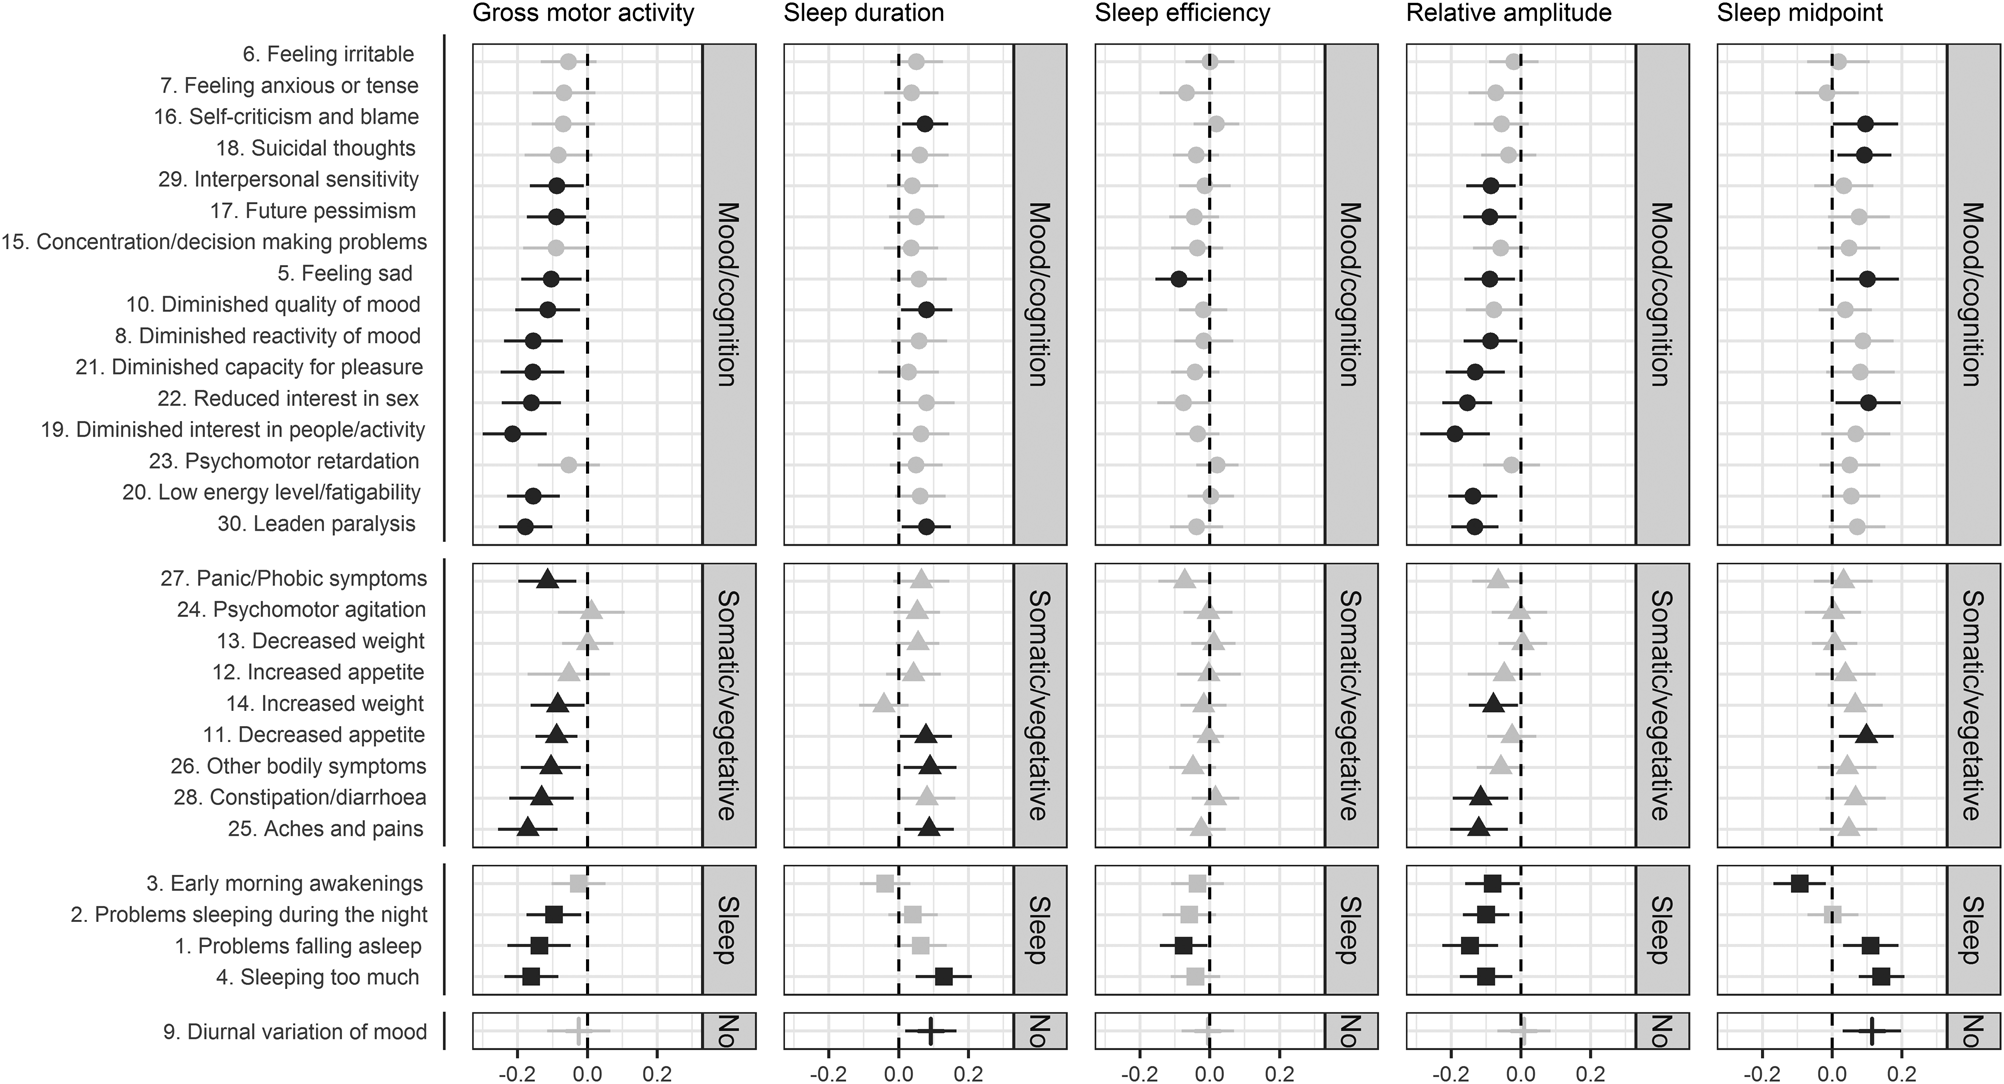
For GMA and RA 63% (n = 19) and 53% (n = 16) of all individual symptoms – spread across different dimensions – were significantly associated with lower GMA and lower RA between daytime and night-time activity level. Other symptoms – although not significantly associated – followed a similar, expected negative direction in their associations with GMA and RA. By inspecting the forest plots, no differential association of GMA and RA with symptom dimensions can be confirmed.
When considering actigraphy-based SD, in total, eight of the 30 individual symptoms were significantly associated with longer SD. Although most of somatic/vegetative symptoms followed the same direction in the association with SD, ‘increased weight’ deviated from the overall pattern. Also, as expected ‘early morning awakenings’ in the sleep dimension was associated with objective shorter SD.
Although not captured in the analyses using symptom dimensions, 30% (n = 9) of all symptoms were associated with later sleep midpoint. Of these seven symptoms, four belong to the mood/cognition dimension and three belong to the sleep dimension. Most individual symptoms were following the same positive direction in the association with sleep midpoint, with the exception of ‘early morning awakenings’ that showed an – expected – negative direction. This may possibly show that there is more heterogeneity in terms of effect estimates for individual symptoms.
Only two symptoms were associated with lower SE. As expected, all sleep symptoms were following the same negative direction in the association with SE as shown by the sleep dimension.
Discussion
This is the first study to examine 14-day actigraphy estimates of sleep, CR, and PA and their relationship with symptoms and symptom dimensions of depression. As all three symptom dimensions were associated with lower and dampened 14-day PA and circadian patterns, it could be concluded that physical inactivity and low circadian amplitude are general indicators of depressive symptom severity. However, sleep disturbances may be more specifically linked to somatic/vegetative and sleep symptom dimensions, as associations with longer SD and lower SE were more pronounced for these symptom dimensions. While exercise and behavioural activation may be used as adjunctive treatments in all patients with depression, sleep interventions may be especially effective in people with more self-reported somatic/vegetative and sleep symptoms.
While few studies have suggested that actigraphy may serve as an objective measure of psychomotor retardation in patients with depression (Krane-Gartiser, Henriksen, Vaaler, Fasmer, & Morken, Reference Krane-Gartiser, Henriksen, Vaaler, Fasmer and Morken2015), our results seem to support that physical inactivity is a general feature of depression (Burton et al., Reference Burton, McKinstry, Szentagotai Tǎtar, Serrano-Blanco, Pagliari and Wolters2013) and symptom severity (Minaeva et al., Reference Minaeva, Booij, Lamers, Antypa, Schoevers, Wichers and Riese2020). This was also reflected in our analyses with individual symptoms, as over 60% of depressive symptoms – across different symptom dimensions – were associated with low GMA with moderate effect sizes. The association between PA and depression has been studied before and appears to be bidirectional. Patients with depression are typically less active and they experience a range of barriers to engaging in PA such as depressive symptoms, higher body mass index, physical co-morbidity, and lower self-efficacy (Vancampfort et al., Reference Vancampfort, Stubbs, Sienaert, Wyckaert, De Hert, Rosenbaum and Probst2015). Low levels of PA increase the risk of depression (Mammen & Faulkner, Reference Mammen and Faulkner2013) and, PA and exercise (i.e. structured physical activity) can improve depressive symptoms (Schuch et al., Reference Schuch, Vancampfort, Richards, Rosenbaum, Ward and Stubbs2016). A large meta-analysis in the general population (Biswas et al., Reference Biswas, Oh, Faulkner, Bajaj, Silver, Mitchell and Alter2015) demonstrated that sedentary behaviour is associated with an increased risk of developing cardiovascular disease, type 2 diabetes, cardiovascular and all-cause mortality. As persons with depression are less active than the general population, they encounter additional risks in developing cardiovascular and chronic diseases and mortality. PA and behavioural activation, predominantly through exercise, may produce an antidepressant effect through multiple biological and psychosocial pathways (Kandola, Ashdown-Franks, Hendrikse, Sabiston, & Stubbs, Reference Kandola, Ashdown-Franks, Hendrikse, Sabiston and Stubbs2019). Neuroplasticity, neuroendocrine responses, inflammation, and oxidative stress have been suggested to play a role at a biological level. Several psychosocial factors accompany and potentially interact with, these biological changes to influence depression, such as self-esteem (Kandola et al., Reference Kandola, Ashdown-Franks, Hendrikse, Sabiston and Stubbs2019). While there is less research into the psychosocial benefits of exercise on depression, they are likely to be of parallel importance. As we observed lower PA across all symptom dimensions, PA and behavioural activation may be of help to all patients with depression as it may produce antidepressant effects through multiple biological and psychosocial pathways.
Similarly, dampened circadian amplitude was generally associated with all symptom dimensions, supporting previous findings on the association between dampened rhythms and mood disorders (Lyall et al., Reference Lyall, Wyse, Graham, Ferguson, Lyall, Cullen and Smith2018). As reviewed by Vadnie and McClung (Reference Vadnie and McClung2017), multiple mechanisms can explain the association between CR disruptions and mood disorders including depression. One of the main theories is that disrupted CRs in the master pacemaker, or suprachiasmatic nucleus may be the cause of mood disturbances. However, also other environmental factors, such as light, or genetic perturbations may influence mood independently from the central clock. Additionally, other studies have suggested that sleep and CR disturbances may be symptoms of mood disorders. As dampened circadian amplitude was associated with all symptom dimensions, CR interventions such as behavioural activation may be administered as adjunctive treatment to all patients with depression.
When studying sleep, it is important to make a clear distinction between subjective and objective sleep measures. The first provides information about a person's perception of his/her sleep quantity and quality. The latter refers to the objective measure of SD and SE with actigraphy. When assessing subjective sleep, persons diagnosed with depression often report sleep disturbances such as insomnia and hypersomnia (Nutt et al., Reference Nutt, Wilson and Paterson2008; van Mill et al., Reference van Mill, Hoogendijk, Vogelzangs, Van Dyck and Penninx2010). While in our previous work using actigraphy (Difrancesco et al., Reference Difrancesco, Lamers, Riese, Merikangas, Beekman, van Hemert and Penninx2019) we have shown that depressive symptom severity is associated with longer objective SD, in these follow-up analyses the association appeared to be more pronounced in patients with somatic/vegetative symptoms. We found a possible explanation for these findings. Persons with more somatic/vegetative symptoms experience more physical complains, such as aches and pains, bodily symptoms, than may directly impact on their ability to be physically active and resulting in more sleep disturbances. The sleep dimension itself may be problematic as it combines opposite clinical presentations (i.e. insomnia and hypersomnia) for which the associations with objective sleep is expected in opposite directions. However, as could be expected, lower SE assessed objectively with actigraphy was associated with sleep symptoms assessed with self-ratings. Although in our previous work we did not find an association between objective SE and subjective sleep assessed with the Women's Health Initiative Insomnia Rating Scale (Difrancesco et al., Reference Difrancesco, Lamers, Riese, Merikangas, Beekman, van Hemert and Penninx2019), objective measure of SE seems indicative of self-reported sleep disturbances assessed with the IDS. Sleep interventions may focus not only on patients reporting sleep problems but also on those reporting somatic/vegetative symptoms. Actigraphy may be used to assess the effectiveness of such interventions.
This study has several limitations. First, although we adjusted for multiple testing, we explored several associations when looking at individual symptoms and that may lead to chance findings. However, we aimed to look more at broader patterns than to focus on specific symptoms. Second, the assessment of depression symptoms and actigraphy were not done at the same time, although there was a median number of 23 days between the two assessments. Another limitation is that sleep and CRs are complicated concepts and actigraphy may provide only an indirect and rough estimate of them based on wrist movement, whereas polysomnography is the gold standard. In addition, sleep midpoint was evaluated during the entire period and it can be argued that chronotype is often assessed with sleep midpoint on free days corrected for the sleep debt accumulated during the working days. However, sleep midpoint measured with actigraphy provides a valid approximation of chronotype and it is moderately correlated with it as shown by Santisteban, Brown, and Gruber (Reference Santisteban, Brown and Gruber2018). Although not assessed in our study, shift work may affect sleep schedules and therefore it may influence the results on the association with sleep and CRs (James, Honn, Gaddameedhi, & Van Dongen, Reference James, Honn, Gaddameedhi and Van Dongen2017). While data did not show reversed activity/sleep patterns as would be expected with night shifts, early and late day shifts could have occurred and may also have an impact. Individual symptoms may fit in different symptoms dimensions and classifications are not always consistent across studies. We based our classification on those of Wardenaar et al. (Reference Wardenaar, Van Veen, Giltay, Den Hollander-Gijsman, Penninx and Zitman2010), in which classification, psychomotor retardation, and low energy level/fatigability, for instance, were part of the mood/cognition dimension, but they could also be fit in the somatic/vegetative dimension. However, by looking at individual symptom patterns we found consistency as most of symptoms follow the same direction in the associations as the dimension they belong to. Although we did not investigate the role of anxiety, as Wardenaar et al. (Reference Wardenaar, Van Veen, Giltay, Den Hollander-Gijsman, Penninx and Zitman2010) have shown that symptom dimensions were consistent across diagnostic groups (i.e. remitted depression, lifetime anxiety, healthy controls), comorbid anxiety does not seem to confound the studied associations. An important strength of the study is the attempt to investigate the heterogeneity of depressive symptoms with actigraphy in a relatively large sample. Another important strength is that on average 14 days of actigraphy data per participant were available.
To conclude, this is the first study to examine the different symptom dimensions of depression and their association with several objective indicators of PA, sleep, CR gathered with wrist-worn actigraphy devices. As lower PA level and dampened circadian amplitude were associated with higher scores on all three dimensions, lower PA level and dampened CRs appeared to be general indicators of depression and depression severity. Disturbances in objective sleep were more pronounced for somatic/vegetative symptoms, suggesting that longer SD may be more closely linked to this dimension. Sleep interventions may focus not only on patients reporting sleep problems but also on those reporting somatic/vegetative symptoms. PA, behavioural activation, and CR interventions may be not limited to groups of patients based on their symptoms but may be promoted in all patients with depression. However, clinical implementation awaits further evidence based on empirical data, if indeed, actigraphy may be used to monitor treatment response of such interventions.
Supplementary material
The supplementary material for this article can be found at https://doi.org/10.1017/S0033291720004870
Acknowledgments
The infrastructure for the NESDA study (www.nesda.nl) is funded through the Geestkracht program of the Netherlands Organisation for Health Research and Development (ZonMw, grant number 10-000-1002) and financial contributions by participating universities and mental health care organizations (VU University Medical Center, GGZ inGeest, Leiden University Medical Center, Leiden University, GGZ Rivierduinen, University Medical Center Groningen, University of Groningen, Lentis, GGZ Friesland, GGZ Drenthe, Rob Giel Onderzoekscentrum). The analytical work was financially supported by Innovative Medicines Initiative 2 Joint undertaking under grant agreement No 115902.
Conflict of interest
All authors declare that they have no conflicts of interest.
Data availability statement
According to European law (GDPR) data containing potentially identifying or sensitive patient information are restricted; our data involving clinical participants are not freely available in a public repository. However, data are available upon request via the NESDA Data Access Committee (nesda@ggzingeest.nl).


 Open access