


1. Introduction
In a global and rapidly changing competitive environment, the development of new products has become a key priority for many companies and R&D teams. To increase their level of competitiveness, many companies have tried to innovate existing products by introducing new features, components or modifying their architectural configuration to deliver novel or high-performing solutions.
However, technological innovation alone does not guarantee market success or profitability, especially in industries where established standards and dominant designs shape market dynamics. Existing studies show that when a market accepts a particular product’s design as the de facto standard that defines the specifications for all products within an industry, a dominant design is set (Reference Brem, Nylund and SchusterBrem et al., 2016). Iconic cases include the diamond-frame bicycle, the QWERTY keyboard, the modern smartphone’s touchscreen layout, and the commercial jetliner configuration with engines mounted beneath the wings. Once a dominant design is established, follow-up innovations are typically based on the accepted design, and the nature of competition within the industry shifts from product innovation to optimizing production process of the accepted design (Reference Murmann and FrenkenMurmann and Frenken, 2006). A dominant design acts as a foundational blueprint that integrates established design principles, component configurations, and consolidated functional relationships, streamlining both the design and manufacturing processes while ensuring reusability and compatibility across product variants and families (Reference UlrichUlrich, 1995). For these reasons, developing innovative products that break away from the dominant design is not only technologically challenging, but also commercially risky, since market resistance to novel designs can lead to reduced profitability and threaten the long-term survival of firms (Reference Suárez and UtterbackSuárez and Utterback, 1995).
In this scenario, the systematic analysis of dominant designs emerges as a focal point to guide design decision-making and product innovation in engineering design. First, by understanding the dominant design for a product, engineers can make better-informed decisions about whether and how to deviate from it. This also enables companies to understand which aspects of the design are important to compete on, reducing technological uncertainty and risk in R&D activities (Reference Brem, Nylund and SchusterBrem et al., 2016). Second, analyzing dominant designs allows engineers to recognize shared spatial configurations and functional structures across different products. This facilitates the transfer of design knowledge between products with similar architectures, improving the understanding of compatibility and technology cross-over (Reference DongDong, 2017). Third, by monitoring changes in design configurations relative to the reference dominant design, engineers can detect deviations or anomalies that may indicate early technological discontinuities, thus enabling firms to align their R&D activities with evolving technological trajectories.
To advance the analysis of dominant design, we propose a novel method for automatically extracting spatial configuration of products from patent images. We propose a computer-based system that identifies the positions of components within patent images and constructs a spatial configuration for a given object category (e.g., eyeglasses). Our hypothesis is that when many alternative designs of a product share a similar arrangement of components, this indicates the presence of a dominant design. To validate the hypothesis, we conducted a case study on the eyeglass domain. We extracted the shared spatial arrangement of eyeglass components and used it to analyse the dominant design and detect anomalies. Finally, we discussed how the results of this analysis can inform design decisions for developing new solutions.
2. Related work and literature gaps
In the field of engineering design, the theoretical concept of dominant design can be examined from both functional and structural perspectives. According to the structural perspective, dominant design emerges as the industry’s convergence toward a common arrangement of components within a product’s architecture, also referred to as product’s structure, spatial configuration or layout (Reference Murmann and FrenkenMurmann and Frenken, 2006). On the other hand, from a functional perspective, a dominant design emerges when the industry converges on a common set of core functions that a product performs, regardless of the physical configurations or embodiments through which those functions are realized (Reference Robinson, Taube-Adams, Kang and DongRobinson et al., 2023).
Existing studies on dominant design have focused on providing a formal definition of dominant design (Reference Murmann and FrenkenMurmann and Frenken, 2006), explaining how dominant design emerges (Reference Suárez and UtterbackSuárez and Utterback, 1995; Reference Robinson, Taube-Adams, Kang and DongRobinson et al., 2023), and investigating its implications on innovation performance and competition at the industry level (Reference Brem, Nylund and SchusterBrem et al., 2016). While this body of research provides an extensive theoretical foundation for understanding dominant design, it rarely addresses how engineers and designers can apply the concept of dominant design to inform real-world design decisions and guide the development of new products. Moreover, many studies on dominant design rely on qualitative case-based methods in which documents such as patents or technical specifications for a single type of product (e.g., cars, smartphones, aircraft) are manually analyzed to identify dominant designs over time. For example, Reference Díaz Lankenau and WinterDíaz Lankenau and Winter (2019) analyzed the emergence of the dominant design in farm tractors, providing both historical and physic motivations for the evolution of farm tractor’s industry. Similarly, Reference Robinson, Taube-Adams, Kang and DongRobinson et al. (2023) manually analyzed patent documents to identify the dominant designs and innovation trajectory of sewing machines. Reference Khan and CameronKhan and Cameron (2025) manually collected manufacturing data on 365 electric vehicle configurations with different characteristics such as battery capacity, drive type, and charging time, and compare them to identify dominant designs. Because all these approaches are applied manually and confined to specific types of products, it is hard to use their findings to inform design decisions beyond the studied case.
To overcome existing limitations, this study proposes a first attempt to bridge the gap between the theory of dominant design and its practical application in design practice. Specifically, we develop a computer-based system that automatically analyses dominant designs from patent images by analyzing the spatial positions of components. Furthermore, we show how the extracted dominant designs can be used in practice to identify anomalies and support design decision-making through a case study in the eyeglass’s domain. Notably, the proposed methodology is generalizable and provides designers with a practical tool that can be applied to other technological domains where patent images are available.
3. Methodology
In this paper we adopt a structural perspective, analyzing the position of components within patent drawings. This approach extends traditional analyses, often limited to the bill of materials, incorporating spatial relationships between components. In fact, significant innovations and alternative designs often originate from modifications to a product’s spatial configuration. The methodology consists in four main phases: (1) data collection, where patent drawings are collected; (2) image preprocessing, in which patent drawings are prepared for subsequent analysis. This includes rotating, cropping and resizing images to standardized dimensions; (3) product structure extraction, in which component positions are identified; and (4) dominant design analysis in which the component positions from the patent set are integrated to construct a common spatial configuration that represents the dominant design and to identify potential avenues for innovation.
3.1. Data collection
We collected patents from the eyeglass domain because eyeglasses represent a relatively simple mechanical system with a limited number of components, which facilitates the identification and analysis of dominant design. We used patent images because they are publicly available and easily retrievable through web-based search interfaces, which increases the reproducibility of the study. Moreover, patent data have been extensively used in prior research on dominant design, as they capture a wide variety of competing product designs and architectural alternatives. The patent data and corresponding drawings were retrieved from the PATSTAT database maintained by the European Patent Office. We collected patents classified under the International Patent Classification (IPC) category G02C1, corresponding to “Assemblies of lenses with bridges or browbars”, using the query IPC = “G02C1” AND PUL = “en”, where PUL = “en” restricts results to English-language patents. We collected 535 patents published between 1982 and 2025, of which 322 included drawings, resulting in a total of 2,980 patent drawings.
3.2. Image pre-processing
To extract information about the dominant design within the G02C1 domain, several preprocessing steps were performed to prepare the patent drawings for analysis. (i) select technical drawings: patents often contain both technical and non-technical drawings, such as plots, flowcharts, or chemical structures. Because this study focuses on the spatial configuration of components, non-technical drawings were excluded from further analysis. Two PhD students with expertise in engineering design manually selected technical drawings from the collected patent drawings and identified 2,404 technical drawings; (ii) segment single drawings: technical drawings often contain multiple sub-images depicting different views of the same object, typically labeled with different captions such as Fig. 1A, Fig. 1B, or Fig. 2. To isolate individual drawings for subsequent analysis, the two PhD students manually segmented these figures, extracting 3,500 single technical drawings of eyeglasses; (iii) select drawing perspective: single technical drawings can depict the same objects from different viewpoints, including front, side, top, or isometric view. Since the spatial configuration of components depends on the viewpoint, this study focuses exclusively on isometric perspective. Only technical drawings showing in an isometric view were included, as this perspective provides the most complete visualization of eyeglasses, allowing all components to be clearly seen. The final dataset includes 43 technical drawings of eyeglasses presented in isometric view; (iv) rotate drawings: technical drawings appeared in either horizontal or vertical orientations. To ensure consistency, vertically oriented images, where height exceeded width, were automatically rotated 90° clockwise to achieve a uniform horizontal format; (v) crop drawings: this step aimed to standardize the technical drawings by removing irrelevant background and isolating only the eyeglasses. Figure captions (e.g., Figure 1a, Figure 2) were first detected using an Optical Character Recognition (OCR) tool, a technique that automatically detects and converts text contained in images or scanned documents into machine-readable format. Specifically, we employed DocTR (https://github.com/mindee/doctr) to detect captions and mask them with white pixels to prevent interference during cropping. Then, the outermost non-white pixels were detected in all four directions (top, bottom, left, and right), and their coordinates were used to automatically define the cropping boundaries; and (vi) resize drawings: the final step standardized the dimensions of all images to ensure comparability across technical drawings originating from different patents. We computed the average width and height of the dataset and resized each image to these mean values, achieving uniform image dimensions.
Notably, steps i), ii) and iii) were performed manually for two main reasons. First, we aimed to evaluate the pipeline using a golden dataset, thereby avoiding error propagation from these pre-processing steps. Second, automated methods for these tasks are already well established in the patent analysis literature and fall outside the scope of this study. For reference, see Reference Jiang, Luo, Ruiz-Pava, Hu and MageeJiang et al. (2021) for patent drawing classification, Reference Joshua, Ragav and IbrahimJoshua et al. (2023) for sub-image segmentation, and Reference Awale, Müller-Budack and EwerthAwale et al. (2025) or Reference Ajayi, Wei, Gryder, Shields, Wu, Jones and OyenAjayi et al. (2023) for drawing perspective identification.
3.3. Product structure extraction
3.3.1. Identify component
The first step in extracting the dominant design representation from patent drawings is to identify the individual components within each image. Since products are composed of multiple subsystems organized hierarchically, it is essential to define the level of detail at which the artifact is analyzed. Without this delineation, any conceptualization of a dominant design becomes ambiguous and unreliable: at the most detailed level of analysis, no two artifacts are identical whereas at the coarsest level of analysis, every two artifacts are the same (Reference Murmann and FrenkenMurmann and Frenken, 2006). For this reason, this study focuses exclusively on five primary components that constitute the architecture of eyeglasses: the right lens (Lens dx), the left lens (Lens sx), the right temple (Temple dx), the left temple (Temple sx), and the nose bridge (Bridge). These components were not defined ex ante but emerged as the most frequently represented components in the dataset, as detailed in Section 3.2.2.
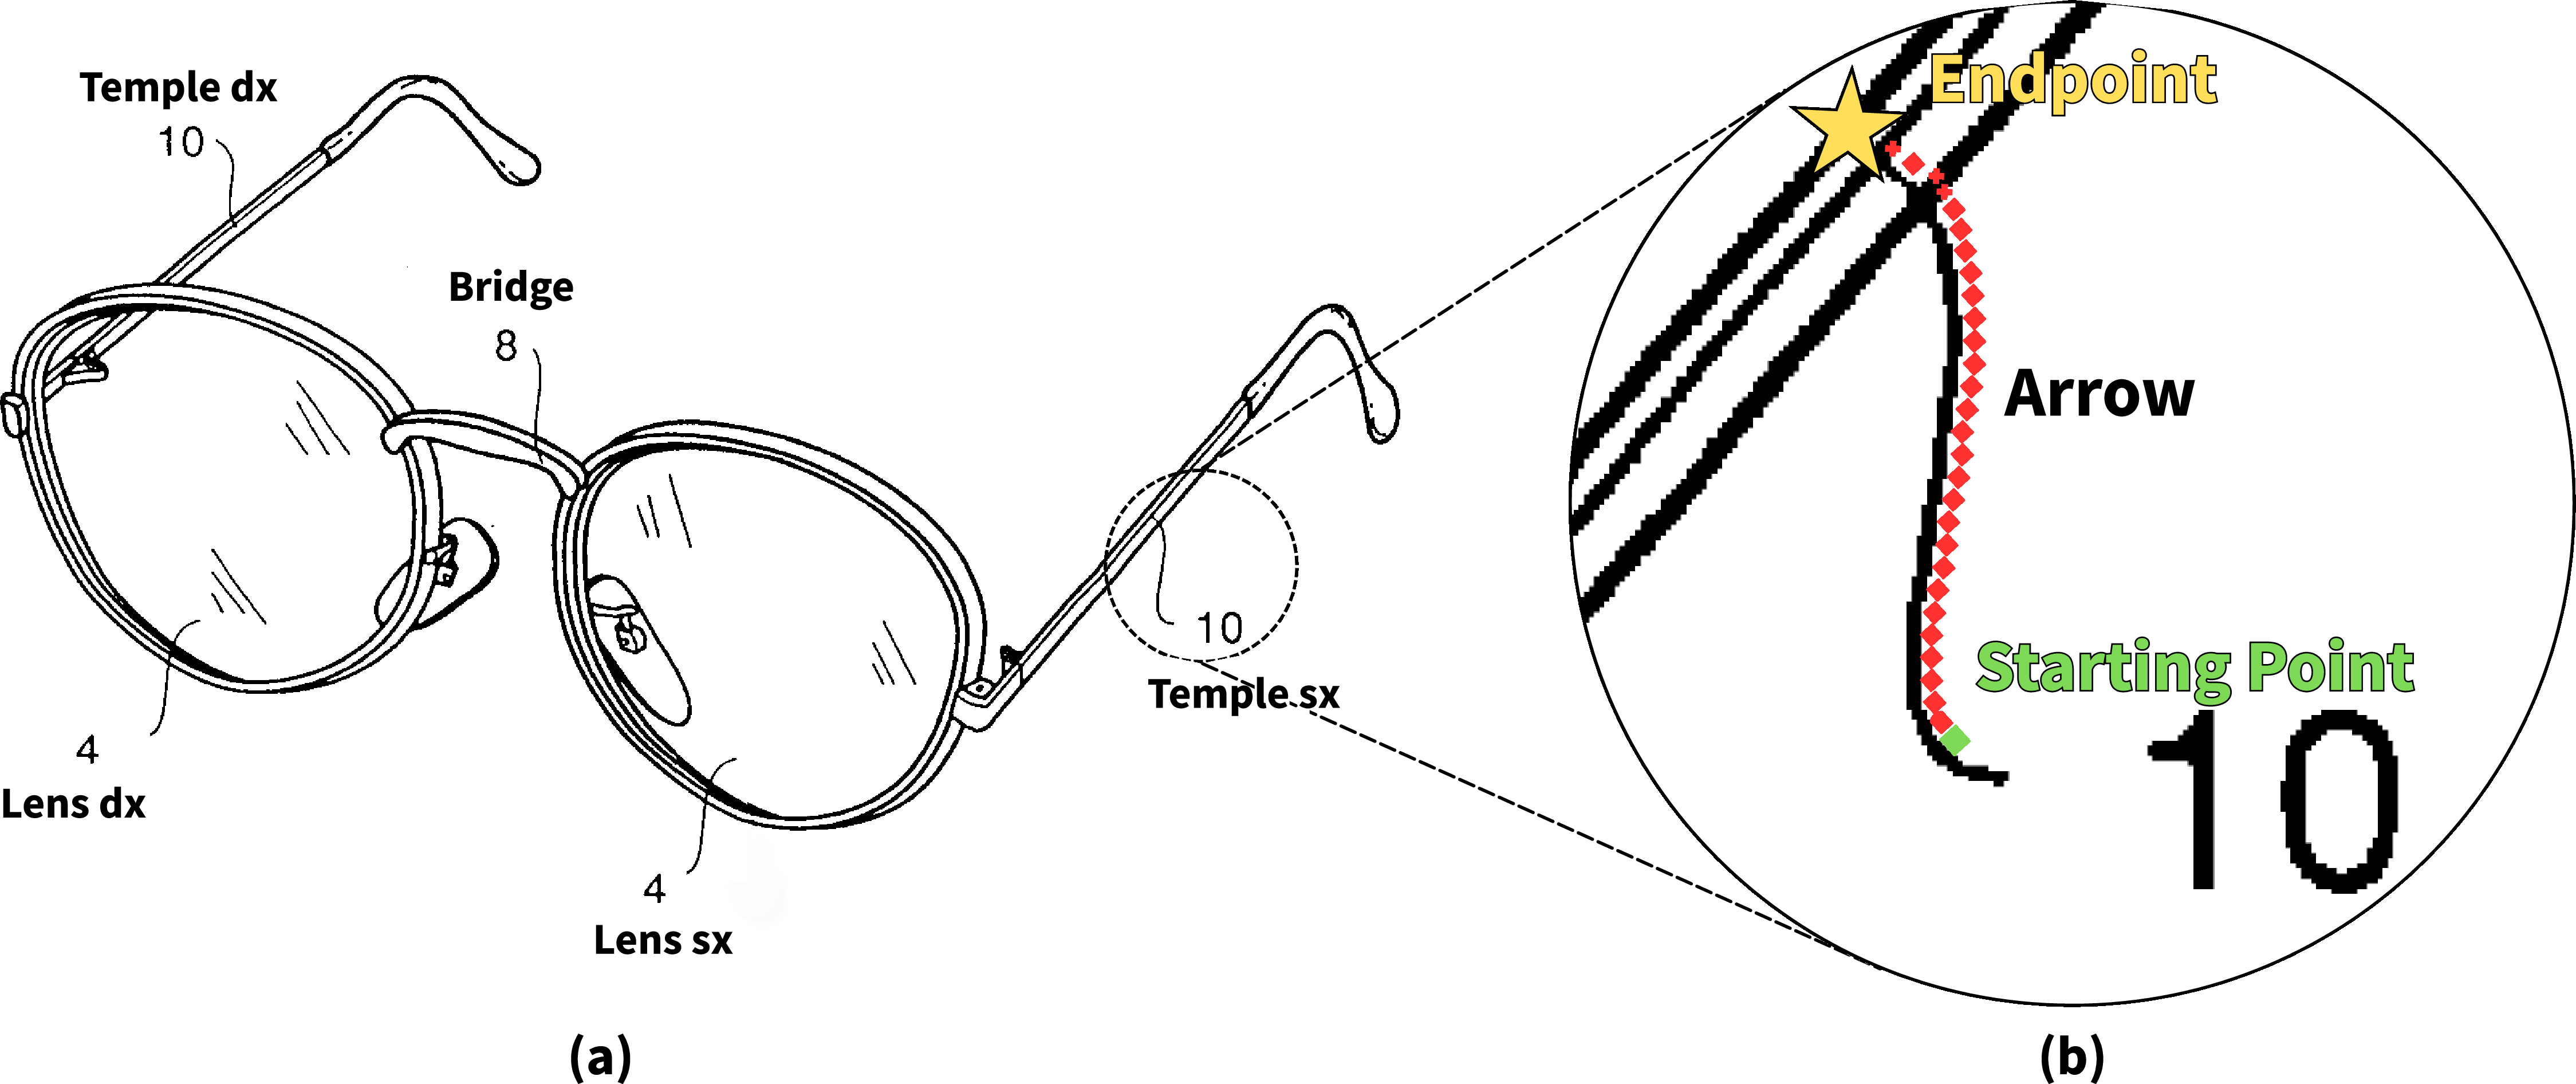
To identify components, we used component numbers of technical drawings which are numerical identifiers assigned to specific parts of an invention. These identifiers are referenced in the accompanying patent text to uniquely denote individual components, as illustrated in Figure 1a. We identified component numbers using DocTR. In our case, DocTR outputs both the coordinates of each component number within the drawings and its recognized numerical label. The coordinates are then used to identify the exact positions of the components, while the numerical labels are used to match each component number with its corresponding name in the patent text.
3.3.2. Cluster components
The second step involved using component numbers to match component names in patent text. This approach is well established in patent analysis. For instance, Erre Quadro (https://www.errequadro.ai/) developed a commercial tool based on the patent “US2020311406A1 – Method for Analysing Digital Documents,” which automatically detects component numbers and associates them with their corresponding names in the patent text. Similarly, Google Patents has implemented a comparable system within its web interface. In this study, we build on the same idea to automatically identify component names from patent text. For each component number, we extracted the words or short phrases, monograms (one word), bigrams (two words), and trigrams (three words), that appeared immediately before it. The most frequently occurring n-gram was then selected as the representative name for that component. Because the same components can be referred to using different terms across patents such as “right glass,” “right lens,” or “optical element”, it was necessary to account for such synonymy to ensure consistent identification and grouping of equivalent components. For this reason, we developed a text-based clustering pipeline to automatically group component names into clusters. Specifically, we collected all the sentences in which each component name appeared. We transformed each component name into a numerical vector representation, known as an embedding using bert-for-patents (https://huggingface.co/anferico/bert-for-patents), a Large Language Model (LLM) trained specifically on patent documents. The model generated term-level embeddings for each component name within its sentence context, capturing rich semantic information. All embeddings corresponding to the same component name were then summed to produce a single aggregated representation for that component. Next, we applied a clustering algorithm to organize the component embeddings into clusters of semantically similar components. The resulting clusters were manually reviewed by two PhD students to identify and eliminate errors and inaccuracies, which primarily stemmed from the n-gram tokenization process. After this process, we retained the clusters with more than ten elements to ensure statistical robustness, corresponding to Lens dx, Lens sx, Temple dx, Temple sx, and Bridge, containing 17, 17, 12, 16, and 14 components, respectively. Given that 43 images were included in the analysis, the retained component clusters are present in approximately 30–50% of the images. The proposed clustering strategy has the advantage of being computer-based; however, it is not the only possible method for grouping component names. Alternative approaches, such as using established taxonomies or manually constructed lookup dictionaries, can also be applied.
3.3.3. Identify component position
The third step involved extracting the exact position of components within technical drawings. As illustrated in Figure 1b. Technical drawings in utility patents typically include arrows that link component numbers to the corresponding parts of the drawing. These arrows serve as visual cues that indicate which parts of the drawing correspond to the components described in the patent text. By detecting the endpoints of the arrows, we can identify the positions of the individual components within the technical drawings. Based on the idea proposed by Reference Chen, Li, Jin, Bao, Su and YuChen et al., 2015, we developed and tested the Follow-The-Arrow (FTA) algorithm, a method designed to automatically trace arrows and identify component positions in patent drawings (see figure 1b). The algorithm proceeds in three steps. (i) identify the starting points: the algorithm begins with the coordinates of the component numbers obtained using DocTR and it detects the starting point of arrows incrementally traces concentric circles, searching for non-white pixels, see green point in Figure 1b. For expert readers, this corresponds to detecting pixels with a non-zero gradient; (ii) follow the arrow: from each identified starting point, the algorithm traces the arrow step by step by following the connected black pixels forming its body, see red points in Figure 1b. In cases where no arrows are present, i.e., when the component number is placed directly on the component without an arrow, the model returns the detected starting point as the component position. (iii) identify the endpoints: the algorithm identifies arrow endpoints based on the empirical observation that these regions typically exhibit low local variance in pixel intensity. In technical drawings, such regions are usually uniformly white, as arrow tips commonly terminate on solid (white) areas representing component bodies (indicated by a star in Figure 1b). The identified endpoints consist of
 coordinates measured in pixels and are used as component positions to construct the dominant design representation. To test the performance of the FTA algorithm, two PhD students with expertise in the field of engineering design manually annotated 1,643 endpoints within patent images. Next, we compared the FTA-predicted endpoints with the manually annotated endpoints (ground-truth). We used a distance-based metric, as defined by Reference Pascual-Marqui, Lehmann, Kochi, Kinoshita and YamadaPascual-Marqui et al. (2013). The metric is defined as e
−λd
, where
coordinates measured in pixels and are used as component positions to construct the dominant design representation. To test the performance of the FTA algorithm, two PhD students with expertise in the field of engineering design manually annotated 1,643 endpoints within patent images. Next, we compared the FTA-predicted endpoints with the manually annotated endpoints (ground-truth). We used a distance-based metric, as defined by Reference Pascual-Marqui, Lehmann, Kochi, Kinoshita and YamadaPascual-Marqui et al. (2013). The metric is defined as e
−λd
, where
 is the Euclidean distance (in pixel) between an FTA-predicted and its corresponding ground-truth endpoint, and λ is a decay parameter controlling sensitivity to distance. The decay parameter λ was empirically set to 0.002. The metrics equals 1 when the two endpoints coincide (d
 0) and decays exponentially toward 0 as their distance increases. The global accuracy was computed by averaging the metric values across all the endpoints in the test dataset. We achieved an overall accuracy of 0.78 ± 0.21, demonstrating the effectiveness of the FTA algorithm in extracting component positions.
a) Identify component names using component numbers and b) identify component positions using the Follow-The-Arrow (FTA) algorithm

3.4. Dominant design analysis
The final step of the methodology involved combining the five component clusters with the spatial positions of their corresponding components to construct a unified representation. Specifically, each component is characterized by its
 coordinates and the cluster to which it belongs. We then plotted all components in a shared
 space, representing each as a point and colouring it according to its cluster (i.e. scatterplot). Our hypothesis is that components of the same cluster, such as all right lenses or all nose bridge, will naturally concentrate in specific regions of this shared space because they tend to occupy consistent relative positions across different eyeglass designs. This procedure allows us to convert a heterogeneous set of patent technical drawings into a unified, data-driven representation of the eyeglass’s architecture. Instead of defining the dominant design subjectively or from a single example, this approach allows the dominant design of eyeglasses to emerge from the data itself, providing empirical evidence of both standard and novel spatial configurations.
4. Results
4.1. Dominant design analysis
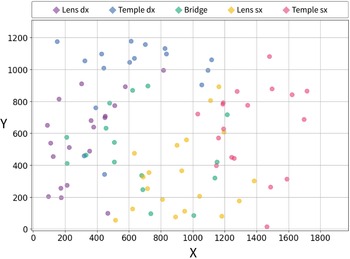
Figure 2 illustrates the dominant design representation of the main components, as detailed in Section 3.3.4. Each point in the plot corresponds to a distinct component. The position of each point corresponds to its
 and
and
 pixel coordinates, obtained using the FTA algorithm. The color indicates the cluster to which the component belongs. The underlaying hypothesis is that when many eyeglass designs share a similar arrangement of components, this similarity indicates a dominant design. Figure 2 clearly shows that the main components are clustered within specific regions of the patent images, providing visual evidence that supports our hypothesis. For example, components which belong to the Temple sx cluster (in pink) are located overall on the top-right corner, while those of the Temple dx (in blue) are positioned in the upper-left corner. Moreover, points representing the Bridge cluster (in green) are positioned on the lower part of the image in the middle between the Lens dx (in violet) and the Lens sx (in yellow).
Dominant design of eyeglasses: spatial configuration of components

To quantitatively evaluate the dominant design representation, we analyzed the distribution of
 and
and
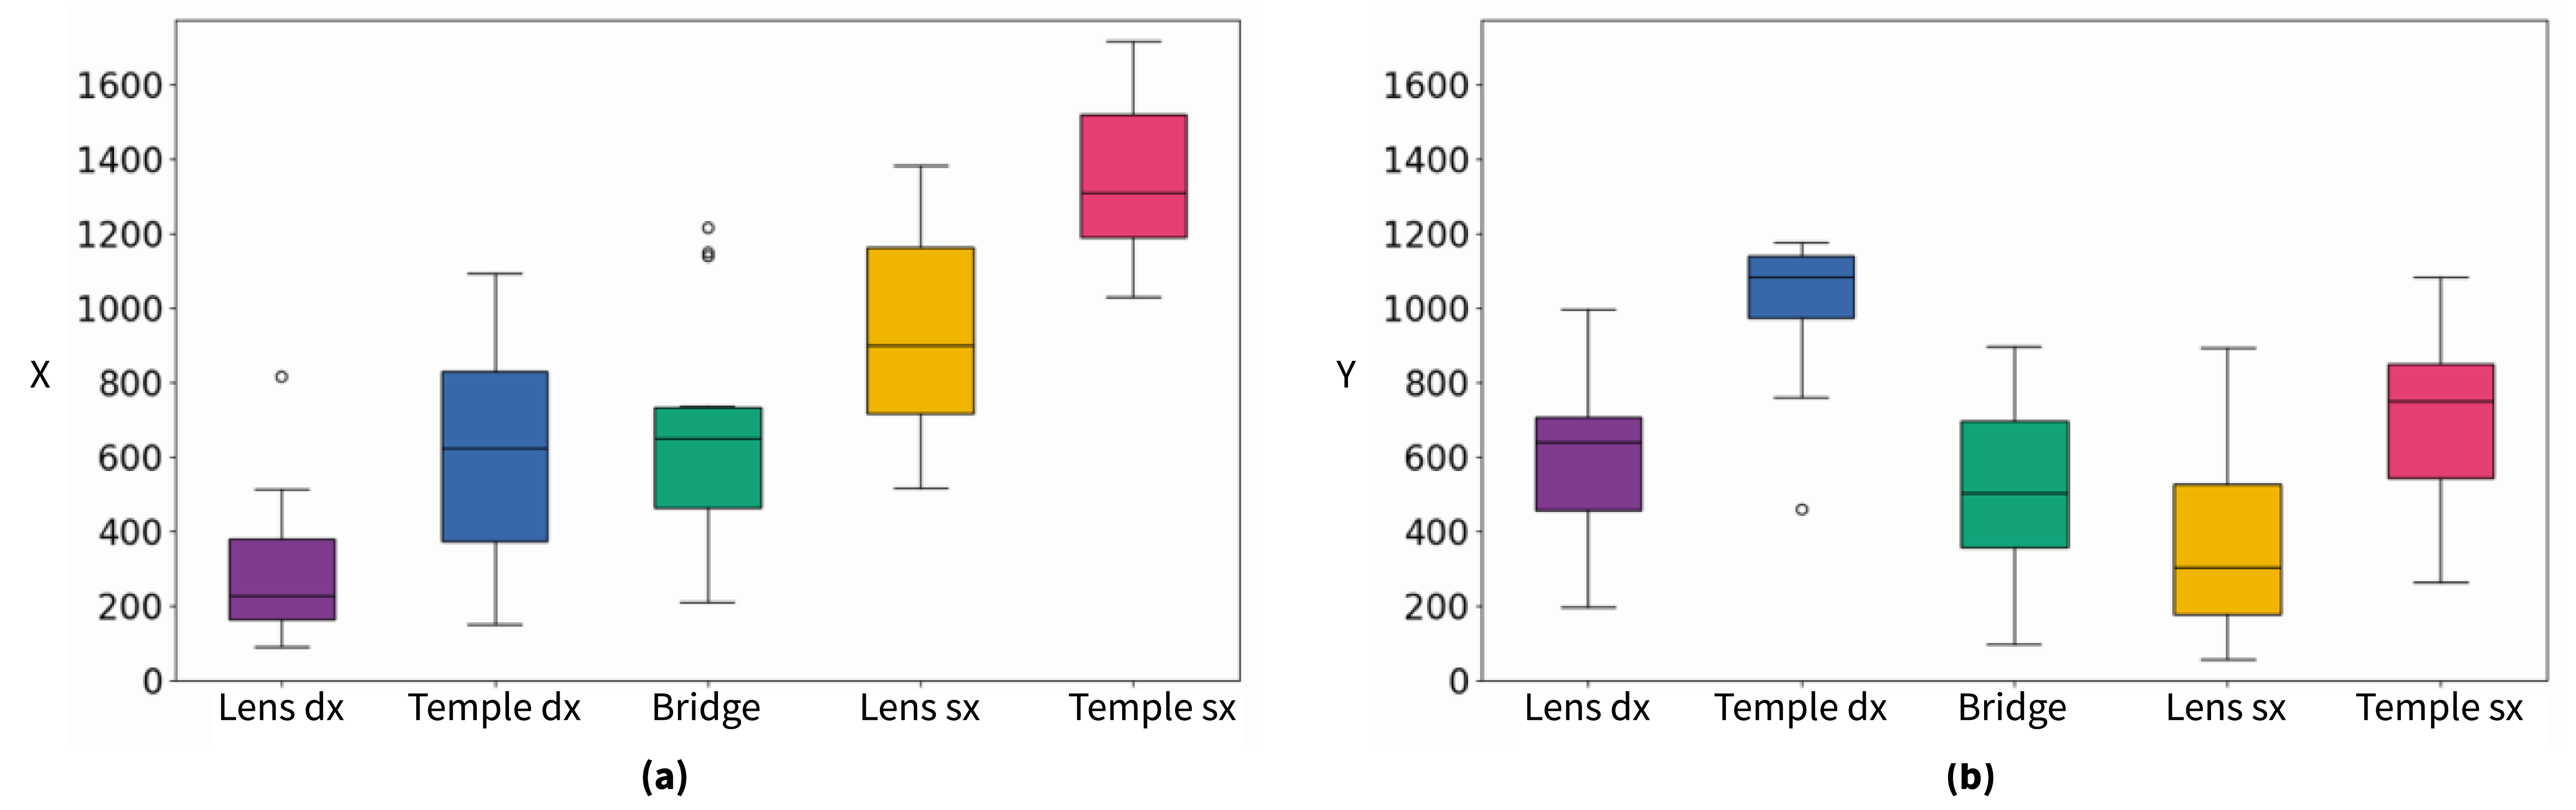
 coordinates (measured in pixels) for each component cluster. Figure 3 illustrates these distributions, with panel (a) showing the
 coordinates and panel (b) showing the
 coordinates. Each boxplot represents the interquartile range (IQR), which contains the central 50% of the data from the first quartile (Q1) to the third quartile (Q3). The line inside the box indicates the median (Q2). The whiskers extend to the smallest and largest values within 1.5×IQR from the quartiles, while any points beyond this range are shown as outliers. Figure 3 shows that the
 and
and
 distributions have different median values and IQRs and that their combination can be used to distinguish the position of each component cluster. For example, the
 distributions for the Temple dx and Bridge clusters overlap, as expected from the isometric view of the eyeglasses, whereas their
 distributions exhibit distinctly different shapes.
To assess whether the
 and
and
 coordinate distributions differ significantly across the component clusters, and to ensure that these differences are not influenced by the specific points selected, we performed three statistical tests.
First, we applied the Shapiro–Wilk test to determine whether the
 and
and
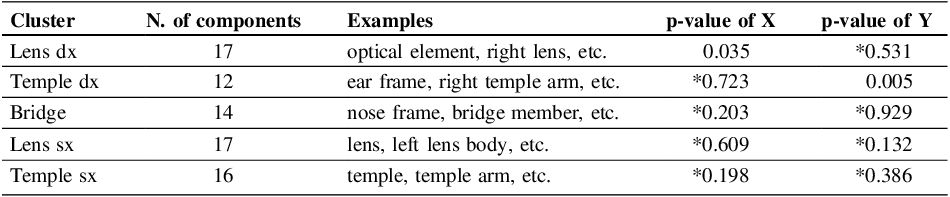
 distributions follow a normal distribution. Table 1 reports for each cluster, the number of components and the corresponding p-values for the
 and
and
 coordinates. The null hypothesis H0 states that data are normally distributed. Therefore, a p-value greater than 0.05 (at a 95% confidence level) indicates that we fail to reject H0, suggesting that
Boxplots of component positions: (a) X-coordinates and (b) Y-coordinates

data can be considered normally distributed (i.e., points do not significantly deviate from normality). In Table 1, p-values above 0.05 are marked with an asterisk (*). The results show that all
 and
and
 distributions can be considered normal, except for the
 distribution of the Lens dx and the
 distribution of the Temple dx clusters. This deviation is likely due to the small number of points (around 12–17) in the distributions, which makes the results more sensitive to outliers. Moreover, at least one of the
 or
or
 distributions is normally distributed for each cluster. Therefore, in the remainder of this paper, we assume that the component positions shown in Figure 3 follow a normal distribution.
Normality test: Shapiro-Wilk test

Second, we performed a Levene’s test to assess whether the
 and
and
 distributions have equal variances. All comparisons yielded p-values above 0.05, indicating no statistically significant difference in variance. This empirical evidence is also consistent with the boxplots shown in Figure 3.
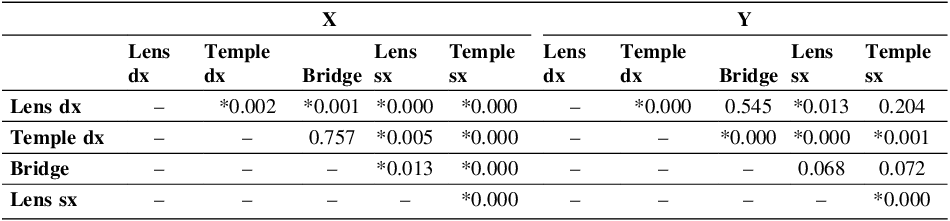
Third, given that the X and Y distributions are independent, meet the assumption of normality, and have equal variances, we used a parametric pairwise Student’s t-test to determine whether they differ significantly. Specifically, we compare every possible pair of clusters (e.g., Lens dx vs Temple dx, Lens dx vs Bridge, etc.) in their
 and
and
 coordinates. Table 2 reports the corresponding p-values for each pair. Only the upper diagonal of the comparison matrix is shown, as the comparisons are symmetric. A p-value below 0.05 indicates a statistically significant difference between the two distributions and is marked with an asterisk (*). To confirm the robustness of our findings, we repeated the analysis using the non-parametric Mann–Whitney test, which does not assume normality. The results were consistent with those obtained from the Student’s t-test.
Table 2 shows that most comparisons between the
 and
and
 distributions exhibit significant differences, with at least one of the two distributions being significant in each case. For example, the
 distributions of the Lens dx and Temple sx components are not significantly different, as their positions usually share similar
 coordinates in the perspective view (see Figure 1). However, their
 distributions differ significantly, indicating that the two components occupy distinct
 coordinates in patent drawings.
Pairwise p-values from student’s t-tests

These findings show that our approach not only captures the position of components but also effectively distinguishes different components based on their
 position. This represents a theoretical contribution of our method, demonstrating through a data-driven approach that specific spatial configurations consistently emerge within the architecture of eyeglasses. While the notion of dominant design has long been discussed theoretically and previously identified through manual image analysis, our approach offers a measurable 2D representation of dominant design and, to the best of our knowledge, constitutes the first empirical validation of dominant design using real-world data.
4.2. Outlier analysis
The dominant design representation obtained so far offers a representation of how eyeglass components are typically arranged in a 2D space. This representation can be used to automatically detect anomalies in the eyeglass’s spatial configuration. When the position of a component deviates from the
 or
or
 coordinates distributions, it is identified as an outlier. These outlier components are placed in an unusual position and are flagged as anomalies that require further analysis.
To conduct this analysis, we examine the outliers in the
 and
and
 coordinate distributions. As shown in Figure 3, outliers are defined as points lying beyond 1.5×IQR from the quartiles. A total of six outlier points out of 72 points were identified. We manually inspected the images containing these points to assess any unusual positioning of components. Our inspection revealed that these outliers do not represent design anomalies but were caused by three sources of error: 1) arrows often point to components from the side rather than the centre (see Figure 1), using their endpoints as
 coordinates may introduce positional inaccuracies; 2) limitations of the FTA algorithm in tracing arrows with sharp or irregular edges, which led to incorrect component localization; and 3) issues in the image-cropping step, which retained white margins and distorted the image scaling.
The outlier analysis revealed no design-meaningful anomalies in component positions across the analyzed patent images. This outcome can be explained by two main factors. First, all analyzed patents belong to the same IPC class, “Assemblies of lenses with bridges or browbars,” which covers only conventional eyeglass designs and excludes more diverse types such as military glasses and special-purpose eyewear. Consequently, positional anomalies of main components are unlikely to occur within such a homogeneous set of patent images. Second, eyeglasses inherently conform to a standardized interface with the human nose and ears, making positional variations in main components such as the temples, lenses, and bridge unlikely to occur within standard designs. Overall, the outlier analysis confirms the stability of the dominant design spatial configuration and indicates that its full potential will emerge when applied to more architecturally diverse patent sets beyond a single IPC class, as discussed in Section 4.3.
4.3. Visual comparative analysis
The dominant design representation obtained so far remains a valuable tool for higher-level comparative analyses outside the G02C1 IPC class. In fact, by overlaying the design representation onto a new image we can visually compare the spatial configuration of the components in the input image with the spatial arrangement defined by the dominant design. This visual comparison facilitates the identification of both analogies and anomalies, flagging potential innovative design solutions.
To conduct this analysis, we first use the actual distributions of the
 and
and
 coordinates to generate synthetic data points for each cluster. As the
 and
and
 coordinate distributions were verified to be normal (Table 1), we used their respective means and standard deviations to generate 100 normally distributed synthetic points per cluster. To reduce the influence of outliers, only points within the interquartile range (IQR) were considered during generation. This synthetic generation process allows us to reinforce the statistical validity of the dominant design representation by simulating a larger sample of data points based on the observed empirical distributions. Once the dominant design representation is established, it can be projected onto a new input image, as illustrated in Figure 4.
Dominant design overlay revealing (a) anomalous components and (b) a new product architecture

Figure 4 Long description
Panel A: A scatter plot representing component positions within technical drawings. The horizontal axis is labeled X and the vertical axis is labeled Y. The plot contains several clusters of data points in different colors, indicating different components. Arrows are labeled with numbers and point to specific clusters. Panel B: Another scatter plot with similar axes and labels. This plot also shows clusters of data points in different colors, with arrows labeled with numbers pointing to specific clusters. The arrows and clusters indicate the positions of components within the technical drawings.
Figure 4a shows the overlay of our dominant design representation on an image from the patent US4810080A. While the clusters of points largely align with the positions of the main eyeglass components, component number 18, corresponding to the head strap, lies distinctly outside the dominant design configuration. This indicates the presence of a new (unexpected) component that introduces a new functional requirement—improving the retention and stability of the eyeglasses during dynamic activities—that may not be explicitly mentioned in the patent text. Moreover, the visual comparison makes explicit how the introduction of these components alters the structural configuration of the dominant design, information that is difficult to accurately reconstruct from textual descriptions alone which is often affected by linguistic ambiguity and terminological inconsistency. Similarly, Figure 4b shows a perspective view of eyeglasses in a foldable configuration from patent EP3090303B1. In this case, the overlap with the dominant design configuration is inconsistent across all components. This suggests the introduction of a fundamentally new product architecture with novel functional requirements―improved portability through reduced storage volume, and controlled rotation for folding. A traditional bill of materials, which only lists component names, cannot reveal architectural differences when the same components are used. In contrast, our analysis makes explicit how components are spatially arranged showing how designers can adapt existing components and their design parameters to realize a specific configuration. Notably, our approach is not limited to patent drawings. Once the dominant design representation is obtained, it can also be applied to non-technical images, such as photographs (provided that all image preprocessing steps described in Section 3.2 have been properly applied to the input image).
5. Conclusions and future developments
We presented proof-of-concept application to bridge the gap between dominant design theory and design practice by extracting a measurable 2D representation of standard eyeglass architecture using a data-driven, computer-based approach. Our work is subject to several limitations that currently restrict the depth of insights achievable within the eyeglass domain and its extension to more complex products; nevertheless, it uncovers important future research directions and general challenges for the quantitative analysis of technical drawings. First, the dominant design representation is constructed solely from component positions. Therefore, it cannot distinguish between designs in which components occupy similar locations but differ substantially in geometry or shape. For example, two eyeglasses might have the bridge positioned at the same
 coordinates, yet one design incorporates a solid bridge integrated into the lens assembly, whereas another employs two separate bars with visible foam supports. Using object detection and segmentation models (e.g., Meta’s Segment Anything Model (SAM)) to extract component geometries could capture both positional and morphological differences, supporting design decisions related to component shape and degree of integration. Second, the analysis considers only five primary components, resulting in a coarse-grained characterization of eyeglass architecture. Future work should extend the approach to include secondary and small components; however, this will require more precise localization methods to reliably capture their positions, a challenge that, to the best of our knowledge, has not yet been fully addressed for technical drawings which typically lack colour and contain intricate line work. Third, the study is limited to a single perspective view of eyeglasses. Future work must address how to compare drawings shown from different viewpoints by defining a shared spatial reference and normalizations steps. Beyond its methodological contributions, our approach demonstrates that dominant design is not merely a theoretical construct but can support data-driven decision-making by identifying unexpected components, non-standard spatial configurations, and their underlying functional requirements. While our approach remains a proof-of-concept application intended to demonstrate methodological feasibility, we believe that the rapid advancement of AI, particularly Vision-Language (VL) models such as ChatGPT-5, SORA, and DALL-E opens promising avenues for extending our current work. In fact, VL models can now generate images from textual descriptions, colorize technical drawings, identify components, and answer text-based questions about image content. These capabilities support component-level analysis of technical drawings and enable the extension of our approach to more complex product systems, with potential applications in modularity analysis, interface discovery, product family analysis, and competitor benchmarking.
Acknowledgements
This research was partially funded by Erre Quadro srl (https://www.errequadro.ai/), a company based in Pisa, Italy, specializing in Intellectual Property (IP) intelligence to support companies and innovators.


 Open access

