


1. Introduction
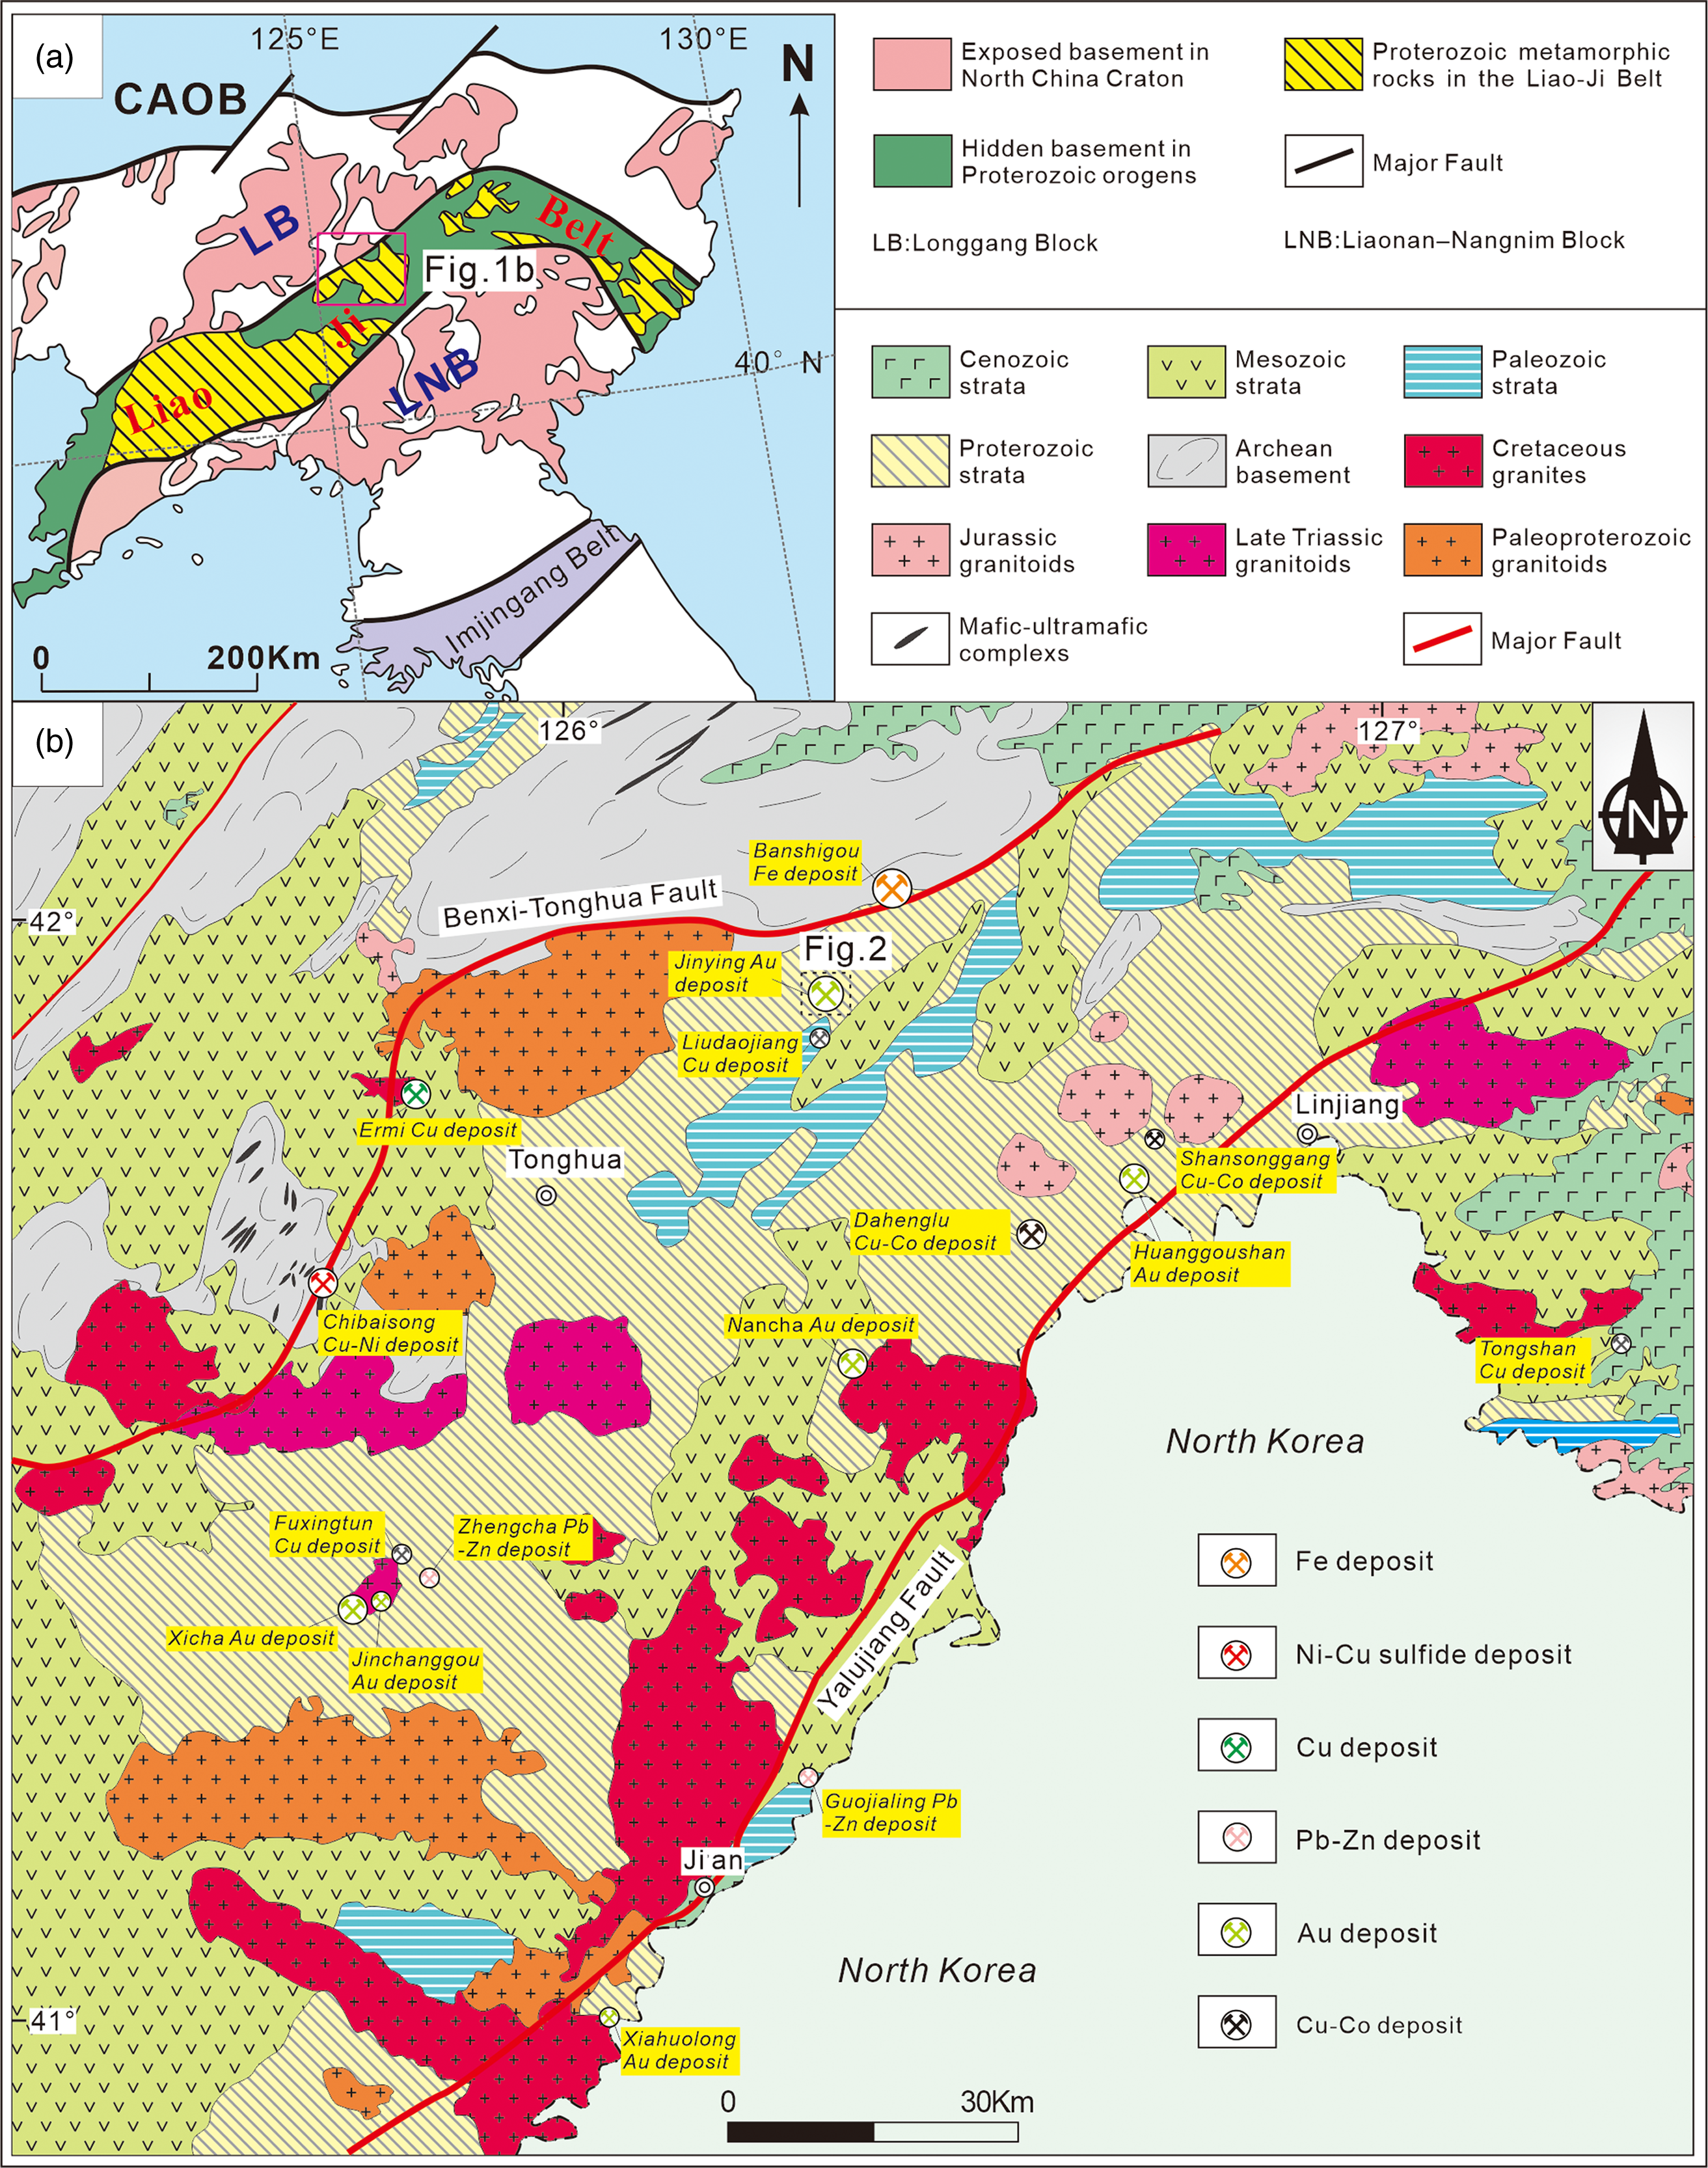
Southern Jilin Province, located in the northeastern margin of the North China Craton (NCC, Fig. 1a), is an important polymetallic metallogenic district that hosts numerous Ni, Fe, Cu and Au deposits (Fig. 1b), and over 20 large-, medium- and small-scale Au deposits have been found in this area. For example, the world-famous Jiapigou gold district contains proven gold reserves of 180 tons or more (Sun et al. Reference Sun, Zhang, Han, Men, Li, Chai and Yang2013; Deng et al. Reference Deng, Yuan, Carranza, Yang, Wang, Yang and Hao2014; Zhang et al. Reference Zhang, Sun, Han and Feng2021; Chen et al. Reference Chen, Li, Zheng, Elatikpo, Cheng and Jiang2022). With advanced exploration, several gold deposits have been discovered in southern Jilin Province, including the Songjianghe (Zhang et al. Reference Zhang, Sun, Yu and Song2019), Toudaoliuhe (Han et al. Reference Han, Sun, Liu, Zhang, He, Yang, Chu, Wang, Wang, Zhang and Zhao2020), Laosandui and Jinying (known as Banmiaozi) gold deposits. Thus, this area shows great potential for ore prospecting and has been recognized as an important gold province in China.
(a) Tectonic map of the Proterozoic Liao-Ji belt, northeastern margin of the North China Craton (Zhao et al. Reference Zhao, Sun, Wilde and Li2005); (b) geological map of southern Jilin Province showing the locations of major deposits (Chu et al. Reference Chu, Sun, Zhang, Liu, Xu, Han, Zhao, Liu and Qin2021).

Jinying is a large-scale gold deposit and currently contains 34 t of gold (Chen, Reference Chen2019). Previous researches have been focused on the geology (Liu et al. Reference Liu, Man and Wang2009; Su & Zang Reference Su and Zang2010; Xing et al. Reference Xing, Zhu, Yang, Li, Feng and Liu2012; Li et al. Reference Li, Zang, Tao, Ma and Ma2015), whole-rock geochemistry (Zhang, Reference Zhang2015; Chen, Reference Chen2019), ore-forming fluid (Zhang, Reference Zhang2015; Men et al. Reference Men, Sun, Xu, Chai and Wang2016; Chen, Reference Chen2019) and geochronology (Zhang, Reference Zhang2015; Chen, Reference Chen2019). However, the ore genesis and mineralization time at Jinying deposit remain controversial. For example, Zhang (Reference Zhang2015) argued that Au mineralization occurred at 170 Ma based on the zircon U–Pb age of granodiorite porphyry, as well as the zircon U–Pb age of 131 Ma for dioritic porphyrite (Chen, Reference Chen2019). The deposit formed during the subduction of the Palaeo-Pacific Plate (Zhang, Reference Zhang2015) or in the following extensional setting (Chen, Reference Chen2019). In addition, the ore-forming fluids originated from a mixture of magmatic water and meteoric water (Men et al. Reference Men, Sun, Xu, Chai and Wang2016) or magmatic water with meteoric water and formation water (Chen, Reference Chen2019).
In view of the above scientific problems, this work carried out sulphide Rb–Sr and LA–ICP–MS zircon U–Pb geochronological analyses and He–Ar–S isotopic analyses of the Jinying gold deposit. We aim to determine the timing of gold mineralization, tectonic setting and sources of ore-forming materials and fluids, which have important implications for the genesis of the Jinying gold deposit.
2. Geological setting
The study area is situated between the Liaonan-Nangrim Block and Longgang Block separated by the Palaeoproterozoic Liao-Ji belt (Zhao et al. Reference Zhao, Sun, Wilde and Li2005; Pei et al. Reference Pei, Xu, Yang, Yu, Meng and Zhao2011, Fig. 1a). The study area underwent multistage cratonization, Palaeoproterozoic rift-subduction-collisional events and late Palaeoproterozoic-Neoproterozoic multistage rifting events that record complicated geotectonic processes in the Precambrian (Zhai, Reference Zhai2013) and final closure of the Palaeo-Asian Ocean in the late Palaeozoic-early Mesozoic as well as overprinted and modified by Palaeo-Pacific Plate tectonic regimes during the Mesozoic–Cenozoic (Sengör et al. Reference Sengör, Natal’in and Burtman1993; Sengör & Natal’in, Reference Sengör, Natal’in, Yin and Harrison1996; Wu et al. Reference Wu, Sun, Ge, Zhang, Grant, Wilde and Jahn2011).
The exposed oldest strata in the study area are Archaean TTG rocks, and supracrustal rocks consist of amphibolite, plagiogneiss, granulite and magnetite-quartzite. The Palaeoproterozoic Laoling Group consists of metamorphic conglomerate, quartzite, phyllite, schist and marble. The Neoproterozoic Qingbaikouan System mainly consists of feldspathic quartz sandstone, arkose and conglomerate. The Jurassic Linzitou and Shiren Formations consist of andesite, andesitic tuff, rhyolite and glutenite. The Cretaceous Xiaonangou Formation sediments consist of conglomerate and glutenite (Fig. 1b). The Quaternary sediments consist of clay and gravel (JBGMR, 1988). The fault system in the study area is dominated by the NE-trending Benxi-Tonghua and Yalujiang faults (Chu et al. Reference Chu, Sun, Zhang, Liu, Xu, Han, Zhao, Liu and Qin2021). Igneous rocks in the area comprise the Late Palaeozoic-Early Mesozoic mafic complex, alkali-granite and associated mafic rocks, and the Mesozoic granitic complex (Zhang, Reference Zhang2002). Mesozoic magmatic activity in the study area can be subdivided into three stages: the Late Triassic, the Early-Middle Jurassic and Cretaceous (Chu et al. Reference Chu, Sun, Zhang, Liu, Xu, Han, Zhao, Liu and Qin2021). Multiple stages of magmatic activity and geotectonic processes formed abundant Au deposits in this area (Sun et al. Reference Sun, Xing, Zheng, Huang, Yin, Liu, Wang, Ge, Li and Chen2006, Reference Sun, Liu, Xu, Xu, Chu and Gu2023; Han et al. Reference Han, Deng, Zhang, Sun, Wang, Zhang, Zhang, Liu, Zhao, Yang, Wang and Lin2022).
3. Deposit geology
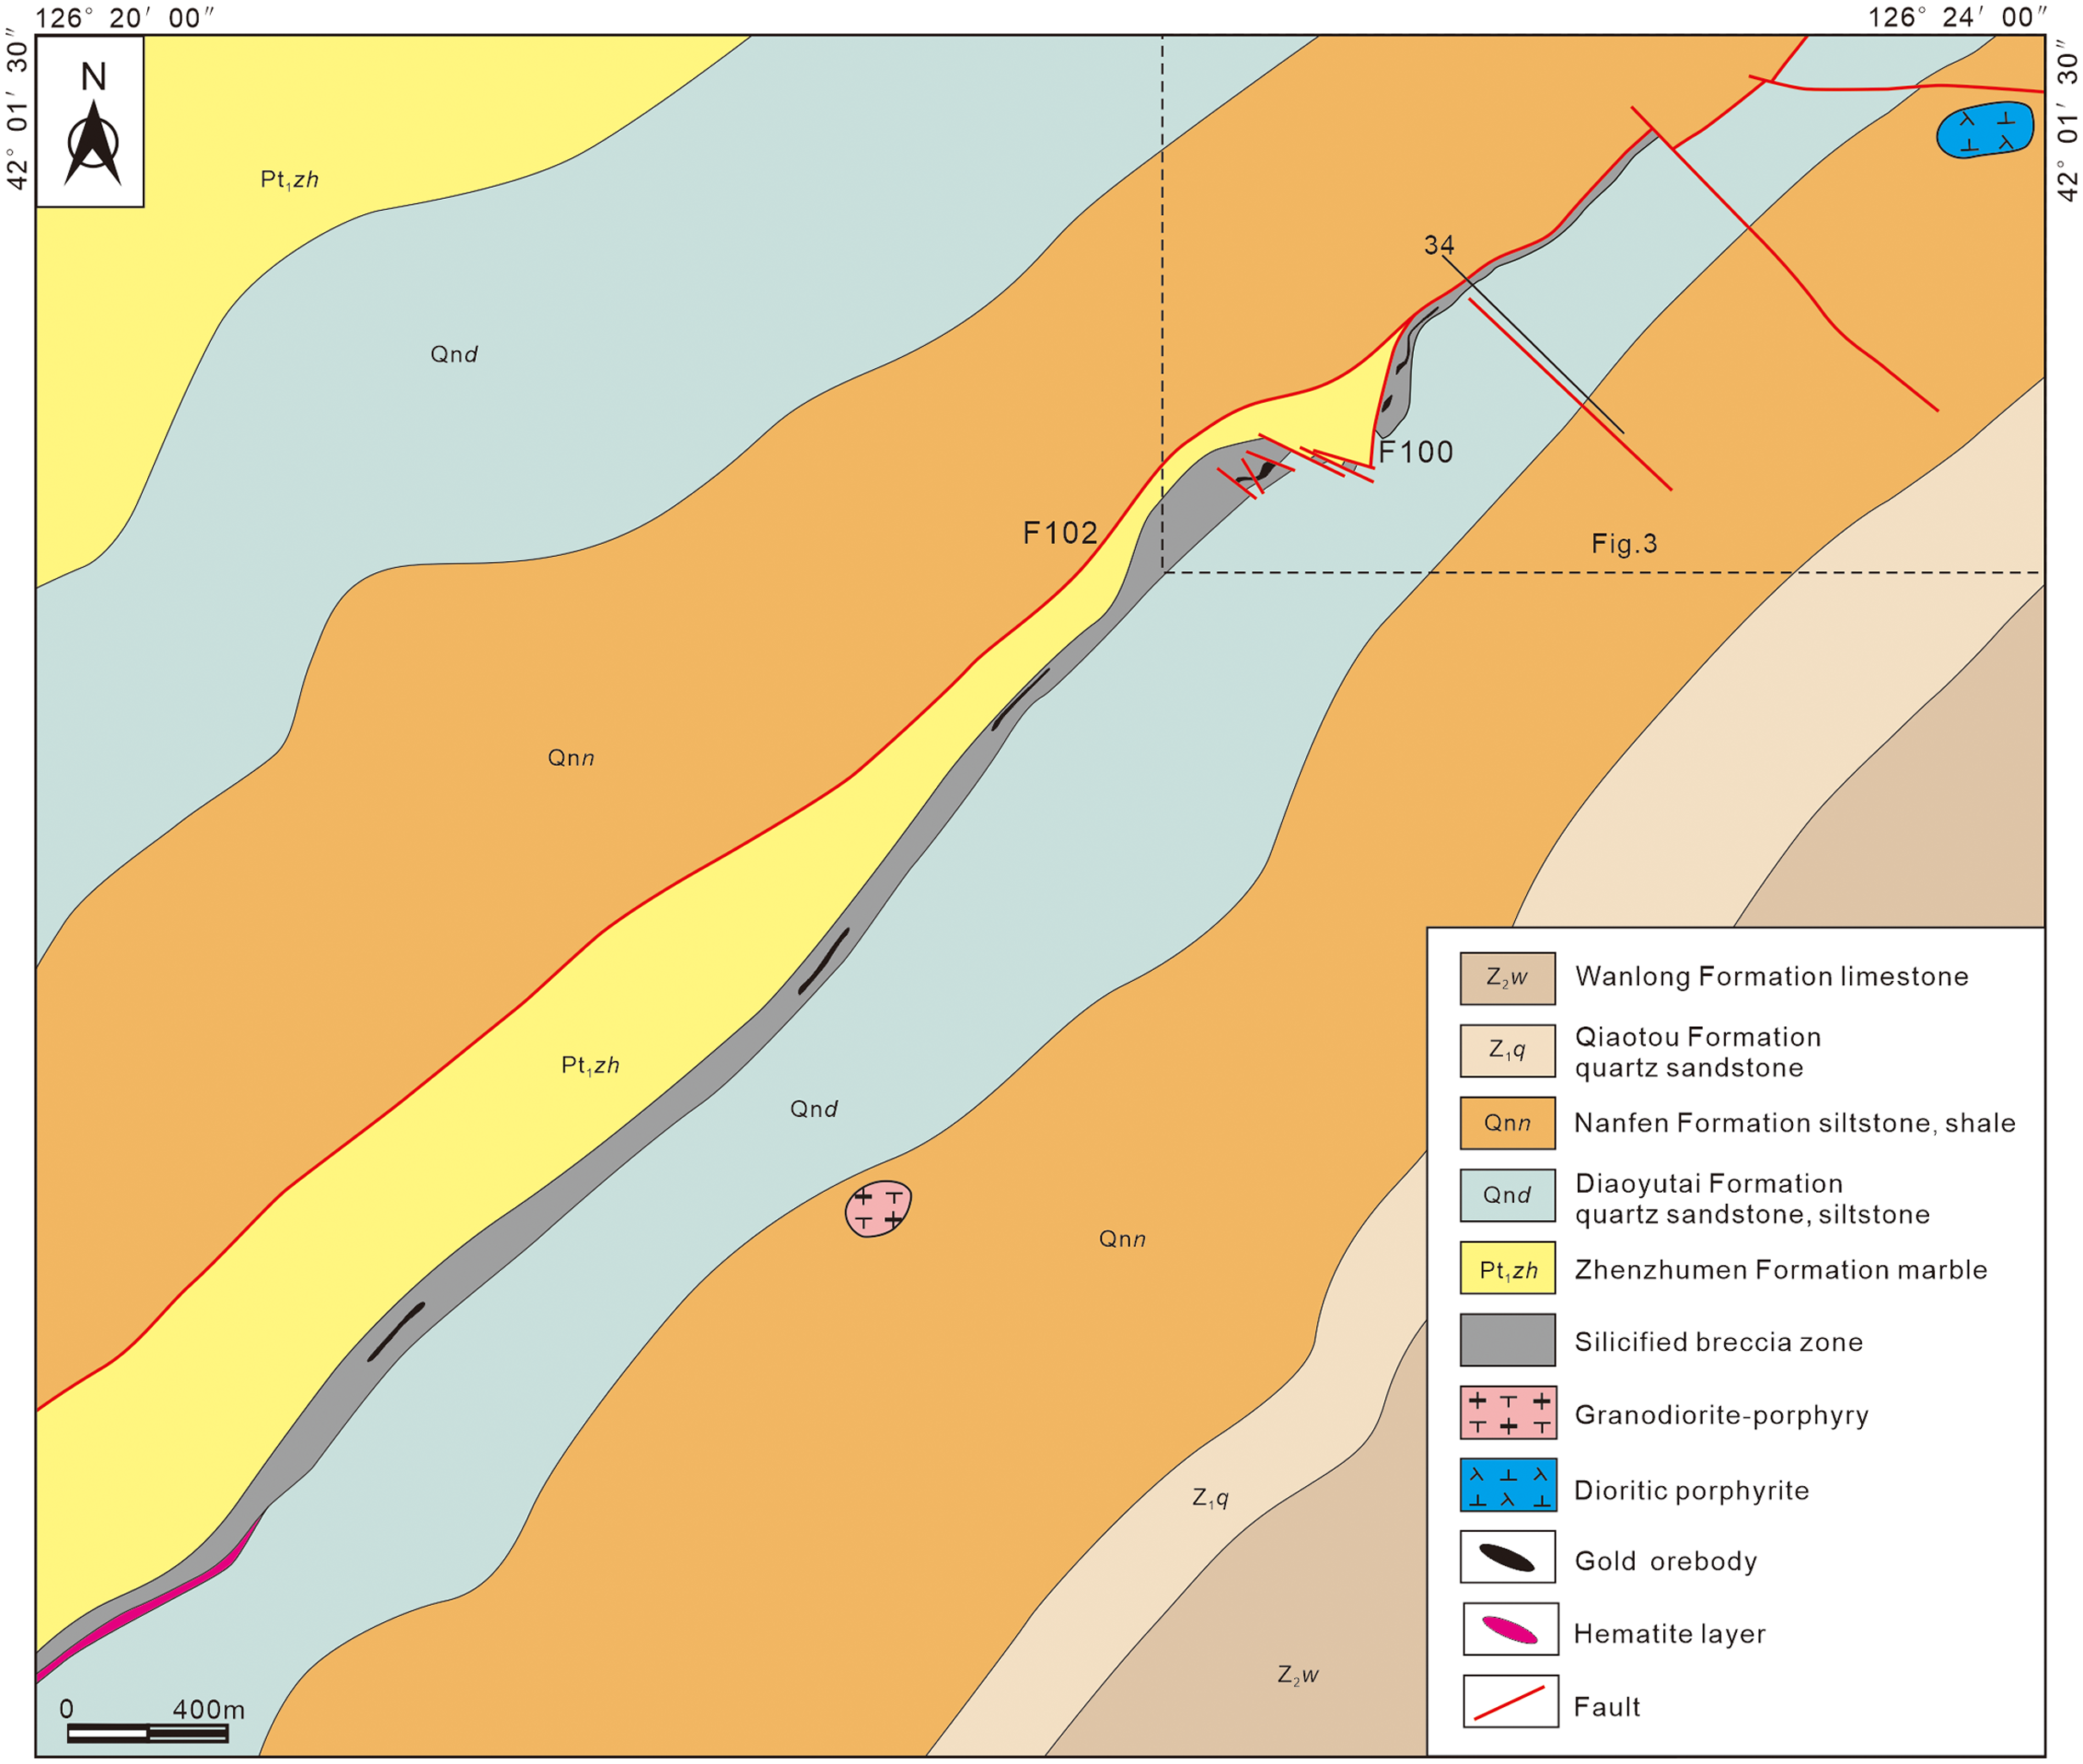
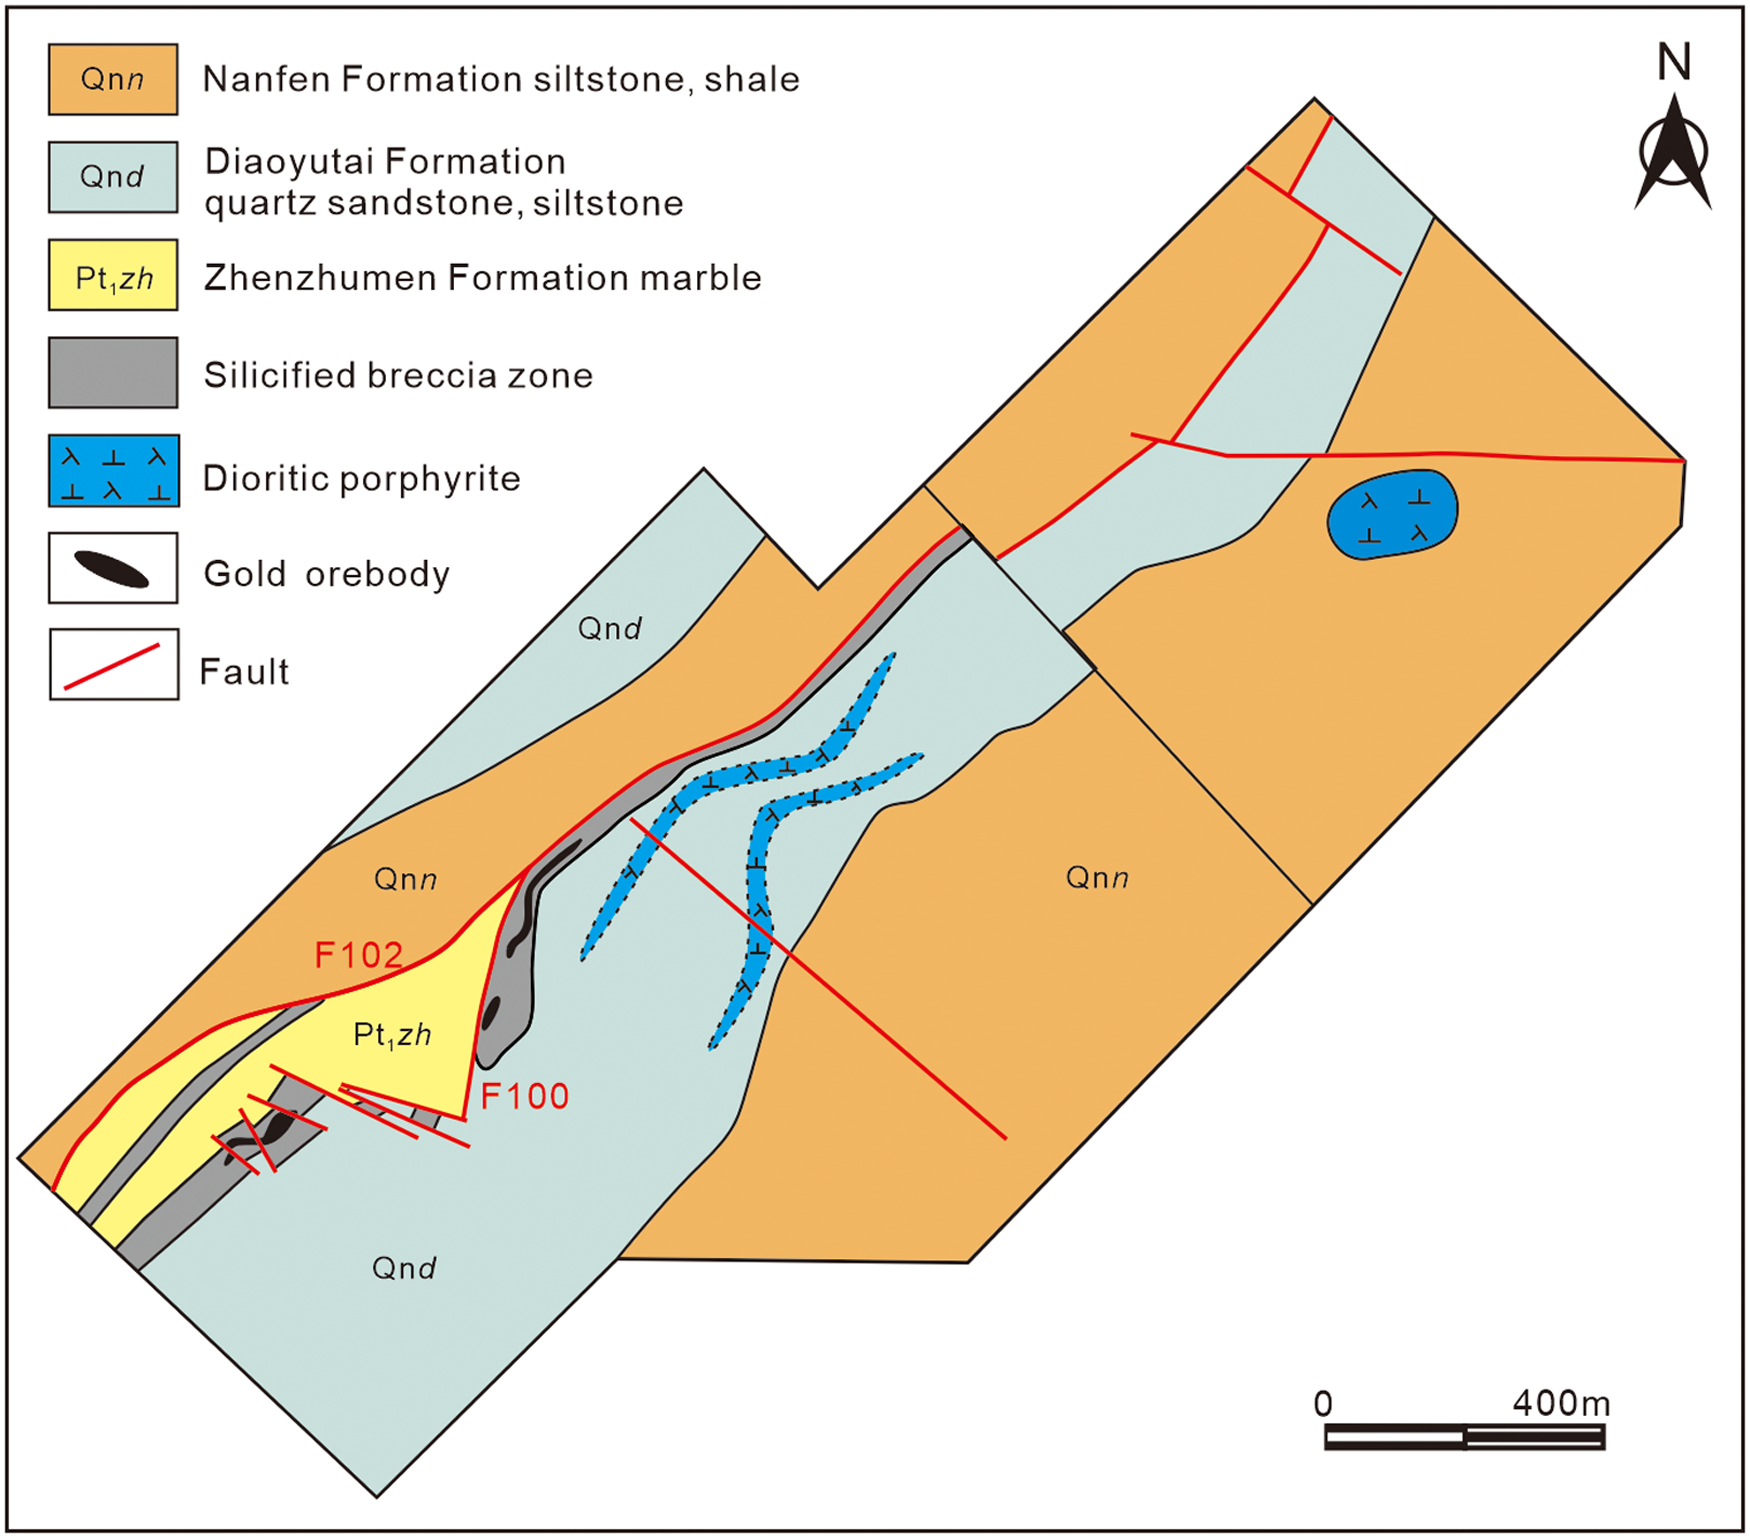
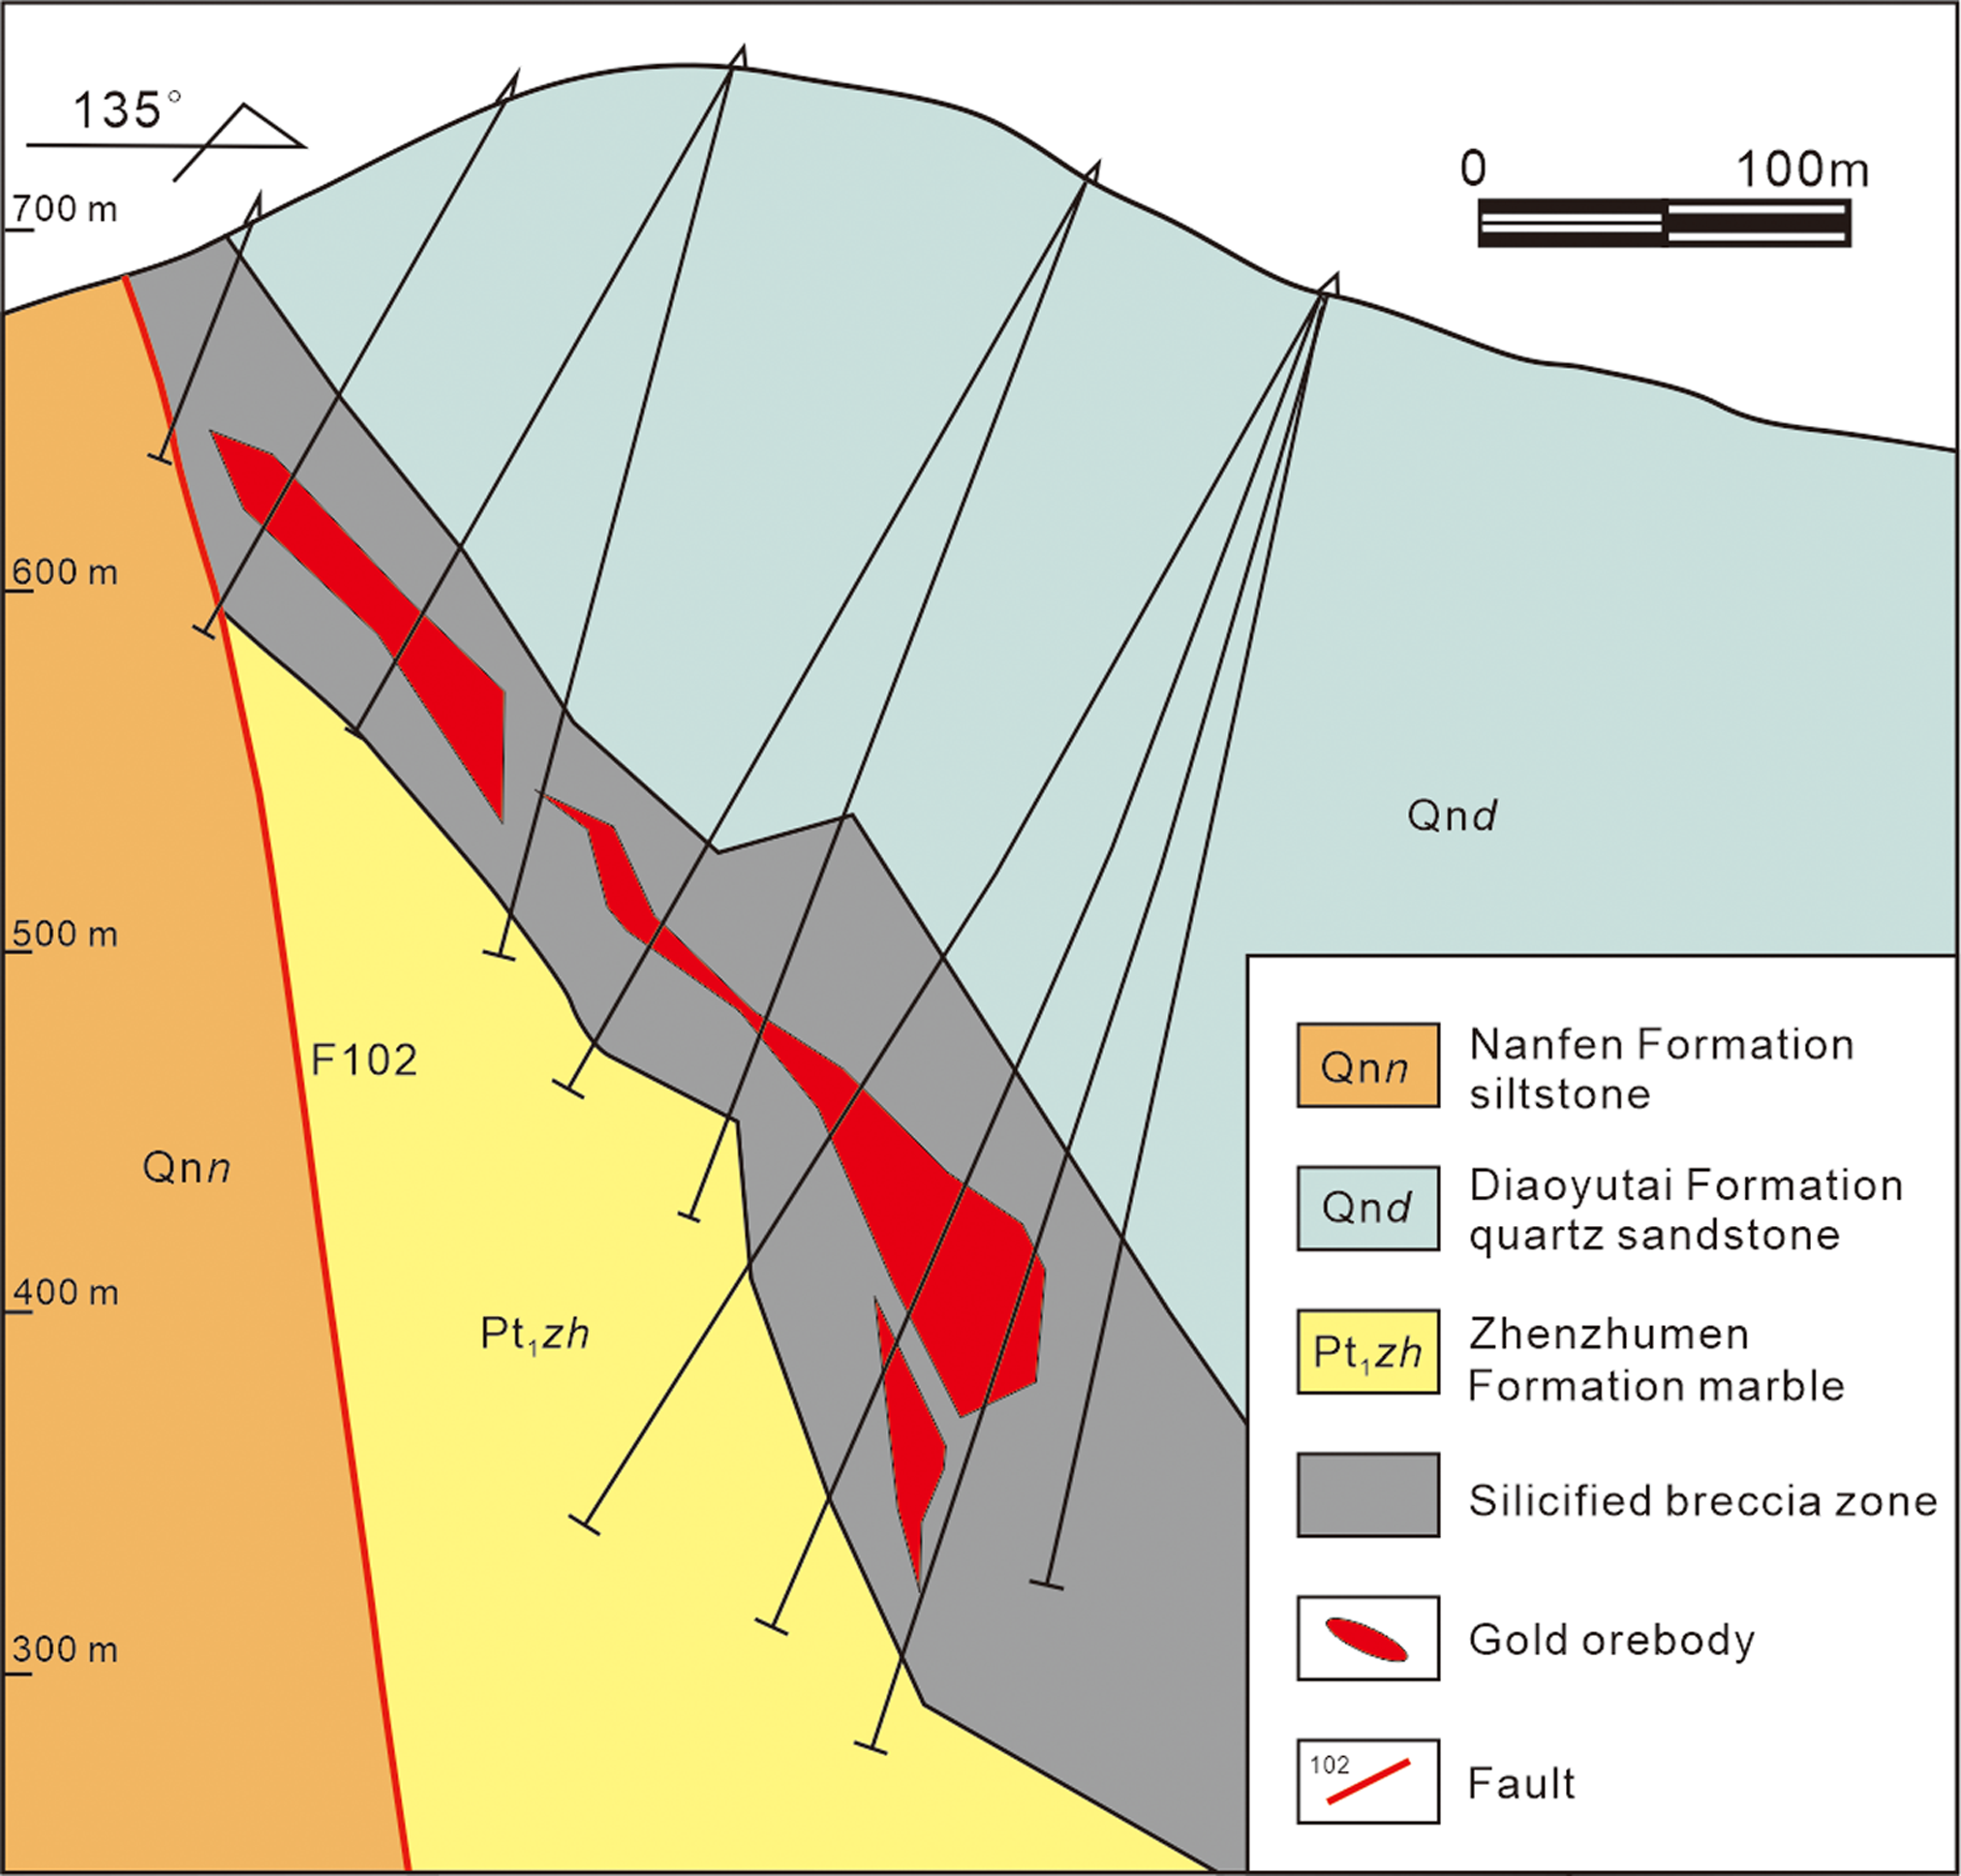
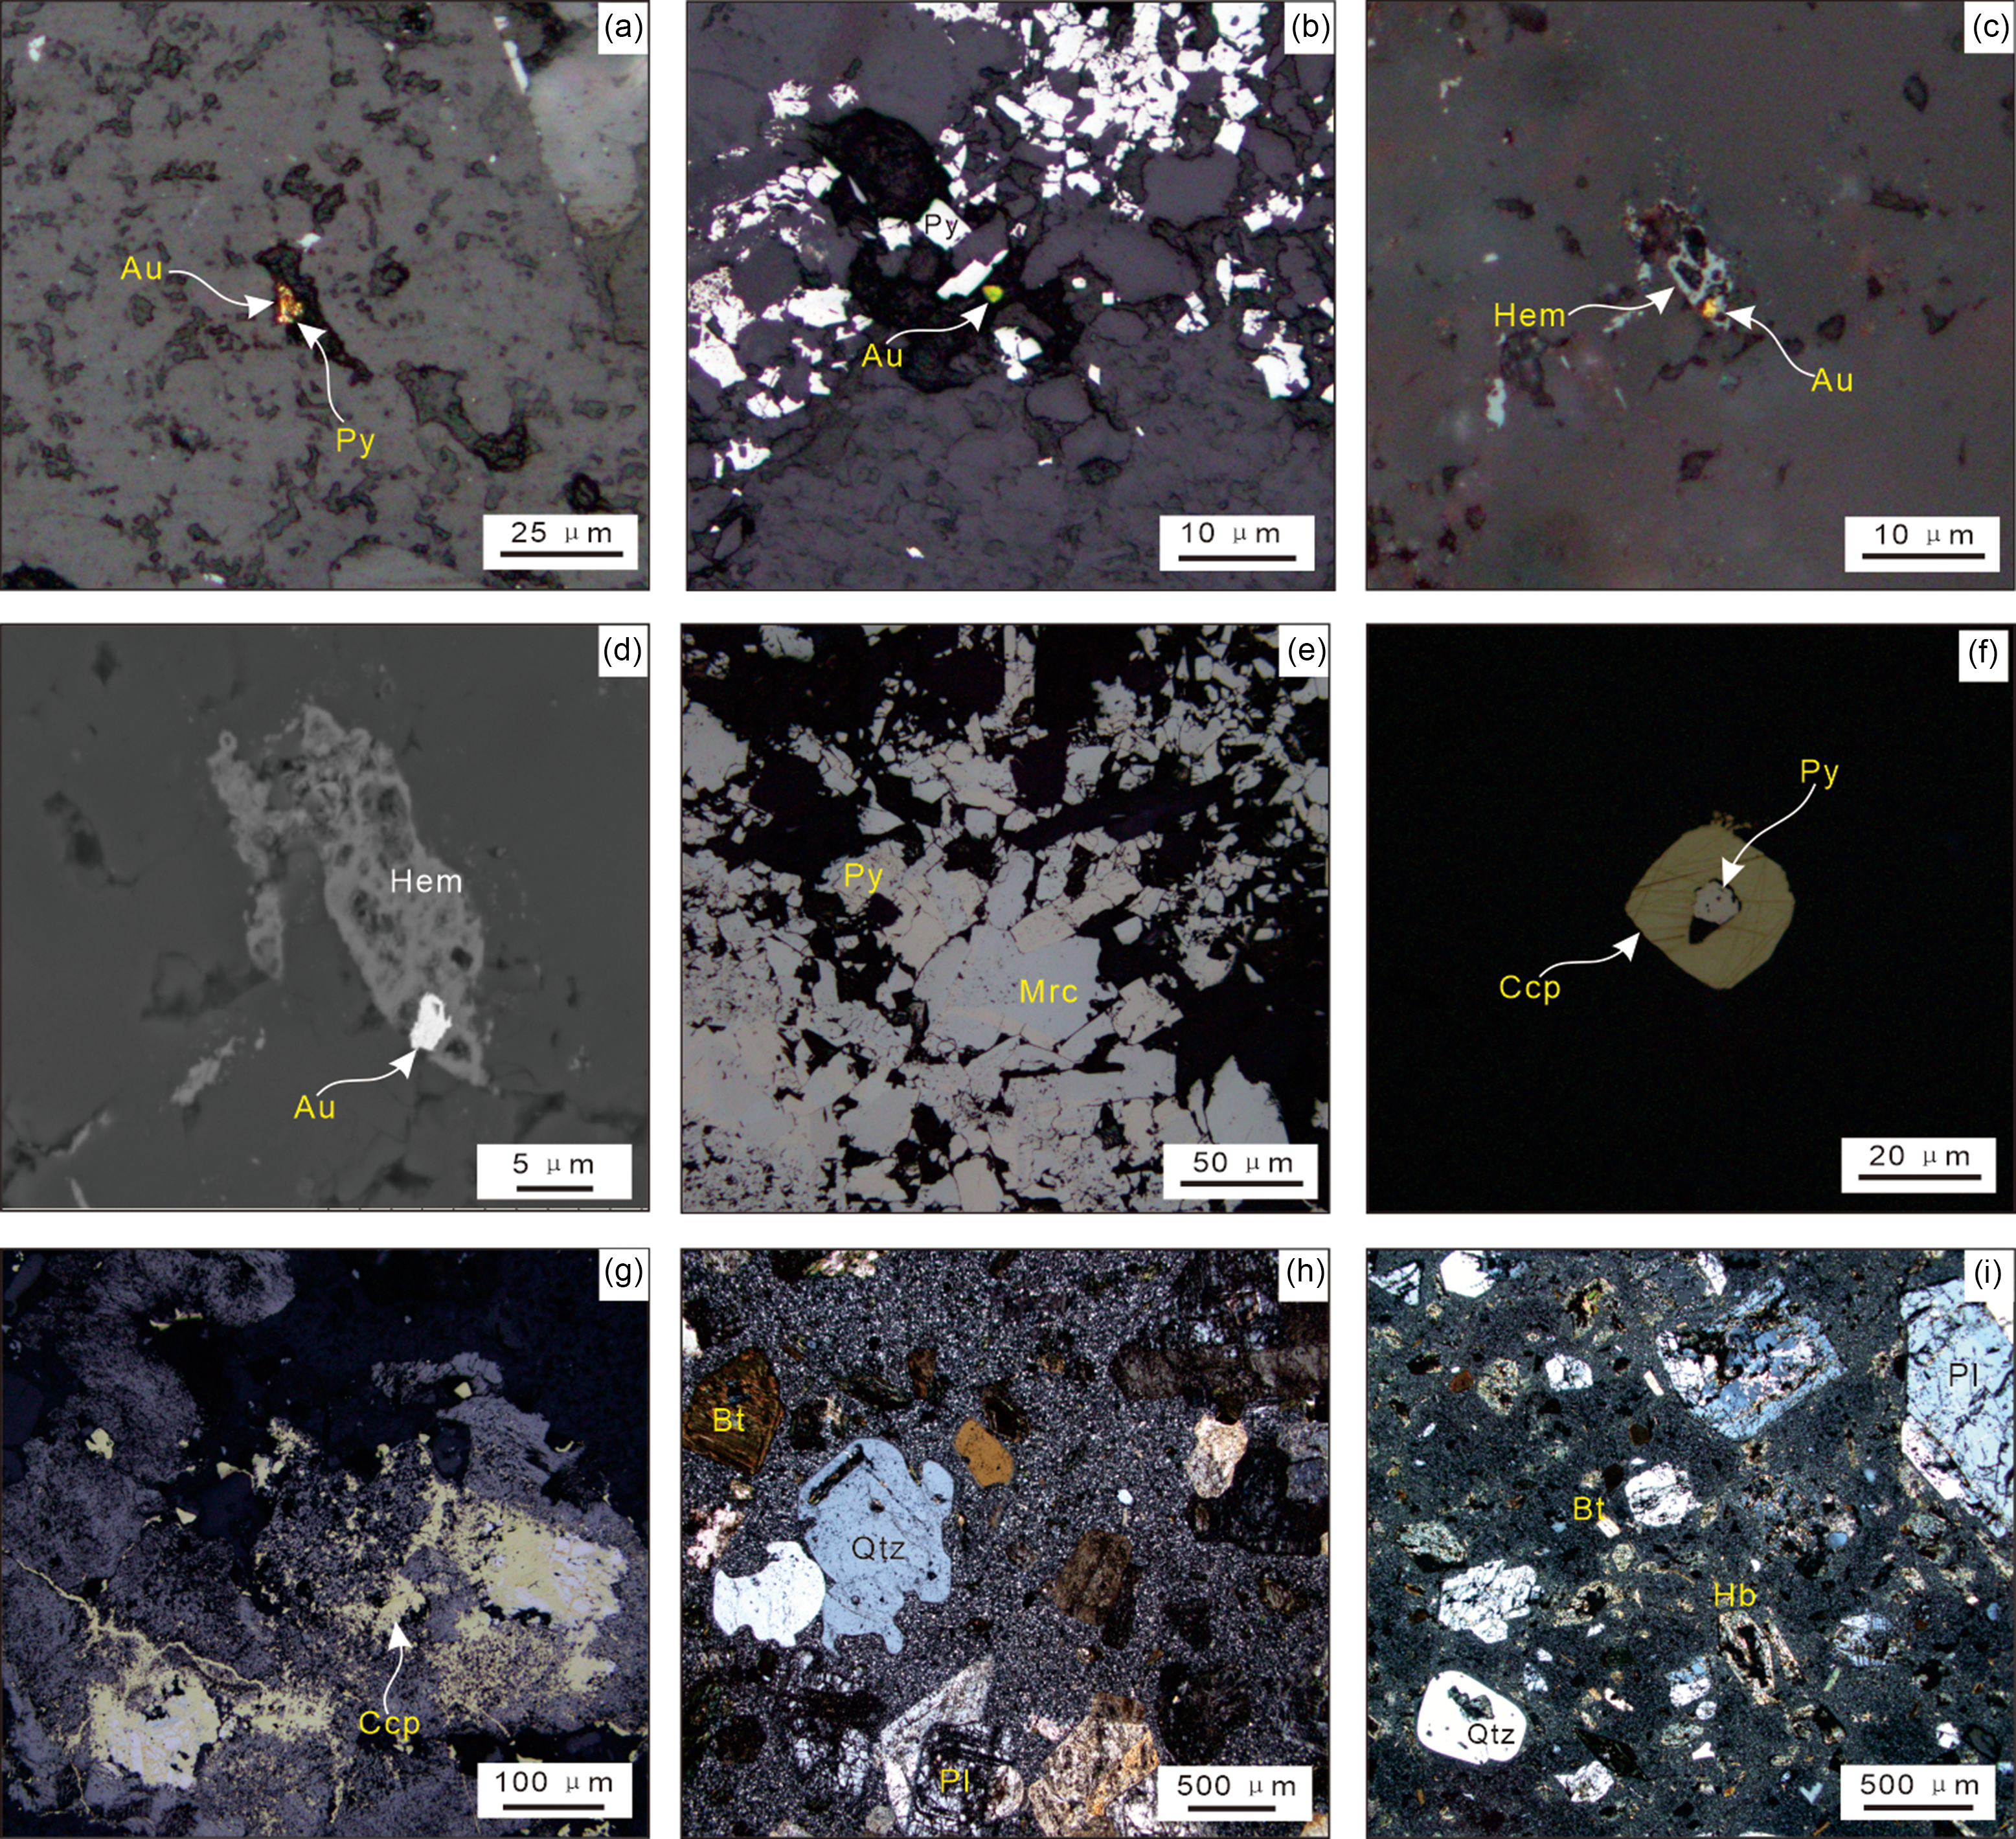
Proterozoic sediments and metasedimentary rocks are the main rocks in the Jinying gold deposit, and they were subdivided into five units: Palaeoproterozoic Zhenzhumen Formation and Neoproterozoic Diaoyutai, Nanfen, Qiaotou and Wanlong Formations (Fig. 2). The Zhenzhumen Formation is composed of dolomite marble and quartz-bearing dolomite marble. The Diaoyutai Formation occurs in the central and northwest parts of the deposit and is mainly composed of quartz sandstone and hematite-bearing quartz sandstone. The Nanfen Formation is composed of siltstone, micritic limestone and shale. The Qiaotou Formation occurs in the southeastern part of the deposit and is mainly composed of quartz sandstone and siltstone. The Wanlong Formation is mainly exposed in the southeast of the deposit and consists mainly of laminated limestone. The structures of the Jinying deposit are dominated by NE- and NW-trending faults, and the NE-trending faults, which are closely related to mineralization. Intrusive rocks in the mining area include granodiorite porphyry and dioritic porphyrite. Granodiorite porphyry is exposed in the south part of the study area (Fig. 2), and dioritic porphyrite is exposed in the northeast part of the study area, as a small-scale rock mass (Fig. 2), but altered dioritic porphyrite can be seen at depth of drill holes 7, 10, 14, 16 and 30 (Fig. 3, Chen et al. Reference Chen, Dong, Liu, Jia, Yu, Wu and Wang2020). Nine orebodies have been discovered in this deposit, and they mainly occur in the silicified breccia zone near the unconformity between the quartz sandstone and the silicified dolomitic marble (Fig. 4). They are controlled spatially by faults of No. F102 and F100 and therefore occur in a bedded shape, with dip SE at 48°–61°, and an average gold grade of 2.33–13.66 g/t (Chen, Reference Chen2019). The ore minerals comprise native gold (Fig. 5a–d), pyrite (Fig. 5e), marcasite (Fig. 5e), chalcopyrite (Fig. 5f, g), arsenopyrite, galena, sphalerite, hematite (Fig. 5c, d). Quartz, barite and sericite constitute the gangue mineral association. The alteration types are characterized by silicification, baritization, sericitization, kaolinization and carbonation. The hydrothermal processes can be divided into four paragenetic stages: quartz-pyrite stage, quartz-gold-pyrite stage, barite-chalcedony-gold-hematite stage and pyrite-marcasite stage (Xing et al. Reference Xing, Zhu, Yang, Li, Feng and Liu2012).
Geological map of the Jinying gold deposit.

Geological sketch map of the Jinying gold deposit (Chen et al. Reference Chen, Dong, Liu, Jia, Yu, Wu and Wang2020).

Cross-section showing the geology along exploration Line 34.

Photomicrographs of the Jinying gold deposit. (a, b) Gold coexisting with pyrite (reflected light); (c, d) gold coexisting with hematite (c-reflected light, d-BSE); (e) pyrite coexisting with marcasite (reflected light); (f) chalcopyrite coexisting with pyrite (reflected light); (g) chalcopyrite mineralization (reflected light); (h) granodiorite porphyry (cross-polarized light); (i) dioritic porphyrite (cross-polarized light). Hem = hematite; Au = gold; Py = pyrite; Mrc = marcasite; Ccp = chalcopyrite; Bt = biotite; Qtz = quartz; Hb = hornblende; Pl= plagioclase.

4. Samples and analytical methods
4.a. Sampling
For zircon U–Pb dating, one granodiorite porphyry sample was collected from an outcrop in the southern part of the deposit, and one dioritic porphyrite sample was collected from tunnel 160. For the He–Ar isotope analysis, five pyrite samples were collected from tunnel 160. Sixteen pyrite samples were collected from tunnel 365, of which nine for Rb–Sr isotope analyses and seven for in situ sulphur isotope analyses.
Granodiorite porphyry is grey in colour, porphyritic texture and massive structure, and the phenocrysts consist of plagioclase, quartz, biotite and minor K-feldspar and hornblende. The plagioclase crystals are platy with lengths varying from 0.5 to 3 mm and are characterized by sericitization. The K-feldspar grains anhedral with lengths varying from 1 to 2 mm. The quartz grains show anhedral shape with lengths varying from 0.5 to 8 mm. The matrix is composed of quartz, feldspar and biotite, with minor accessory magnetite, zircon and apatite (Fig. 5h). Dioritic porphyrite is grey, porphyritic texture, massive structure, and the phenocrysts are mainly plagioclase, quartz, biotite and hornblende. The plagioclase crystals are platy with lengths varying from 1 to 10 mm and are characterized by sericitization. The quartz grains are xenomorphic with lengths varying from 0.5 to 5 mm. The biotite is platy with lengths varying from 0.5 to 2 mm and is characterized by chloritization. The hornblende crystals are rhombic with lengths varying from 0.5 to 5 mm. The matrix is composed of quartz, plagioclase and biotite, with minor accessory magnetite, zircon and apatite (Fig. 5i).
4.b. Analytical methods
4.b.1. Zircon U–Pb dating
Zircon grains were separated using conventional heavy liquid and magnetic techniques, followed by hand selection under a binocular microscope. U–Pb isotopic analyses were performed using an Agilent 7500 mass spectrometer connected to a 193 nm ArF excimer laser ablation system at the MNR Key Laboratory of Metallogeny and Mineral Assessment, Institute of Mineral Resources, Chinese Academy of Geological Sciences (CAGS). Detailed operating conditions for the laser ablation system, the LA–ICP–MS instrument and data reduction were described by Hou et al. (Reference Hou, Li and Tian2009). Errors in individual analyses by LA–ICP–MS are provided at the 1σ level, while errors in pooled ages are noted at the 95% confidence level. Concordia diagrams and weighted mean calculations were made using the Isoplot program (Ludwig, Reference Ludwig2003).
4.b.2. Rb–Sr isotope analysis
The samples were crushed to a 40–80 mesh size and hand-selected under a binocular microscope, yielding samples of >99% purity. Sulphide grains were crushed to a <200 mesh size before analysis and then washed in an ultrasonic bath and dried. Rb and Sr isotopic analyses were performed on a VG-354 mass spectrometer with five collectors at the Nantai Geological Testing Institute, Nanjing, China. The analytical procedures were consistent with those described by Wang et al. (Reference Wang, Yang, Chen, Zhang and Rao2007a, Reference Wang, Gu, Zhang, Wu, Li and Yang2007b). During analysis, the reproducibility and accuracy of Sr isotope measurements were periodically checked by running the NBS987 standard reference material and laboratory standard La Jolla with a mean 87Sr/86Sr value of 0.710342 ± 0.000040 (certified value: 0.710340 ± 0.000260) based on the standard 86Sr/88Sr = 0.1194. The accuracy of the Rb/Sr ratios was better than 1%.
4.b.3. He–Ar isotope analysis
He–Ar isotopic analyses of five pyrite samples were conducted using a Helix SFT noble gas isotope mass spectrometer at the MNR Key Laboratory of Metallogeny and Mineral Assessment, Institute of Mineral Resources, CAGS. The measurement procedure consisted of crushing, purification and mass spectrometry. All weighed pyrite samples were measured under high vacuum conditions for analysis, with n × 10−9 mbar in the crush and purification system and n × 10−10 mbar in the mass spectrometer system. The details can be found in Liu et al. (Reference Liu, Li and Duan2018).
4.b.4. In situ S isotope
Seven pyrite samples (BMZ6, BMZ7, BMZ8 BMZ9, BMZ10, BMZ13, BMZ14) for in situ sulphur isotope analyses were analysed using a laser ablation coupled multicollector inductively coupled plasma mass spectrometer (LA-MC-ICP–MS) at the MNR Key Laboratory of Metallogeny and Mineral Assessment, Institute of Mineral Resources, CAGS. The laser fluence was 5.0 J/cm2, with a frequency of 4 Hz and spot diameter of 40–50 μm. The ablation method consisted of single-point ablation with a high-purity carrier gas. A standard-sample bracketing method (SSB) was employed to correct for instrumental mass fractionation, calibrated via a Balmat pyrite standard (Crowe & Vaughan, Reference Crowe and Vaughan1996), and the matrix effect was no more than 0.5‰.
5. Results
5.a. LA–ICP–MS zircon U–Pb ages
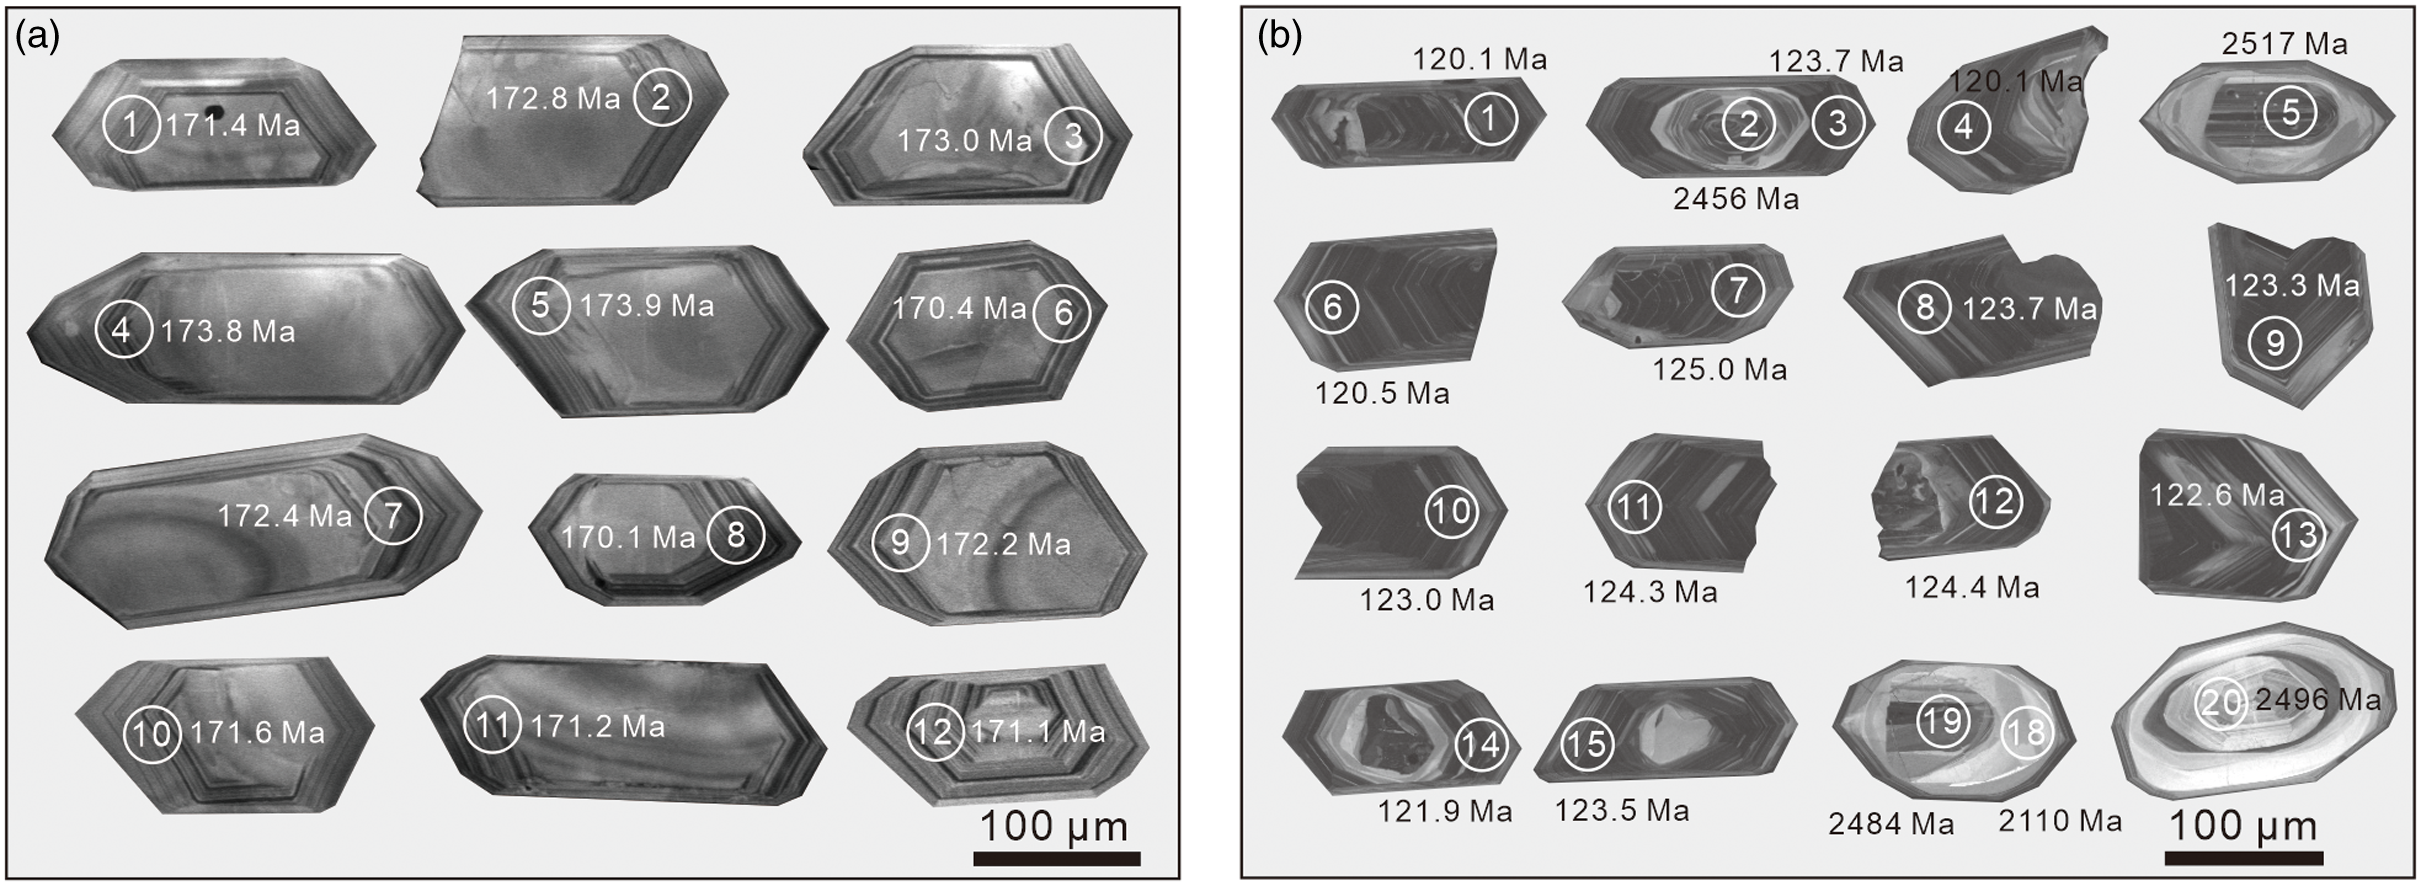
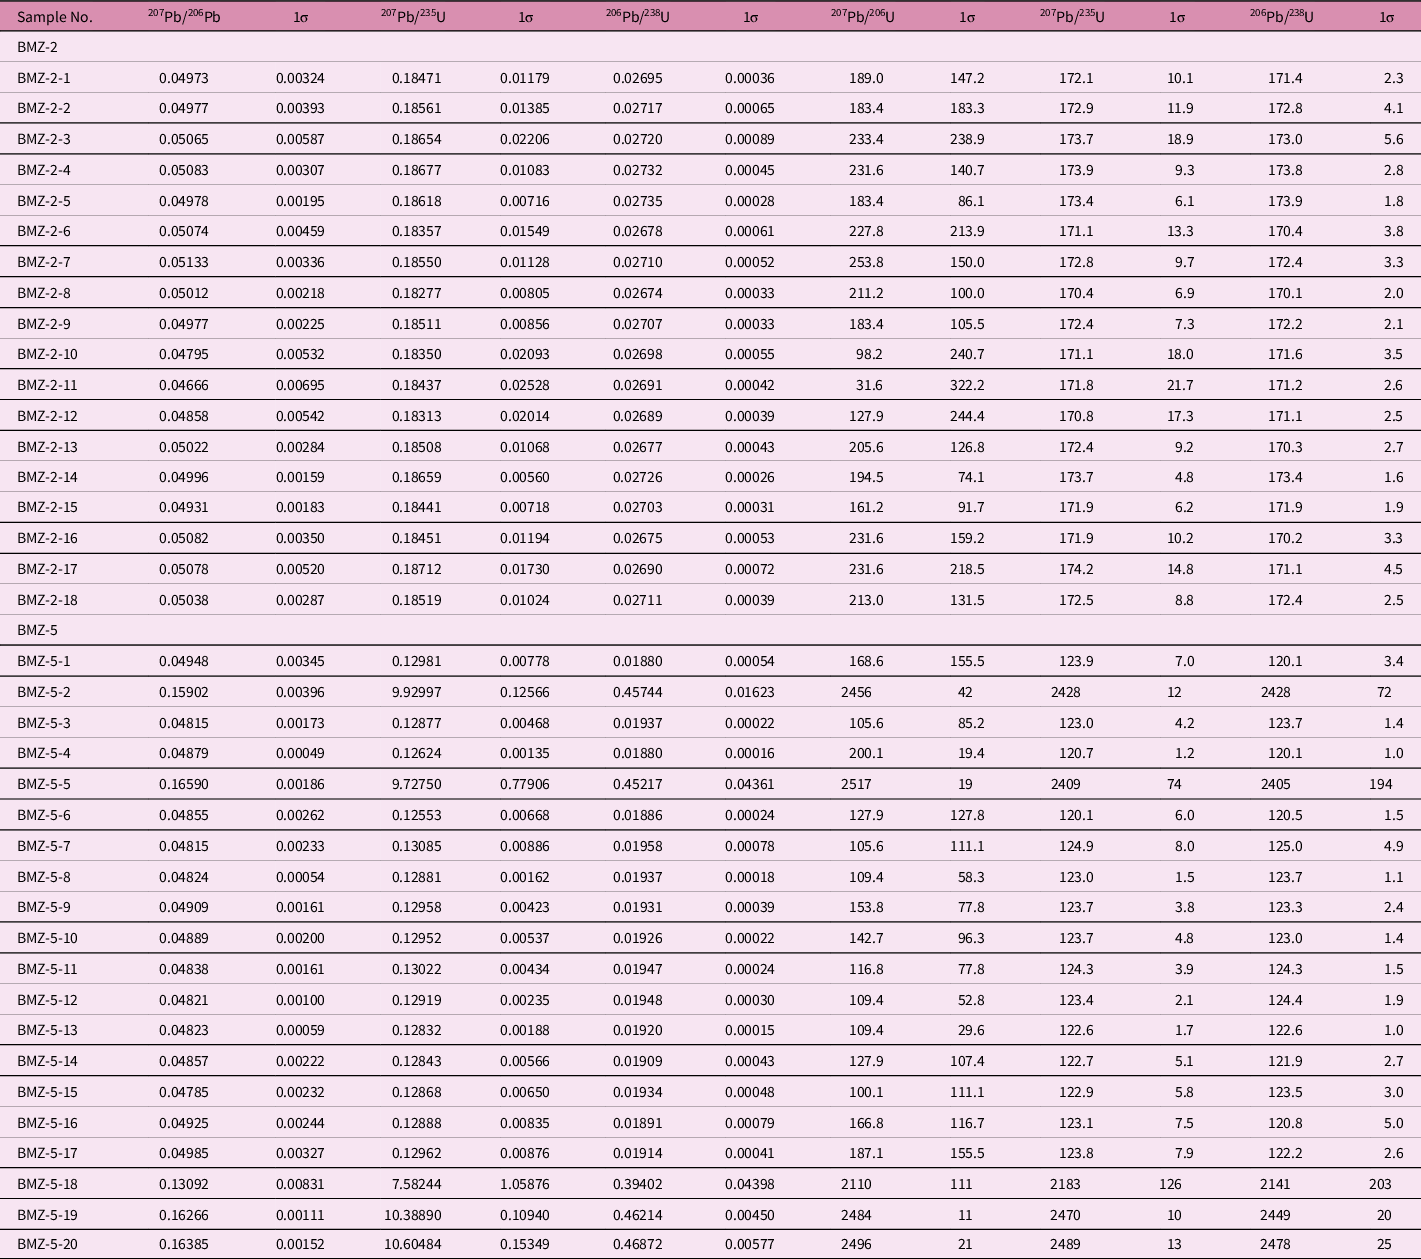
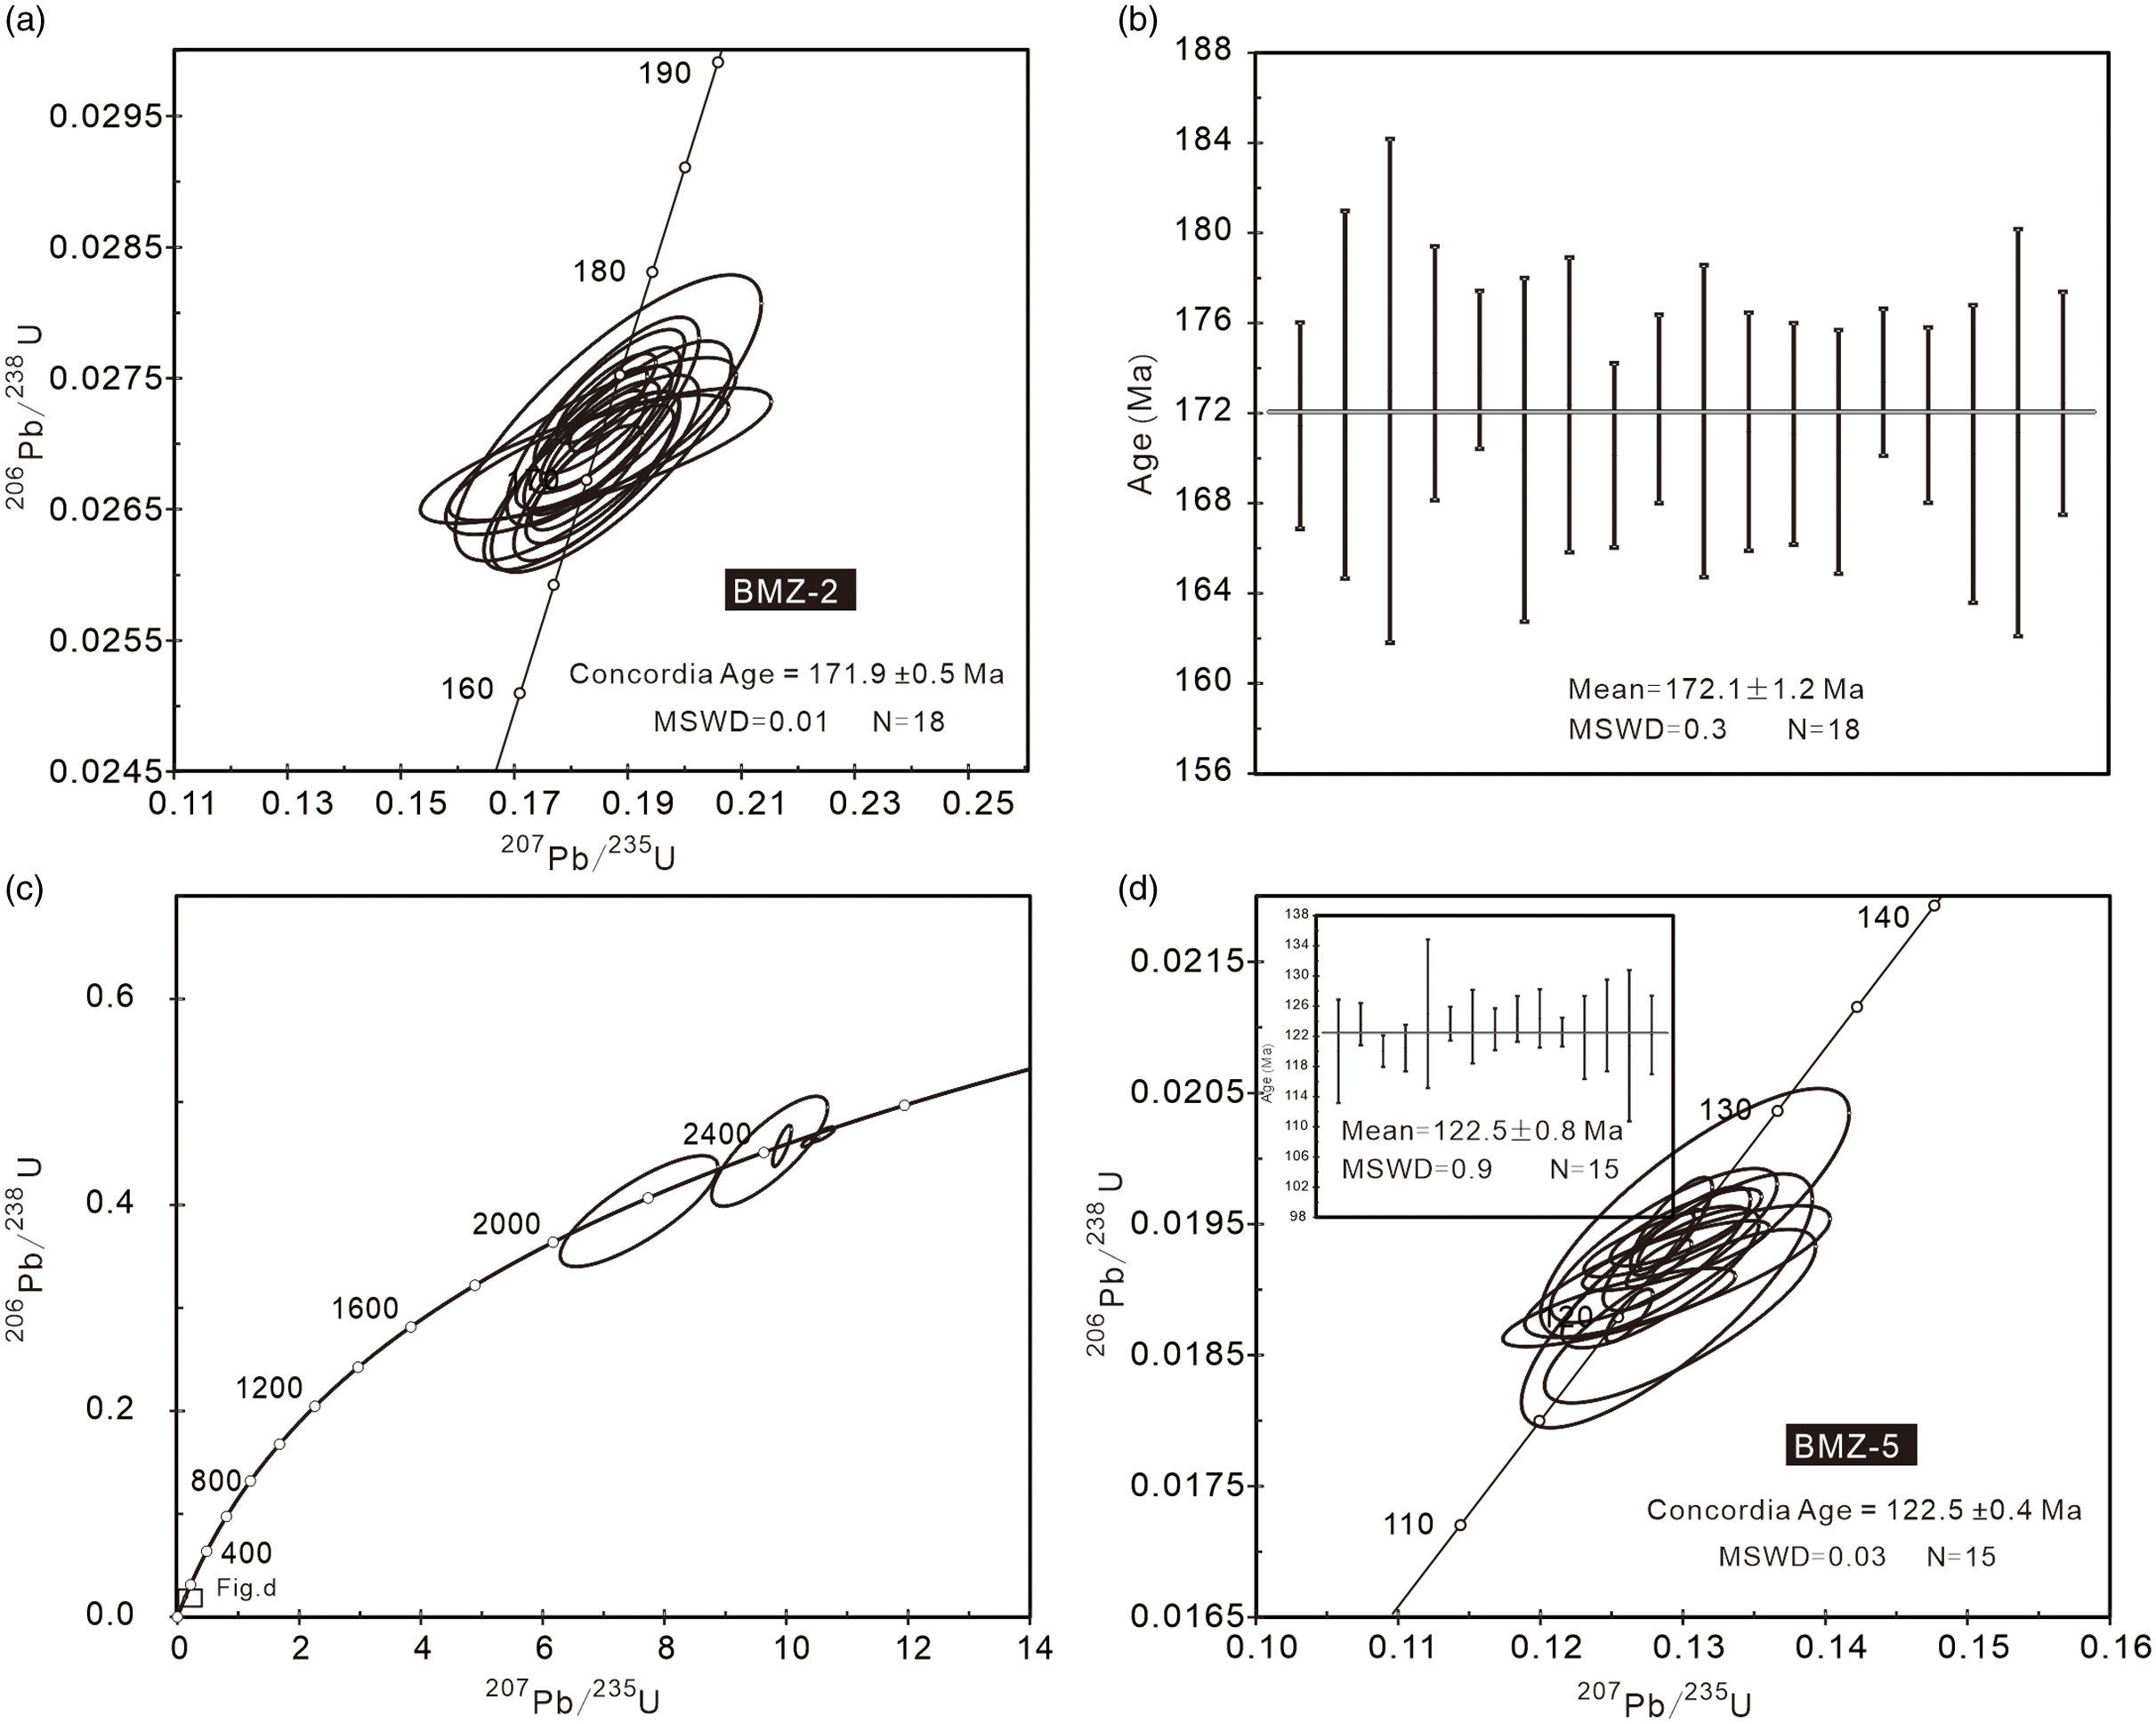
The zircons are euhedral or subhedral and show oscillatory zoning (Fig. 6a, b). The results of LA–ICP–MS zircon U–Pb dating are presented in Table 1. The zircon grains collected from granodiorite porphyry (BMZ-2) yield 206Pb/238U ages of 170.1–173.9 Ma and yield a zircon U–Pb concordia age and weighted age of 171.9 ± 0.5 Ma and 172.1 ± 1.2 Ma, respectively (Fig. 7a, b). The zircon grains collected from dioritic porphyrite (BMZ-5) yield 206Pb/238U ages of 120.1–2478 Ma (Fig. 7c). A total of 15 zircon grains of dioritic porphyrite yield 206Pb/238U ages of 120.1–125.0 Ma and yield a zircon U–Pb concordia age and weighted age of 122.5 ± 0.4 Ma and 122.5 ± 0.8 Ma, respectively (Fig. 7d). The remaining zircon grains yields ages of 2141–2478 Ma; they are interpreted as inherited ones.
Representative CL images of analysed zircons extracted from granodiorite porphyry and dioritic porphyrite in the Jinying gold deposit.

LA-ICP–MS zircon U–Pb dating results of intrusions in the Jinying gold deposit

Zircon U–Pb concordia diagrams for samples BMZ-2 (a, b) and BMZ-5 (c, d) from the Jinying gold deposit.

5.b. Rb–Sr dating
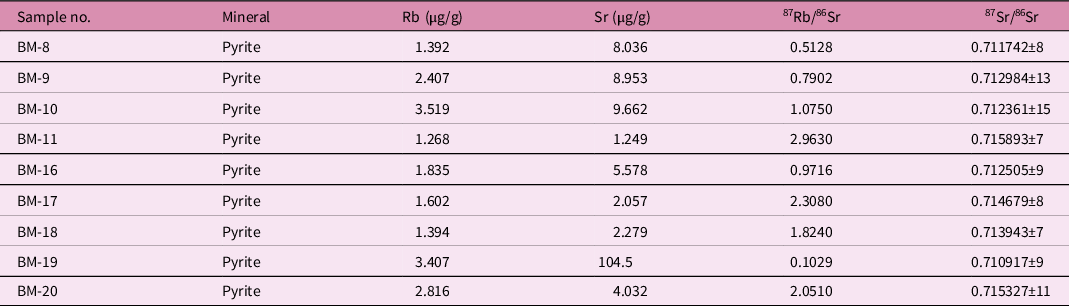
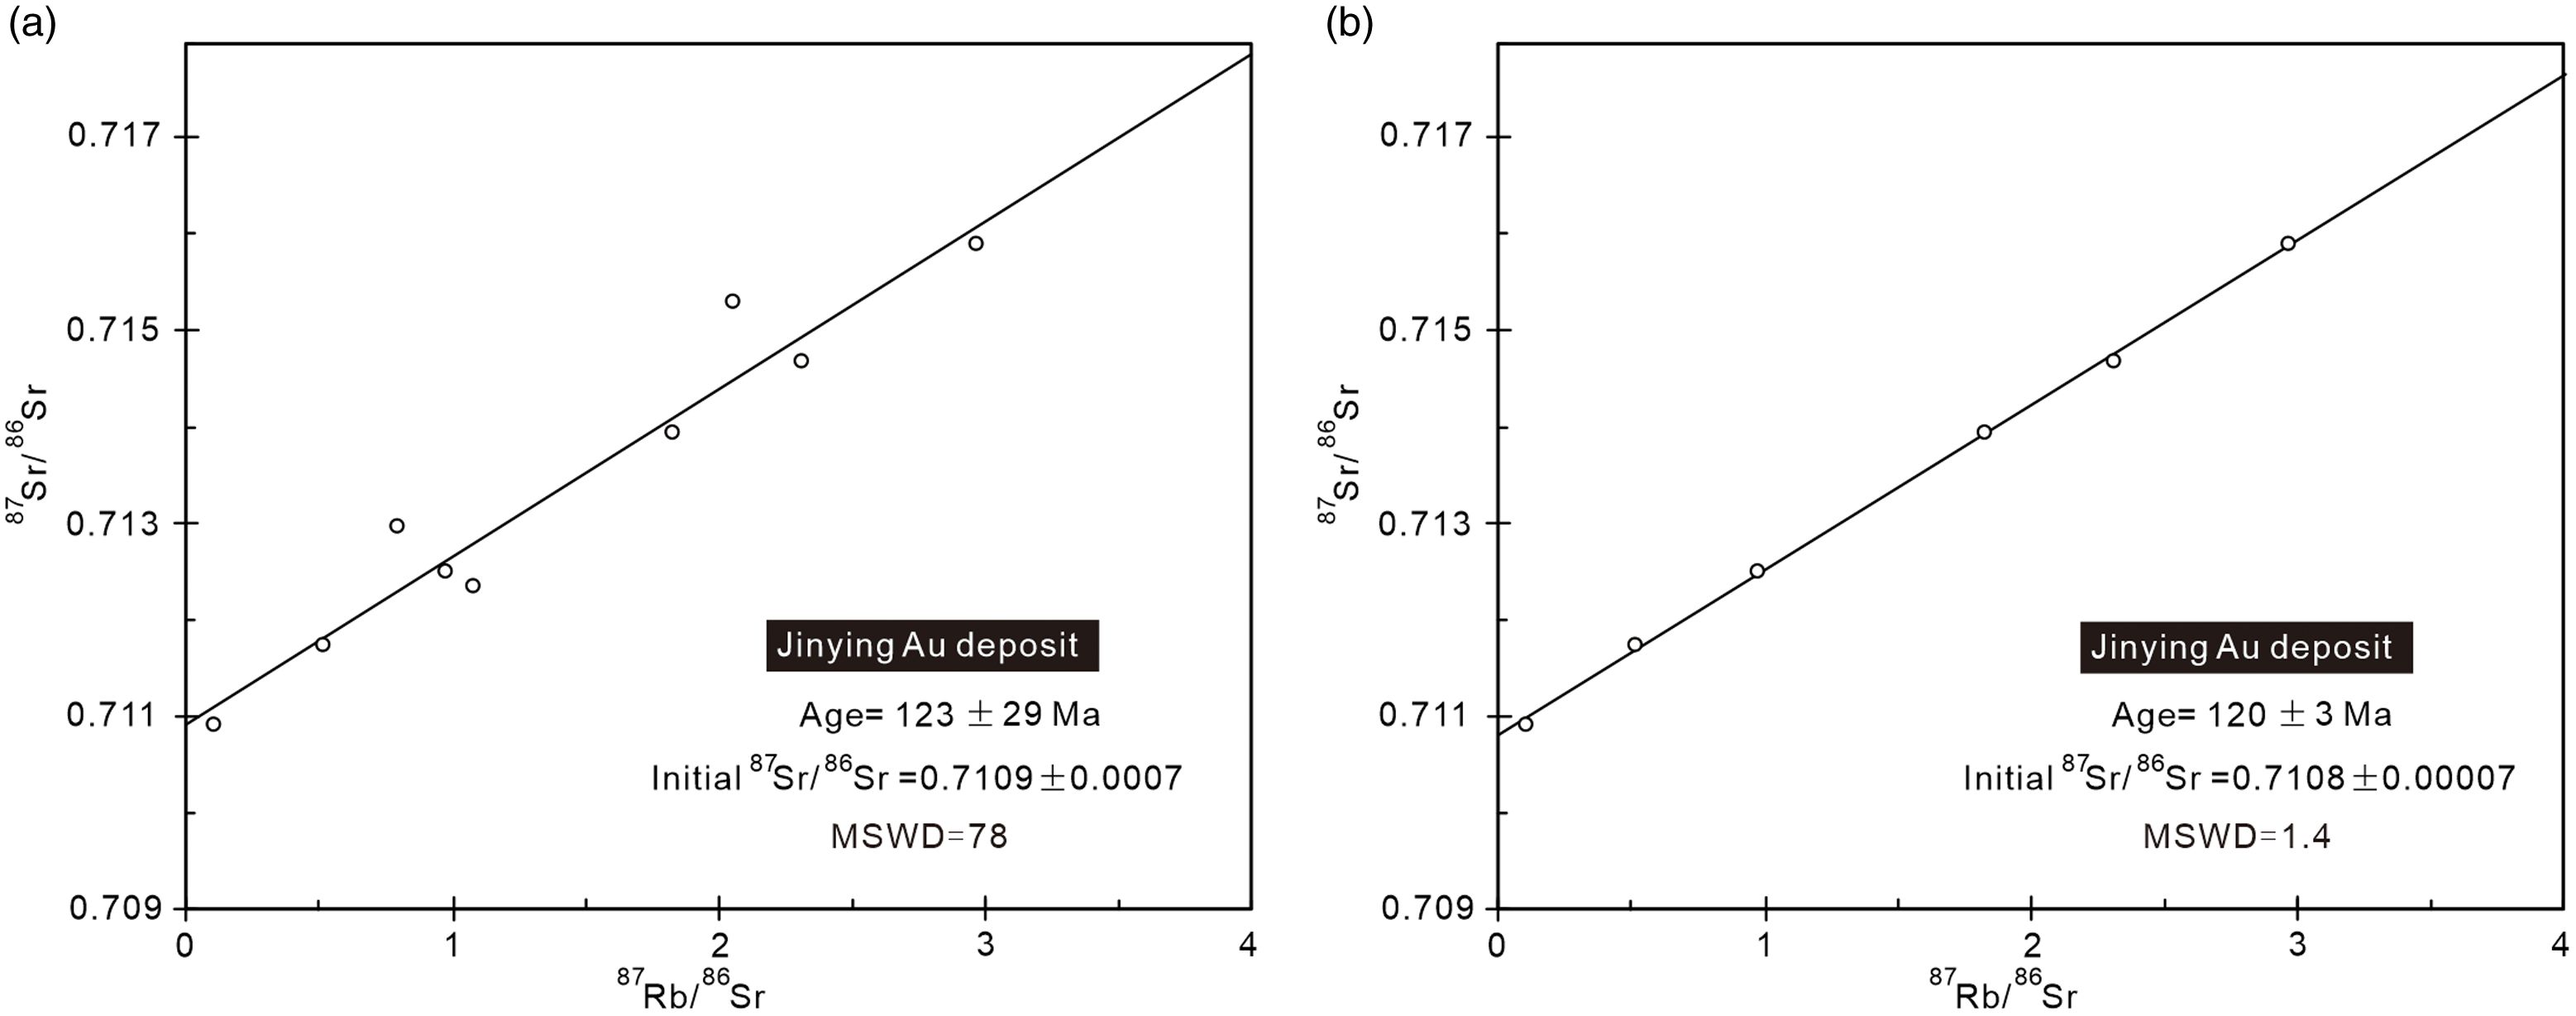
The Rb and Sr concentrations for nine pyrite samples from the Jinying gold deposit are listed in Table 2. The Rb contents of pyrite range from 1.268 to 3.519 ppm, and the Sr contents ranging from 1.249 to 104.5 ppm. The 87Rb/86Sr values range from 0.103 to 2.963. Nine data points yield an imprecise age of 123 ± 29 Ma with an initial 87Sr/86Sr ratio of 0.7109 ± 0.0007 (n = 9, MSWD = 78; Fig. 8a), which is considered unreliable. By removing three discrete points (BM-2, BM-3, and BM-9), the remaining data points yield a more precise date of 120 ± 3 Ma with an initial 87Sr/86Sr ratio of 0.7108 ± 0.00007 (MSWD = 1.4; Fig. 8b).
Rb-Sr isotopic analyses of pyrite from the Jinying gold deposit

Plot of sulphide Rb–Sr isochron for the Jinying gold deposit.

5.c. He–Ar isotopes
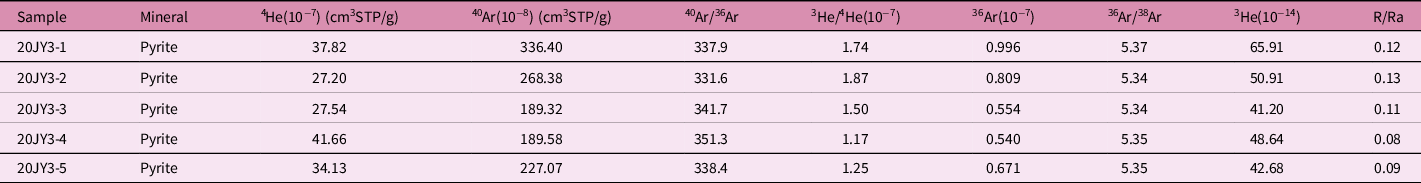
The He–Ar isotopic results of pyrite samples are presented in Table 3. The concentrations of 4He and 3He are (27.20–41.66) × 10−7 cm3STP/g and (41.20–65.91) × 10−14 cm3STP/g, respectively, and 40Ar ranges from 189.32 × 10⁻⁸ cm3STP/g to 336.40 × 10⁻⁸ cm3STP/g. The 40Ar/36Ar ratios are 331.6–351.3. The 3He/4He ratios vary from 1.17 × 10⁻⁷ to 1.87 × 10⁻⁷. The R/Ra ratios of the ore-forming fluid from the pyrite samples are 0.08–0.13.
He-Ar isotopic compositions of fluid inclusions trapped in pyrite from the Jinying gold deposit

Note: R/Ra = (3He/4He)sample/1.4 × 10−6.
5.d. In situ S isotope compositions
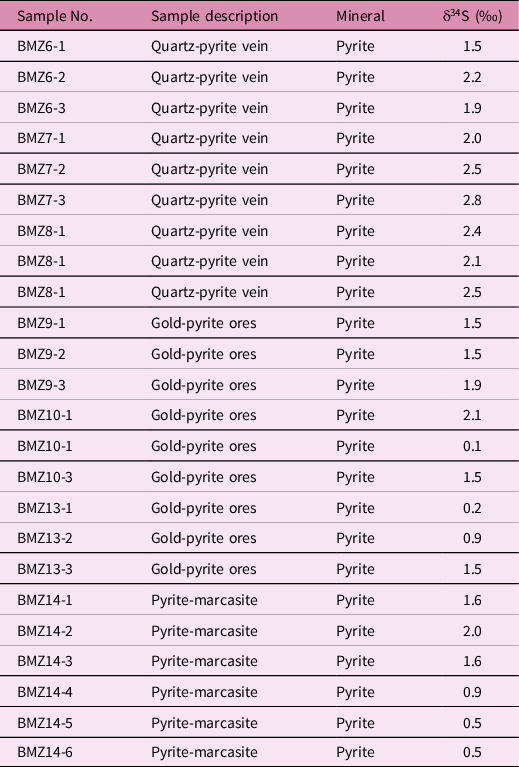
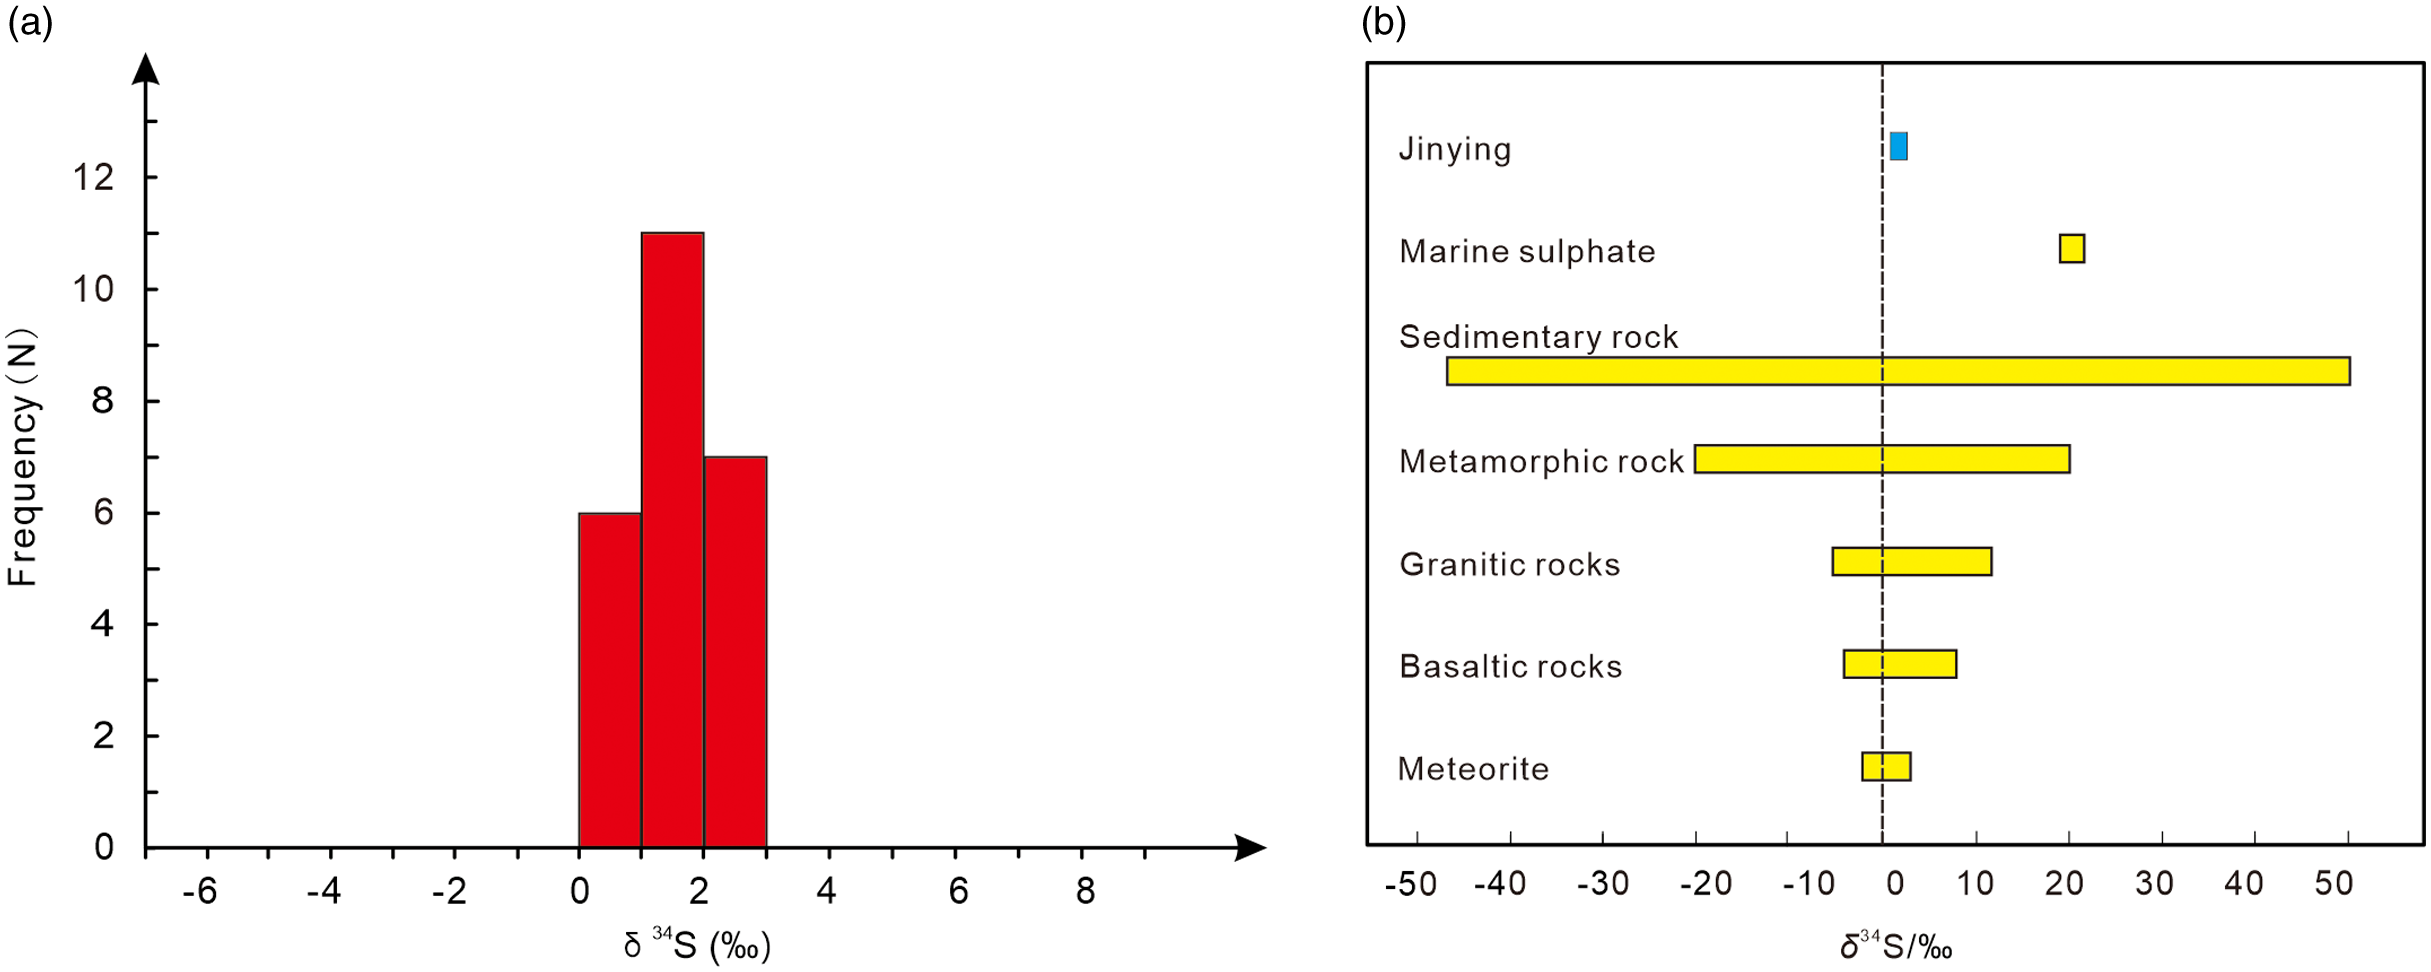
The in situ S isotopic compositions of pyrite are listed in Table 4. The δ34S values of pyrite have a relatively narrow range from + 0.1 ‰ to + 2.8 ‰ (Fig. 9a, b) and an average of 1.6 ‰ (n = 24).
In situ sulphur isotope results of ore minerals in the Jinying gold deposit

Frequency histogram (a) and selected geologically important sulphur reservoirs (b, Wei and Wang, Reference Wei and Wang1988) of δ34S values for pyrite from the Jinying deposit.

6. Discussion
6.a. Timing of gold mineralization
The volume of dioritic porphyrite increases towards deep levels, suggesting a considerable flux of dioritic magmas (Chen et al. Reference Chen, Dong, Liu, Jia, Yu, Wu and Wang2020). At the No. 7 drill hole, the dioritic porphyrite is featured by sericitization and kaolinization at a depth of 51 metres. On either side in contact with the gold-bearing silicified breccia, the mineralized alteration shows a gradual trend of evolution from strong to weak. Moreover, mineralized altered dioritic porphyrite breccia was found in drill holes 10, 14, 16 and 30. All these ideological facts show that the genesis of the gold deposit is closely related to the dioritic porphyrite. In this study, the Rb–Sr age of 120 ± 3 Ma for pyrite associated with Au mineralization in the ore vein provides evidence of an Early Cretaceous Au mineralization age. Zircon U–Pb dating indicates that the crystallization age of the dioritic porphyrite was 122.5 ± 0.8 Ma, whereas the granodiorite porphyry yielded a relatively older age of 172.1 ± 1.2 Ma. These ages indicate that dioritic porphyrite and gold mineralization were largely synchronous and that mineralization and magmatism occurred in the Early Cretaceous. The age interpreted for the Jinying deposit is similar to that of many other magmatic-hydrothermal ore deposits in eastern Liaoning and southern Jilin. These include the Wulong Au deposit (119 Ma, Zhang et al. Reference Zhang, Kou, Zhao, Bi, Sha, Han and Li2020), Xinfang Au deposit (121 Ma, Zhang et al. Reference Zhang, Zhao, Kou, Yang, Sha, Yang, Zhang and Yu2022a), Changfagou Cu (Au) deposit (116 Ma; Zhang et al. Reference Zhang, Xing, Li, Liang, Yu, Du, Wang, Zhang and Ma2017) and Tianhexing Cu (Mo) deposit (115 Ma; Zhang et al. Reference Zhang, Xing, Song, Wang, Yu, Du, Ma and Zhang2015). The Jinying Au deposit is thus representative of an important Early Cretaceous gold mineralization event in southern Jilin Province.
6.b. Source of sulphur and ore-forming fluids
The δ34S values of pyrite at Jinying show a narrow range from + 0.1 ‰ to + 2.8‰ (mean = 1.6 ‰, n = 24), which are consistent with those from the typical magmatic-hydrothermal deposit worldwide (0 ± 3 ‰, Ohmoto & Rye Reference Ohmoto, Rye and Barnes1979) and from magmatic-hydrothermal Au deposits in the Liaodong Peninsula (e.g. Wulong, Liu et al. Reference Liu, Zhang, Wang, Li, Yang, Liu, Li and Duan2019, Zhang et al. Reference Zhang, Kou, Zhao, Bi, Sha, Han and Li2020; Xinfang, Zhang et al. Reference Zhang, Zhao, Kou, Yang, Sha, Yang, Zhang and Yu2022a). These data indicate that the sulphur of the Jinying deposit was derived from a magmatic source.
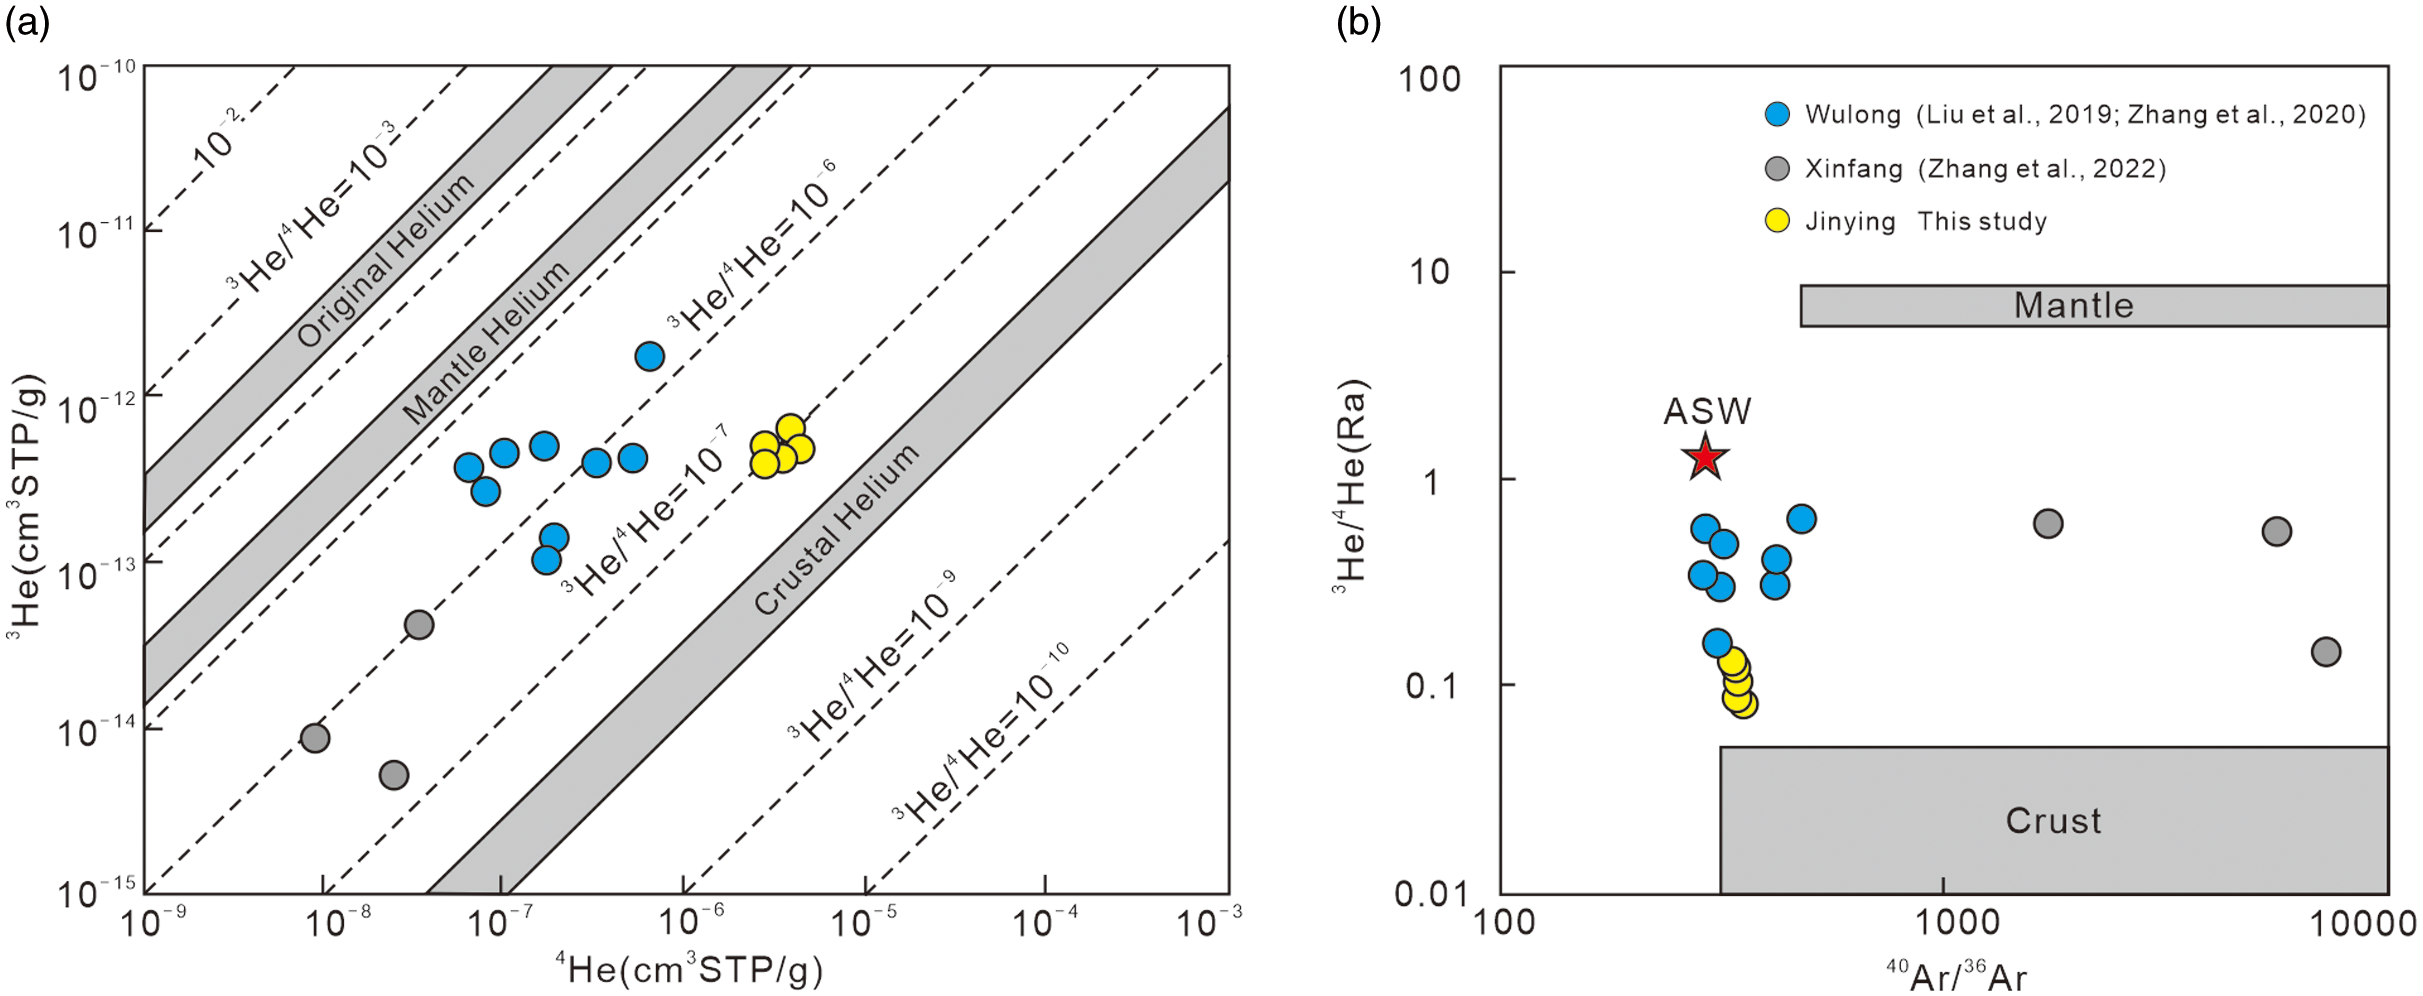
It is generally recognized that there are three potential sources of He and Ar isotopes (Turner et al. Reference Turner, Burnard, Ford, Gilmour, Lyon and Stuart1993; Stuart et al. Reference Stuart, Burnard, Taylor and Turner1995; Burnard et al. Reference Burnard, Hu, Turner and Bi1999): (1) air-saturated water (ASW, e.g. meteoric water or seawater) with a 3He/4He ratio of 1Ra=1.4 × 10⁻⁶ and a 40Ar/36Ar ratio of 295.5; (2) mantle-derived fluids with 3He/4He ratios generally of 6–9 Ra and 40Ar/36Ar >40000; and (3) crust-derived fluids with 3He/4He ratios of 0.01 to 0.05 Ra and 40Ar/36Ar >45000. The 3He/4He ratios of the pyrite from Jinying range from 0.08 to 0.13 Ra, which are slightly higher than those of crust-derived fluids. In the plot of 3He vs. 4He (Fig. 10a), all of the data are located between the crust and mantle helium isotopic compositions, indicating that the ore-forming fluids of the Jinying gold deposit were derived from mixed mantle and crustal sources.
Plots of 3He versus 4He (a, Mamyrin & Tolstikhin, Reference Mamyrin and Tolstikhin1984) and 3He/4He versus 40Ar/36Ar (b, Winckler et al. Reference Winckler, Aeschbach-Hertig, Kipfer, Botz, Rübel, Bayer and Stoffers2001) for fluid inclusions in pyrite from the Jinying gold deposit.

For Ar isotopes, the obtained 40Ar/36Ar values of fluid inclusions range from 331.6 to 351.3 and are slightly higher than those of ASW (295.5, Fig. 10b). In the 3He/4He (R/Ra) vs. 40Ar/36Ar diagram (Fig. 10b), all of the data plot between the crustal and mantle end-members, indicating that the ore-forming fluids might be a mixture of two end-member fluids. These He–Ar isotope data are similar to those from the Early Cretaceous magmatic-hydrothermal Au deposits in the Liaodong. Likewise, the 3He/4He and 40Ar/36Ar values of pyrite from Wulong range from 0.15–0.54 R/Ra and 297–315 (Zhang et al. Reference Zhang, Kou, Zhao, Bi, Sha, Han and Li2020). For the Xinfang gold deposit, the 3He/4He and 40Ar/36Ar values of pyrite range from 0.14–0.62 R/Ra and 1008–7100 (Zhang et al. Reference Zhang, Zhao, Kou, Yang, Sha, Yang, Zhang and Yu2022a). Moreover, the proportion of mantle 4He is calculated as Hemantle (%) = (Rsample-Rcrust)/(Rmantle -Rcrust) × 100%, where R mantle = 8, Rcrust= 0.01 and R represents the 3He/4He ratios of the fluids in the mantle, crust, and sample (Tolstikhin, Reference Tolstikhin, Alexander and Ozima1978; Kendrick et al. Reference Kendrick, Burgess, Pattrick and Turner2001). The calculated results indicate a mantle He range of 1.0–1.6%, indicating that the ore-forming fluids were dominantly crustal fluids with inputs of minor amounts of mantle fluids.
6.c. Ore genesis and tectonic implications
The sulphur isotopic compositions of pyrite suggested that the sulphur of the Jinying gold deposit has a magmatic source. Their He–Ar isotopic compositions suggest that the ore-forming fluids were derived from mixed mantle and crustal sources. The timing of gold mineralization is similar to the timing of emplacement of spatially related dioritic porphyrite in the deposit, implying that the mineralization was related to the intrusive activity. Based on the above arguments, it is reasonable to interpret the Jinying gold deposit is a magmatic-hydrothermal deposit.
The study area is located within the eastern edge of the NCC, which records the evolution and the final closure of the Palaeo-Asian Ocean, as well as the overprinting of the Palaeo-Pacific tectonic regimes during the Mesozoic (Sengör et al. Reference Sengör, Natal’in and Burtman1993; Sengör & Natal’in, Reference Sengör, Natal’in, Yin and Harrison1996; Li, Reference Li2006; Wu et al. Reference Wu, Sun, Ge, Zhang, Grant, Wilde and Jahn2011; Xu et al. Reference Xu, Pei, Wang, Meng, Ji, Yang and Wang2013). Multiple stages and complicated geotectonic processes led to the formation of abundant magnesite, talcum, boron, lead–zinc and gold deposits in this area (Shen et al. Reference Shen, Zhang and Bi2020; Li et al. Reference Li, Zhu, Algeo, Li, Jiang, Chen and Elatikpo2023; Zhang et al. Reference Zhang, Xu, Sun, Han, Feng, Wang, Liu and Chu2023). The northern margin of the NCC is the most important gold belt in China, and many previous studies have examined the mineralization age and tectonic setting of gold deposits. The results show that gold mineralization occurred in the Permian–Triassic, Jurassic and Early Cretaceous (Li et al. Reference Li, Li, Algeo, Wu and Cisse2018; Zeng et al. Reference Zeng, Wang, Yang, Guo, Yu, Zhou and Qiu2021; Zhang et al. Reference Zhang, Kou and Zhao2022b; Song et al. Reference Song, Wang, Song, Li, Wang, Wei, Zhang and Song2023; Zhao et al. Reference Zhao, Xu, Dong, Santosh, Li and Chang2023), formed during closure of the Palaeo-Asian Ocean, subduction of the Palaeo-Pacific Plate and an extensional setting associated with rollback of the Palaeo-Pacific Plate (Zhu et al. Reference Zhu, Fan, Li, Meng, Li and Zeng2015; Wu et al. Reference Wu, Yang, Xu, Wilde and Walker2019), respectively. In this study, we determined that magmatism and mineralization at Jinying occurred during the Early Cretaceous, and the formation of the deposit likely occurred in an extensional setting controlled by the rollback of the Palaeo-Pacific Plate. This interpretation is extensional-related settings, lithospheric thinning and delamination occurring spatially from west to the east with accompanying by upwelling asthenospheric mantle. In this case, the hot asthenospheric mantle provided enough heat to melt the delaminated lower crust and react with it, producing adakitic magmas in this area (Chen et al. Reference Chen, Dong, Liu, Jia, Yu, Wu and Wang2020; Xuan et al. Reference Xuan, Dong, Wang, Liu, Zhang, Wang, Gao and Li2022), where magmatic differentiation formed ore-bearing fluids. The ore-bearing fluids then ascended along the fault and mixed with meteoric water or metamorphic water, which was accompanied by complicated physical and chemical changes that would have led to the deposition of gold and metal sulphides in the structural breccia belt.
7. Conclusions
-
(1) Zircons from granodiorite porphyry and dioritic porphyrite yield U–Pb ages of 172.1 ± 1.2 Ma and 122.5 ± 0.8 Ma, respectively, and the Rb–Sr isotopic age is 120 ± 3 Ma for pyrite samples associated with gold, indicating that gold mineralization and associated magmatism of the Jinying gold deposit occurred during the Early Cretaceous.
-
(2) He–Ar isotopic compositions indicate that the ore-forming fluids mainly originated from a mixture of crustal and mantle components. In situ S isotope compositions of pyrite indicate that the ore-related sulphur source was derived from deep magma.
-
(3) The Early Cretaceous diagenesis and mineralization formed in an extensional setting associated with rollback of the Palaeo-Pacific Plate.
Acknowledgements
This work was jointly supported by the Science & Technology Fundamental Resources Investigation Program (Grant No. 2022FY101704), the National Natural Science Foundation of China (Nos. 42172095, 42072085, 41602075), the Chinese Central Government for Basic Scientific Research Operations in Commonwealth Research Institutes (KK2105) and the Chinese Geological Survey Program (DD20230305). We thank executive editor Dr. Tim Johnson and associate editor Dr. Bo Wang, and Dr. Huan Li and anonymous reviewers for their critical reviews and excellent suggestions that improved this article.
Competing interests
The authors declare that they have no known competing financial interests or personal relationships that could have appeared to influence the work reported in this paper.

 Open access