


Introduction
Permafrost is defined as ground that does not warm above 0°C for 2 or more years (Muller Reference Muller1945), and it is found in the Arctic, Antarctica and high-elevation environments. Dry permafrost, devoid of ice, was first discovered in the high elevations of Antarctica. Extensive studies in the upper elevations of the McMurdo Dry Valleys of Antarctica have shown that below a thin active layer that reaches above 0°C on an annual basis there are locations with dry permafrost with no ice table below (Campbell & Claridge Reference Campbell and Claridge2006, Bockheim et al. Reference Bockheim, Campbell and McLeod2007, Marinova et al. Reference Marinova, McKay, Pollard, Heldmann, Davila and Andersen2013), as well as dry permafrost overlying massive ice or ice-cemented sediments (Sugden et al. Reference Sugden, Marchant, Potter, Souchez, Denton and Swisher1995, McKay et al. Reference McKay, Mellon and Friedmann1998, Campbell & Claridge Reference Campbell and Claridge2006, Bockheim et al. Reference Bockheim, Campbell and McLeod2007, McKay Reference McKay2009, Marinova et al. Reference Marinova, McKay, Pollard, Heldmann, Davila and Andersen2013). Dry permafrost over ice-cemented ground has also been reported in an ice-free area in the Ellsworth Mountains (Schaefer et al. Reference Schaefer, Michel, Delpupo, Senra, Bremer and Bockheim2017, McKay et al. Reference McKay, Balaban, Abrahams and Lewis2019) - thousands of kilometres distant from the McMurdo Dry Valleys - as well as in other locations in the Transantarctic Mountains (Bibby et al. Reference Bibby, Putkonen, Morgan, Balco and Shuster2016, Bergelin et al. Reference Bergelin, Putkonen, Balco, Morgan, Corbett and Bierman2022, Putkonen & Mahmood Reference Putkonen and Mahmood2023; see the review of other Antarctic sites in Verret et al. Reference Verret, Lacelle, Dickinson and Fisher2024). Recent results show that there is dry permafrost and subsurface ice in the high Andes (Yoshikawa et al. Reference Yoshikawa, Casassa, Azócar, Iribarren Anacona, Masías and Miyata2025). Although on Earth dry permafrost over ice-cemented ground is found primarily in Antarctica, it is present from mid-latitudes to the polar regions on Mars (e.g. Mellon & Jakosky Reference Mellon and Jakosky1993, Mellon et al. Reference Mellon, Arvidson, Sizemore, Searls, Blaney and Cull2009, Reference Mellon, Sizemore, Heldmann, McKay and Stoker2024, Smith et al. Reference Smith, Tamppari, Arvidson, Bass, Blaney and Boynton2009, Mellon & Sizemore Reference Mellon and Sizemore2022).
It is useful here to briefly summarize the history of explanations for the presence of ice under dry permafrost. Initial observations of dry permafrost associated with subsurface ice - both massive ice and ice-cemented ground - led to the suggestion that the ice was continually sublimating and that the depth to the ice was a function of age (Ugolini Reference Ugolini1963, Tedrow & Ugolini Reference Tedrow, Ugolini and Tedrow1966, Campbell & Claridge Reference Campbell, Claridge, Suggate and Cresswell1975). Campbell & Claridge (Reference Campbell and Claridge1982) summarized this as follows: ‘Depth to frozen ground is a function of age.’ This continued for some time to be the accepted explanation for the varying depth to ice observed in the upper elevations of the McMurdo Dry Valleys (Campbell & Claridge Reference Campbell and Claridge1982, Reference Campbell and Claridge1987, Bockheim Reference Bockheim1995, Sugden et al. Reference Sugden, Marchant, Potter, Souchez, Denton and Swisher1995).
The age of subsurface ice in the upper McMurdo Dry Valleys came to widespread attention when Sugden et al. (Reference Sugden, Marchant, Potter, Souchez, Denton and Swisher1995) claimed that the massive ice layer below ~50 cm of sublimation till on the floor of Beacon Valley was 8 Myr old. This would make this the oldest ice on Earth, and this was, of course, of interest beyond the geology of this area. In particular, the evidence of viable microorganisms in the ice was of widespread interest (Gilichinsky et al. Reference Gilichinsky, Wilson, Friedmann, McKay, Sletten and Rivkina2007).
Simultaneously with the publication by Sugden et al. (Reference Sugden, Marchant, Potter, Souchez, Denton and Swisher1995), van der Wateren & Hindmarsh (Reference van der Wateren and Hindmarsh1995) noted that the calculations of ice loss by Sugden et al. (Reference Sugden, Marchant, Potter, Souchez, Denton and Swisher1995) assumed that the sublimation of the ice was determined by the geothermal gradient. In contrast, van der Wateren & Hindmarsh (Reference van der Wateren and Hindmarsh1995) pointed out that the ice at 50 cm depth would reflect seasonal atmospheric conditions, resulting in greater sublimation rates by three orders of magnitude. The arguments were somewhat theoretical as there were at that time no direct year-round measurements of the temperature in the dry permafrost or ice-cemented ground below it.
McKay et al. (Reference McKay, Mellon and Friedmann1998) provided the first year-round measurements of the temperature in the dry permafrost and ice-cemented permafrost below it and computed sublimation rates based on this temperature profile, assuming atmospheric conditions for the temperature and humidity of the surface boundary. Subsequently, Hindmarsh et al. (Reference Hindmarsh, van der Wateren and Verbers1998) presented a detailed theoretical model for the sublimation rate with the same upper boundary conditions. Both sets of results suggested that sublimation rates were much faster than inferred by Sugden et al. (Reference Sugden, Marchant, Potter, Souchez, Denton and Swisher1995) and that ‘some unconsidered physical process’ (Hindmarsh et al. Reference Hindmarsh, van der Wateren and Verbers1998) or ‘sporadic processes that recharge the ice’ (McKay et al. Reference McKay, Mellon and Friedmann1998) would be required to stabilize the ground ice at the depth observed.
The suggestion of such a process came with the observation of the depth of ice-cemented ground in University Valley - a hanging valley ~300 m above Beacon Valley. Along the several-kilometre length of this valley, the depth to ice-cemented ground varied linearly with distance down the valley (McKay Reference McKay2009, Marinova et al. Reference Marinova, McKay, Pollard, Heldmann, Davila and Andersen2013). At the head of the valley the depth to ice-cemented ground was zero and smoothly transitioned from a permanent snowpack. This observation suggested that the snow on the surface was the ultimate driver of the depth to ground ice, not age, and that atmospheric temperature and humidity were not the correct boundary conditions for calculating the loss of the ground ice. It was clear that snow altered the surface soil moisture content and that the surface soil conditions, and not the atmosphere, were the correct upper boundary conditions that determined the depth to ground ice. Along the ~1 km length of University Valley, the atmospheric conditions did not change, but the persistence of snow did, and this altered the soil surface moisture.
McKay (Reference McKay2009) presented a simple semi-analytical model for the effect of snow on the surface moisture content and hence on the depth to ground ice and showed that the varying depth to ground ice across University Valley was consistent with a snow recurrence of 0–10 years. Ignoring the effect of snow, or a snow recurrence interval of more than 10 years, would result in such a low surface moisture content that no ice-cemented ground would be stable at any depth. In the simple model of McKay (Reference McKay2009), the surface moisture was determined by setting the relative humidity to the average of two states: 100% when snow was present and the typical atmospheric relative humidity of 35% when snow was not present. The water vapour density of the surface depended on this relative humidity, which varied along the valley, and on the surface temperature, which was assumed not to vary along the valley. This was the first time that a model set the surface moisture density as the upper boundary condition rather than the atmospheric moisture density, and it provided a direct relationship between the surface water vapour density and atmospheric water vapour density.
The McKay (Reference McKay2009) study identified and confirmed that the unconsidered physical process required in the models of Hindmarsh et al. (Reference Hindmarsh, van der Wateren and Verbers1998) and McKay et al. (Reference McKay, Mellon and Friedmann1998) was snow and the enhancement of the moisture vapour density of the surface soil due to snow. In a related study, Hagedorn et al. (Reference Hagedorn, Sletten and Hallet2007) measured temperature and humidity in ice-cemented ground in Victoria Valley (elevation of 450 m), where the depth to ground ice was from 20 to 40 cm and average ground temperatures were −23°C. Summer air temperatures reached 10°C. These authors calculated that the ice at this location was evaporating over the period from 2002 to 2005 at a typical rate of 0.2 mm/year when using the atmosphere as the upper boundary condition on the diffusion equation, but that summer snow cover affected the rate of evaporation and even reversed it. They also reported frost formation on the surface in winter. Hindmarsh et al. (Reference Hindmarsh, van der Wateren and Verbers1998) had also postulated that snow might play a role in inhibiting the sublimation of subsurface ice.
Based on the analysis of oxygen and hydrogen isotopes of buried massive ice in upper University Valley, Lacelle et al. (Reference Lacelle, Davila, Pollard, Andersen, Heldmann, Marinova and McKay2011) concluded that sublimation rates calculated from atmospheric conditions were too high and attributed the observed difference ‘to potential ice recharge mechanisms or to missing parameters’.
The effect of enhanced surface moisture was confirmed with a sophisticated diffusion model by Fisher et al. (Reference Fisher, Lacelle, Pollard, Davila and McKay2016). These authors noted that the measured average relative humidity at the soil surface at the location of the meteorological station in University Valley was 85% compared to the atmospheric relative humidity of ~50%. And when the soil surface boundary condition was used, the depth to ground ice was correctly computed at that location. However, this study did not postulate a mechanism for setting the surface soil relative humidity or how it varied along the valley in a way that would explain the change in depth to ground ice down the valley.
Lapalme et al. (Reference Lapalme, Lacelle, Pollard, Fisher, Davila and McKay2017a) studied the isotopes of water from 12 cores throughout University Valley. These authors found evidence for three sources of ground ice: vapour deposited, liquid from snowmelt and buried glacier ice. They identified a perennially cryogenic zone on the floor of University Valley based on solar flux and surface temperatures inferred by Lacelle et al. (Reference Lacelle, Lapalme, Davila, Pollard, Marinova, Heldmann and McKay2016). All of their sites in the perennially cryogenic zone were vapour deposited, and this is the zone of interest here.
Williams et al. (Reference Williams, Heldmann, McKay and Mellon2018) developed a full numerical model of the coupled temperature and water vapour transport in the dry permafrost using the measurements of air temperature and humidity at the meteorological station in University Valley to drive the model. They considered two opposing mechanisms for ground-ice stability in University Valley: 1) diffusive recharge via thin seasonal snow deposits and 2) desiccation via salt deposits in the upper soil column. They found that salt alone was not effective at stabilizing the ground ice against evaporation to the dry atmosphere. Williams et al. (Reference Williams, Heldmann, McKay and Mellon2018) considered a range of possible snow amounts and periodicities that were, in general, consistent with the observations of snow at the site. They found that periodic thin surficial snow deposits (as observed in University Valley) could explain the depth to ground ice - consistent with the simpler modelling of McKay (Reference McKay2009). They also found that the average surface relative humidity of 85% as set by Fisher et al. (Reference Fisher, Lacelle, Pollard, Davila and McKay2016) could also be obtained. However, neither Williams et al. (Reference Williams, Heldmann, McKay and Mellon2018) nor Fisher et al. (Reference Fisher, Lacelle, Pollard, Davila and McKay2016) attempted to explain the change in depth to ground ice down the valley. In a general sense, the conclusion of McKay (Reference McKay2009) that the ultimate explanation for the change in depth to ground ice down the valley was due to a change in snow recurrence would seem to fit both of these modelling studies.
More recent field data have been published from a survey of dry permafrost in Ellsworth Land, Antarctica (Schaefer et al. Reference Schaefer, Michel, Delpupo, Senra, Bremer and Bockheim2017, McKay et al. Reference McKay, Balaban, Abrahams and Lewis2019). This site is located thousands of kilometres distant from the McMurdo Dry Valleys. McKay et al. (Reference McKay, Balaban, Abrahams and Lewis2019) measured both temperature and relative humidity in the air, at the soil surface and at the ice table at 49 cm depth at a site known as Elephant Head.
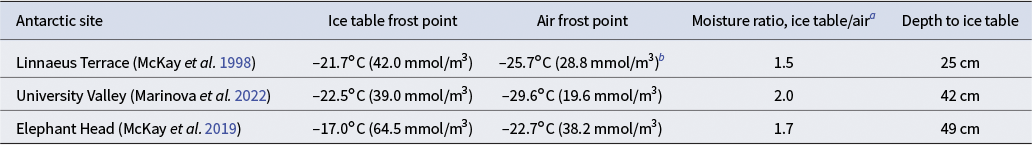
The values of the enhancement in surface soil moisture above atmospheric conditions at the Ellsworth Land and University Valley sites are similar, but the physical conditions at the two sites have important differences. In University Valley, the dimensionless enhancement factor of the water vapour density at the surface (compared to the air) is 1.98, and this can explain the observed ice table depth (Fisher et al. Reference Fisher, Lacelle, Pollard, Davila and McKay2016, Marinova et al. Reference Marinova, McKay, Heldmann, Goordial, Lacelle, Pollard and Davila2022). In the calculations of Fisher et al. (Reference Fisher, Lacelle, Pollard, Davila and McKay2016), the enhancement factor was due entirely to higher relative humidity within the soil (simply set to 85%) compared to the atmosphere (observed at ~50%). In Marinova et al. (Reference Marinova, McKay, Heldmann, Goordial, Lacelle, Pollard and Davila2022), the enhancement factor of the water vapour density at the surface (compared to the air) was determined from the measured temperature and relative humidity. At Elephant Head, a similar value was found for the enhancement factor of the water vapour density at the surface compared to the air (1.7), resulting in a similar stability of the ice table. However, as discussed by McKay et al. (Reference McKay, Balaban, Abrahams and Lewis2019), while at University Valley the enhancement in the surface moisture is primarily due to higher relative humidity in the soil, at Elephant Head it is primarily due to higher temperatures in the soil. The water vapour density depends on both temperature and relative humidity. The data from McKay et al. (Reference McKay, Mellon and Friedmann1998) from Linnaeus Terrace in the McMurdo Dry Valleys can be used to compute an enhancement factor of the water vapour density at the ice table compared to the air of 1.5 at that site. This, then, is the enhancement factor of the surface that would make the ground ice at this site stable. Unlike the other two sites, the relative humidities of the soil surface and subsurface at Linnaeus Terrace were not measured.
McKay et al. (Reference McKay, Mellon and Friedmann1998, Reference McKay, Balaban, Abrahams and Lewis2019) and Marinova et al. (Reference Marinova, McKay, Heldmann, Goordial, Lacelle, Pollard and Davila2022) reported the mean annual water vapour density at the ice table and in the air in terms of ‘frost point’, precisely defined as in McKay (Reference McKay2009). While there is heuristic value in the use of a frost point to express mean annual water vapour density, there are differing definitions of frost point even in application to ice-cemented ground in Antarctica. For example, Lacelle et al. (Reference Lacelle, Verret, Faucher, Fisher, Gaudreau and Pellerin2024) reported on studies of ground ice at a low-elevation Antarctic site, which has summer maximum air temperatures well above freezing, and these authors define ‘frost point’ in terms of vapour pressure rather than vapour density - this is incorrect, as only frost point defined in terms of vapour density is related to the vapour diffusion equilibrium. Hence, there is some confusion in the literature on how the frost point is averaged over the year. Thus, in summarizing the data from high-elevation sites in Table I, we translate the frost point values to water vapour number densities, and in the rest of this paper we do not use frost point. We use ‘ice table’ to refer to the boundary between the dry permafrost and the ice-cemented ground beneath it.
Reported moisture enhancement ratios between the ice table and atmosphere.

a This is the required enhancement of the surface water vapour density above the value for the air required to stabilize the depth to the ice table.
b Corrected from McKay et al. (Reference McKay, Mellon and Friedmann1998) for relative humidity over ice.
In this paper, we combine a detailed analysis of the field measurements from Elephant Head in the Ellsworth Mountains (McKay et al. Reference McKay, Balaban, Abrahams and Lewis2019) and three closely spaced sites in University Valley (Marinova et al. Reference Marinova, McKay, Heldmann, Goordial, Lacelle, Pollard and Davila2022). These are all sites at which the summer maximum air temperatures are below freezing. Our first goal is to reveal the mechanism linking the presence of surface snow/frost to the average water vapour density of the surface soil and how this explains the depth of the ice table. A second goal is to explain the systematic linear change in depth to ground ice across University Valley (McKay Reference McKay2009, Marinova et al. Reference Marinova, McKay, Pollard, Heldmann, Davila and Andersen2013).
Environmental data
In this paper, we use data from two sites: University Valley and Elephant Head (Fig. 1). At both sites, we use three datasets: 1) the air temperature and relative humidity measured ~1 m above the surface, 2) the surface soil temperature and relative humidity at a depth of ~1–3 cm and 3) the temperature at the ice table. At University Valley (77°51.729’S, 160°42.606’E, elevation 1677 m), we also use the temperature and relative humidity measurements within the dry permafrost at 20 cm depth and the temperature at the ice table at the Deep (77°51.946’S, 160°43.720’E, elevation 1697 m) and Shallow (77°51.584’S, 160°43.019’E, elevation 1684 m) sites in Marinova et al. (Reference Marinova, McKay, Heldmann, Goordial, Lacelle, Pollard and Davila2022). The Elephant Head (79°49.213’S, 83°18.860’W, elevation 718 m) data are posted as supplemental data in McKay et al. (Reference McKay, Balaban, Abrahams and Lewis2019). The University Valley data are from Marinova et al. (Reference Marinova, McKay, Heldmann, Goordial, Lacelle, Pollard and Davila2022) and are posted online at https://zenodo.org/records/10553881.
Location map of Elephant Head (E) and University Valley (U) and images of the meteorological stations. The University Valley picture of the meteorological station is on a summer snow day and the permanent snowpack at the head of the valley can be seen off to the right.

Our primary concern is the transport of water vapour to and from the ice table. For any subsurface ice to be stable over many years, the annual mean transport of water to and from the ice must be equal to zero. Marinova et al. (Reference Marinova, McKay, Heldmann, Goordial, Lacelle, Pollard and Davila2022) showed that this condition is satisfied for the University Valley meteorological station site. In particular, the gradient in water vapour density between the ice table and the surface of the soil sums to zero over the entire year. McKay et al. (Reference McKay, Balaban, Abrahams and Lewis2019) concluded based on summer data that this is also the case for the Elephant Head site.
Field observations show that the depth to the ice table in University Valley increases with distance from the large permanent snowpack at the head of the valley, with a slope of 32 cm/km along the valley floor (McKay Reference McKay2009, Marinova et al. Reference Marinova, McKay, Pollard, Heldmann, Davila and Andersen2013). Near the edge of the snowpack, the ice-cemented ground is at the surface. Approximately 1800 m down the valley from the snowpack, the ground ice reaches a maximum depth of ~60 cm, and beyond this distance no ground ice has been detected within the upper metre (Marinova et al. Reference Marinova, McKay, Pollard, Heldmann, Davila and Andersen2013). Marinova et al. (Reference Marinova, McKay, Pollard, Heldmann, Davila and Andersen2013) did find one site with ground ice at 98 cm, and this was not the farthest site down-valley. McKay (Reference McKay2009) suggested that this trend in depth to ground ice was due to changes in snow recurrence down the valley.
Results
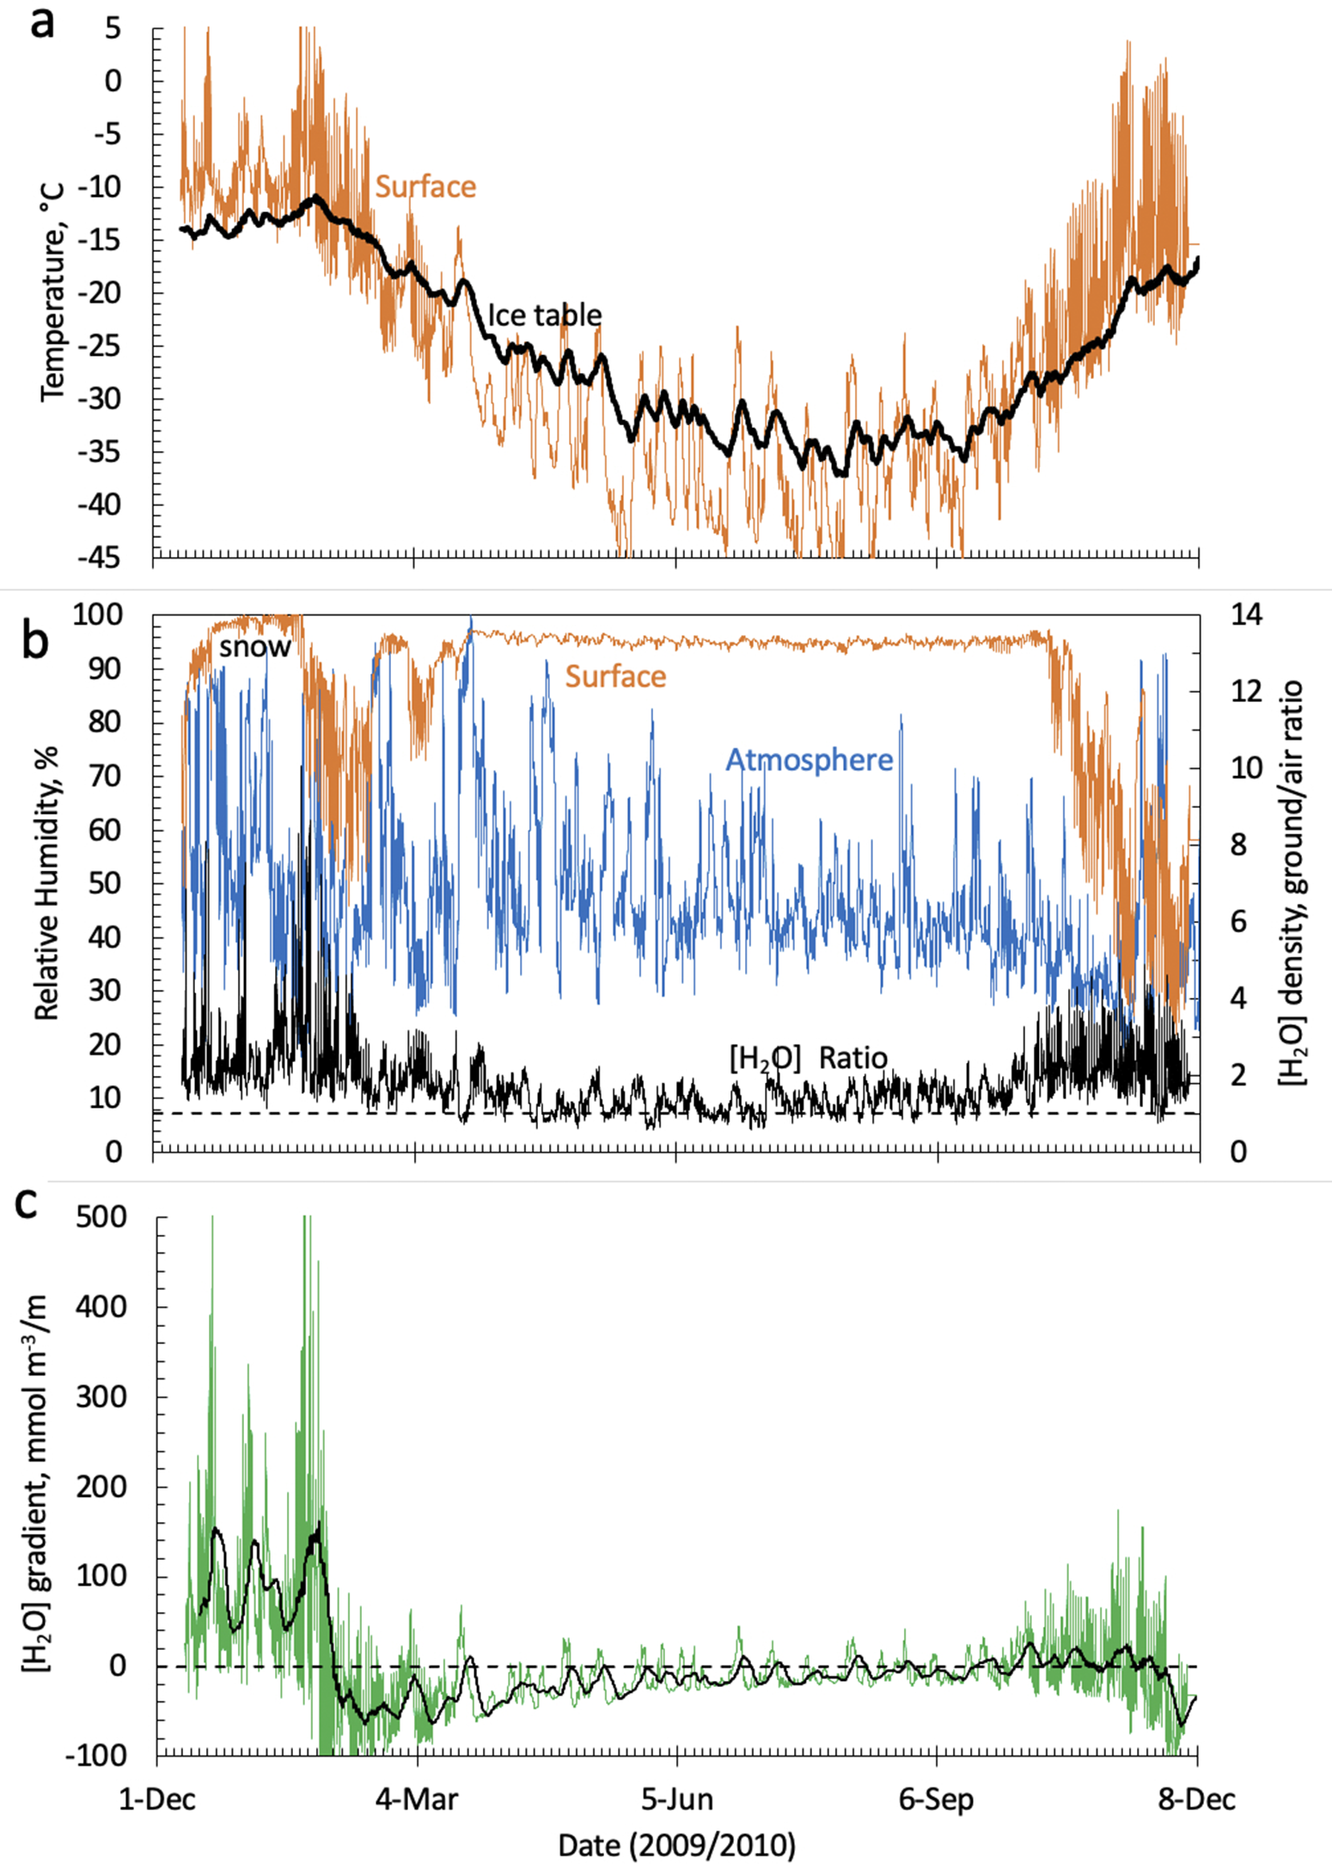
Here, we first show that, during summer snow events, water vapour is transported downwards to the ground ice. We do this by directly computing the vapour density gradient in the dry permafrost. A key point shown in the data is that, in the summer, the temperature of the ice-cemented permafrost is lower than the temperature of the ground surface (Figs 2a & 3a). This is due to the phase shift with depth of the annual thermal wave. When snow is present at the ground surface in summer, the relative humidity at the surface and the ice table are both close to 100% (Figs 2b & 3b). A heavy snow period beginning mid-December 2009 is indicated in Fig. 2b. But as the ice table is colder than the surface, the water vapour density at the ice is lower than at the surface, and water vapour diffuses downwards towards the ice table (Figs 2c & 3c). Second, we show that when the summer snow is gone, the water vapour in the dry permafrost layer still exceeds the water vapour density in the atmosphere. This causes water vapour to diffuse back into the atmosphere, contributing to the water vapour content of the near surface. This flow maintains the enhancement of the surface water vapour density over the atmospheric water vapour density for up to ~30 days after the end of a period of snow cover. The flux of water vapour towards the ice table is strictly a summer process driven by summer snow. The data show that there is persistent high humidity at the surface in the winter - the relative humidity essentially equals 100% from late March until early October (Fig. 2b). We refer to this condensation as a ‘frost’. Thus, the surface has the same relative humidity as the ice table (Fig. 2b), yet the water vapour gradient is such that, on average, water vapour is leaving the ice table (black line in Fig. 2c). This is understandable because, in the winter, the surface is colder than the atmosphere, and hence frost forms. But the ice-cemented permafrost is warmer than the surface. For example, the average surface temperature in July was −38.6°C, and the average temperature at the ice table was ~5°C warmer (Fig. 2a) - the phase shift of the annual thermal wave. The magnitude of the water vapour gradient is also reduced due to the cold winter temperatures (Fig. 2c), which allow for only a few warm and wetter summer days to recharge the moisture lost during an entire winter.
Temperature and relative humidity at University Valley. Panel a. shows the surface temperature and the temperature at the ice table. Panel b. shows the surface relative humidity and the atmosphere relative humidity. When snow or frost is present on the surface, the surface relative humidity equals 100% (b.). When thick snow is present, diurnal variation in the surface temperature is attenuated (a.). Panel b. (black curve) shows the ratio of the water vapour density at the surface compared to the air as computed from temperature and relative humidity measurements. The dashed line shows when this ratio has the value of unity. Panel c. shows the gradient in water vapour density from the surface to the ice table. Positive values indicate the transport of water vapour to the ice table. The black line is a 10 day running average. Tick marks represent 3 days.
As in Fig. 2 but for the summer months at Elephant Head, Ellsworth Mountains. Tick marks represent 3 days.
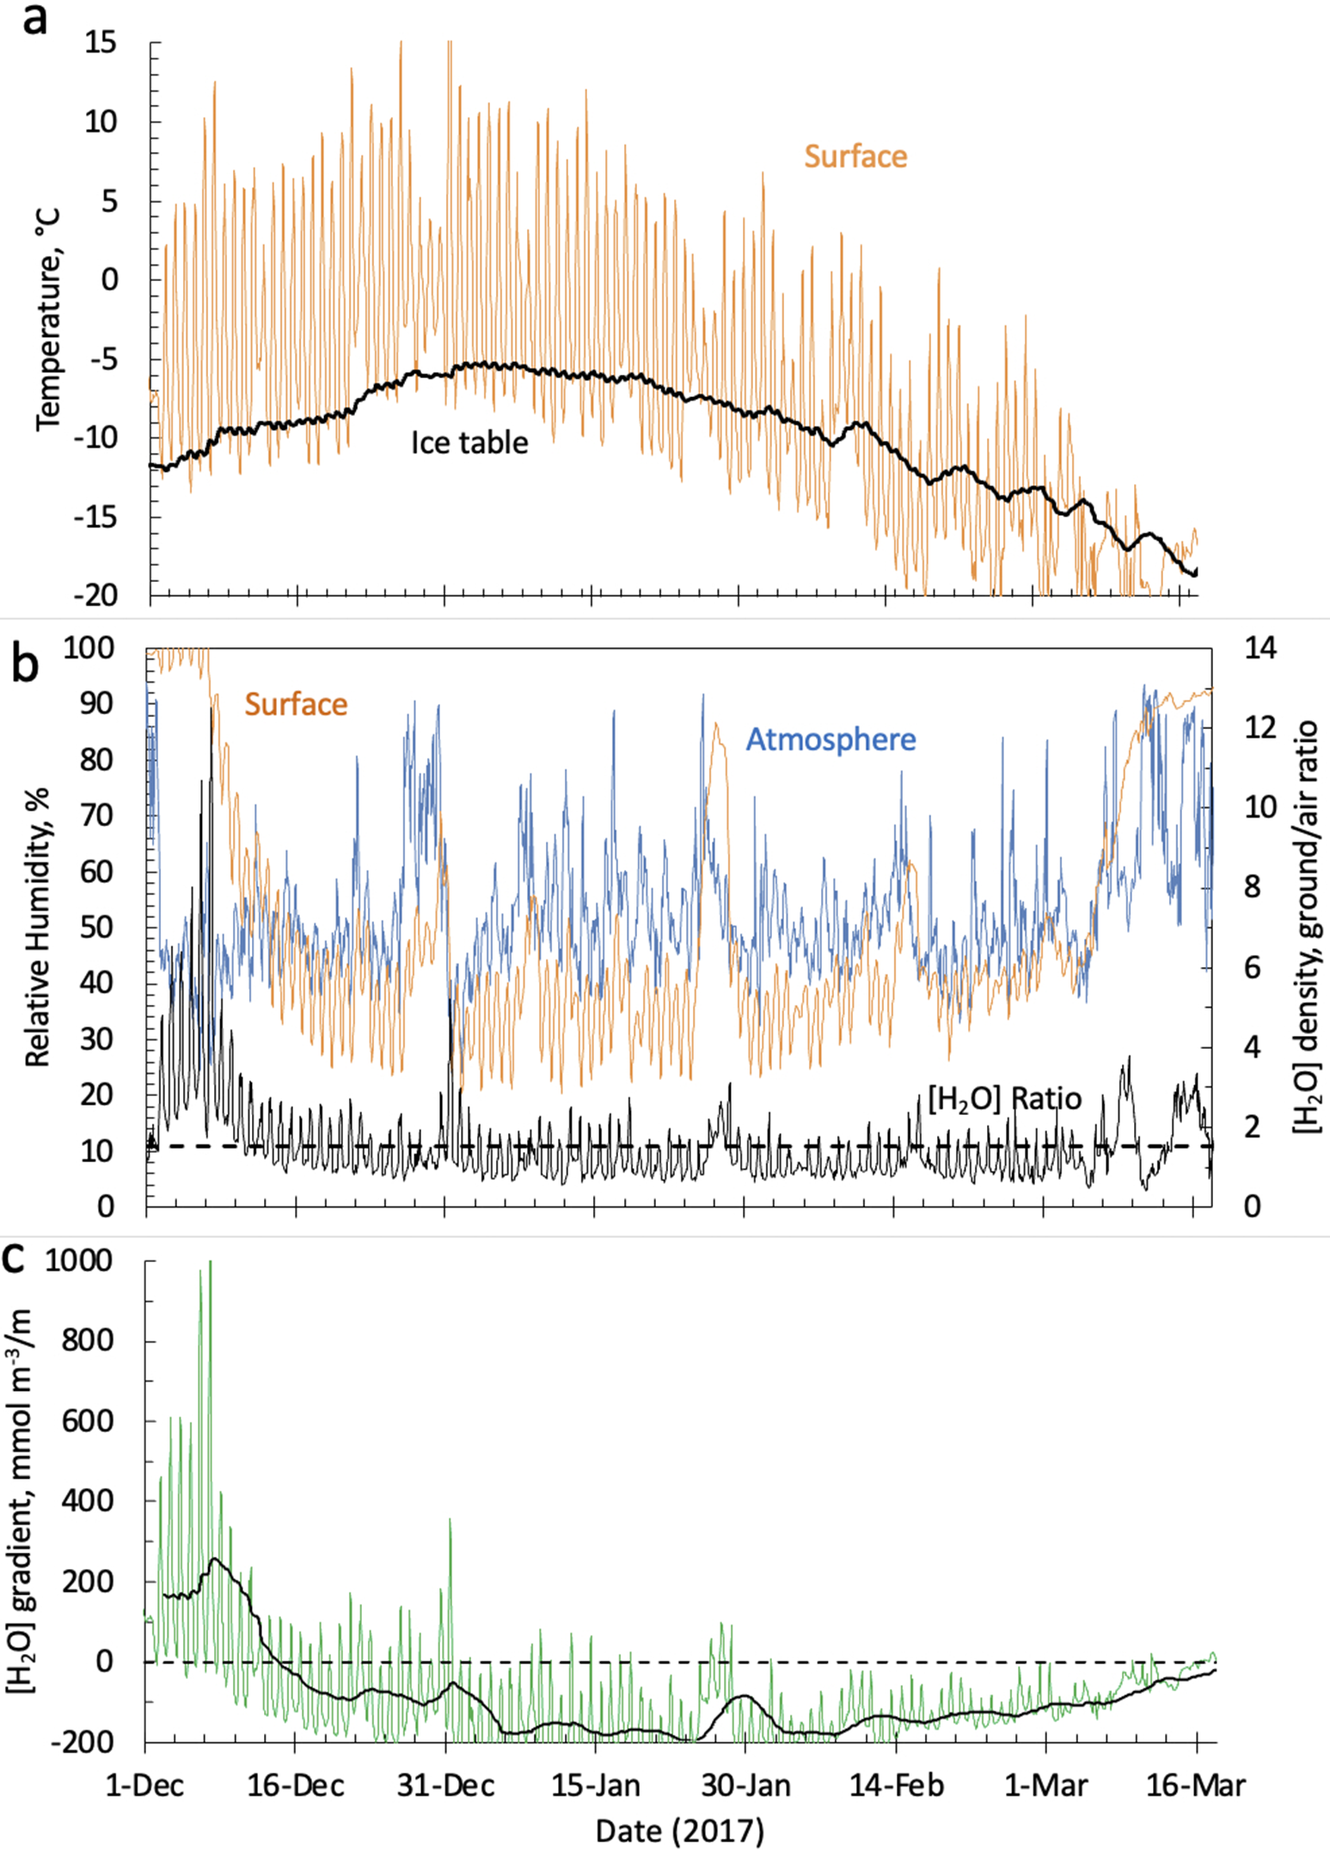
Summer temperatures at Elephant Head are warmer than at University Valley. The surface temperatures reach 15°C at Elephant Head (Fig. 3a) and 5°C at University Valley (Fig. 2a), but there is a similar temperature difference between the surface and the ice table in summer. The temperature gradient between the surface and the ice table is similar in both cases, but the water vapour density gradient at Elephant Head is about twice as large as the water vapour density gradient at University Valley due to the exponential dependence of saturated water vapour density with temperature (compare Figs 2c & 3c).
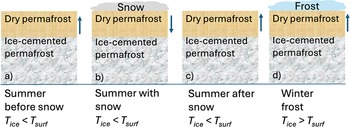
The different aspects of the transport of water vapour to and from the ice table in summer with or without snow on the surface and the winter frost covering can be diagrammed in terms of the surface, the dry permafrost and the ice table (Fig. 4).
Schematic diagram of the transport of water vapour to and from the ice table in summer before, during and after snow days (a.–c.) and in winter (d.) during which there is a persistent frost cover on the surface. The comparison between the ice table and surface temperatures is indicated. The dominant flux of water vapour is shown by an arrow on the side.
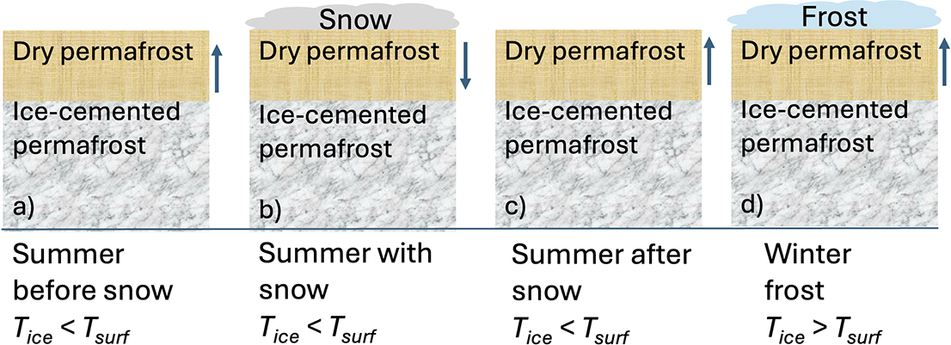
Figure 5 shows the relationship of water vapour density and temperature between the surface, the ice table (42 cm) and a point approximately midway between them (20 cm depth). Two time periods are shown in detail: April (early winter), when the gradient of water vapour drives water from the ice table up towards the surface, and December (mid-summer), when the gradient of water vapour drives water to the ice table from the surface. In both cases, the water vapour density at 20 cm is between the surface and ice table values, and the lag between changes in the surface values and changes at 20 cm is ~3 days. As seen in Fig. 5 for 21 December (also 27 January in Fig. 2 and 7 December in Fig. 3) after 1 day with high surface water vapour density, the water vapour density at 20 cm depth can very briefly exceed the value at the surface.
Water vapour density and temperature in the dry permafrost at University Valley, shown at the surface, at 20 cm depth and at the ice table (42 cm), illustrating conditions under which the gradients result in an upwards flux into the atmosphere (panels a. and c. in April) and when they result in a downwards flux to the ice-cemented ground (panels b. and d. in December). Tick marks represent 3 days.

Based on our analysis and the detailed dataset from the meteorological station site (located approximately halfway down the valley), we can quantitatively explain the slope in the ice table in terms of the number of summer days with snow present on the surface.
Summer snow and winter frost
Surface frost forms in the winter months because the surface cools to below the frost (condensation) point of the near-surface atmospheric water vapour. The frost condenses directly onto the soil surface, drawing water out of the vapour phase. The result is that the surface vapour density boundary is held in equilibrium with the atmosphere above it. Thus, it would be expected that the surface water vapour density during the winter frost would be identical to that of the atmosphere, leading to no surface enhancement.
In contrast to the winter frost, the summer surface snow represents a mechanical precipitation of water ice from the atmosphere onto the surface and is not closely coupled to the soil surface temperature. Often, snow is advected by the air motion from distant sources. Summer snow in the McMurdo Dry Valley is typically moisture derived from McMurdo Sound and carried inland by summer winds (Fountain et al. Reference Fountain, Nylen, Monaghan, Basagic and Bromwich2010). As the snow warms to the surface temperature (given the soil heat capacity), the surface water vapour density increases markedly (Figs 2b & 3b). In general, the atmosphere is somewhat drier than the snow-covered surface (Figs 2b & 3b) and the snow will gradually sublimate, diffusing back to the atmosphere but also diffusing downwards into the subsurface (Fig. 3a,b). The net effect is an increase in the water vapour density of the surface compared to the atmosphere.
These differing effects of the winter frost and the summer snow can be seen in Fig. 2. Periods of summer snow can be identified in Fig. 2b when the surface relative humidity is ~100% and air relative humidity is high. During summer snows, the gradient of water vapour density is decidedly from the surface to the ice table. Winter frosts are indicated based on the surface relative humidity being ~100% and the air relative humidity being lower. During the winter frost, the vapour density of the atmosphere and the surface closely overlap (black curve in Fig. 2b).
At the University Valley meteorological station (Fig. 2), the surface water vapour density averaged over the entire year is 39.5 mmol/m3, the value for the ice table is 39.0 mmol/m3 (Table I) and the value for the atmosphere is 19.6 mmol/m3 (Table I). Again, this indicates that the ice table is in equilibrium with the average surface density of the surface, not the atmosphere. Both the ice table and the surface have average moisture density values that are approximately two times the value for the atmosphere.
As discussed earlier, it can be seen in Fig. 2 that the winter frost produces no enhancement of the surface compared to the atmosphere. As specific examples, we consider the mid-winter month of July: the mean water vapour density of the surface is 8.5 mmol/m3, and for the atmosphere it is 6.3 mmol/m3. This difference of 2 mmol/m3 is comparable to the uncertainty in the density computation of ± 2 mmol/m3 associated with the temperature uncertainty of ± 0.5°C and the relative humidity uncertainty of ± 3%. In contrast, during the mid-summer snowy month of January, the mean surface moisture density is larger than the mean atmospheric water vapour density by 82 mmol/m3.
Discussion
The analysis of McKay (Reference McKay2009) and the comparisons presented here for the depth to ground ice in University Valley assume that the only important variation between sites is the recurrence of snow cover - elevation and sunlight are not important variables. The four stations in University Valley considered here are within the 1650–1700 m contour (Marinova et al. Reference Marinova, McKay, Heldmann, Goordial, Lacelle, Pollard and Davila2022) and have similar values of mean solar insolation (Lacelle et al. Reference Lacelle, Lapalme, Davila, Pollard, Marinova, Heldmann and McKay2016). The subsurface humidity measurements at all sites show no indication of liquid water transport in the dry permafrost, with transport only being due to vapour diffusion. This is consistent with all four sites being within the permanently cryotic zone in University Valley, as previously defined (Lacelle et al. Reference Lacelle, Lapalme, Davila, Pollard, Marinova, Heldmann and McKay2016, Lapalme et al. Reference Lapalme, Lacelle, Pollard, Fisher, Davila and McKay2017a).
Extrapolating up and down University Valley
As discussed earlier, there is a positive flux of water vapour from the surface to the ice table only during summer days with snow on the surface. During the rest of the year, and in particular in the winter, there is mostly a flux of water vapour from the ice table to the surface, resulting in a loss of ice. When the annual total flux sums to zero, the ice table is stable, as has been shown to be the case at the meteorological station site (Marinova et al. Reference Marinova, McKay, Heldmann, Goordial, Lacelle, Pollard and Davila2022). This equilibrium sets the equilibrium depth of the ground ice. For example, if the ice table were to be artificially set to be deeper, then the annual integrated flux between the artificial ice table and the surface would not be zero but instead slightly negative, driving a net flux into the subsurface, an accumulation of ice and a shallowing of the ice table back towards equilibrium.
Next, we examine the correlation between the number of summer snow days and the depth of the ice table. We begin with the observation of the number of snow events in summer at the meteorological station site. To alter the snow effect - simulating moving from the meteorological station site up-valley, towards the snowpack, or down-valley, away from the snowpack - we change the number of snow events. We define a snow event on the surface as any time when the relative humidity (as measured every 30 min) of the surface with respect to ice is 98% or above. A snow day consists of 48 snow events that are typically, but not necessarily, continuous - it might snow in the morning and be clear in the afternoon, for example. We define the summer period as the 120 days from November through February following Obryk et al. (Reference Obryk, Doran, Fountain, Myers and McKay2020). At the meteorological station, the snow events in the summer total to ~24 days in the winter of 2009/2010 (Fig. 6). To simulate increased snow, we add additional snow events to the summer dataset. To simulate decreased snow, we remove snow events. In both cases, we renormalize the distribution to maintain the length of summer at 120 days. Figure 6 shows the distribution of surface relative humidity for the meteorological station (24 snow days) and for cases with snow events that would total 14 and 40 snow days. We make no changes to the rest of the year - the non-summer days. We also constructed a snow-covered site in which we used the surface temperature measurements from the weather station site and, without altering the temperature, set the relative humidity to 100%. This approximates a site with a thin but persistent layer of snow. Field observations near the edge of the perennial snowpack show that sites such as this have ice-cemented ground at the surface.
Normalized cumulative relative humidity (RH) distribution for all measurements (each 30 min) in the 120 days from November 2009 through February 2010 for University Valley summer RH sequences. Individual RH measurements (120 × 48) are listed in descending order and normalized to 1. The solid black line represents the data from the meteorological station with 24 snow days. The dashed lines correspond to removing (red line) or adding (green line) snow events to the summer and then re-normalizing to a total of 120 days, giving 14 and 40 snow days, respectively. The blue line represents 98% RH, which is the demarcation of a snow event.

The change in the number of summer snow days changes the mean annual water vapour density of the surface. This, in turn, changes the depth at which ground ice will be stable and thus the depth of the ice table. We estimate the depth to the ice table (Fig. 7) using the method illustrated in Fig. 1 of McKay (Reference McKay2009). This method approximates the amplitude of the temperature variation with depth via a sinusoidal temperature variation with time and then estimates the depth to the ice table by scaling from the measured depth of 42 cm to the ice table at the meteorological station (Marinova et al. Reference Marinova, McKay, Heldmann, Goordial, Lacelle, Pollard and Davila2022).
Water vapour number density of the surface required for stability of the upper layer of ice-cemented ground as a function of depth, expressed as the number of damping depths. The water vapour density of the soil surface determined from measurements at the meteorological station is shown by a dashed line. Calculated values with fewer summer snow days (14) and more summer snow days (40) are shown. Below a surface water vapour density of 35.8 mmol/m3 (blue line) ice-cemented ground is not stable at any depth. The shape of the curve reflects the exponential decrease of the amplitude of the seasonal temperature variation with depth.

This approach relies on two main approximations: 1) the use of a soil surface relative humidity value of 98% to define snow events and 2) the use of an exponential damping expression to calculate the depth to ground ice. Despite these approximations, the results remain meaningful and effectively illustrate how snow days impact the depth of the ice table.
Additionally, we assume that 1 year of data from University Valley and 1 year of data from Elephant Head are representative of long-term conditions at these sites. In the case of University Valley, this single year was selected to ensure a complete dataset with all data stations operational, as detailed by Marinova et al. (Reference Marinova, McKay, Heldmann, Goordial, Lacelle, Pollard and Davila2022). Figure 3 in Marinova et al. (Reference Marinova, McKay, Heldmann, Goordial, Lacelle, Pollard and Davila2022) indicates that the selected year is typical of the approximately 3 years of data available. Nevertheless, a long-term monitoring effort focused specifically on the ice table would be valuable. We note that analysis of the polygon sizes (Mellon et al. Reference Mellon, McKay and Heldmann2014) indicates that the ice table has varied little over ~10 kyr timescales.
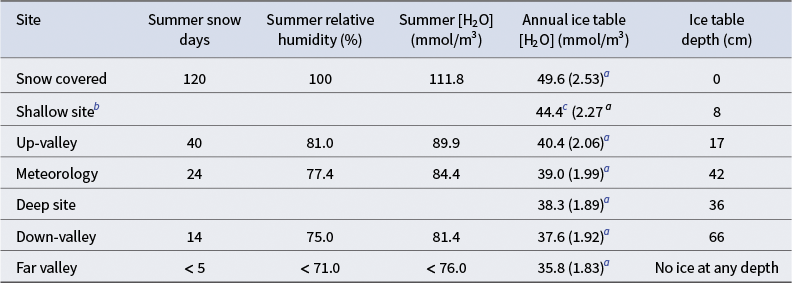
For the deep and shallow sites at University Valley we have temperature data at the ice table, and by setting the relative humidity to 100% we can compute the annual mean water vapour density. These results are included in Table II, which shows how the number of snow days alters the mean summer relative humidity and the depth to ground ice for all of the measured and simulated sites in University Valley.
Measured or inferred ice table depths in University Valley, December 2009–December 2010.

a Ratio to the mean [H2O] of the atmosphere, 19.6 mmol/m3 (Table I).
b Depth of ice table and temperature of ice table measured directly (Marinova et al. Reference Marinova, McKay, Heldmann, Goordial, Lacelle, Pollard and Davila2022).
c Based on temperatures measured hourly over the year starting 1 January 2011.
It is interesting to note that the surface moisture enhancement under a persistent thin snow cover of 2.53, computed by setting the relative humidity at the surface to 100% with no other changes then dividing the computed surface water vapour density by the atmospheric value of 19.6 mmol/m3, is not much different from the simple approximation of dividing 100% by the mean air humidity of 45.4% (table 2 in Marinova et al. Reference Marinova, McKay, Heldmann, Goordial, Lacelle, Pollard and Davila2022), which equals 2.20.
Interannual variability
The data presented in Figs 2 & 3 are based on 1 year of measurements. To assess whether these are representative of longer-term conditions, we can determine the interannual variability as recorded by stations at high elevation in long-term networks. Currently, two long-term networks operate in the Dry Valleys: the Long Term Ecological Research (LTER) network, which primarily monitors lakes at lower elevations (Doran et al. Reference Doran, McKay, Clow, Dana, Fountain, Nylen and Lyons2002), and the soil climate network maintained by Antarctica New Zealand in collaboration with Landcare Research, the University of Waikato and the US Department of Agriculture (USDA; Seybold et al. Reference Seybold, Harms, Balks, Aislabie, Paetzold, Kimble and Sletten2009, Reference Seybold, Balks and Harms2010). Two of the LTER stations, Friis Hills and Mount Fleming, are at high elevations and record zero or negligible air temperatures above freezing (Obryk et al. Reference Obryk, Doran, Fountain, Myers and McKay2020). The relevant data at these stations are the air temperature and relative humidity (Doran & Fountain Reference Doran and Fountain2023a,Reference Doran and Fountainb). From these we can compute the atmospheric water vapour density. There is one station in the Antarctic New Zealand network also on Mount Fleming. The data at this site are described by Seybold et al. (Reference Seybold, Harms, Balks, Aislabie, Paetzold, Kimble and Sletten2009, Reference Seybold, Balks and Harms2010). The depth of the active layer at this site is 6 cm, and the depth to ice-cemented ground is 45 cm (Adlam et al. Reference Adlam, Balks, Seybold and Campbell2010, Seybold et al. Reference Seybold, Balks and Harms2010, Carshalton et al. Reference Carshalton, Balks, O’Neill, Bryan and Seybold2022). This station is of particular interest here because, in addition to atmospheric temperature and relative humidity, this station records temperature at the ice table. This allows us to compute the water vapour density at the ice table (by assuming relative humidity equals 100%), and from that we can determine the ratio of surface moisture enhancement needed to stabilize the ground ice at this location.
At the LTER Friis Hills station (latitude: −77.7474°; longitude: 161.5162°; elevation: 1591 m above sea level), the usable data span from December 2010 to December 2022. Over this period, the year-long average water vapour number density in the atmosphere was 29.5 mmol/m3, the minimum annual average was 22.7 mmol/m3 and the maximum annual average was 32.6 mmol/m3, representing a range of ± 15%. The average temperature was −22.4°C, the maximum temperature was −2.8°C and the minimum temperature was −39.8°C. The average air relative humidity was 61%. The depth to the ice table for Friis Hills is reported as 30–35 cm by Verret et al. (Reference Verret, Dickinson, Lacelle, Fisher, Norton and Chorley2021). This ice table depth is approximately equal to that at the Deep site in Table II. As the mean air temperature at Friis Hills is only 1°C warmer than at University Valley (−23.4°C; Marinova et al. Reference Marinova, McKay, Heldmann, Goordial, Lacelle, Pollard and Davila2022), we could assume that the annual average water vapour density at the ice table there is the same as at the Deep site, at 38.3 mmol/m3 (Table II). This would imply that the enhancement of the surface water vapour over the atmospheric water vapour due to summer snow is only 1.3 (= 38.3/29.5) - considerably fewer summer snow days than at any site in Tables I–III.
Annual values for temperature, relative humidity (RH) and water vapour concentration computed from temperature and RH at the Antarctica New Zealand/United States Department of Agriculture station on Mount Fleming.
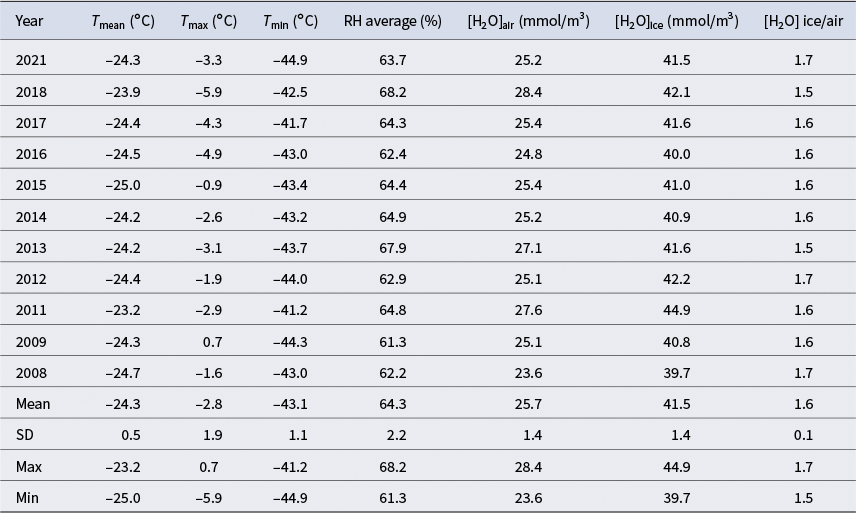
Note: Only years with complete data have been used. The RH data have been corrected to be referenced to ice (as described previously; e.g. Hagedorn et al. Reference Hagedorn, Sletten and Hallet2007, McKay et al. Reference McKay, Balaban, Abrahams and Lewis2019). The temperature data have not been corrected for temperatures less than −40°C as required for the sensor used (Viasala HMP45C) because the wintertime minimum temperature is only slightly below −40°C. In this table, we follow Hagedorn et al. (Reference Hagedorn, Sletten and Hallet2007) and report the minimum internal temperature of the Campbell logger.
Max = maximum; Min = minimum; SD = standard deviation.
At the LTER Mount Fleming station (latitude: −77.5327°; longitude: 160.2714°; elevation: 1870 m above sea level), the usable data span from December 2010 to December 2022. Over this period, the year-long average water vapour number density in the atmosphere was 26.2 mmol/m3, the minimum annual average was 24.4 mmol/m3 and the maximum annual average was 28.0 mmol/m3, representing a range of ± 14%.
The Antarctica New Zealand/USDA Mount Fleming station (latitude: −77.5453°; longitude: 160.2903°; elevation: 1700 m above sea level) is 1.5 km south of and 182 m lower compared to the LTER station. The usable data spanning from 2008 to 2021 are available at https://www.nrcs.usda.gov/resources/data-and-reports/soil-climate-research-stations (accessed 8 December 2024). For the 11 years considered, the average water vapour number density in the atmosphere was 25.7 mmol/m3 (Table III). Because ice table temperatures are recorded, it is possible to calculate the ratio of the surface moisture density to air moisture density required to stabilize the ice table. The results from these 11 years (Table III) give a value for this ratio at 1.6 ± 0.1. The standard deviation is 6%, and the total range is 12.5%.
These multi-year datasets (Friis Hills and Mount Fleming) suggest that the year-to-year standard deviations in the annual mean water vapour densities of air and the ice table in the upper elevations of the Dry Valleys are less than ± 10%. Although Elephant Head, situated in the Ellsworth Mountains, is not part of the McMurdo Dry Valleys, its high-elevation and polar desert setting shares similar environmental characteristics. Although long-term monitoring at University Valley is not available, these findings suggest that its variability is probably comparable, supporting the assumption that the single-year dataset we focused on in this paper is broadly representative of long-term conditions.
Source of summer snow
Our analysis offers a self-consistent explanation of how the gradient in depth of the ice table at University Valley could be due to the recurrence of snow, as originally suggested by McKay (Reference McKay2009). However, it does not explain why there would be a gradient in the persistence of summer snow cover down the valley floor. The large permanent snowpack at the head of the valley might provide a clue. Because of the elevation and location of University Valley, the Polar Plateau is just a few kilometres to the south, and snow from the plateau could be carried in the direction of the valley by winds, as has been suggested for nitrates (Witherow et al. Reference Witherow, Lyons, Bertler, Welch, Mayewski and Sneed2006). Alternatively, snow could be carried up the valley by coastal winds that are then stalled by the cliff at the head of the valley, which rises to 2000 m from the valley floor at 1700 m. Either process could result in higher snow levels towards the head of University Valley, consistent with the large permanent snowpack. Finally, katabatic winds blowing down from the Polar Plateau might play a role by preferentially clearing snow away from the valley. Because the snow cover of interest here is in the summer and the katabatic winds are more common in the winter, it is probable that the coastal winds are the source of the summer snow. The data indicate that this is the case. For example, the extensive snow interval shown in Fig. 1 extending from ca. 20 December 2009 to 20 January 2010 provides details of such summer snow. During this time, the wind speed was moderate (averaging ~2 m/s with a maximum of 10 m/s). The direction of the wind was predominantly towards 160° (south-east/south-south-east), directly up the axis of University Valley. This coastal origin of the summer snow cover is consistent with other observations throughout the Dry Valleys (Fountain et al. Reference Fountain, Nylen, Monaghan, Basagic and Bromwich2010) and the radiatively forced up-valley warming that drives the flow of air from the coast up into the valleys (Obryk et al. Reference Obryk, Doran, Fountain, Myers and McKay2020).
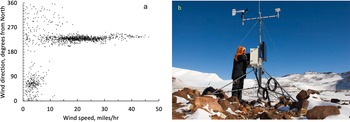
Mount Fleming may be an important site for comparison to University Valley. The depth to ground ice at the Antarctica New Zealand/USDA station (45 cm) is very comparable to the depth to ground ice at the University Valley meteorological station (42 cm). However, the wind pattern and snow source are quite different. As discussed earlier, the summer snow at University Valley derives from up-valley winds. However, it is clear that the prevailing strong winds in the late summer (January and February) at Mount Fleming are from the Polar Plateau (Fig. 8a). McKay (Reference McKay2015) also concluded - based on summer temperature and light data - that Mount Fleming was beyond the reach of the up-valley winds. Summer snow sourced from the Polar Plateau and blown by high-speed winds is likely to be relatively uniform on the surface (Fig. 8b). Based on this, we might expect the depth to ground ice across the summit area of Mount Fleming to be relatively uniform.
a. Late summer (January–February 2010) wind direction and speed at Mount Fleming from the Antarctica New Zealand/United States Department of Agriculture station. b. The view of the station with snow on the surface in 2010; photograph by Rod Strachan, reproduced under Creative Commons Licensing from Antarctica New Zealand Pictorial Collection K123 09/10, https://adam.antarcticanz.govt.nz/nodes/view/29328.

In contrast to the summer snow, the winter frost at University Valley can be explained simply as surface ice condensation directly from the atmosphere due to the temperature difference between the surface and the atmosphere and the relative humidity of the atmosphere during the cold winter. As shown earlier, the data show that this frost does not result in a surface moisture enhancement compared to the atmosphere.
As expected, and as the measurements show, when snow is deposited on the surface in summer it increases the relative humidity to 100% on the soil surface. As discussed earlier, this surface water vapour density is much higher than the water vapour density at the ice table, which, despite also having a relative humidity value of ~100%, is much colder. In general, diffusive mass transport of water vapour occurs as molecules move from areas of higher vapour density to areas of lower vapour density. Thus, water vapour diffuses downwards from the surface into the subsurface in response to this gradient in water vapour density. It is important to note that the diffusive transport of water vapour responds to gradients in water vapour density, not gradients in relative humidity. Relative humidity alone is not a directly useful parameter in these analyses. There is no relative humidity gradient in the dry permafrost layer under the summer snow.
Once the snow has sublimated or been blown away, the flow reverses, and the water vapour in the surface layers of the soil diffuses back into the atmosphere, which is dry by comparison. As a result, the surface water vapour density exceeds the atmospheric value not just while the snow is present, but also for some time after the snow is gone, as the excess water vapour in the soil layers diffuses back to the atmosphere and also downwards to the ice table (diagrammed in Fig. 4).
The accumulation of water vapour in the dry permafrost layer - and its rebound back after the snow is gone - is absent in winter because then the temperature of the subsurface ice-cemented ground is much warmer than the surface. During the frost in winter, as with the snow days in summer, the relative humidity is 100% both at the surface and at the ice table. Again, there is no relative humidity gradient in the dry permafrost layer, but the winter gradient in water vapour density is reversed compared to summer. Due to the lower temperatures, the magnitude of the water vapour gradient is much smaller, however, allowing only a few days of summer snow to reverse the sublimation loss from a much longer winter period. The mechanisms we have identified that control the flux of water to and from the ice table involve a layer of dry permafrost to absorb water vapour and, crucially, a temperature profile set by the attenuation and phase shift of the annual temperature cycle. The ice table is too deep to be affected by the diurnal cycle (Marinova et al. Reference Marinova, McKay, Heldmann, Goordial, Lacelle, Pollard and Davila2022). Thus, the details of the mechanism we have investigated are likely to depend on the latitude of a site, among other factors. These studies originated in the Dry Valleys, but it is not surprising that the Elephant Head site, which is at approximately the same latitude, although quite distant from the Dry Valleys, would show the same physical processes - albeit with some interesting differences in the details of the temperature and humidity properties. Our analysis based on temperature and moisture measurements is broadly consistent with the analysis based on oxygen and hydrogen isotopes in the ice (Lacelle et al. Reference Lacelle, Davila, Pollard, Andersen, Heldmann, Marinova and McKay2011, Lapalme et al. Reference Lapalme, Lacelle, Pollard, Fisher, Davila and McKay2017a) and cryostratigraphy (Lapalme et al. Reference Lapalme, Lacelle, Pollard, Fortier, Davila and McKay2017b).
Mars
It is interesting to consider whether the processes examined here have relevance to the depth to ice-cemented ground on the planet Mars. On Mars, there is abundant observational evidence that ice-cemented ground is present below dry permafrost down to 45° latitude (Diez et al. Reference Diez, Feldman, Maurice, Gasnault, Prettyman and Mellon2008, Byrne et al. Reference Byrne, Dundas, Kennedy, Mellon, McEwen and Cull2009, Mellon et al. Reference Mellon, Arvidson, Sizemore, Searls, Blaney and Cull2009, Dundas et al. Reference Dundas, Byrne, McEwen, Mellon, Kennedy, Daubar and Saper2014, Reference Dundas, Mellon, Conway, Daubar, Williams and Ojha2021). This contrasts with Earth. At these mid-latitudes on Mars, there would still be an annual cycle, but compared to the Antarctic sites the diurnal cycle would be more pronounced. How this would alter the temperature difference between the ice table and surface on summer snow days cannot be directly determined from the Antarctic data. More importantly, although there is evidence for frost on the Martian surface (Svitek & Murray Reference Svitek and Murray1990, Smith et al. Reference Smith, Tamppari, Arvidson, Bass, Blaney and Boynton2009), there is no evidence for snow. Although Whiteway et al. (Reference Whiteway, Komguem, Dickinson, Cook, Illnicki and Seabrook2009) observed fall streaks beneath nighttime clouds in early autumn at the Mars Phoenix landing site, suggesting that precipitating ice crystals do occur, no observational evidence showed that these crystals reached the surface before sublimating in the lower atmosphere. As discussed earlier, in University Valley we see that frost does not enhance the surface moisture density over the near-surface atmospheric value.
Conclusions
We have analysed the seasonal variation in water vapour density in the atmosphere, at the soil surface and at the ice table at University Valley and Elephant Head - two sites in Antarctica that have ice-cemented permafrost underlying a layer of dry permafrost. From these data and a simple model for the depth to ground ice in cold, dry environments, we draw the following conclusions.
-
1) Subsurface ice is stable when the mean annual water vapour density at the ice table is equal to the mean annual water vapour density at the upper boundary of the soil column (the soil surface). Summer snow increases the mean annual water vapour density of the soil surface compared to the atmosphere by a factor of up to ~2. This surface moisture enhancement results in ice-cemented permafrost being present when the atmospheric water content is too low for ground ice to be stable.
-
2) Surface frost such as that observed throughout the winter raises the surface relative humidity to 100% but does not enhance the surface moisture density over the atmospheric value.
-
3) Variations in the persistence of the summer snow cover at University Valley provide a plausible explanation for the observed gradient in the depth to the ice table in this valley.
-
4) The processes involved in setting the ice table depth at University Valley also control the ice table depth at Elephant Head in the Ellsworth Mountains.
-
5) Many of the processes that explain the depth to ground ice in these Antarctic sites are specific to their dry conditions and the long polar seasons and are not easily extrapolated to sites not within the polar circles or to sites with much higher or much lower levels of moisture.
Acknowledgements
The University Valley data used in this work were collected as part of the United States Antarctic Program Project B-302. We thank the United States Antarctic Program staff and helicopter crews for their extensive support. We thank the internal NASA and US Geological Survey reviewers and journal reviewers for their constructive reviews. We thank Megan Balks for useful discussions regarding the Antarctica New Zealand/USDA datasets.
Author contributions
CPM proposed the investigation and created the first draft of the paper. All authors contributed to analysis of the data and the writing of the final paper.
Financial support
The research in this paper was supported by a NASA Habitable Worlds programme grant to CPM. Fieldwork and research were supported by the NASA Astrobiology Science and Technology for Exploring Planets (ASTEP) programme, in collaboration with the National Science Foundation (NSF) Office of Polar Programs and the United States Antarctic Program.
Competing interests
The authors declare none.


 Open access