

1. INTRODUCTION
Glaciers are not only an important freshwater resource (Immerzeel and others, Reference Immerzeel, van Beek and Bierkens2010), but are also responsible for hazards such as glacier collapse, surges, lake outburst floods and landslides. In recent years, the glacier hazards have increased according to reports from Pamir (Shangguan and others, Reference Shangguan2016), Himalaya (Bolch and others, Reference Bolch, Buchroithner, Peters, Baessler and Bajracharya2008), Russia (Huggel and others, Reference Huss2005), etc. and caused extreme loss to human beings. Two glaciers, located in western Tibet near the Aru Co lake, collapsed on 17 July and 21 September 2016. Both collapses caused large ice avalanches, and the first killed nine herders and hundreds of animals (Tian and others, Reference Tian2016). Remarkably, it is unprecedented that in only 2 months the two glaciers within 2.6 km of each other collapsed with similar behaviour. Until then, only one similar glacier event had been reported, i.e. the Kolka/Karmadon glacier in the Russian Caucasus on 20 September 2002, which led to a huge rock and ice slide of 120 million m3 in volume and the death of more than 140 people (Huggel and others, Reference Huss2005). Note that the Kolka glacier is a hanging glacier that experienced repeated surging (Huggel and others, Reference Huss2005), while our twin glaciers show no evidence of surging (Tian and others, Reference Tian2016). Scientists and the local government are concerned about whether the other glaciers near Aru Co might also collapse. Therefore, we need to study the glacier variations in this region to better understand the mechanism of glacier collapse.
Previous research (Wei and others, Reference Wei2014) has revealed a decrease in the glacier area of 4.16 ± 5.37% in the Lumajiangdong Co basin (corresponding to the 5Z41 entry of the World Glacier Inventory) which includes the study region, during 1971–2009. Ye and others (Reference Ye2017) also showed that glaciers in the Bangong Co basin (corresponding to the 5Z4 entry of the World Glacier Inventory) retreated by −7.58% from 1976 to 2013. However, we do not know whether the glacier area changed in the smaller basin because of heterogeneous climate conditions. Moreover, detailed glacier mass budgets are still lacking for this region. The main aim of this study was to fill the knowledge gap regarding the glacier area and mass changes in Aru Co, western Tibet, based on data from topographic maps, ASTER, Shuttle Radar Terrain Mission (SRTM) and Landsat imagery.
2. STUDY REGION
The study region (33.9 − 34.2°N, 82 − 82.3°E, Fig. 1) extends from the mountain range on the western side of the Aru Co lake to the western side of the Memar Co lake in western Tibet, China, adjoined with the southern part of Western Kunlun Mountains. The region spans in elevation from 4900 to 6400 m a.s.l. and corresponds to the 5Z412 entry of the World Glacier Inventory (Shi, Reference Shi2008). The glaciers of this region are extremely continental/subpolar with ice frozen to the bedrock (Shi, Reference Shi2008). The local climate is predominantly influenced by the westerlies and is extremely cold and arid.
Overview of the study region and glacier distribution, including the location of the meteorological stations (S: Shiquanhe, G: Gerze). Glaciers (Nos. 2 and 4) collapsed in subregion I. The background image is Landsat 8 OLI of 17 December 2016.

There are two highly glacierized regions classified into sub-regions I and II. Sub-region II is more highly glacierized and has a larger mean glacier size (1.6 km2) than sub-region I (0.8 km2). The collapsed glaciers (Glaciers No.2 and No.4) were located in sub-region I within the Aru Co lake basin. Glaciers No.4 and No.2 collapsed on 17 July and 21 September 2016, respectively. According to the second Chinese Glacier Inventory (CGI), the shape and attributes of Glacier No.2 and Glacier No.4 were very similar (Fig. 1 and Table 1); therefore, we call them twin glaciers.
Attributes of the twin glaciers derived from the second CGI

3. DATA AND METHODS
3.1. Data
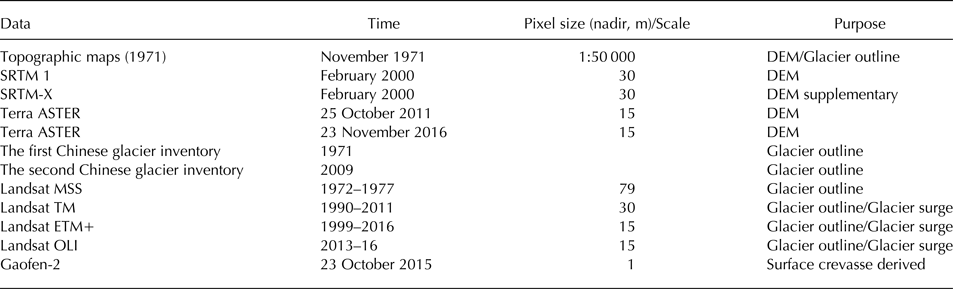
The glacier boundaries of 1971 and 2009 were obtained from the first and second CGI datasets (Table 2). Glacier outlines from the first CGI based on topographical maps with scales of 1: 50 000 and 1: 1 00 000 were verified using aerial images and Landsat MSS images. The second CGI was compiled using Landsat TM images, and the glacier inventories in 1993, 2001 and 2016 were also compiled using Landsat TM and OLI images by following the procedure and methods of the second CGI (Guo and others, Reference Guo2015; Liu and others, Reference Liu2015).
List of datasets used in this study
The glacier elevation changes were determined using the differences between the DEMs generated from the ASTER stereo images (ASTER DEM) acquired in 2011 and 2016, and the SRTM DEM for 2000. Elevation changes for 1971–2000 and 1971–2011–16 were also assessed on the basis of the DEM from topographic maps produced using aerial photos acquired in 1971 (Table 2).
The ASTER sensor mounted on Terra, a satellite launched in December 1999 as part of NASA's Earth Observing System, provides multispectral imagery between 82°N and 82°S. The imagery consists of 14 spectral bands (two of these (Bands 3N and 3B) with a 15-m spatial resolution), and composes an along-track stereo pair with a base-to-height (B/H) ratio of ~0.6, which is close to ideal for generating DEMs for a variety of terrain conditions via automated techniques (Hirano and others, Reference Hirano, Welch and Lang2003). In this study, we used two ASTER-level 1A raw data scenes acquired on 25 October 2011 and 23 November 2016 with no heavy clouds and slight snow coverage.
The SRTM DEM, acquired by radar interferometry with the C-band and the X-band from 11 to 22 February 2000, provides a near-global DEM with a range of 60°N and 56°S, which can be often seen as representative of the glacier surface at the end of the 1999 ablation period with slight seasonal variances (Gardelle and others, Reference Gardelle, Berthier, Arnaud and Kääb2013). The C- and X-band SRTM were processed independently into two separate DEMs at the Jet Propulsion Laboratory (JPL) of NASA and the German Aerospace Center (DLR), respectively. The 1″ C-band DEM (SRTM 1) and the 3″ C-band DEM (SRTM 3) are freely available globally. The X-band SAR system was operated with a narrower scan width of only 45 km, leaving large data gaps in the resulting X-band DEM. Fortunately, the entire study region was covered by the SRTM X-band. However, DEM differencing with SRTM X-band DEM shows a higher amount of noise because no filter was applied to the original SRTM-X DEM (Neckel and others, Reference Neckel, Braun, Kropáček and Hochschild2013). Thus, SRTM-C DEM was used to evaluate the glacier elevation change. We also utilized SRTM-X DEM to correct the penetration depth of the SRTM-C DEM by assuming that the penetration depth of the SRTM X-band beam into snow and ice was zero.
The topographic DEMs were obtained from five topographic maps (1:50 000), which were constructed from aerial photogrammetry acquired in November 1971 by the Chinese Military Geodetic Service (CMGS). These maps were based on the Beijing Geodetic Coordinate System 1954 geoid and the Yellow Sea 1956 datum (the mean sea level at the Qingdao Tidal Observatory in 1956), and were georeferenced into the WGS84/EGM96 coordinate system with a spatial resolution of 30 m.
In addition, we obtained meteorological data from the China Meteorological Data Sharing Service System (http://data.cma.cn/). Annual mean air temperature and precipitation at two stations (Shiquanhe and Gerze) were used to analyze the climate changes during 1961–2015.
3.2. Glacier boundary mapping, changing and uncertainty
Glacier boundaries of 1993, 2001 and 2016 were manually delineated from Landsat images. For comparison, we excluded all changes in voids in the accumulation area which could not be used for distinguishing between snow and glacier ice within a certain period.
Uncertainty was estimated by using a buffer of 6 m for topographic maps with a scale of 1:50 000 (from the first CGI) and half a pixel for the Landsat images (Bolch and others, Reference Bolch, Menounos and Wheate2010; Paul and others, Reference Paul2013; Wei and others, Reference Wei2014; Zhang and others, Reference Zhang, Ding, Xiao, Zhang and Du2016a, Reference Zhangb). On the basis of the law of error propagation, the final uncertainty for area change (E AC) was calculated as:
 $$E_{AC} = \sqrt {{(E_{A1})}^2 + {(E_{A2})}^2} $$
where E A1 and E A2 represent the uncertainties of the glacier outlines of periods 1 and 2, respectively.
3.3. DEM generation, post-processing, differencing and uncertainty
ASTER stereo images were processed using the ENVI ‘DEM Extraction’ module. More than 20 ground control points (GCPs) and 60 tie points (TPs) were selected on the ice-free terrain for each stereo image. These GCPs were obtained from Landsat images and topographic DEM as the horizontal (x,y) and elevation (z) references, respectively. The TPs were generated first automatically and then revised. We selected more TPs in the snow and ice areas to increase the accuracy of image-to-image coregistration. The final result was accepted when the maximum Y parallax errors <0.6 pixels.
All DEMs including SRTM-X were projected onto the coordinate system of WGS84 UTM zone 44 N/EGM96 and resampled at a resolution of 30 m by cubic convolution. Before the differencing of multi-temporal DEMs, one of them must be appropriately co-registered to the other DEMs. We first minimized the elevation error based on the relationship between the elevation difference and the aspect as we considered only the elevation differences between ± 100 m over the nonglacierized terrain with slopes ranging from 5 to 75° (Nuth and Kääb, Reference Nuth and Kääb2011; Holzer and others, Reference Huggel2015; Pieczonka and Bolch, Reference Pieczonka and Bolch2015; Shangguan and others, Reference Shangguan2015). Subsequently, biases resulting from multiple spatial resolutions were adjusted by using the minimized vertical error on the basis of the relationship between the elevation biases and the maximum curvatures both on and off glacierized areas (Gardelle and others, Reference Gardelle, Berthier and Arnaud2012).
When we compared SRTM with the other DEMs, the penetration of the radar beams was considered. Assuming that the penetration depth of the X-band signal was negligible for glaciers, an average difference of 1.01 m between the C-band and the X-band (Gardelle and others, Reference Gardelle, Berthier, Arnaud and Kääb2013) was used to estimate and correct the penetration of the C-band radar.
After the adjustments, we estimated the uncertainty in the differences between each pair of DEMs by using the normalized median absolute deviation (NMAD) as:
 $${\rm NMAD} = 1.4826 \times {\rm MED}( \vert \widetilde{x} - x_i \vert )$$
where x i and x͠ represent the elevation differences and their mean, respectively (Höhle and Höhle, Reference Holzer2009).
The uncertainty of the radar penetration was estimated from the NMAD of SRTM-X to be 3.78 m. We assumed that the possible slight penetration of the X-band radar beam is within this uncertainty range. Thus we calculated the uncertainty of the difference (e) between SRTM-C and the other DEMs as follows:
 $$e = \sqrt {{\rm NMA}{\rm D}^2 + {3.78}^2} $$
To convert elevation change to mass change an assumption is required about density. In this study, we used a density of 850 ± 60 kg m−3 (Huss, Reference Höhle and Höhle2013) to estimate the mass change in w.e..The final mass-balance uncertainty (E) was calculated as:
 $$E = \sqrt {{\left( {\displaystyle{e \over t}{^\ast}\displaystyle{{\Delta \rho} \over {\rho _w}}} \right)}^2 + {\left( {\displaystyle{e \over t}{^\ast}\displaystyle{{\rho _I} \over {\rho _w}}} \right)}^2} $$
where t is the observation period, Δρ is the ice density uncertainty (60 kg m−3), ρ w is the water density (999.92 kg m−3) and ρ w is the ice density (850 kg m−3) (Pieczonka and Bolch, Reference Pieczonka and Bolch2015; Shangguan and others, Reference Shangguan2015).
4. RESULTS
4.1. Glacier area change
There were 69 glaciers in our study region with a total area of 86.6 ± 1.34 km2 in 1971; most of these glaciers have exhibited no significant change during the past 45 years. The total glacier area was only decreased by −0.4 ± 3.55 km2 or −0.4 ± 4.1% from 1971 to 2016 (Pre-collapse period) (Table 3). Glaciers in sub-region I, where the twin glaciers collapsed, lost −0.3 ± 1.23 km2 or −1.3 ± 5.2% of the total glacier area between 1971 and 2016, which made a large contribution to the total area loss in our study region. Glaciers in sub-region II decreased by only −0.1 ± 3.7% during 1971–2016, and experienced an area gain of 0.8 ± 4.7% during 2001–16. During 1971–2001, these glaciers decreased by −0.9 ± 3.7%, which is in line with sub-region I (0.8% ± 5.2%).
Glacier area (A) and changes from 1971–2016 for selected glaciers with mass-balance estimates and for all glaciers of the study region
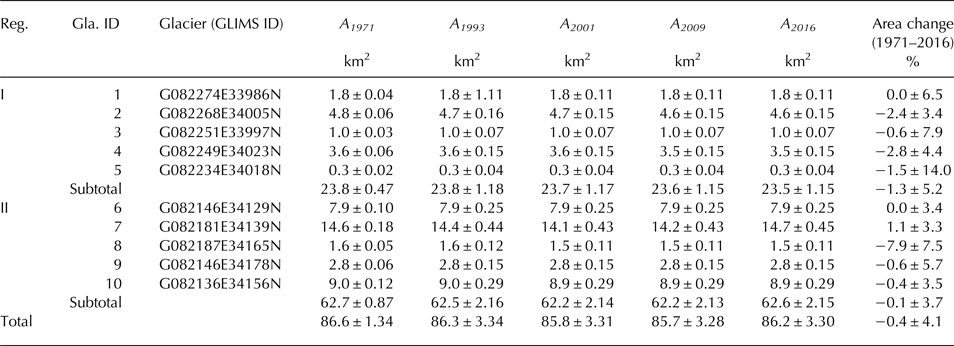
Twenty glaciers experienced various shrinkages from ~−0.2% to ~−7.9% during 1971–2016, and Glacier No.7, the largest glacier in our study region, reduced by −3.0 ± 3.2% during 1971–2001 and then, subsequently, advanced by 4.2 ± 4.4% during 2001–16. We consider that Glacier No.7 surged during the period.
4.2. Glacier mass balances
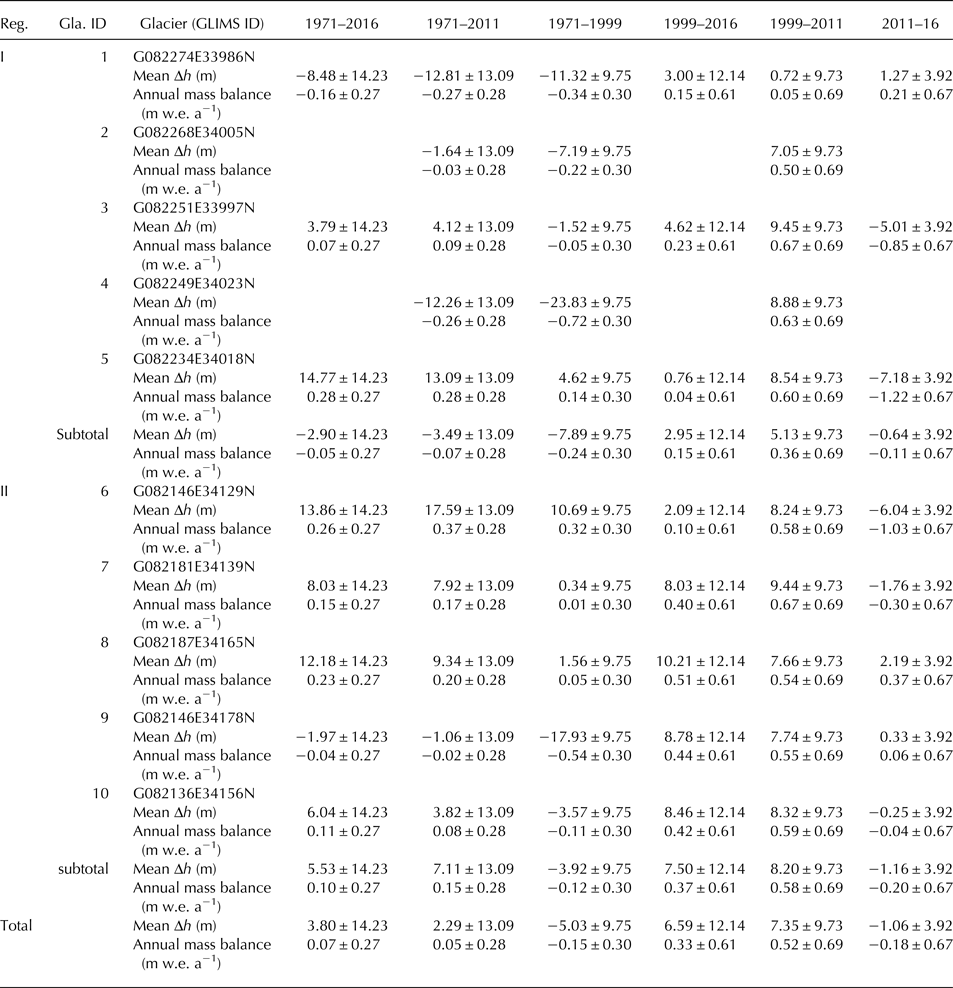
The average mass budget of our study region was nearly balanced for more than 45 years (Table 4 and Fig. 2). Regional mean annual mass balances were 0.05 ± 0.27 m w.e. a−1 during 1971–2011 and 0.07 ± 0.28 m w.e. a−1 during 1971–2016 whereas the mass budgets of sub-region I were −0.05 ± 0.27 m w.e. a−1 and −0.07 ± 0.28 m w.e. a−1 during 1971–2011 and 1971–2016. We used SRTM 1 to evaluate the mass budget before and after 1999. The results showed that the mass budget of the region was negative (−0.15 ± 0.30 m w.e. a−1) before 1999, and then became positive (in the range from 0.52 ± 0.69 m w.e. a−1 to 0.33 ± 0.61 m w.e. a−1) after 1999. We also found that the average mass budget during 2011–16 which was slightly negative (−0.18 ± 0.67 w.e. a−1) and had a higher uncertainty should be considered to be too short to obtain reliable results.
Elevation difference (dh) of glaciers during 1971–2016 (a), 1971–2011 (b), 1971–1999 (c), 1999–2016 (d), 1999–2011 (e) and 2011–16 (f) in our study region.

Glacier mean change of elevation (Δh) and geodetic glacier mass-balance rates measured using DEM differencing
4.3. Twin glacier collapses
In November 2016, the detached ice areas of Glacier Nos. 2 and 4 were 6.1 ± 0.24 and 7.6 ± 0.25 km2, respectively. The lengths of their detached extents were 4.7 and 5.4 km, respectively. The detached extent of Glacier No. 2 melted little from 21 September to November 2016. However, the detached extent of Glacier No. 4 decreased by −19.1 ± 3.76% from 21 July (shortly after the collapse) to November.
In the above statement of geodetic glacier mass balances, both glaciers that collapsed in 2016 were not considered in the calculation process for 2016. We compared the average elevation values of the twin glaciers and their detached extents in 2011 with those in 2016 and found that a mean surface elevation increase of 2.34 ± 3.92 and 2.04 ± 3.92 m was observed on Glacier No.2 and Glacier No.4 (include their detached extents), respectively (Fig. 3). The reason for the surface elevation decrease of Glacier No.4 is the partial but significant transfer of the melted parts to the Aru Co lake from July to November. And the surface elevation increase of Glacier No.2 may be ascribed to positive mass balance during 2011–16.
(a) Elevation difference of twin glaciers with their detached extent during 2011–16; (b) Longitudinal profiles of the surface elevation for twin glaciers before (2011) and after collapse (2016).

The volume gain was ~(9.13 ± 2.38) × 107 m3 in the detached extent of Glacier No. 2. This part was not adjacent to the Aru Co lake and was considered to be the total ice volume of the ice avalanche by assuming that the volume did not change from 21 September to November, after the end of the ablation season. However, we could not get the volume of the ice avalanche for Glacier No. 4 because of the partial detached ice transferred to the Aru Co lake and melted from July to November. The ice volume loss of Glacier No. 4 (excluding its detached area), ~(5.83 ± 1.39) × 107 m3, might be considered the total ice volume of the ice avalanche by assuming that the volume did not change from 2011 to 2016. If we assumed that the mass balance of Glacier No. 4 was in line with the average of sub-region I during 2011–16 (−1.06 ± 3.92 m), the total ice detached volume was ~(5.61 ± 1.39) × 107 m3. Further, if the elevation change of Glacier No. 4 and its detached extent was in line with the average of Glacier No. 2 and its detached area (2.34 ± 3.92 m) during 2011–16, the total ice avalanche volume was ~ (6.66 ± 1.39) × 107 m3.
4.4. Surge of the Glacier No. 7
According to a time series of Landsat images between 1971 and 2003, we found that the Glacier No.7 has retreated by a total of −850 ± 30 m (Supplement Fig. S1a), and its area changed by −3.0 ± 3.2% during 1971–2001. In fact, it has retreated by −240 ± 30 m from 2011 to 2013 (Fig. S1a), after an advance of 300 ± 30 m in 2003 because of surging (Fig. S1b). The north tributary of the glacier was assumed to surge in 2003 on the basis of a visual indication. Then, it remained almost stable from 2004 to 2010 (Figs S1c and S1d). In 2010, the south tributary of the glacier again showed signs of surging (Fig. S1e). From September to October 2011, it advanced by 140 ± 30 m, which might be attributed to the surging of the south tributary (Figs S1f, S1g and S1h). Then, it continuously advanced until 2013 (Figs S1i, S1j, S1k, S1l, S1m and S1n). In particular, the glacier advanced by 170 ± 30 m in 2013 (Figs. S1m and S1n). The glacier did not show any visual indications of change in extent from 2013 to 2016.
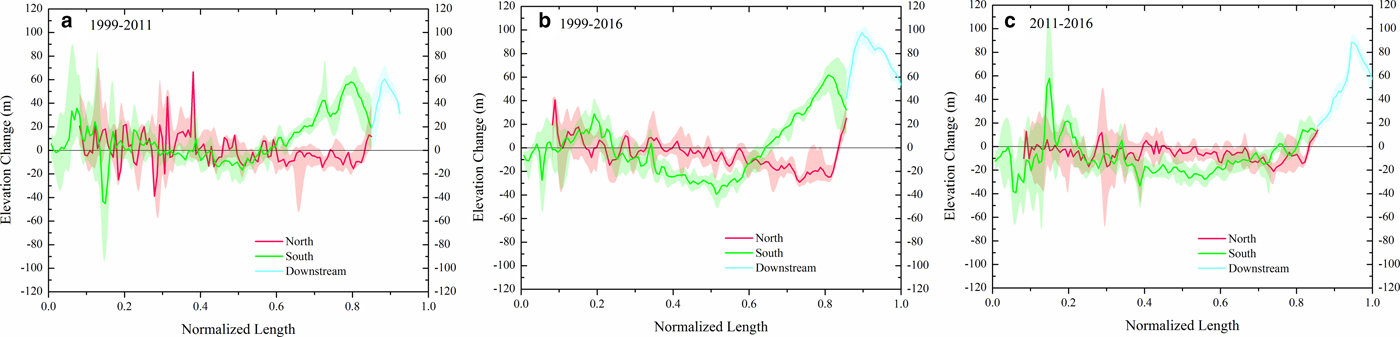
Glacier No. 7 experienced a significant thickening during 1999–2011 and 2011–16 (Fig. 4). Significant lowering was observed on the upper part of the south branch during 1999–2016 and 2011–16 because this was the region from which mass was transferred to the lower part of the tongue. The upper part of the north tributary showed a slight elevation change from 1999 to 2016, which was probably because the ice built up in the reservoir area during a quiescent phase from 2003 to 2016. The lower part of the north tributary thinned from 2011 to 2016 because it was more prone to melting at a lower elevation.
Longitudinal profiles of the surface elevation changes for Glacier G082181E34139N during 1999–2011 (a), 1999–2016 (b) and 2011–16 (c). The profiles are generated using a moving average with a bandwidth of 120 m.
5 DISCUSSION
5.1. Glacier changes
Previous studies reported slight area shrinkage of glaciers in the interior area of the Tibetan Plateau from the 1970s to 2010s (Wei and others, Reference Wei2014, Ye and others, Reference Ye2017). This agreed well with our results and indicated that the glaciers in our study region were more stable. The area of the glaciers in our study region has been almost stable in the recent years, which is related to the positive mass budget after 1999.
So far, no report of the mass balance before 1999 has been published for our study region. Our study revealed that the glaciers in the Aru Co basin have been nearly in balance since 1971 and that there was a transition from negative to positive mass balance ~1999. Previous studies have reported a mass gain of 0.03 ± 0.25 m w.e. a−1 (Neckel and others, Reference Neckel, Kropáček, Bolch and Hochschild2014) or 0.17 ± 0.15 m w.e. a−1 (Gardner and others, Reference Gardner2013) in the Western Kunlun Mountains including our study region by using ICESat laser altimetry data for the period of 2003–09. Lin and others (Reference Lin, Li, Cuo, Hooper and Ye2017) reported that the average mass budget of glaciers near our study region (~50 km northeast, a zone called Toze Kangri) was 0.343 ± 0.055 m w.e. a−1 from 2000 to 2014. These results are in agreement with our study, which revealed an overall positive trend for the glaciers in the Aru Co basin after 1999. Kääb and others (Reference Kamb2018) also reported sub-regions I and II had a positive mass balance of 0.19 ± 0.16 m w.e. a−1 and 0.21 ± 0.16 m w.e. a−1 between 2000 and 2015 obtained from a time series of ASTER DEMs. This agrees well with our study despite such uncertainties due to differences in measurement periods.
5.2. Glacier surge
Previous literature has reported that a large number of glaciers in Karakoram, which is adjacent to our study region, experienced surging (Rankl and others, Reference Rankl, Kienholz and Braun2014). However, there are few surge-type glaciers in the interior area of the Tibetan Plateau.
Two types of triggering mechanisms for surge initiation have been proposed (Quincey and others, Reference Quincey, Glasser, Cook and Luckman2015). One is the polythermal glacier surging in a thermally controlled environment, which is due to the basal temperature instability promoting increased sediment deformation and porosity, and a positive feedback among pore water pressure, deformation and basal flow (Clarke and others, Reference Clarke, Collins and Thompson1984; Murray and others, Reference Murray2000). This type is characterized by an initiation phase that lasts several years before the peak of the surge is reached, and a termination phase that consists of several years of deceleration following the peak of the surge (Clarke and others, Reference Clarke, Collins and Thompson1984; Murray and others, Reference Murray2000). These surges are found to begin their acceleration/deceleration independent of any seasonal control (Clarke and others, Reference Clarke, Collins and Thompson1984; Murray and others, Reference Murray, Luckman, Strozzi and Nuttall2003). The other is the temperate glacier surging in a hydrologic switch-controlled environment, which is due to the flow instability. This type is triggered by changes in the efficiency of the hydrological system and thus, pore water pressure, which is characterized by rapid acceleration and deceleration (i.e. days to weeks long), tending to initiate during winter months when the drainage efficiency is low, and terminating during summer months when the drainage efficiency is high (Kamb and others, Reference Kääb1985; Björnsson, Reference Björnsson1998; Burgess and others, Reference Burgess, Forster, Larsen and Braun2012).
As is known, glaciers in this region are not temperate but cold-based and frozen to the bed (Shi and Liu, Reference Shi and Liu2000). Glacier No.7 has exhibited a strong positive mass-balance trend in recent years, which may be attributed to the precipitation increases. Therefore, we assume that the build-up of ice due to accumulation in the reservoir area increased the driving stress, which led to higher ice creep rates. In turn, this generated heat and initiated a positive feedback between the accelerated ice motion and the strain heating. Consequently, a part of the bed was brought to the pressure melting point and further energy dissipated during the glacier motion was used to produce meltwater. The frozen periphery and toe in the downstream area could prevent this water from escaping and thus increase basal water pressures, leading to reduced basal drag and faster sliding.
5.3. Twin glacier collapses
As is known, the Kolka glacier in the Russian Caucasus which collapsed in 2002 surged in 1969/70 (Huggel and others, Reference Huss2005). Whether the two glaciers in our study region were surging glaciers is yet to be determined. The two glaciers experienced a long period of positive mass balance after 1999 followed by an increase in the ice creep rates and heat generation, which made the bed reach the pressure melting point. The mechanism by which these glaciers responded seems to be similar to that of Glacier No.7. However, we used the time series of Landsat images obtained in the recent years to monitor the velocities of glaciers and did not find acceleration before the collapses. Polythermal glacier surges usually last from a couple of days to several years (Quincey and others, Reference Quincey, Glasser, Cook and Luckman2015), but these glaciers did not seem to have this characteristic. Thus, we suggest that the twin glaciers collapsed in a very short period of time because of liquid water lubrication. The liquid water possibly came from the infiltration of the snow melt, and liquid precipitation and glacier melt by the heat of the ice creep and friction with the glacier bed. For example, Zhang and others (Reference Zhang2016) reported stored water in the Jima Yangzong Glacier of the headstream of Yarlung Zangbo River and Wang and others (Reference Wang, Xu, Pu and Zhang2013) found that there were water contents in the ice layer of the Yuzhu Glacier of Kunlun mountains.
Kääb and others (Reference Kamb2018) also reported on these twin collapses, and their results agree with ours. They also found that twin collapses were triggered by short-term variation in the subglacial hydrological system induced by unusually high water input from melt and rain in the summer of 2016. However, there is a lack of data for glacier mass changes before 1999. According to our results, two glaciers exhibited a stronger shrinkage in the area and negative mass budget than the others before 1999 (Fig. 2). We suggest that the internal ice of these glaciers melted before 1999 and not all of this meltwater was released. These waters came together with the meltwater on the pressure melting point because of the continuous accumulation in the recent years. The twin glaciers collapses occurred in July and September, which was also the ablation period when the meltwater from the internal glaciers is ample for supplementing the water at the bed. The high shear stresses along the frozen sidewalls due to the high-pressure water dammed at the bed progressively broke the ice until the glacier avalanche.
We also found that the two glaciers were heavily crevassed on 23 October 2015; this was also the end of the ablation period (Fig. 5). Unfortunately, we could not determine the reason for the development of the crevasses because of a lack of data. However, we assumed that snow water and liquid precipitation entered into the glaciers through the crevasses in the summer and were stored at the bed. These waters might have also participated in the following year.
Surface crevasse development derived from Gaofen-2 (panchromatic band) on 23 October 2015.

5.4. Glacier response to climate change
Shiquanhe (32.50°N, 80.08°E, 4279 m a.s.l.), 290 km southwest of the Aru Co, the nearest meteorological station, recorded that the air temperature increased during 1961–2000 but remained almost stable (slightly decreased) from 2000 to 2015 (Fig. 6a). Gerze Meteorological Station (32.15°N, 84.42°E, 4416 m a.s.l.), 280 km southeast of the Aru Co, also recorded that the air temperature increased during 1973–2005 but decreased from 2005 to 2015 (Fig. 6a). Glacier area and mass changes were found to be in good agreement with the air temperature changes.
Changes in the average air temperature and precipitation during 1961–2015 recorded at the Shiquanhe and Gerze stations.
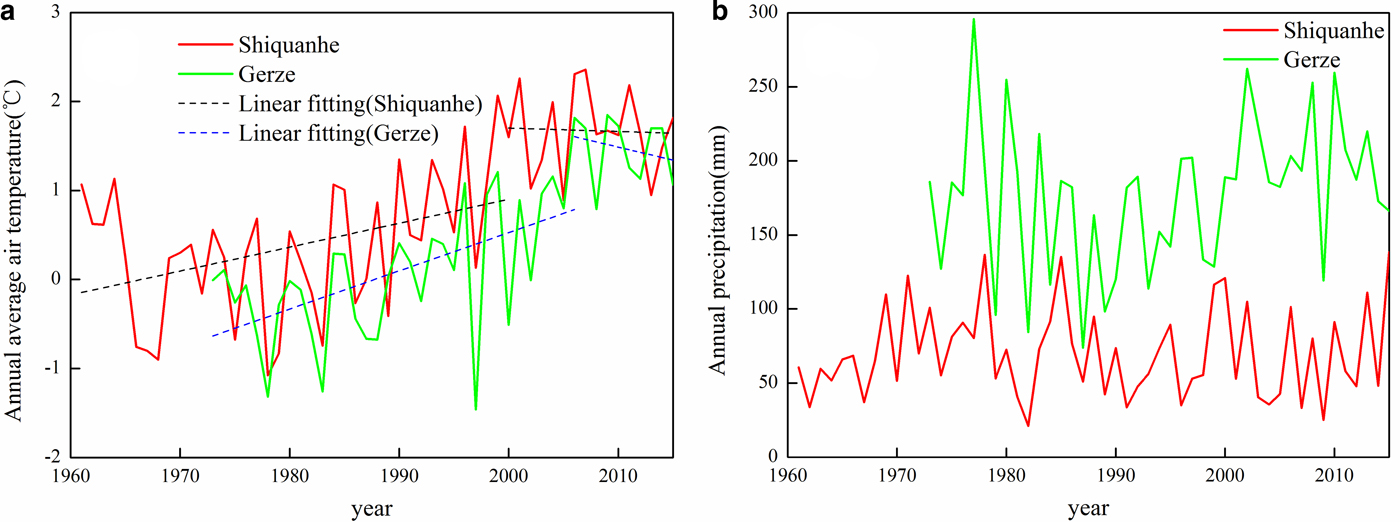
Shiquanhe and Gerze meteorological stations reported that there were dry years between 1987 and 1998 when the annual average air temperature increased, which led to less net ice accumulation in this period (Fig. 6b). This might be the cause of the glacier shrinkage in the area and the negative mass budget before 1999. Although Shiquanhe and Gerze Meteorological Stations recorded a slight increase in precipitation after 1990, the higher-altitude regions might have had more cumulative precipitation. Yao and others (Reference Yao2012) also observed strengthening westerlies coming along with an increase in precipitation. Moreover, the glaciers located at a higher altitude had more precipitation. Therefore, the glaciers had a negative balance before 1999 and a positive balance after 1999 as a response to the increase in the precipitation in the recent years.
CONCLUSION
We investigated the glacier area and the mass changes in the Aru Co basin for the period 1971–2016 by using ASTER images (2011–16), SRTM DEM (2000) and topographic maps (1971) in conjunction with Landsat images and the first and second Chinese glacier inventories. Our results demonstrated that the total glacier shrinkage of −0.4 ± 4.1%, from 86.6 ± 1.34 km2 in 1971 to 86.2 ± 3.30 km2 in 2016, was low and insignificant. The glacier area increased after 2009 because of the surging of Glacier No. 7. We found that Glacier No. 7 surged and the north and the south tributaries surged in 2003 and 2010–13, respectively. The mass budgets of this study region were −0.15 ± 0.30 m w.e. a−1 for the period 1971–99 and 0.05 ± 0.28~0.07 ± 0.27 m w.e. a−1 for the period 1999–2011–16. However, these glaciers showed a mass balance during 1971–2011–16 that was not subject to the penetration depth uncertainties in the 2000 SRTM DEM. The positive budgets observed after 1999 could possibly reflect a regional anomaly with increasing snow accumulation from the strengthening westerlies in line with Pamir, Karakorum and western Kunlun. The twin glaciers showed a relative larger mass loss than the others before 1999 when more meltwater was produced, followed by a sustained increase in meltwater at the pressure melting point which was possibly in response to the period of positive mass balance (1999–2016) and then a transfer to the glacier bed until the glaciers collapsed. The volumes of the two collapses were estimated to be (5.83 ± 1.39) × 107~(6.66 ± 1.39) × 107 m3 for the first glacier and (9.13 ± 2.38) × 107 m3 for the second.
SUPPLEMENTARY MATERIAL
The supplementary material for this article can be found at https://doi.org/10.1017/jog.2018.34
ACKNOWLEDGEMENTS
This work was supported by the National Natural Science Foundation of China (Grant Nos. 41701087, 41671057 and 41501226), the fundamental program from the Ministry of Science and Technology of China (MOST) (Grant No. 2013FY111400) and Research Funds Provided to New Recruitments of Yunnan University (YJRC3201702). The glacier inventory Data are a product of MOST ‘Investigation on glacier resources and their change in China’ project (Grant No. 2006FY110200) and ‘Glacier change monitoring and its impact assessment in western China’ by Chinese Academy of Sciences (Grant No.KZCX2-YW-301) (http://westdc.westgis.ac.cn/glacier, accessed on 11.19.2017). We thank NASA for free access to ASTER images, DLR for free access to SRTM X-band data, USGS for free access to SRTM C-band and Landsat data and CMA for free access to meteorological data.


 Open access