


1. Introduction
Generalized linear models (GLMs) or general additive models (GAMs) are the standard benchmark models used in most non-life insurance pricing, see e.g. (Ohlsson and Johansson, Reference Ohlsson and Johansson2010, Ch. 2 and 5) and (Wuthrich & Merz Reference Wüthrich and Merz2023, Ch. 5). These types of models are well-studied, transparent, and, hence, easy to interpret, which is part of their popularity and widespread use in the decision-making process. If one instead considers machine learning (ML) methods such as gradient boosting machines (GBMs) and neural networks (NNs), see e.g. (Hastie et al. Reference Hastie, Tibshirani and Friedman2009, Ch. 10–11) for a general introduction, and e.g. Denuit et al. (Reference Denuit, Hainaut and Truffin2020) focusing on tree-based models and (Wuthrich & Merz Reference Wüthrich and Merz2023, Ch. 7–12) focusing on NNs, which also discusses actuarial applications, these type of methods tend to outperform GLMs and GAMs in terms of predictive accuracy. A potential problem, however, is that the predictors obtained when using ML methods tend to be hard to interpret. In this short note, we introduce a method for guided construction of a categorical GLM based on a given black-box predictor $\widehat \mu (x)$
. From a practitioner’s perspective, this is a very tractable approach, since categorical GLMs are well understood and are widely used for non-life insurance pricing, see e.g. Ohlsson and Johansson (Reference Ohlsson and Johansson2010). This approach is similar to the one introduced in Henckaerts et al. (Reference Henckaerts, Antonio and Côté2022), but our focus is not on maintaining fidelity w.r.t. the original predictor
$\widehat \mu (x)$
. From a practitioner’s perspective, this is a very tractable approach, since categorical GLMs are well understood and are widely used for non-life insurance pricing, see e.g. Ohlsson and Johansson (Reference Ohlsson and Johansson2010). This approach is similar to the one introduced in Henckaerts et al. (Reference Henckaerts, Antonio and Côté2022), but our focus is not on maintaining fidelity w.r.t. the original predictor $\widehat \mu (x)$
, but rather on finding an as good categorical GLM as possible. For more on surrogate modeling, see e.g. Hinton et al. (Reference Hinton, Vinyals and Dean2015); Henckaerts et al. (Reference Henckaerts, Antonio and Côté2022) and the references therein.
$\widehat \mu (x)$
, but rather on finding an as good categorical GLM as possible. For more on surrogate modeling, see e.g. Hinton et al. (Reference Hinton, Vinyals and Dean2015); Henckaerts et al. (Reference Henckaerts, Antonio and Côté2022) and the references therein.
The general setup is that we observe $(Z, X, W)$
data, where
$(Z, X, W)$
data, where $Z$
is the response, e.g. number of claims or claim cost,
$Z$
is the response, e.g. number of claims or claim cost, $X$
is a
$X$
is a $d$
-dimensional covariate vector, and
$d$
-dimensional covariate vector, and $W$
is an exposure measure, e.g. policy duration. It will be assumed that
$W$
is an exposure measure, e.g. policy duration. It will be assumed that $Z$
, given
$Z$
, given $X$
and
$X$
and $W$
belongs to an exponential dispersion family (EDF), see e.g. (Jørgensen and Paes De Souza (Reference Jørgensen and Paes De Souza1994), Ohlsson and Johansson, Reference Ohlsson and Johansson2010, Ch. 2), and (Wüthrich & Merz Reference Wüthrich and Merz2023, Ch. 2), which includes e.g. the Tweedie distribution. Further, it will be assumed that the (conditional) mean and variance can be written on the form
$W$
belongs to an exponential dispersion family (EDF), see e.g. (Jørgensen and Paes De Souza (Reference Jørgensen and Paes De Souza1994), Ohlsson and Johansson, Reference Ohlsson and Johansson2010, Ch. 2), and (Wüthrich & Merz Reference Wüthrich and Merz2023, Ch. 2), which includes e.g. the Tweedie distribution. Further, it will be assumed that the (conditional) mean and variance can be written on the form
 \begin{align} {\mathbb{E}}[Z \mid X, W] = W\mu (X) \, \text{and}\,{\mathrm{Var}}(Z \mid X, W) = W\sigma ^2(X), \end{align}
for suitable functions $\mu (X)$
and
$\mu (X)$
and $\sigma ^2(X)$
, which is common in insurance pricing, see e.g. (Ohlsson and Johansson Reference Ohlsson and Johansson2010, Ch. 2). Hence, if we let
$\sigma ^2(X)$
, which is common in insurance pricing, see e.g. (Ohlsson and Johansson Reference Ohlsson and Johansson2010, Ch. 2). Hence, if we let $Y \;:\!=\; Z / W$
, based on Equation (1), it follows that
$Y \;:\!=\; Z / W$
, based on Equation (1), it follows that
 \begin{align}{\mathbb{E}}[Y \mid X, W] = \mu (X) ={\mathbb{E}}[Y \mid X] \,\text{and}\,{\mathrm{Var}}(Y \mid X, W) = \frac{1}{W}\sigma ^2(X). \end{align}
When it comes to building a guided GLM based on an exogenous black-box predictor $\widehat \mu (x)$
, the exposition will focus on most two-way interactions, but the generalization to higher-order interactions is straightforward. Further, focus will be on log-linear models, as in Equation (3) below, but the assumption of using a log-link function can also be relaxed, and the procedure using other link functions is analogous to the one described below. The suggested procedure can be summarized as follows: In a first step, start from a general
$\widehat \mu (x)$
, the exposition will focus on most two-way interactions, but the generalization to higher-order interactions is straightforward. Further, focus will be on log-linear models, as in Equation (3) below, but the assumption of using a log-link function can also be relaxed, and the procedure using other link functions is analogous to the one described below. The suggested procedure can be summarized as follows: In a first step, start from a general $d$
-dimensional covariate vector
$d$
-dimensional covariate vector $x \;:\!=\; (x_1, \ldots, x_d)' \in \mathbb{X}$
,
$x \;:\!=\; (x_1, \ldots, x_d)' \in \mathbb{X}$
, $\mathbb{X} \;:\!=\; \mathbb{X}_1 \times \cdots \times \mathbb{X}_d$
, where
$\mathbb{X} \;:\!=\; \mathbb{X}_1 \times \cdots \times \mathbb{X}_d$
, where $x_j \in \mathbb{X}_j, j = 1, \ldots, d$
, and use a given mean predictor
$x_j \in \mathbb{X}_j, j = 1, \ldots, d$
, and use a given mean predictor $\widehat \mu (x)$
to define categorical versions of the original covariates,
$\widehat \mu (x)$
to define categorical versions of the original covariates, $x_j$
, and two-way interactions. This step uses partial dependence (PD) functions, see e.g. Friedman and Popescu (Reference Friedman and Popescu2008), to construct categories, or, equivalently, a partition of
$x_j$
, and two-way interactions. This step uses partial dependence (PD) functions, see e.g. Friedman and Popescu (Reference Friedman and Popescu2008), to construct categories, or, equivalently, a partition of $\mathbb{X}_j$
. This is the same idea used in Henckaerts et al. (Reference Henckaerts, Antonio and Côté2022), but instead of aiming for fidelity w.r.t. the original PD function, the number of categories, and the size of the partition, is adjusted using an auto-calibration step, see e.g. Krüger and Ziegel (Reference Krüger and Ziegel2021); Denuit et al. (Reference Denuit, Charpentier and Trufin2021). In this way, focus is shifted from fidelity w.r.t. the initial predictor to accuracy of the new predictor, since the auto-calibration step will remove categories that do not contribute to the final predictor’s predictive performance. In a second step, once the categorical covariates have been constructed, fit a standard categorical GLM with a mean function from Equation (1) of the form
$\mathbb{X}_j$
. This is the same idea used in Henckaerts et al. (Reference Henckaerts, Antonio and Côté2022), but instead of aiming for fidelity w.r.t. the original PD function, the number of categories, and the size of the partition, is adjusted using an auto-calibration step, see e.g. Krüger and Ziegel (Reference Krüger and Ziegel2021); Denuit et al. (Reference Denuit, Charpentier and Trufin2021). In this way, focus is shifted from fidelity w.r.t. the initial predictor to accuracy of the new predictor, since the auto-calibration step will remove categories that do not contribute to the final predictor’s predictive performance. In a second step, once the categorical covariates have been constructed, fit a standard categorical GLM with a mean function from Equation (1) of the form
 \begin{align} \mu (x;\; \beta ) \;:\!=\; \exp \left \{\beta _0 + \sum _{j = 1}^d \sum _{k = 1}^\kappa \beta _j^{(k)} \textit{1}_{\{x_j \in \mathbb{B}_j^{(k)}\}} +{\sum _{j = 1}^d\sum _{j \lt l} \sum _{k = 1}^\kappa \beta _{j, l}^{(k)}\textit{1}_{\{(x_j, x_l) \in \mathbb{B}_{j, l}^{(k)}\}}}\right \}, \end{align}
where $\cup _{k = 1}^\kappa \mathbb{B}_\bullet ^{(k)} \;=\!:\; \mathbb{X}_\bullet$
, and where the
$\cup _{k = 1}^\kappa \mathbb{B}_\bullet ^{(k)} \;=\!:\; \mathbb{X}_\bullet$
, and where the $\beta$
s are regression coefficients taking values in
$\beta$
s are regression coefficients taking values in $\mathbb{R}$
. Further, EDFs can be parametrized such that
$\mathbb{R}$
. Further, EDFs can be parametrized such that $\sigma ^2(X)$
from (1) can be expressed according to
$\sigma ^2(X)$
from (1) can be expressed according to $\sigma ^2(X) = \phi V(\mu (X))$
, where
$\sigma ^2(X) = \phi V(\mu (X))$
, where $\phi$
is the so-called dispersion parameter, and
$\phi$
is the so-called dispersion parameter, and $V$
is the so-called variance function, see e.g. (Ohlsson and Johansson Reference Ohlsson and Johansson2010, Ch. 2). Using this parametrization together with the moment Assumptions (1), gives us that the
$V$
is the so-called variance function, see e.g. (Ohlsson and Johansson Reference Ohlsson and Johansson2010, Ch. 2). Using this parametrization together with the moment Assumptions (1), gives us that the $\beta$
-coefficients from Equation (3) can be estimated using the deviance loss function
$\beta$
-coefficients from Equation (3) can be estimated using the deviance loss function
 \begin{align} D(y;\; \beta, \lambda ) \;:\!=\; \sum _{i = 1}^n w_i d(y_i, \mu (x_i;\; \beta )), \end{align}
where the $w_i$
s refer to contract exposures, e.g. policy duration,
$w_i$
s refer to contract exposures, e.g. policy duration, $d(y, \mu )$
is the unit deviance function of an EDF, see e.g. (Ohlsson and Johansson Reference Ohlsson and Johansson2010, Ch. 2) and (Wüthrich and Merz Reference Wüthrich and Merz2023, Ch. 2), and where
$d(y, \mu )$
is the unit deviance function of an EDF, see e.g. (Ohlsson and Johansson Reference Ohlsson and Johansson2010, Ch. 2) and (Wüthrich and Merz Reference Wüthrich and Merz2023, Ch. 2), and where $\mu (x_i, \beta )$
is from Equation (3).
$\mu (x_i, \beta )$
is from Equation (3).
The remainder of this short note is structured as follows: In Section 2, basic results on PD functions are provided. Section 2.1 discusses implications and interpretations of using PD functions, followed by Section 2.2, which describes how PD functions can be used to partition the covariate space, both marginally and w.r.t. interaction effects, in this way creating categorical covariates. This section also describes how a marginal auto-calibration procedure can be used to remove possibly redundant categories. Section 3 discusses various implementational considerations and describes a full estimation procedure, which is summarized in Algorithm1. The paper ends with numerical illustrations based on Poisson models applied to real insurance data, see Section 4, followed by concluding remarks in Section 5.
2. Partial dependence functions
The PD function w.r.t. a, potentially exogenously given, (mean) function $\mu (x)$
,
$\mu (x)$
, $x' = (x_1, \ldots, x_d)' \in \mathbb{X}$
, and the covariates
$x' = (x_1, \ldots, x_d)' \in \mathbb{X}$
, and the covariates $x_{\mathcal{A}}$
,
$x_{\mathcal{A}}$
, $\mathcal{A} \subset \{1, \ldots, d\}$
, is given by:
$\mathcal{A} \subset \{1, \ldots, d\}$
, is given by:
 \begin{align} {\mathrm{PD}}(x_{\mathcal{A}}) \;:\!=\; \int \mu (x_{\mathcal{A}}, x_{\mathcal{A}^{{\mathrm{C}}}}){{\mathrm{d}}} \mathbb{P}(x_{\mathcal{A}^{\mathrm{C}}}), \end{align}
where $\mathcal{A}^{\mathrm{C}} = \{1, \ldots, d\} \setminus \mathcal A$
, see e.g. Friedman and Popescu (Reference Friedman and Popescu2008). Note that Equation (5) can be rephrased according to
$\mathcal{A}^{\mathrm{C}} = \{1, \ldots, d\} \setminus \mathcal A$
, see e.g. Friedman and Popescu (Reference Friedman and Popescu2008). Note that Equation (5) can be rephrased according to
 \begin{align} {\mathrm{PD}}(x_{\mathcal{A}}) ={\mathbb{E}}[\mu (x_{\mathcal{A}}, X_{\mathcal{A}^{\mathrm{C}}})], \end{align}
which illustrates that ${\mathrm{PD}}(x_{\mathcal{A}})$
quantifies the expected effect of
${\mathrm{PD}}(x_{\mathcal{A}})$
quantifies the expected effect of $X_{\mathcal{A}} = x_{\mathcal{A}}$
, when breaking all potential dependence between
$X_{\mathcal{A}} = x_{\mathcal{A}}$
, when breaking all potential dependence between $X_{\mathcal{A}}$
and
$X_{\mathcal{A}}$
and $X_{\mathcal{A}^{\mathrm{C}}}$
, see Friedman and Popescu (Reference Friedman and Popescu2008). In particular, note that if
$X_{\mathcal{A}^{\mathrm{C}}}$
, see Friedman and Popescu (Reference Friedman and Popescu2008). In particular, note that if $\mu (x) \;:\!=\;{\mathbb{E}}[Y \mid X = x]$
, the PD function w.r.t.
$\mu (x) \;:\!=\;{\mathbb{E}}[Y \mid X = x]$
, the PD function w.r.t. $\mathcal{A}$
is related to the expected effect of
$\mathcal{A}$
is related to the expected effect of $\mathcal{A}$
on
$\mathcal{A}$
on $Y$
, when adjusting for potential association between
$Y$
, when adjusting for potential association between $X_{\mathcal{A}}$
and
$X_{\mathcal{A}}$
and $X_{\mathcal{A}^{\mathrm{C}}}$
, see Zhao and Hastie (Reference Zhao and Hastie2021). Henceforth, all references to
$X_{\mathcal{A}^{\mathrm{C}}}$
, see Zhao and Hastie (Reference Zhao and Hastie2021). Henceforth, all references to $\mu$
will, unless stated explicitly, treat
$\mu$
will, unless stated explicitly, treat $\mu$
as a conditional expected value of
$\mu$
as a conditional expected value of $Y$
.
$Y$
.
Remark 1.
-
(a) The PD function (6) w.r.t. a potentially exogenously given $\mu$
is expressed in terms of an unconditional expectation w.r.t.
$X_{\mathcal{A}^{\mathrm{C}}}$
. This is qualitatively different to(7)which relies on the distribution of
\begin{align} \mu (x_{\mathcal{A}}) \;:\!=\;{\mathbb{E}}[\mu (X_{\mathcal{A}}, X_{\mathcal{A}^{\mathrm{C}}}) \mid X_{\mathcal{A}} = x_{\mathcal{A}}], \end{align}
$X_{\mathcal{A}^{\mathrm{C}}} \mid X_{\mathcal{A}}$
.
$\mu$
is expressed in terms of an unconditional expectation w.r.t.
$X_{\mathcal{A}^{\mathrm{C}}}$
. This is qualitatively different to(7)which relies on the distribution of
\begin{align} \mu (x_{\mathcal{A}}) \;:\!=\;{\mathbb{E}}[\mu (X_{\mathcal{A}}, X_{\mathcal{A}^{\mathrm{C}}}) \mid X_{\mathcal{A}} = x_{\mathcal{A}}], \end{align}
$X_{\mathcal{A}^{\mathrm{C}}} \mid X_{\mathcal{A}}$
.
Further, note that the PD function aims at isolating the effect of
$X_{\mathcal{A}}$
, when adjusting for potential association with the remaining covariates. This is not the case for Equation (7), where effects in
$x_{\mathcal{A}}$
could be an artifact of a strong association with (a subset of the covariates in)
$X_{\mathcal{A}^{\mathrm{C}}}$
.Another related alternative is to use accumulated local effects (ALEs), see Apley and Zhu (Reference Apley and Zhu2020), which is closely connected to (7) but makes use of a local approximation, and, hence suffers from similar problems as Equation (7). See also the discussion about PDs and ALEs in Henckaerts et al. (Reference Henckaerts, Antonio and Côté2022).
-
(b) If the ambition is to construct a black-box guided (categorical) GLM model, it could be an alternative to apply the black-box model directly to subsets of covariates, i.e.
but recall Remark 1(a). Also, note that this will likely become computationally intensive, and the sub-models based on
\begin{align*} \mu (x_{\mathcal{A}}) \;:\!=\;{\mathbb{E}}[Y \mid X_{\mathcal{A}} = x_{\mathcal{A}}], \end{align*}
$\mu (x_{\mathcal{A}})$
are models that would not have been used in practice, and the models are in general not consistent with the original full model
$\mu (x)$
.
-
(c) In practice, when using PD functions a potentially exogenous predictor
$\mu$
can be evaluated without having access to the conditional distribution of
$X_{\mathcal{A}^{\mathrm{C}}} \mid X_{\mathcal{A}}$
, as opposed to Equation (7).


2.1 Implications of partial dependence functions
From Section 2, we know that the PD function describes the expected effect that a covariate, or a subset of covariates, has on $Y$
, when adjusting for the possible dependence between covariates, recall Remark1(a). Further, since the PD functions measure the influence of (subsets of) covariates deduced from
$Y$
, when adjusting for the possible dependence between covariates, recall Remark1(a). Further, since the PD functions measure the influence of (subsets of) covariates deduced from $\mu (x)$
, i.e. not on the link-function transformed scale, the use of PD functions is not expected to identify marginal or interaction effects in the standard sense. In order to illustrate this, consider the following log-linear additive model:
$\mu (x)$
, i.e. not on the link-function transformed scale, the use of PD functions is not expected to identify marginal or interaction effects in the standard sense. In order to illustrate this, consider the following log-linear additive model:
 \begin{align} \mu (x) \;:\!=\; \exp \left \{\beta _0 + \sum _{k = 1}^d f_k(x_k) + \sum _{k = 1}^d\sum _{j \lt k} f_{j, k}(x_j, x_k)\right \}, \end{align}
where the $f$
s are, e.g., basis functions. Hence, if we let
$f$
s are, e.g., basis functions. Hence, if we let $\mathcal A = \{j\}$
, and introduce
$\mathcal A = \{j\}$
, and introduce $x_{\setminus j} \;:\!=\; x_{\mathcal{A}^{\mathrm{C}}}$
, it follows that the PD based on Equation (8) w.r.t.
$x_{\setminus j} \;:\!=\; x_{\mathcal{A}^{\mathrm{C}}}$
, it follows that the PD based on Equation (8) w.r.t. $x_j$
reduces to
$x_j$
reduces to
 \begin{align} {\mathrm{PD}}(x_j) &={\exp \{f_j(x_j)\}\exp \{\beta _0\}\int \exp \left \{\sum _{k \neq j} f_k(x_k) + \sum _{k = 1}^d\sum _{j \lt k} f_{j, k}(x_j, x_k)\right \}{{\mathrm{d}}} \mathbb{P}(x_{\setminus j})}\nonumber \\[5pt] &= \exp \{f_j(x_j)\} \nu _{\setminus j}(x_j). \end{align}
That is, the PD function provides a marginalized effect of $x_j$
on
$x_j$
on $Y$
deduced from
$Y$
deduced from $\mu (x)$
, but it is in general not the same as
$\mu (x)$
, but it is in general not the same as $\exp \{f_j(x_j)\}$
. This, however, is expected, since based on Equation (8), it is clear that the component
$\exp \{f_j(x_j)\}$
. This, however, is expected, since based on Equation (8), it is clear that the component $f_j(x_j)$
does not have the meaning of a unique marginal effect of
$f_j(x_j)$
does not have the meaning of a unique marginal effect of $x_j$
on
$x_j$
on $Y$
, due to the presence of the
$Y$
, due to the presence of the $f_{j,k}$
s. Thus, changes in the PD function w.r.t.
$f_{j,k}$
s. Thus, changes in the PD function w.r.t. $x_j$
are related to changes in the
$x_j$
are related to changes in the $j$
th dimension of
$j$
th dimension of $\mu (x)$
, when adjusting for possible dependence between
$\mu (x)$
, when adjusting for possible dependence between $X_j$
and
$X_j$
and $X_{\setminus \{j\}}$
, see Remark1(a). Further, note that as discussed in the introduction, for our purposes the PD function is only used to construct covariate partitions. Thus, whether the absolute level of a marginal effect is correct or not, is of considerably less importance. We will come back to this discussion when describing how to construct covariate partitions in Section 2.2, see also Remark2(a) below.
$X_{\setminus \{j\}}$
, see Remark1(a). Further, note that as discussed in the introduction, for our purposes the PD function is only used to construct covariate partitions. Thus, whether the absolute level of a marginal effect is correct or not, is of considerably less importance. We will come back to this discussion when describing how to construct covariate partitions in Section 2.2, see also Remark2(a) below.
Further, note that if $f_{j, k}(\cdot ) = 0$
for all
$f_{j, k}(\cdot ) = 0$
for all $j, k$
, it follows that
$j, k$
, it follows that
 \begin{align} {\mathrm{PD}}(x_j) \propto \exp \{f_j(x_j)\}. \end{align}
In this situation, $\exp \{f_j(x_j)\}$
truly corresponds to the expected direct effect of
$\exp \{f_j(x_j)\}$
truly corresponds to the expected direct effect of $x_j$
on
$x_j$
on $Y$
, and this is, up to scaling, captured by the PD function. However, as pointed out above, this identifiability is not vital for our purposes.
$Y$
, and this is, up to scaling, captured by the PD function. However, as pointed out above, this identifiability is not vital for our purposes.
Similarly, if we instead consider bivariate PD functions and consider $\mathcal{A} = \{j, k\}$
, with
$\mathcal{A} = \{j, k\}$
, with $x_{\setminus \{j, k\}} \;:\!=\; x_{\mathcal{A}^{\mathrm{C}}}$
, analogous calculations to those for the univariate PD functions yield
$x_{\setminus \{j, k\}} \;:\!=\; x_{\mathcal{A}^{\mathrm{C}}}$
, analogous calculations to those for the univariate PD functions yield
 \begin{align} {\mathrm{PD}}(x_j, x_k) &= \exp \{f_j(x_j) + f_k(x_k) + f_{j, k}(x_j, x_k)\}\nu _{\setminus \{j, k\}}(x_j, x_k). \end{align}
This illustrates how the bivariate PD function describes the expected joint effect of $x_j$
and
$x_j$
and $x_k$
on
$x_k$
on $Y$
deduced from
$Y$
deduced from $\mu (x)$
, which, as expected, is different from identifying
$\mu (x)$
, which, as expected, is different from identifying $\exp \{f_{j, k}(x_j, x_k)\}$
.
$\exp \{f_{j, k}(x_j, x_k)\}$
.
Similar relations hold for other link functions than the log-link, but in this short note, focus will be on the log-link function.
Before ending this discussion, one can note that for the log-link it is possible to introduce an alternative identification. In order to see this, consider the situation where $\mu (x)$
is given by Equation (8) with only two covariates,
$\mu (x)$
is given by Equation (8) with only two covariates, $x_1, x_2$
, and (for ease of notation) no intercept. Based on Equation (9), introduce
$x_1, x_2$
, and (for ease of notation) no intercept. Based on Equation (9), introduce $g_j(x_i), j = 1, 2$
, such that
$g_j(x_i), j = 1, 2$
, such that
 \begin{equation*} \exp \{g_j(x_j)\} \;:\!=\; \exp \{f_j(x_j)\} \nu _{\setminus j}(x_j), \end{equation*}
and introduce $g_{1, 2}(x_1, x_2)$
such that
$g_{1, 2}(x_1, x_2)$
such that
 \begin{equation*} \exp \{g_1(x_1) + g_2(x_2) + g_{1, 2}(x_1, x_2)\} \;:\!=\; \mu (x), \end{equation*}
i.e.
 \begin{equation*} \exp \{g_{1, 2}(x_1, x_2)\} \;:\!=\; \frac {\exp \{f_{1, 2}(x_1, x_2)\}}{\nu _{\setminus 1}(x_1)\nu _{\setminus 2}(x_2)}. \end{equation*}
Thus, by construction, it then holds that
 \begin{equation*} {\mathrm {PD}}(x_j) = \exp \{g_j(x_j)\}, \, j = 1, 2, \end{equation*}
together with that
 \begin{equation*} \frac {{\mathrm {PD}}(x_1, x_2)}{{\mathrm {PD}}(x_1){\mathrm {PD}}(x_2)} = \exp \{g_{1, 2}(x_1, x_2)\}, \end{equation*}
which provides us with identifiability w.r.t. alternative factor effects given by $g_1(x_1), g_2(x_2)$
, and
$g_1(x_1), g_2(x_2)$
, and $g_{1, 2}(x_1, x_2)$
.
$g_{1, 2}(x_1, x_2)$
.
From the above discussion of $\mathrm{PD}$
functions, it is clear that these may serve as a way to identify the sensitivity of a covariate, or set of covariates, with respect to
$\mathrm{PD}$
functions, it is clear that these may serve as a way to identify the sensitivity of a covariate, or set of covariates, with respect to $\mu (x)$
. This is precisely how the
$\mu (x)$
. This is precisely how the $\mathrm{PD}$
functions will be used for covariate engineering purposes in Sections 2.2 and 3.
$\mathrm{PD}$
functions will be used for covariate engineering purposes in Sections 2.2 and 3.
2.2 Covariate engineering, PD functions, and marginal auto-calibration
As discussed when introducing the expectation representation of the PD function in Equation (6), see also Remark1(a), the PD function of $X_{\mathcal{A}}$
aims at isolating the expected effect of
$X_{\mathcal{A}}$
aims at isolating the expected effect of $X_{\mathcal{A}}$
, when adjusting for potential influence from
$X_{\mathcal{A}}$
, when adjusting for potential influence from $X_{\mathcal{A}^{\mathrm{C}}}$
. This suggests to use of PD functions for covariate engineering w.r.t. individual covariates, which allows us to partition the covariate space and, ultimately, construct a data-driven categorical GLM. That is, if
$X_{\mathcal{A}^{\mathrm{C}}}$
. This suggests to use of PD functions for covariate engineering w.r.t. individual covariates, which allows us to partition the covariate space and, ultimately, construct a data-driven categorical GLM. That is, if ${\mathrm{PD}}(x_j) \in B$
, we can construct the corresponding covariate set on the original covariate scale according to:
${\mathrm{PD}}(x_j) \in B$
, we can construct the corresponding covariate set on the original covariate scale according to:
 \begin{equation*} x_j \in \mathbb {B} \;:\!=\; \{x_j^* \in \mathbb {X}_j \;:\; {\mathrm {PD}}(x_j^*) \in B\}. \end{equation*}
This allows us to use the PD function to partition $\mathbb{X}_j$
, based on where
$\mathbb{X}_j$
, based on where $X_j$
is similar in terms of PD function values, which can be generalized to tuples of covariates.
$X_j$
is similar in terms of PD function values, which can be generalized to tuples of covariates.
In order to construct a partition based on PD functions, consider a sequence of $b_j^{(k)}$
s such that
$b_j^{(k)}$
s such that
 \begin{align} -\infty \le b_j^{(0)} \lt b_j^{(1)} \lt \ldots \lt b_j^{(\kappa - 1)} \lt b_j^{(\kappa )} \le + \infty, \end{align}
and set $B_j^{(k)} \;:\!=\; (b_j^{(k - 1)}, b_j^{(k)}]$
, i.e.
$B_j^{(k)} \;:\!=\; (b_j^{(k - 1)}, b_j^{(k)}]$
, i.e. $\cup _{k = 1}^\kappa B_j^{(k)} = \mathbb{R}$
. The corresponding partition of
$\cup _{k = 1}^\kappa B_j^{(k)} = \mathbb{R}$
. The corresponding partition of $\mathbb{X}_j$
, denoted
$\mathbb{X}_j$
, denoted $\Pi _j \;:\!=\; (\mathbb{B}_j^{(k)})_{k = 1}^\kappa$
, is defined in terms of the parts
$\Pi _j \;:\!=\; (\mathbb{B}_j^{(k)})_{k = 1}^\kappa$
, is defined in terms of the parts
 \begin{align} \mathbb{B}_j^{(k)} \;:\!=\; \{x_j^* \in \mathbb{X}_j \;:\; {\mathrm{PD}}(x_j^*) \in B_j^{(k)}\}, \, k = 1, \ldots, \kappa . \end{align}
That is, the pre-image of the PD function w.r.t. $B_j^{(k)}$
defines the corresponding covariate set
$B_j^{(k)}$
defines the corresponding covariate set $\mathbb{B}_j^{(k)}$
such that
$\mathbb{B}_j^{(k)}$
such that $\cup _{k = 1}^\kappa \mathbb{B}_j^{(k)} = \mathbb{X}_j$
. Thus, without having specified how to obtain a partition of the real line according to Equation (12), including both the size of the partition,
$\cup _{k = 1}^\kappa \mathbb{B}_j^{(k)} = \mathbb{X}_j$
. Thus, without having specified how to obtain a partition of the real line according to Equation (12), including both the size of the partition, $\kappa$
, and the location of split points, the
$\kappa$
, and the location of split points, the $b_j^{(k)}$
s, it is clear that given such a partition the procedure outlined above can be used to construct a categorical GLM in agreement with Equation (3). Further, since the aim is to construct a categorical GLM with good predictive accuracy in terms of mean predictions, it is reasonable to only keep the parts in the partition
$b_j^{(k)}$
s, it is clear that given such a partition the procedure outlined above can be used to construct a categorical GLM in agreement with Equation (3). Further, since the aim is to construct a categorical GLM with good predictive accuracy in terms of mean predictions, it is reasonable to only keep the parts in the partition $\Pi _j$
that actually impacts the response. In particular, note that
$\Pi _j$
that actually impacts the response. In particular, note that
 \begin{align} \overline{\mu }_j^{(k)} \;:\!=\;{\mathbb{E}}[Y \mid X_j \in \mathbb{B}_j^{(k)}], \, k = 1, \ldots, \kappa, \end{align}
which allows us to introduce the following piece-wise constant mean predictor
 \begin{align} \overline{\mu }_j(X_j) \;:\!=\; \sum _{k = 1}^\kappa \overline{\mu }_j^{(k)}\textit{1}_{\{X_j \in \mathbb{B}_j^{(k)}\}}, \quad \overline{\mu }_j^{(k)} \in \mathbb{R}. \end{align}
In addition, note that if we assume that the $\overline{\mu }_j^{(k)}$
s is unique, which typically is the case, it holds that
$\overline{\mu }_j^{(k)}$
s is unique, which typically is the case, it holds that
 \begin{align} \{X_j(\omega ) \in \mathbb{B}_j^{(k)}\} = \{\overline{\mu }_j(X_j)(\omega ) = \overline{\mu }_j^{(k)}\}, \end{align}
together with
 \begin{align} \overline{\mu }_j(X_j) ={\mathbb{E}}[Y \mid \overline{\mu }_j(X_j)], \end{align}
where Equation (17) precisely corresponds to that $\overline{\mu }_j(X_j)$
is auto-calibrated (AC), see Krüger and Ziegel (Reference Krüger and Ziegel2021); Denuit et al. (Reference Denuit, Charpentier and Trufin2021). A consequence of this is that, given the information contained in
$\overline{\mu }_j(X_j)$
is auto-calibrated (AC), see Krüger and Ziegel (Reference Krüger and Ziegel2021); Denuit et al. (Reference Denuit, Charpentier and Trufin2021). A consequence of this is that, given the information contained in $\overline{\mu }_j(X_j)$
, the predictor cannot be improved upon, and the predictor is both locally and globally unbiased. In particular, if we let
$\overline{\mu }_j(X_j)$
, the predictor cannot be improved upon, and the predictor is both locally and globally unbiased. In particular, if we let $\widetilde{\overline{\mu }}_j(X_j)$
be a version of
$\widetilde{\overline{\mu }}_j(X_j)$
be a version of $\overline{\mu }_j(X_j)$
where a number of categories have been merged, i.e. the
$\overline{\mu }_j(X_j)$
where a number of categories have been merged, i.e. the $\sigma$
-algebra generated by
$\sigma$
-algebra generated by $\widetilde{\overline{\mu }}_j(X_j)$
is coarser than the one generated by
$\widetilde{\overline{\mu }}_j(X_j)$
is coarser than the one generated by $\overline{\mu }_j(X_j)$
, it holds that both
$\overline{\mu }_j(X_j)$
, it holds that both ${\mathbb{E}}[Y \mid \overline{\mu }_j(X_j)]$
and
${\mathbb{E}}[Y \mid \overline{\mu }_j(X_j)]$
and ${\mathbb{E}}[Y \mid \widetilde{\overline{\mu }}_j(X_j)]$
are AC predictors, and
${\mathbb{E}}[Y \mid \widetilde{\overline{\mu }}_j(X_j)]$
are AC predictors, and ${\mathbb{E}}[Y \mid \overline{\mu }_j(X_j)]$
outperforms
${\mathbb{E}}[Y \mid \overline{\mu }_j(X_j)]$
outperforms ${\mathbb{E}}[Y \mid \widetilde{\overline{\mu }}_j(X_j)]$
in terms of predictive performance, see Theorem 3.1 and Proposition 3.1 in Krüger and Ziegel (Reference Krüger and Ziegel2021). This, however, is a theoretical result, assuming access to an infinite amount of data. In practice, the
${\mathbb{E}}[Y \mid \widetilde{\overline{\mu }}_j(X_j)]$
in terms of predictive performance, see Theorem 3.1 and Proposition 3.1 in Krüger and Ziegel (Reference Krüger and Ziegel2021). This, however, is a theoretical result, assuming access to an infinite amount of data. In practice, the $\overline \mu _j^{(k)}$
s are estimated using data and we only want to keep the
$\overline \mu _j^{(k)}$
s are estimated using data and we only want to keep the $\overline \mu _j^{(k)}$
s that generalize well to unseen data. That is, those
$\overline \mu _j^{(k)}$
s that generalize well to unseen data. That is, those $\overline \mu _j^{(k)}$
s that do not generalize are merged, and from Equation (16), we know that merging of
$\overline \mu _j^{(k)}$
s that do not generalize are merged, and from Equation (16), we know that merging of $\;\overline \mu _j^{(k)}$
s is equivalent to merging the corresponding parts in the covariate partition. Consequently, in order to find the most parsimonious covariate partition based on data, we will, in Section 3, introduce a procedure that combines Equation (17) with an out-of-sample loss minimization using cross-validation (CV). We refer to this as a marginal AC step.
$\;\overline \mu _j^{(k)}$
s is equivalent to merging the corresponding parts in the covariate partition. Consequently, in order to find the most parsimonious covariate partition based on data, we will, in Section 3, introduce a procedure that combines Equation (17) with an out-of-sample loss minimization using cross-validation (CV). We refer to this as a marginal AC step.
This procedure is analogously defined for tuples of covariates, and a precise implementation is described in Section 3.
Remark 2.
-
(a) If we consider a numerical covariate, the idea of using a PD function to construct a covariate partition is only relevant when the PD function is not strictly monotone, since otherwise we could just as well partition the covariate directly based on, e.g., quantile values. Note that this comment applies to the procedure used in Henckaerts et al. (Reference Henckaerts, Antonio and Côté2022) as well, and it applies if we would change from using PD functions to using, e.g., ALEs or other covariate effect measures. If the PD function would be monotone, but not strictly monotone, then the PD function of the underlying black-box predictor implies a coarsening of the covariate space.
Further, from the above construction, it is clear that the PD function is only used to construct covariate partitions. That is, the actual impact on the response, here measured in terms of PD functions values, is of lesser importance, as long as the PD function changes when the covariate values change. Consequently, it is the sensitivity of the measure being used, here PD functions, that matters, not the level. The same comment, of course, applies if we use e.g. ALEs; for more on ALEs and PD functions, see Apley and Zhu (Reference Apley and Zhu2020) and Henckaerts et al. Reference Henckaerts, Antonio and Côté2022). Also, recall Remark 1(a) above.
-
(b) The output of (17) in the AC step is not a new PD function, but a conditional expected value. Still, the partitioning will be based on similarity in terms of PD function values, but those parts in the partition that do not affect the response will be removed. If one instead favor models with as high fidelity w.r.t. the original black-box predictor, i.e. a so-called surrogate model, see e.g. Henckaerts et al. (Reference Henckaerts, Antonio and Côté2022), the AC step is problematic for, e.g., ordered categories, since the merging of categories does not respect ordering. The corresponding step in the algorithm of Henckaerts et al. (Reference Henckaerts, Antonio and Côté2022), see their Algorithm1, merges categories only based on fidelity to the original PD function, see their Equation (2). Also note that for numerical and ordinal covariates the procedure in Henckaerts et al. (Reference Henckaerts, Antonio and Côté2022) only merges PD function values that have adjacent covariate values.
3. Constructing a guided categorical GLM
The aim of the present note is to introduce a method of constructing a classical categorical GLM that is guided by a given black-box predictor. The main step is to define covariate partitions that define categorical versions of the initial covariates and interactions. Since the aim is to construct categorical covariates, the method will be applied to all initial covariates that are non-categorical.
The first step in creating a guided GLM is to calculate the PD function values from the external black-box predictor $\widehat \mu (x)$
. This needs to be done for each covariate dimension, and for all covariate tuples. We will start by focusing on single covariates, noting that tuples are handled analogously.
$\widehat \mu (x)$
. This needs to be done for each covariate dimension, and for all covariate tuples. We will start by focusing on single covariates, noting that tuples are handled analogously.
Next, in order to construct the covariate partitions for each covariate dimension $j$
, we need to the decide on the number of parts in the partition,
$j$
, we need to the decide on the number of parts in the partition, $\kappa$
, together with the split points
$\kappa$
, together with the split points $b_j^{(k)}$
.
$b_j^{(k)}$
.
In the present note, we suggest doing this using $L^2$
-regression trees and CV. To see why this is reasonable, recall that an
$L^2$
-regression trees and CV. To see why this is reasonable, recall that an $L^2$
-regression tree can be represented as:
$L^2$
-regression tree can be represented as:
 \begin{align*} T(x) \;:\!=\; \sum _{k = 1}^\kappa \delta _k \textit{1}_{\{x \in \mathbb{G}_k\}},\, \delta _k \in \mathbb{R}, \end{align*}
where $\cup _{k = 1}^\kappa \mathbb{G}_k \;=\!:\; \mathbb{X}$
, see e.g. (Hastie et al. Reference Hastie, Tibshirani and Friedman2009, Ch. 9), which is of the same form as
$\cup _{k = 1}^\kappa \mathbb{G}_k \;=\!:\; \mathbb{X}$
, see e.g. (Hastie et al. Reference Hastie, Tibshirani and Friedman2009, Ch. 9), which is of the same form as $\overline{\mu }_j$
from Equation (15):
$\overline{\mu }_j$
from Equation (15):
 \begin{align*} \overline{\mu }_j(x_j) \;:\!=\; \sum _{k = 1}^\kappa \overline{\mu }_j^{(k)}\textit{1}_{\{x_j \in \mathbb{B}_j^{(k)}\}}. \end{align*}
Further, in this short note, we will use $L^2$
-regression trees estimated using square loss in a greedy manner, using CV, see e.g. (Hastie et al. Reference Hastie, Tibshirani and Friedman2009, Ch. 7). That is, the empirical loss that will be (greedily) minimized is given by:
$L^2$
-regression trees estimated using square loss in a greedy manner, using CV, see e.g. (Hastie et al. Reference Hastie, Tibshirani and Friedman2009, Ch. 7). That is, the empirical loss that will be (greedily) minimized is given by:
 \begin{align} \widehat{\overline{\mu }}_j(x_j) \;:\!=\; \textrm{arg min}_{T \in \mathcal{T}_\kappa } \sum _{i = 1}^n w_i (y_i - T((x_j)_i))^2, \end{align}
where $(x_j)_i$
denotes the
$(x_j)_i$
denotes the $i$
th observation of the
$i$
th observation of the $x_j$
th covariate, where the
$x_j$
th covariate, where the $w_i$
weights have been added in order to agree with the GLM assumptions from Equation (1), and where
$w_i$
weights have been added in order to agree with the GLM assumptions from Equation (1), and where $\mathcal{T}_\kappa$
corresponds to the set of binary regression trees with at most
$\mathcal{T}_\kappa$
corresponds to the set of binary regression trees with at most $\kappa$
terminal nodes. Consequently, decreasing
$\kappa$
terminal nodes. Consequently, decreasing $\kappa$
corresponds to merging covariate regions
$\kappa$
corresponds to merging covariate regions $\mathbb{B}_j^{(k)}$
s, which is equivalent to coarsening the covariate partition, since the tree-based partition is defined recursively using binary splits. Moreover, note that due to Equation (13), the described tree-fitting procedure is equivalent to fitting an
$\mathbb{B}_j^{(k)}$
s, which is equivalent to coarsening the covariate partition, since the tree-based partition is defined recursively using binary splits. Moreover, note that due to Equation (13), the described tree-fitting procedure is equivalent to fitting an $L^2$
-regression tree using
$L^2$
-regression tree using ${\mathrm{PD}}(x_j)$
as the single numerical covariate. As a consequence of this, the definition of the resulting
${\mathrm{PD}}(x_j)$
as the single numerical covariate. As a consequence of this, the definition of the resulting $\mathbb{B}_j^{(k)}$
s will be implicitly defined in terms of the corresponding
$\mathbb{B}_j^{(k)}$
s will be implicitly defined in terms of the corresponding $\mathrm{PD}$
-function.
$\mathrm{PD}$
-function.
Furthermore, due to the relation (16), it is possible to extract a categorical covariate version of $x_j$
from the fitted predictor
$x_j$
from the fitted predictor $\widehat{\overline{\mu }}_j(x_j)$
, which will take on at most
$\widehat{\overline{\mu }}_j(x_j)$
, which will take on at most $\kappa$
covariate values.
$\kappa$
covariate values.
Continuing, the motivation for using $L^2$
-trees instead of, e.g., a Tweedie loss is because all Tweedie losses that are special cases of the Bregman deviance losses, see Denuit et al. (Reference Denuit, Charpentier and Trufin2021), result in the same mean predictor for a given part
$L^2$
-trees instead of, e.g., a Tweedie loss is because all Tweedie losses that are special cases of the Bregman deviance losses, see Denuit et al. (Reference Denuit, Charpentier and Trufin2021), result in the same mean predictor for a given part $\mathbb{B}_j^{(k)}$
in the partition, see e.g. Lindholm and Nazar (Reference Lindholm and Nazar2024). In particular, note that the resulting
$\mathbb{B}_j^{(k)}$
in the partition, see e.g. Lindholm and Nazar (Reference Lindholm and Nazar2024). In particular, note that the resulting $\widehat{\overline{\mu }}_j$
s correspond to empirical means, regardless of the Tweedie loss function used. For alternatives to using
$\widehat{\overline{\mu }}_j$
s correspond to empirical means, regardless of the Tweedie loss function used. For alternatives to using $L^2$
-regression trees to achieve auto-calibration, see e.g. Denuit et al. (Reference Denuit, Charpentier and Trufin2021); Wüthrich and Ziegel (2023).
$L^2$
-regression trees to achieve auto-calibration, see e.g. Denuit et al. (Reference Denuit, Charpentier and Trufin2021); Wüthrich and Ziegel (2023).
Consequently, by fitting $L^2$
-regression trees and using CV to decide on the optimal number of terminal nodes
$L^2$
-regression trees and using CV to decide on the optimal number of terminal nodes $\kappa ^*$
, where
$\kappa ^*$
, where $1 \le \kappa ^* \le \kappa$
, which defines the coarseness of the partition, combines the search for suitable split points and a greedy coarsening of the covariate partition using auto-calibration into a single step. This corresponds to Step A in Algorithm1 describing the construction of a guided categorical GLM.
$1 \le \kappa ^* \le \kappa$
, which defines the coarseness of the partition, combines the search for suitable split points and a greedy coarsening of the covariate partition using auto-calibration into a single step. This corresponds to Step A in Algorithm1 describing the construction of a guided categorical GLM.
If the procedure from Section 2.2 is applied to all covariates and interactions, the resulting number of categorical levels, and, hence, $\beta$
coefficients to be estimated in Equation (3) can become very large. This suggests that regularization techniques should be used when fitting the final categorical GLM. One way of achieving this is to use
$\beta$
coefficients to be estimated in Equation (3) can become very large. This suggests that regularization techniques should be used when fitting the final categorical GLM. One way of achieving this is to use $L^1$
-regularisation or so-called lasso-regularisation, see e.g. (Hastie et al. Reference Hastie, Tibshirani and Wainwright2015, Ch. 3). If we consider EDF models, this means that we, given the
$L^1$
-regularisation or so-called lasso-regularisation, see e.g. (Hastie et al. Reference Hastie, Tibshirani and Wainwright2015, Ch. 3). If we consider EDF models, this means that we, given the $\mathbb{B}_\bullet ^{(k)}$
s, use the following penalized deviance loss function:
$\mathbb{B}_\bullet ^{(k)}$
s, use the following penalized deviance loss function:
 \begin{align} D(y;\; \beta, \lambda ) \;:\!=\; \sum _{i = 1}^n w_i d(y_i, \mu (x_i;\; \beta )) + \lambda |\beta |, \end{align}
which is the loss from Equation (4), but where the $L^1$
-penalty term
$L^1$
-penalty term $\lambda |\beta |$
has been added, where
$\lambda |\beta |$
has been added, where $\lambda$
is the penalty parameter. The
$\lambda$
is the penalty parameter. The $\lambda$
-parameter is chosen using
$\lambda$
-parameter is chosen using $k$
-fold CV.
$k$
-fold CV.
Moreover, if the covariate vector $x$
is high-dimensional, it can be demanding already to evaluate all two-way interactions fully. An alternative is here to consider only those two-way interactions that are believed to have an impact on the final model. This can be achieved by using Friedman’s
$x$
is high-dimensional, it can be demanding already to evaluate all two-way interactions fully. An alternative is here to consider only those two-way interactions that are believed to have an impact on the final model. This can be achieved by using Friedman’s $H$
statistic, see Friedman and Popescu (Reference Friedman and Popescu2008):
$H$
statistic, see Friedman and Popescu (Reference Friedman and Popescu2008):
 \begin{align} H_{j, k} = \frac{\widehat{\mathbb{E}}[({\mathrm{PD}}(X_j, X_k) -{\mathrm{PD}}(X_j) -{\mathrm{PD}}(X_k))^2]}{\widehat{\mathbb{E}}[{\mathrm{PD}}(X_j, X_k)^2]}, \end{align}
where $\widehat{\mathbb{E}}[\cdot ]$
refers to the empirical expectation. That is, Equation (20) provides an estimate of the amount of excess variation in
$\widehat{\mathbb{E}}[\cdot ]$
refers to the empirical expectation. That is, Equation (20) provides an estimate of the amount of excess variation in ${\mathrm{PD}}(X_j, X_k)$
compared with
${\mathrm{PD}}(X_j, X_k)$
compared with ${\mathrm{PD}}(X_j) +{\mathrm{PD}}(X_k)$
.
${\mathrm{PD}}(X_j) +{\mathrm{PD}}(X_k)$
.
By combining all of the above, focusing on a categorical GLM with at most two-way interactions, we arrive at Algorithm1. Of course, if two-way interactions turn out to be insufficient, the procedure can be extended analogously to consider higher-order interactions as well.
Remark 3.
-
(a) Note that there is a qualitative difference between using
$L^2$
-trees, or other deviance-based binary trees, and using
$L^1$
-penalisation: Trees merge categories (parts in a partition), whereas using an
$L^1$
-penalty will remove categories, or, equivalently, merge removed categories with a global intercept. -
(b) In practice, it may be computationally costly to evaluate
${\mathrm{PD}}(x_j)$
in all observed values when
$x_j$
is continuous. If this is the case one may, e.g., use a piece-wise constant step-function approximation of
${\mathrm{PD}}(x_j)$
. This is what will be used in the numerical illustrations in Section 4. -
(c) The
$L^1$
-penalty from Equation (19) has a single
$\lambda$
applied to all
$\beta$
-coefficients. An alternative is to use a grouped penalty, see e.g. (Hastie et al. Reference Hastie, Tibshirani and Wainwright2015, Ch. 4). That is, one could, e.g., use one
$\lambda$
-penalty for individual covariates and one
$\lambda$
for interaction terms, see e.g. Henckaerts et al. (Reference Henckaerts, Antonio and Côté2022).


– Guided GLM

4. Numerical illustrations
In the current section, we will construct guided categorical GLMs based on reference models that are GBMs, following the procedure described in Algorithm1, using the freMTPL, beMTPL, auspriv, and norauto data sets available in the R-package CASdataset, see Dutang and Charpentier (Reference Dutang and Charpentier2020). Only Poisson claim count models will be considered, i.e. the Poisson deviance
 \begin{align} D_{\mathrm{Pois}}(y;\; \mu ) \;:\!=\; \sum _{i = 1}^n w_i\left (y_i\log (y_i) - y_i\log (\mu _i) - y_i - \mu _i\right ), \end{align}
will be used for model estimation and prediction evaluation. Concerning data, for all data sets analyzed 2/3 of the data have been used for in-sample training, and 1/3 for out-of-sample (hold out) evaluation.
Further, all GBM models use a tree depth of two, 0.01 learning rate, and a bag fraction of 0.75 corresponding to the fraction of training data used for each tree iteration. The maximum number of trees is set to 4 000 with the optimal number chosen via 5-fold CV and the remaining hyperparameters are the default levels in the R-package GBM. Hence, hyperparameters for the GBM modeling are the same as those used in Henckaerts et al. (Reference Henckaerts, Antonio and Côté2022), as described in Section 3.2.1. The R-implementation used can be found at https://github.com/Johan246/Boosting-GLM.git
When implementing Algorithm1 the number of interaction terms is set to 5 ( $\gamma$
) and the maximum size of the partition is set to 30 (
$\gamma$
) and the maximum size of the partition is set to 30 ( $\kappa$
). Concerning the hyperparameters for the
$\kappa$
). Concerning the hyperparameters for the $L^2$
-trees (
$L^2$
-trees ( $\theta _{tree}$
), the minimum number of observations per node is set to 10 and the cost penalty parameter is set to 0.00001 in order to allow for very deep un-pruned trees, after which the optimal tree size, including pruning, is determined using CV as implemented according to the rpart-package in R.
$\theta _{tree}$
), the minimum number of observations per node is set to 10 and the cost penalty parameter is set to 0.00001 in order to allow for very deep un-pruned trees, after which the optimal tree size, including pruning, is determined using CV as implemented according to the rpart-package in R.
As commented on in Remark3(2), the computational cost of calculating the PD function values for all observed covariates becomes infeasible. Due to this, all numerical covariates’ $\mathrm{PD}$
-functions are approximated as piece-wise constant step functions that only jump at
$\mathrm{PD}$
-functions are approximated as piece-wise constant step functions that only jump at $\kappa$
values corresponding to equidistant covariate percentile values.
$\kappa$
values corresponding to equidistant covariate percentile values.
Apart from the reference GBM model, the surrogate model from Henckaerts et al. (Reference Henckaerts, Antonio and Côté2022), maidrr, will be used for comparison and the R package with the same name is used in all numerical illustrations.
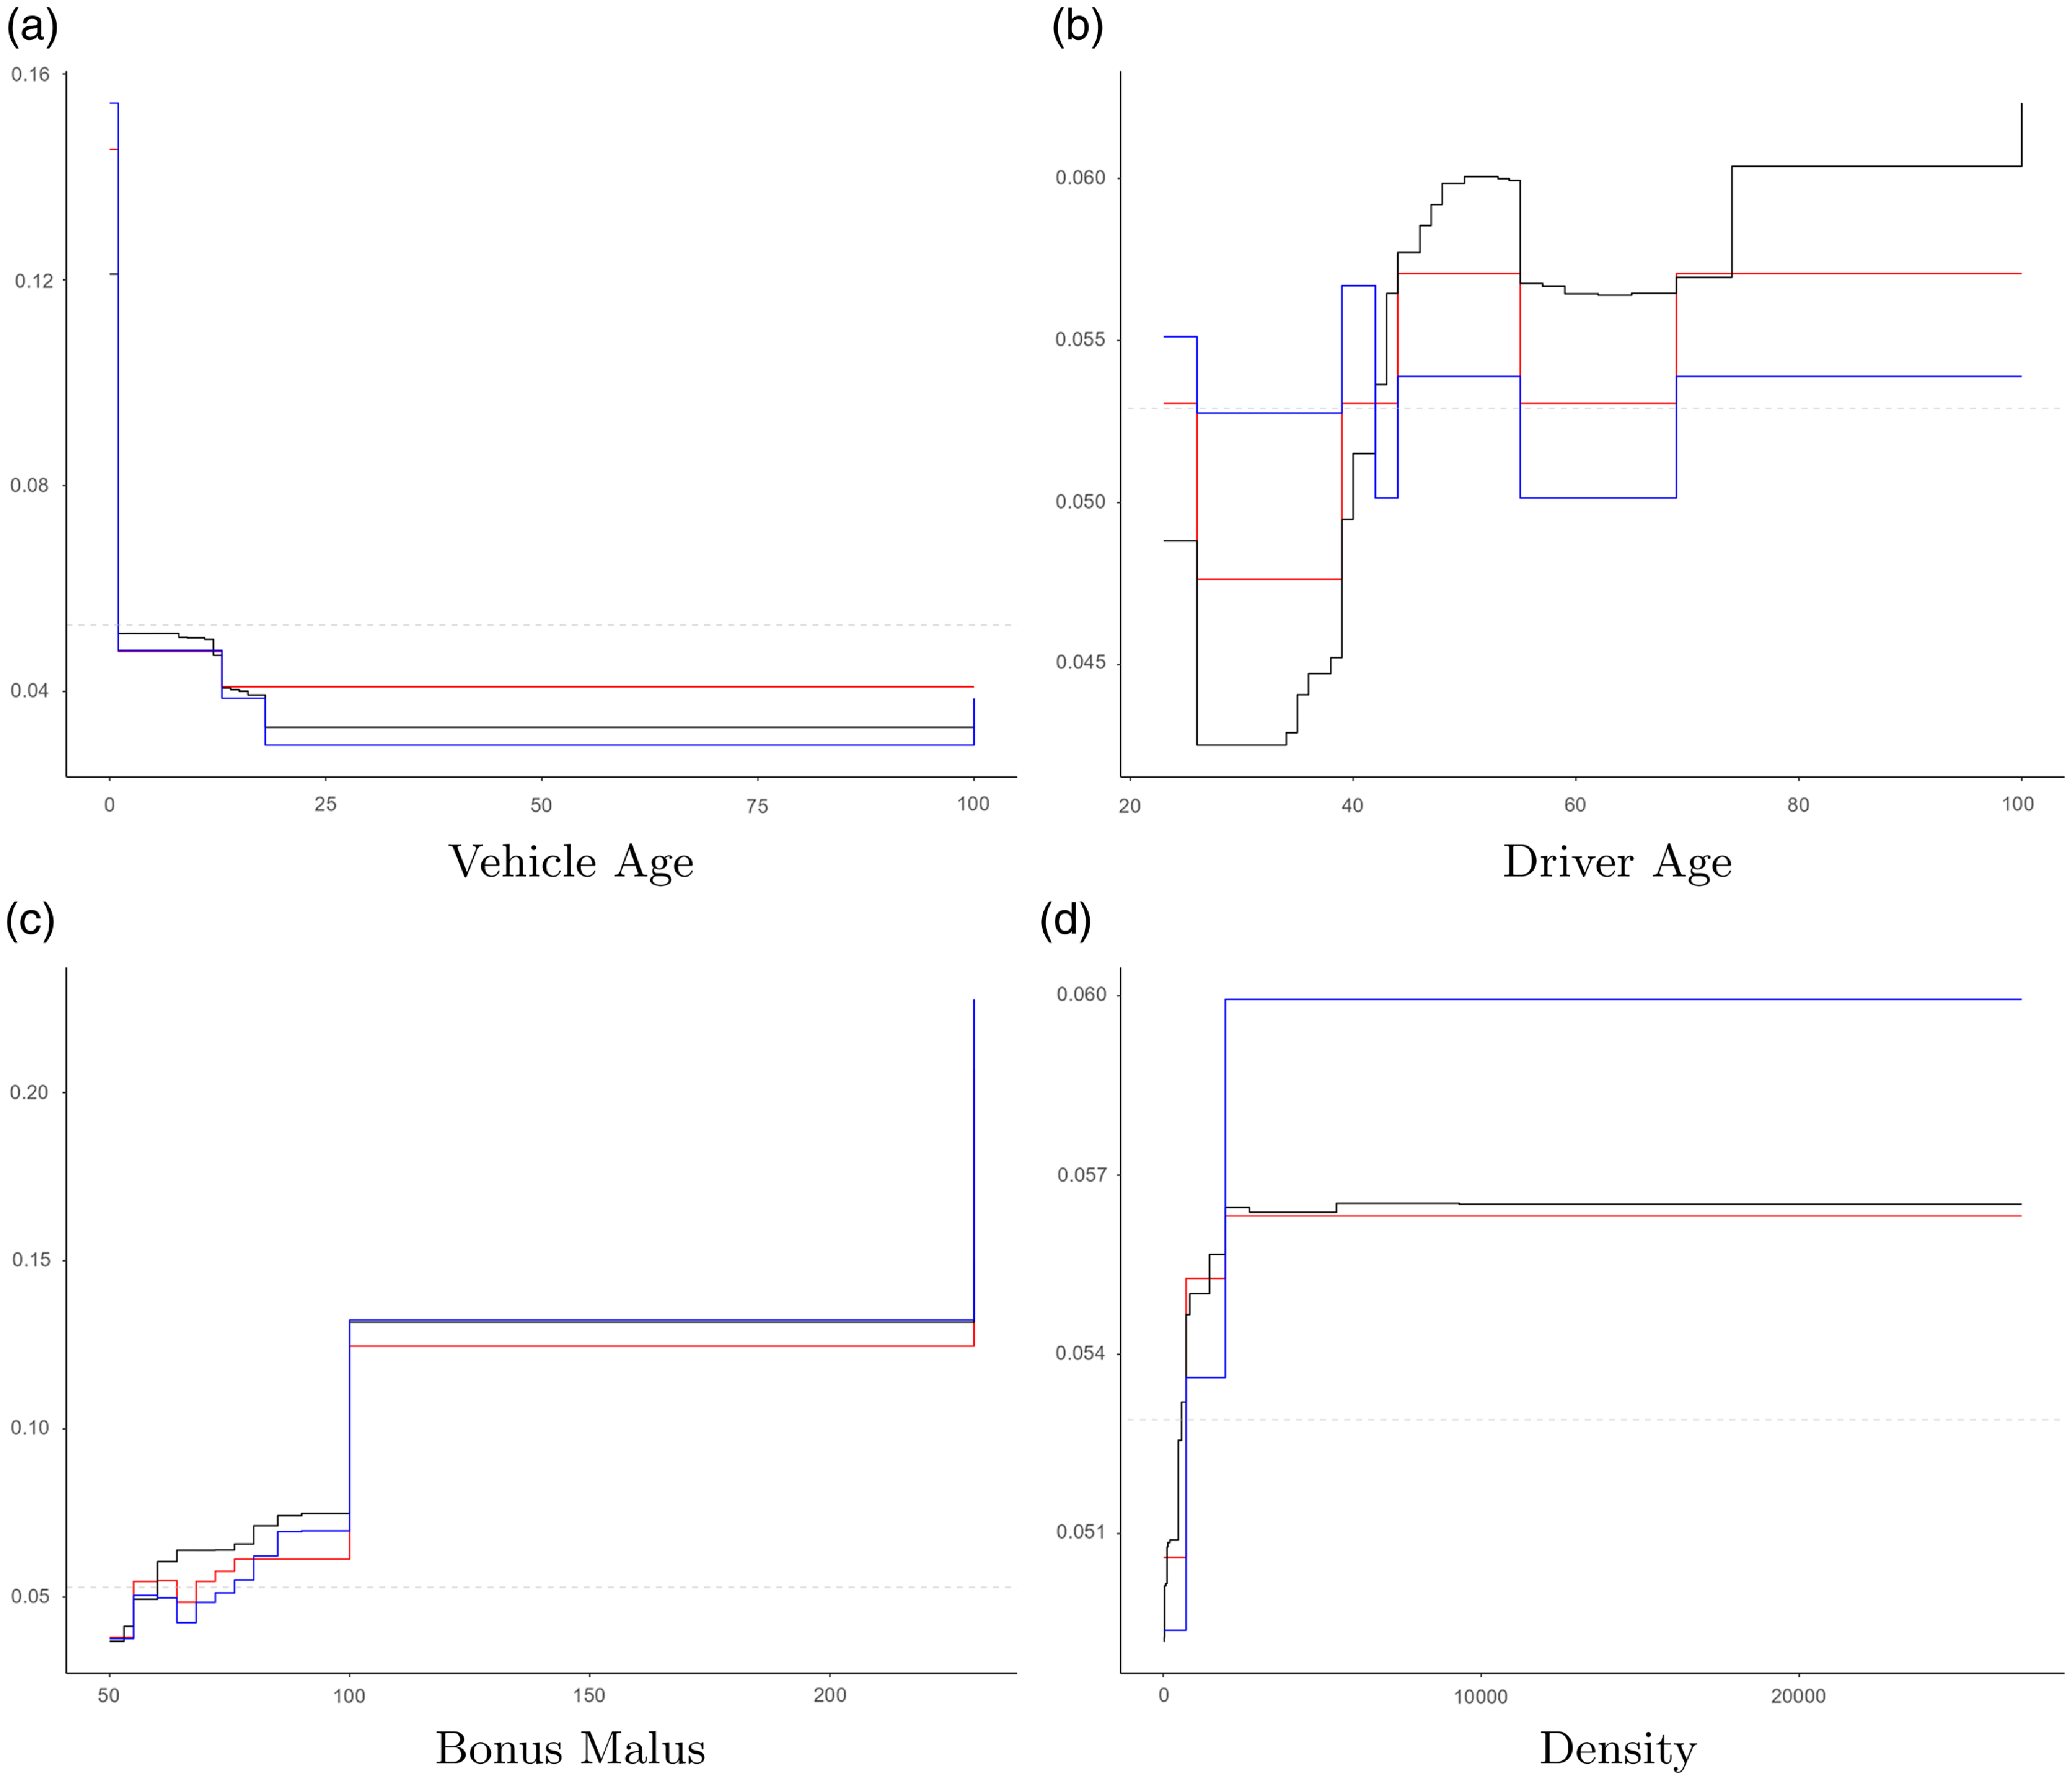
From Algorithm1, it is clear that there is no ambition to replicate the PD functions of the initial model, which here is a GBM. An example of PD functions for the different models for the freMTPL data is given in Fig. 1. From Fig. 1 it is also seen that the GBM’s PD functions are monotone for the covariates “Vehicle age” and “Bonus Malus,” but not strictly monotone. If these would have been strictly monotone, the covariates could have been adjusted directly using $L^2$
trees, see Remark2(a); as we can see from the GBM’s PD function plot, there are multiple covariate values having the same PD function value, which indicates that the GBM has introduced a coarsening of the covariate space. Moreover, from Fig. 1 it is also seen that the number of categories in the guided categorical GLM is reduced by using a final lasso (
$L^2$
trees, see Remark2(a); as we can see from the GBM’s PD function plot, there are multiple covariate values having the same PD function value, which indicates that the GBM has introduced a coarsening of the covariate space. Moreover, from Fig. 1 it is also seen that the number of categories in the guided categorical GLM is reduced by using a final lasso ( $L^1$
) step in Algorithm1. Further, the number of active parameters, i.e. non-zero
$L^1$
) step in Algorithm1. Further, the number of active parameters, i.e. non-zero $\beta$
regression coefficients in Equation (3), in the final guided categorical GLM are summarized in Table 1, and it can be noted that the number of parameters tends to be very low.
$\beta$
regression coefficients in Equation (3), in the final guided categorical GLM are summarized in Table 1, and it can be noted that the number of parameters tends to be very low.
Comparison of model factor effects (partial dependence-function plots) for the freMTPL data between initial gradient boosting machine model (black lines), guided categorical generalized linear model including final lasso ( $L^1$
) step (red lines), and a model including all levels found by the tree-calibration (blue lines).
$L^1$
) step (red lines), and a model including all levels found by the tree-calibration (blue lines).
Continuing, in order to compare the predictive performance of the guided categorical GLM and the reference GBM, we calculate the out-of-sample relative difference in Poisson deviance, $\Delta D_{\mathrm{Pois}}$
. The out-of-sample relative difference in Poisson deviance between the reference GBM and candidate model
$\Delta D_{\mathrm{Pois}}$
. The out-of-sample relative difference in Poisson deviance between the reference GBM and candidate model $\widehat \mu ^\star$
is defined according to:
$\widehat \mu ^\star$
is defined according to:
 \begin{align} \Delta D_{\mathrm{Pois}} \;:\!=\; \frac{D_{\mathrm{Pois}}(y;\; \widehat \mu ^\star ) - D_{\mathrm{Pois}}(y;\; \widehat{\mu }^{\mathrm{GBM}})}{D_{\mathrm{Pois}}(y;\; \widehat{\mu }^{\mathrm{GBM}})}, \end{align}
where $D_{\mathrm{Pois}}(y;\; \mu )$
is given by Equation (21). From Table 1, it is seen that the
$D_{\mathrm{Pois}}(y;\; \mu )$
is given by Equation (21). From Table 1, it is seen that the $\Delta D_{\mathrm{Pois}}$
values for the different data sets are very small indicating that the guided categorical GLMs tend to track the performance of the initial GBMs closely. One can also note that the guided categorical GLM in fact outperforms the corresponding GBMs for the beMTPL and auspriv data sets, although these results could, at least partly, be due to random fluctuations. It is also worth highlighting that for both the auspriv and norauto data sets, a standard GLM without interactions outperforms the GBM in terms of Poisson deviance slightly, which is in agreement with that the guided GLM has a very low number of parameters. Further, in Table 1, the surrogate model from Henckaerts et al. (Reference Henckaerts, Antonio and Côté2022) is included, denoted maidrr, which tends to be close to the guided GLM in terms of Poisson deviances, although slightly worse, with a generally higher fidelity to the reference GBM, as expected. Note, however, that these results are based on our own use of the maidrr R-package, which may be sub-optimally tuned, but the results obtained here seem close to the maidrr results from Henckaerts et al. (Reference Henckaerts, Antonio and Côté2022), see Table 4, and their relative Poisson deviances are comparable to those seen in Table 1 in this short note.
$\Delta D_{\mathrm{Pois}}$
values for the different data sets are very small indicating that the guided categorical GLMs tend to track the performance of the initial GBMs closely. One can also note that the guided categorical GLM in fact outperforms the corresponding GBMs for the beMTPL and auspriv data sets, although these results could, at least partly, be due to random fluctuations. It is also worth highlighting that for both the auspriv and norauto data sets, a standard GLM without interactions outperforms the GBM in terms of Poisson deviance slightly, which is in agreement with that the guided GLM has a very low number of parameters. Further, in Table 1, the surrogate model from Henckaerts et al. (Reference Henckaerts, Antonio and Côté2022) is included, denoted maidrr, which tends to be close to the guided GLM in terms of Poisson deviances, although slightly worse, with a generally higher fidelity to the reference GBM, as expected. Note, however, that these results are based on our own use of the maidrr R-package, which may be sub-optimally tuned, but the results obtained here seem close to the maidrr results from Henckaerts et al. (Reference Henckaerts, Antonio and Côté2022), see Table 4, and their relative Poisson deviances are comparable to those seen in Table 1 in this short note.
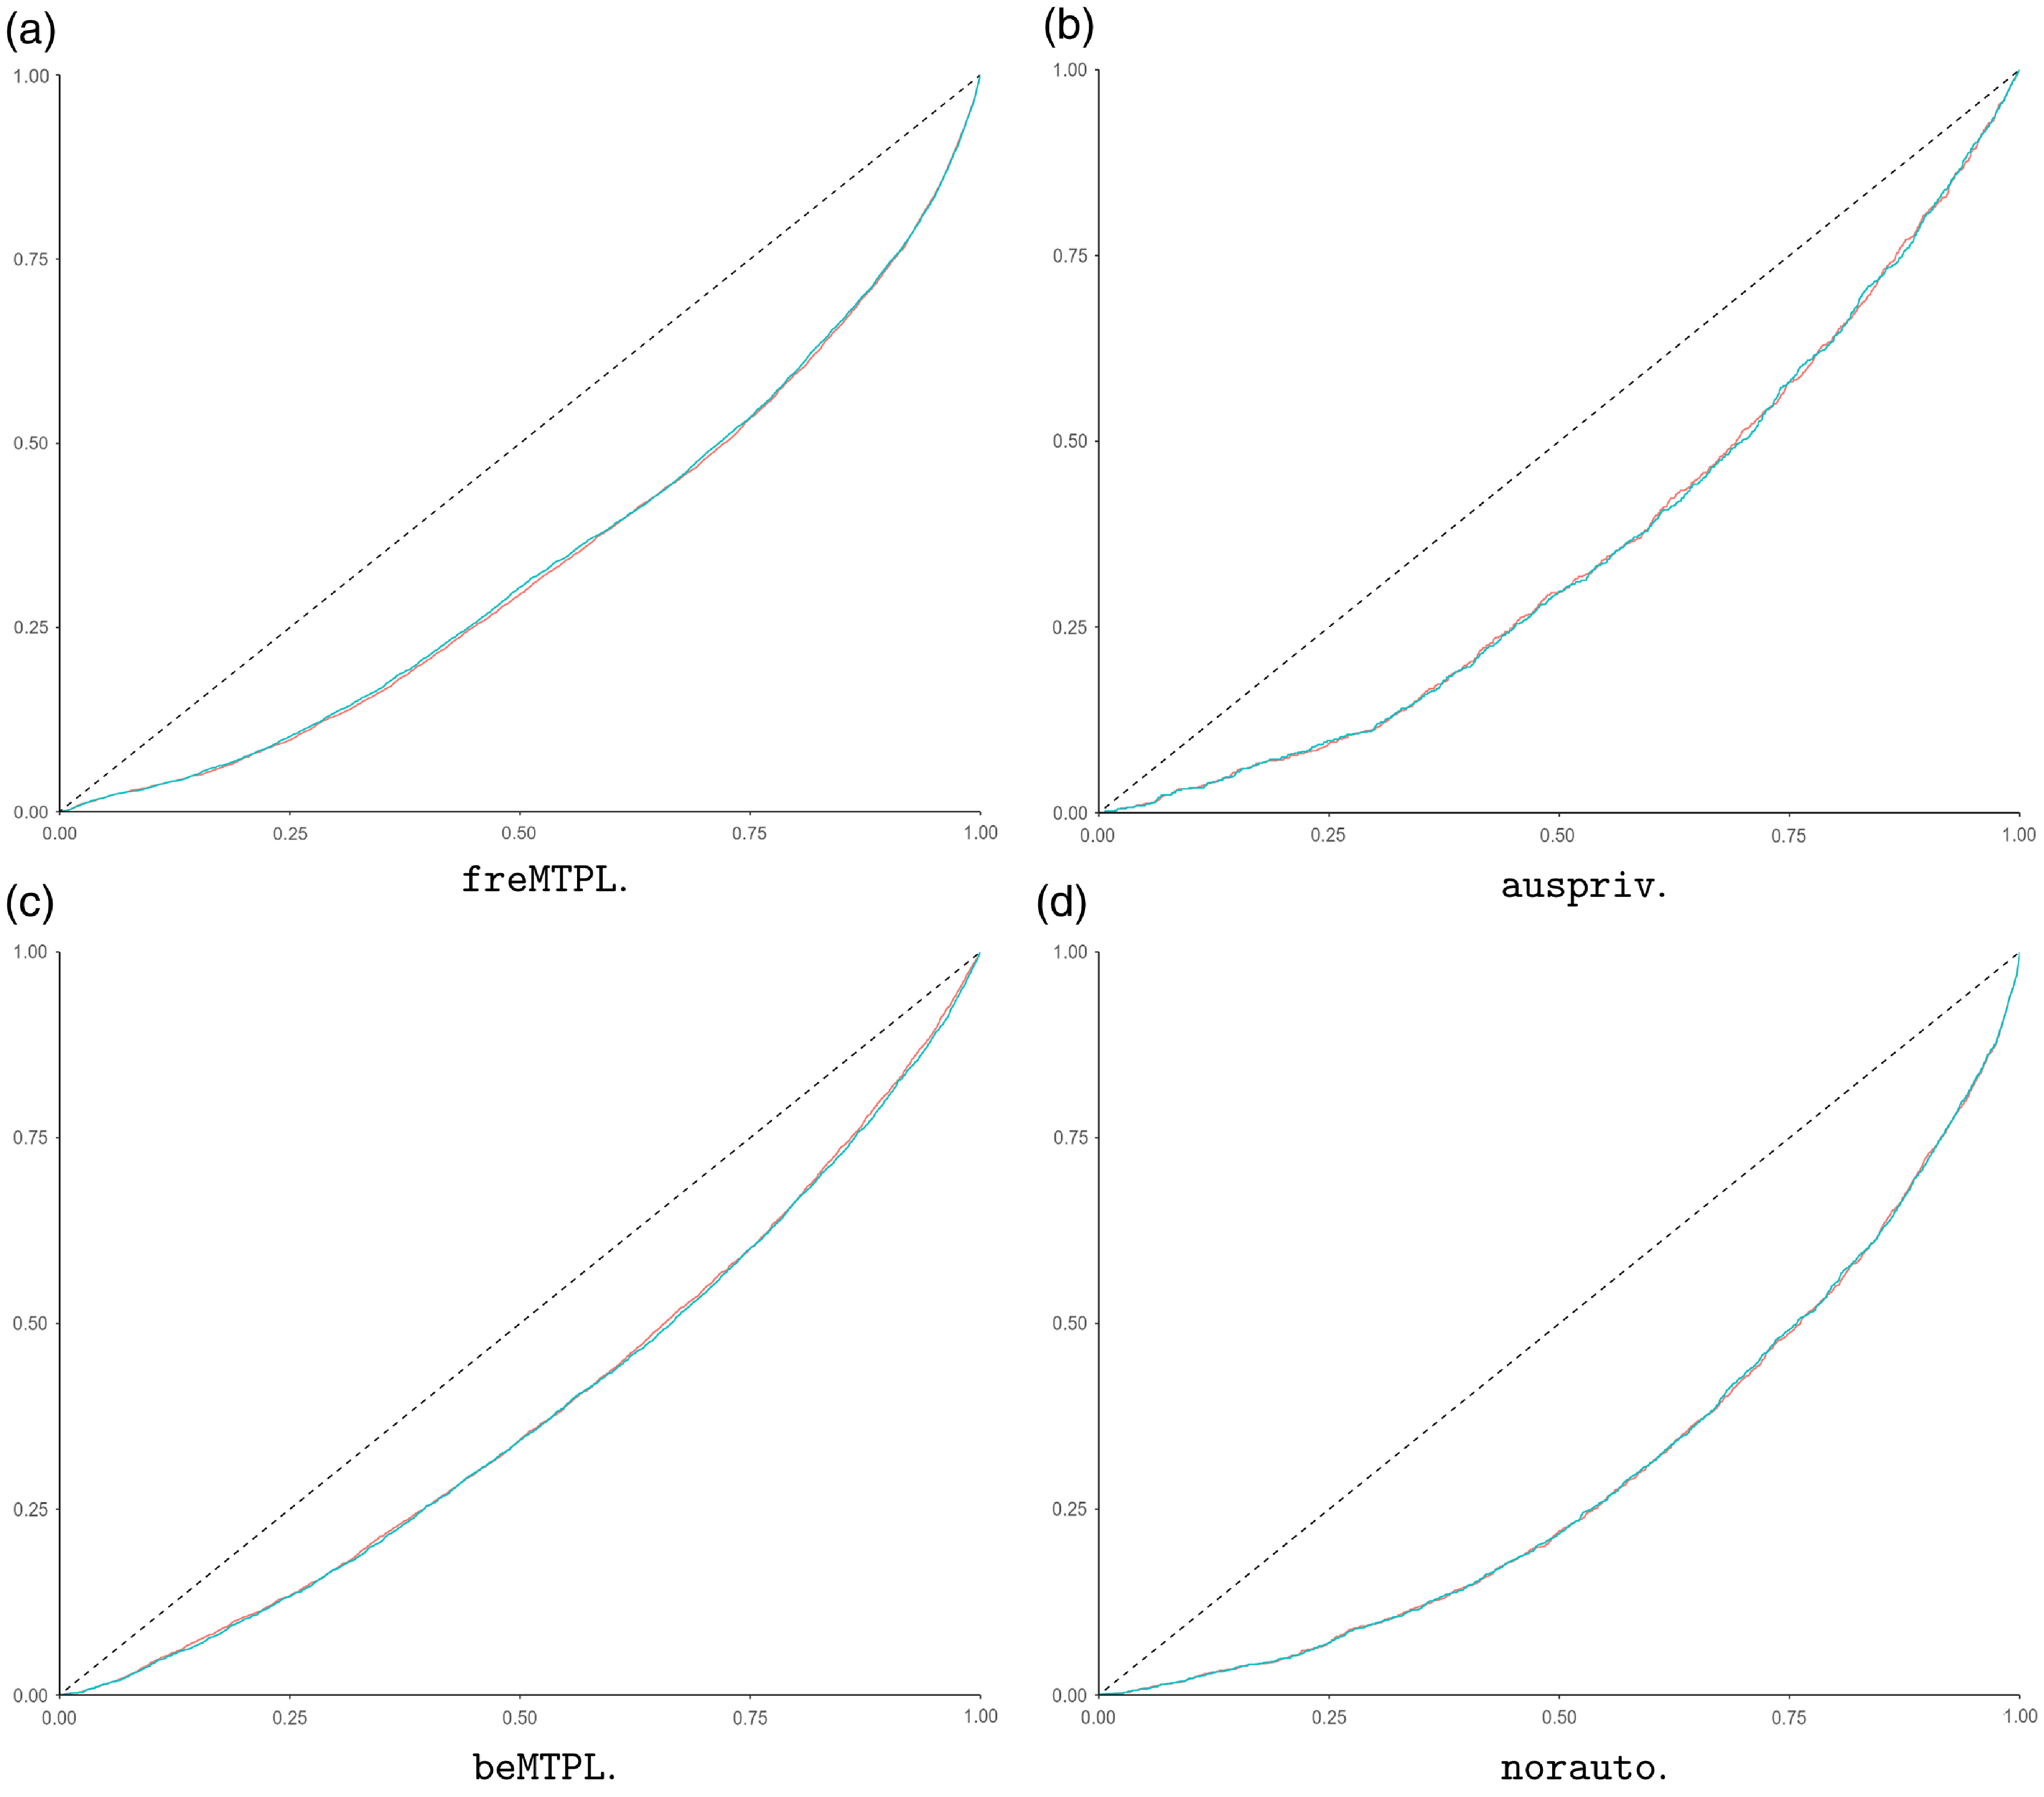
Moreover, the relative Poisson deviance values provide a summary of the overall out-of-sample performance. In order to assess local performance of the mean predictors, we use concentration curves, see Fig. 2, and for more concentration curves, we refer to e.g. Denuit et al. (Reference Denuit, Sznajder and Trufin2019). From Fig. 2, it is seen that also the local performance of the mean predictors of the guided categorical GLMs is comparable to the corresponding GBMs’ performance.
Concerning different covariates’ and interactions’ influence on the final predictor, recall that the final predictor is a regularized categorical GLM, and can hence be fitted using the glmnet package in R, and it is possible to use standard techniques such as variable importance plots (VIPs), see e.g. Greenwell et al. (Reference Greenwell, Boehmke and Gray2020). For a categorical GLM, the variable importance for a single covariate corresponds to the sum of the absolute values of the regression coefficients for its categories. This is illustrated in Fig. 3 for the different CASdataset data analyzed above. From Fig. 3, it is seen that there are a number of important categorical interaction terms for each model. This is information that is valuable when, e.g., constructing a tariff.
Summary statistics for the different data sets, where $\Delta D_{\mathrm{Pois}}$
is defined in (22), and where fidelity refers to the correlation between the gradient boosting machine predictor and the corresponding candidate categorical generalized linear model (GLM) – the guided GLM or maidrr from Henckaerts et al. (Reference Henckaerts, Antonio and Côté2022). The number of parameters refers to the guided GLM
$\Delta D_{\mathrm{Pois}}$
is defined in (22), and where fidelity refers to the correlation between the gradient boosting machine predictor and the corresponding candidate categorical generalized linear model (GLM) – the guided GLM or maidrr from Henckaerts et al. (Reference Henckaerts, Antonio and Côté2022). The number of parameters refers to the guided GLM

Concentration curves for different CASDatasets data comparing the original gradient boosting machine models (red lines) and the corresponding guided categorical generalized linear model (blue lines).
Variable importance plots for the final guided generalized linear model with lasso based on different CASDatasets data.

Further, VIPs provide a simple way to quantify global impact of covariates and interactions. Due to the categorical GLM structure, it is, however, straightforward to assess local impact by ranking the $\widehat \mu ^{\mathrm{GLM}^*}(x_i)$
s and inspect the contribution of individual covariates and interactions on the prediction. This is illustrated in Fig. 4, which shows
$\widehat \mu ^{\mathrm{GLM}^*}(x_i)$
s and inspect the contribution of individual covariates and interactions on the prediction. This is illustrated in Fig. 4, which shows $\exp \{\widehat \beta _j\}$
for specific covariate/interaction values corresponding to the 25%, 50%, and 75% percentiles of the empirical predictor distribution
$\exp \{\widehat \beta _j\}$
for specific covariate/interaction values corresponding to the 25%, 50%, and 75% percentiles of the empirical predictor distribution $(\widehat \mu (x_{i}))_i$
for different CASdataset data. Thus, from Fig. 4, we get a detailed picture of the importance of specific covariate/interaction values w.r.t. different risk percentiles. This is again valuable information for, e.g., constructing a tariff, but also for identifying characteristics of high-risk contracts.
$(\widehat \mu (x_{i}))_i$
for different CASdataset data. Thus, from Fig. 4, we get a detailed picture of the importance of specific covariate/interaction values w.r.t. different risk percentiles. This is again valuable information for, e.g., constructing a tariff, but also for identifying characteristics of high-risk contracts.
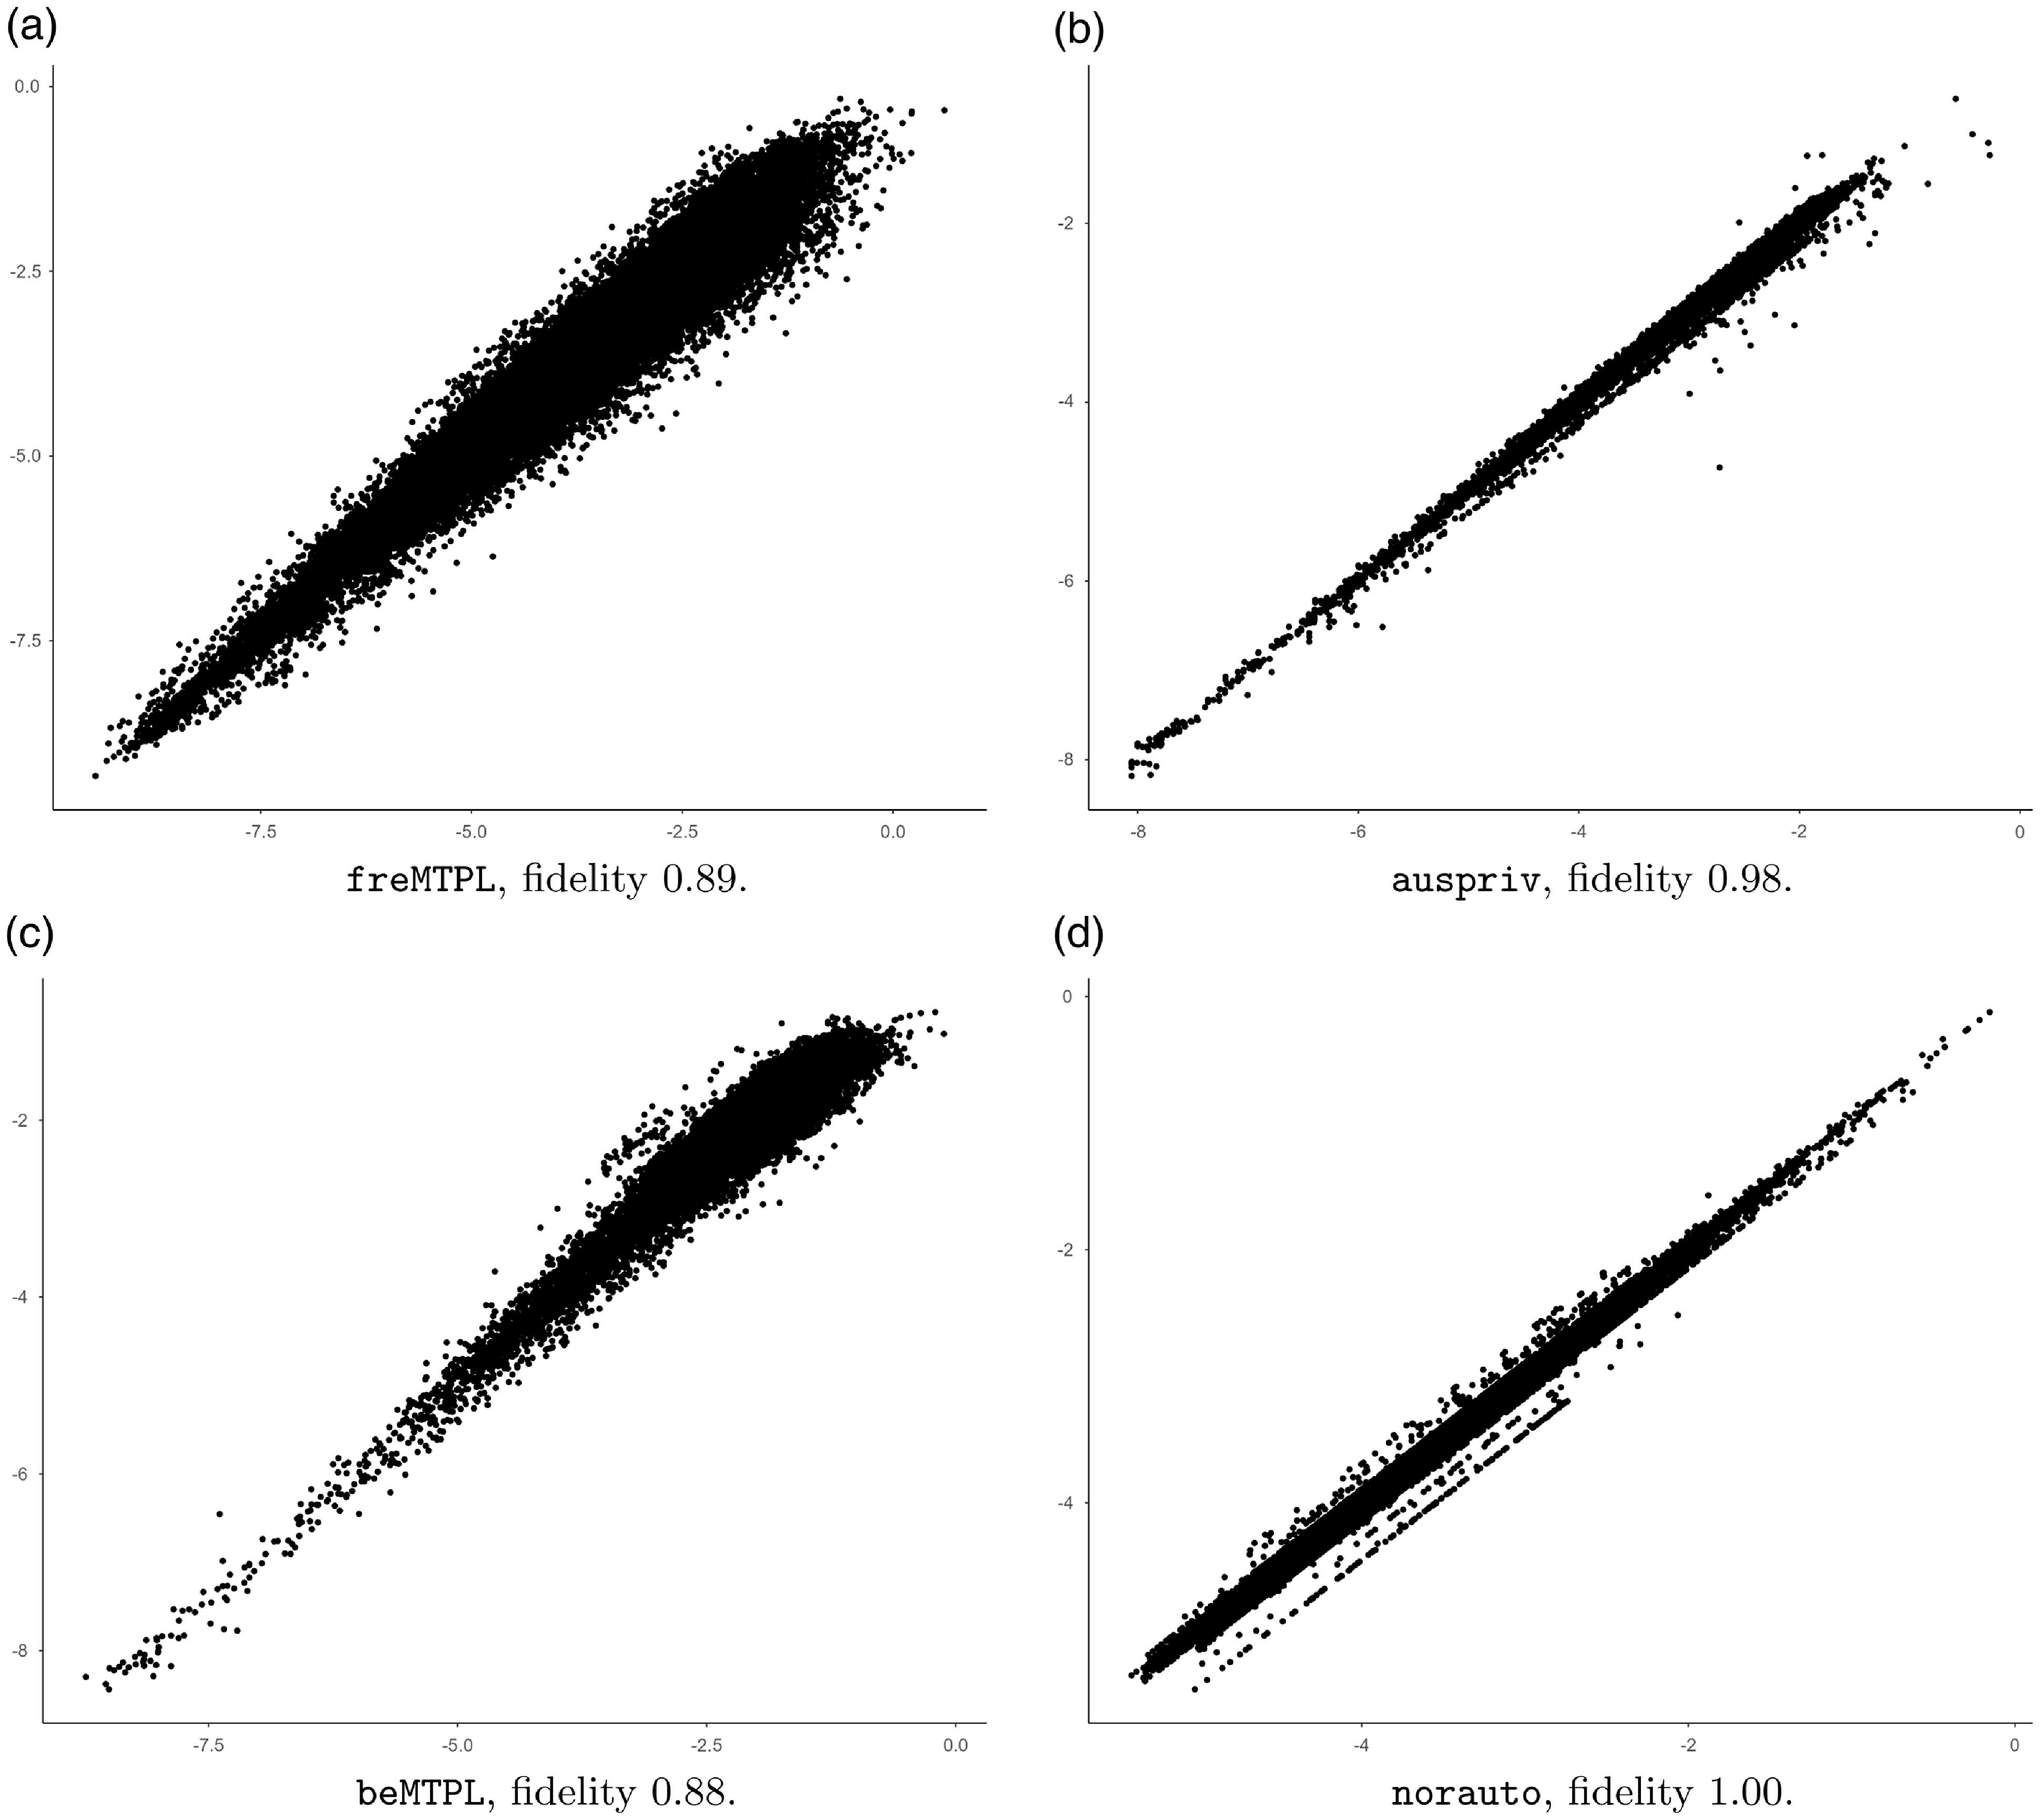
Before ending this section, we briefly discuss surrogate aspects of the guided GLM. Table 1 shows the fidelity of the guided categorical GLM w.r.t. the original GBM model, where fidelity is defined as the correlation between the initial GBM mean predictor and the corresponding guided categorical GLM predictor. From this, it is seen that fidelity tends to be rather high for the data sets being analyzed, with no fidelity of less than 88%. These numbers, however, tend to deviate considerably for freMTPL and beMTPL compared to the surrogate model of Henckaerts et al. (Reference Henckaerts, Antonio and Côté2022), see Table 5. This could, at least, partly be caused by the use of different seeds. It is, however, worth noting that the guided categorical GLMs with the lowest fidelity, beMTPL and freMTPL, are the ones that also differ the most compared with Henckaerts et al. (Reference Henckaerts, Antonio and Côté2022) w.r.t. predictive performance, in favor of the current guided GLM. Still, as commented on above, the observed differences could, at least partly, be due to not using the same seed.
A more detailed comparison of the original GBMs and the guided GLMs is provided by the scatter plots in Fig. 5, which agree with the fidelity calculations. The analogous scatter plots between the guided GLMs and the maidrr models look very similar to Fig. 5, but are slightly wider, and are not included.
Covariate contributions to the categorical generalized linear models (GLMs) mean predictor for different CASDatasets. From left to right: covariate contributions corresponding to the 25%, 50%, and 75% percentile of the empirical distribution of $(\widehat \mu (x_i))_i$
from the guided categorical GLM; each point corresponds to
$(\widehat \mu (x_i))_i$
from the guided categorical GLM; each point corresponds to $\exp \{\widehat \beta _j\}$
for the particular covariate value/interaction term value. Note that interactions are represented without displaying a specific value on the
$\exp \{\widehat \beta _j\}$
for the particular covariate value/interaction term value. Note that interactions are represented without displaying a specific value on the $y$
-axes.
$y$
-axes.

Scatter plots for different CASDatasets data on log-scale, comparing the original gradient boosting machine models ( $y$
-axes) and the corresponding guided categorical generalized linear models (
$y$
-axes) and the corresponding guided categorical generalized linear models ( $x$
-axes) predictions. Fidelity corresponds to the correlation between the two predictors.
$x$
-axes) predictions. Fidelity corresponds to the correlation between the two predictors.
5. Concluding remarks
In this short note, we introduce a simple procedure for constructing a categorical GLM making use of implicit covariate engineering within a black-box model, see Algorithm1. The resulting model is referred to as a guided categorical GLM. The central part of the modeling aims at identifying how single covariates (and interactions) impact the response. This is here done using PD functions together with a marginal auto-calibration step in order to construct covariate partitions. The rationale behind this procedure is as follows: The PD functions are used to assess the impact of a covariate w.r.t. the initial black-box predictor and in this way generate candidate covariate partitions. Given a partition, by using marginal auto-calibration, only the parts in the candidate partition that have an impact on the response will remain, regardless of the underlying black-box model. Consequently, as long as the PD functions are able to differentiate between covariate values, the actual level of the PD functions is not important, and the PD functions can be replaced with any other meaningful covariate effect measures, such as ALEs. Further, note that if the PD functions, or equivalent effect measures, are applied to numerical or ordinal covariates, and the resulting function is strictly monotone, the suggested procedure could just as well be replaced by binning the covariates based on, e.g., their quantile values, see Remark2(a). Furthermore, Algorithm1 does not consider alternative partitionings of covariates that are categorical from the start. This could of course be allowed for if wanted by including them in Step A. of Algorithm1. Relating to the previous points, an alternative to being guided by a black-box predictor $\widehat \mu (x)$
in the construction of the GLM is to directly partition the covariate space based on quantile values and apply
$\widehat \mu (x)$
in the construction of the GLM is to directly partition the covariate space based on quantile values and apply $L^2$
trees marginally. This is another example of a marginally auto-calibrated method that could be worth investigating in its own right.
$L^2$
trees marginally. This is another example of a marginally auto-calibrated method that could be worth investigating in its own right.
The above procedure is closely related to the modeling approach introduced in Henckaerts et al. (Reference Henckaerts, Antonio and Côté2022), where the main difference is that they aim for fidelity w.r.t. the (PD function) behavior of the original black-box predictor. The guided categorical GLM, on the other hand, focuses on predictive accuracy. Although the two approaches likely will be close if the PD functions are strictly monotone, the numerical illustrations show situations where the guided categorical GLMs reduction in fidelity coincides with an increase in predictive performance. This also connects to the wider discussion on the use of auto-calibration and (complex) black-box predictors in non-life insurance pricing, see e.g. Lindholm et al. (Reference Lindholm, Lindskog and Palmquist2023); Wüthrich and Ziegel (2023). In these references, it is noted that a low signal-to-noise ratio, which is common in non-life insurance data, may result in complex predictors that are spuriously smooth. In their examples, by applying the auto-calibration techniques in Lindholm et al. (Reference Lindholm, Lindskog and Palmquist2023); Wüthrich and Ziegel (2023) to a complex predictor, the resulting auto-calibrated predictor only has a few unique predictions; in the examples of around 100 unique predictions. This is still considerably less than the current guided GLMs’ predictors that use up to 150 parameters, see Table 1 in Section 4 above. Consequently, if the number of parameters in the guided categorical GLM is not too large, it may be possible to construct a new interpretable categorical GLM that is auto-calibrated by using the techniques from, e.g., Lindholm et al. (Reference Lindholm, Lindskog and Palmquist2023); Wüthrich and Merz (Reference Wüthrich and Merz2023). On the other hand, the number of parameters in Table 1 refers to the total number of parameters in the model, whereas the number of non-zero regression coefficients for a specific contract will likely be considerably lower; recall Fig. 4 above.
Concerning estimation error and robustness, since the final model is a regularized categorical GLM, one can use off-the-shelf confidence intervals for regression coefficients, given that the produced partitions are treated as static. In practice, however, this will likely not be the case, and the stability of the full method, including all steps of covariate engineering, should be taken into consideration when assessing the variability in $\widehat \mu (x)$
. This is outside of the scope of this short note.
$\widehat \mu (x)$
. This is outside of the scope of this short note.
Acknowledgments
M. Lindholm gratefully acknowledges financial support from Stiftelsen Länsförsäkringsgruppens Forsknings- och Utvecklingsfond [project P9/20 “Machine learning methods in non-life insurance”]. J. Palmquist gratefully acknowledges the support from Länsförsäkringar Alliance. All views expressed in the paper are the author’s own opinions and not necessarily those of Länsförsäkringar Alliance.
Data availability statement
All data sets used are publicly available and have been retrieved from the R-package CASdatasets. The code used can be retrieved from https://github.com/Johan246/Boosting-GLM.git
Competing interests
None to declare.


 Open access

