

1. Introduction
The microstructure of a rock is understood as the small-scale arrangement of geometric elements within it (Reference Hobbs, Means and WilliamsHobbs and others, 1976). Ice (and firn) in the cold and dry plateaus of polar ice sheets is a monomineralic rock and, as such, it has many geometric elements which can be observed using an optical microscope (e.g. grain and subgrain boundaries, slip bands, pores and air inclusions (air bubbles, air clathrate hydrates and plate-like inclusions), to mention the most common). Ice also contains traces of insoluble impurities, typically solid particles like mineral dust and volcanic ash, but only occasionally are such particles deposited in high enough amounts to form visible layers (e.g. Reference FujiiFujii and others, 1999; Reference SvenssonSvensson and others, 2005).
Over 20 years ago, Reference Wilson, Hobbs and HeardWilson (1986) noted a paucity of data on ice microstructure evolution with progressive deformation, as well as a lack of studies on slip bands in naturally deformed ice. Although dislocation glide is widely accepted as the dominant deformation mechanism in polar ice, there is still considerable debate on the role of grain boundary sliding (Reference Goldsby and KohlstedtGoldsby and Kohlstedt, 2001, Reference Goldsby and Kohlstedt2002; Reference Duval and MontagnatDuval and Montagnat, 2002). Detailed observation of deformation-induced microstructural features of polar ice, which are characteristic of the deformation mechanisms active in situ, may contribute to solving this debate.
There is a long list of questions which motivates the mapping of the microstructure of firn and ice in microscopic resolution. For instance, in order to properly discriminate the factors influencing the microstructure properties, like global and local climate conditions (impurity load, accumulation rate, insolation, etc.), depositional characteristics (finer or coarser grains) and the regimes of deformation and recrystallization, it is essential to analyze the microstructural features of ice through an annual layer (whose typical thickness on the dry plateaus of polar ice sheets ranges between 3 and 20 cm of ice equivalent). In combination with fabric measurements (Reference Wang and AzumaWang and Azuma, 1999; Reference Azuma and HondohAzuma and others, 2000; Reference WilenWilen, 2000; Reference Wilson, Russell-Head and SimWilson and others, 2003) data about grain size and shape have been derived (Reference SvenssonSvensson and others, 2003), but we are aware of no study investigating the microstructure of ice by mapping as many features in a section as possible by means of digital-imaging techniques. Reference Arnaud, Gay, Barnola and DuvalArnaud and others (1998) used a classic still camera to photograph the microstructure of firn and bubbly ice in coaxial reflected light. Reference Nishida and NaritaNishida and Narita (1996) reconstructed the threedimensional shape of ice grains using similar methods. Both used classic still cameras, and were not able to instantaneously control the image quality (contrast, resolution, etc.). They developed negative films, digitized the negatives and finally processed the resulting digital images in a computer, although computer-based image-processing systems were already described at that time (Reference Perovich and HiraiPerovich and Hirai, 1988; Reference EickenEicken, 1993). Likewise, optical microscopes have been used to derive statistical data about air bubbles and hydrates (Reference Uchida, Hondoh, Mae, Lipenkov and DuvalUchida and others, 1994; Reference Pauer, Kipfstuhl, Kuhs and ShojiPauer and others, 1999; Reference Lipenkov and HondohLipenkov, 2000; Reference Kipfstuhl, Pauer, Kuhs and ShojiKipfstuhl and others, 2001), but no systematic mapping or image processing was performed during such investigations.
In the past decade, computing power and digital-imaging techniques have progressed rapidly and modern digital cameras have attained such high image quality that they can, in most cases, successfully replace classic film still cameras. It is possible today to set up a mapping environment consisting of commercially available components, like a charge-coupled device (CCD) video or digital camera, a computer-controlled xy-stage and an optical microscope or similar lens system, that can be operated under cold room conditions down to –30°C and even below without major problems.
While the NorthGRIP deep ice core (North Greenland Ice Core Project members, 2004) was being drilled in Greenland, we began to set up and test a computer-controlled microscopic imaging system, which could replace the tedious and time-consuming manual counting of air inclusions (see, e.g., Reference Kipfstuhl, Pauer, Kuhs and ShojiKipfstuhl and others, 2001). The idea was to automate the microscopic observation as much as possible, through the scanning of a thin or thick section of ice (typical dimensions: 5–10 cm by 10 cm) and the production of digital images at microscopic resolution in a reasonable time (about an hour), while drilling was ongoing. The processing of the images could then be done at a more convenient time. While testing this equipment for air-bubble and hydrate studies, we found it was also suitable for recording grain boundaries and a wide variety of deformation-induced microstructural features, among them slip bands and subgrain boundaries, which have received little attention to date. Some of these features (e.g. grain and subgrain boundaries) were revealed by sublimation of the exposed ice surface, which became an essential part of the method. In this paper, we describe the computer-imaging environment which has been used in Antarctica within the EPICA–DML (European Project for Ice Coring in Antarctica–Dronning Maud Land) microstructure mapping project. We describe the procedures used to obtain good optical images and the microstructural features seen in naturally deformed ice. We first present results demonstrating that careful preparation and adequate observation techniques reveal a wide spectrum of deformation-induced microstructural features which may help us to better understand the recrystallization processes taking place in ice sheets.
2. Methods
The NorthGRIP and EPICA cutting plans dedicate the top 10 mm of the 98 mm diameter core for the study of physical properties (EPICA community, 2004; NorthGRIP members, 2004). From 9 or 10 cm long vertical sections, with the long axis parallel to the vertical axis of the ice core, another section about 6 mm thick is cut (Fig. 1, grey-shaded region). The dimensions of a section used for mapping are typically 40–50 mm wide, 90–110 mm long and 4–5 mm thick.
Cutting scheme. From the top piece of a 98 mm diameter ice core the lower half (grey shaded) is used for crystal studies and microstructure mapping. The length, l, is 55 cm for the EDC (EPICA Dome C) core and 100 cm for the EDML (EPICA Dronning Maud Land) core.

2.1. Sample preparation
Samples are prepared according to the standard procedures used for the production of thin sections for fabric and texture analysis (e.g. Reference Uchida, Hondoh, Mae, Lipenkov and DuvalUchida and others, 1994; Reference Pauer, Kipfstuhl, Kuhs and ShojiPauer and others, 1999). We use band-saws for cutting and microtomes for polishing. Clear surfaces are achieved by exposing the polished section to the free atmosphere. Sublimation of an ice surface works like chemical or thermal etching, a method widely employed in materials science to produce etch pits and grooves on the surfaces of metal, mineral and ceramic samples (Reference MullinsMullins, 1957; Reference Kuroiwa, Hamilton and KingeryKuroiwa and Hamilton, 1963; Reference HobbsHobbs, 1974; Reference Nishida and NaritaNishida and Narita, 1996; Reference Arnaud, Gay, Barnola and DuvalArnaud and others, 1998). During sublimation, the scratches produced by the microtome blades disappear, while certain characteristic patterns, called sublimation ‘grooves’, ‘lines’ and ‘pits’, start to develop at the sites where grain/subgrain boundaries (as well as other energetically unfavourable structures) meet the surface. We wait between half an hour and half a day to obtain a clear surface, with well-developed grain-boundary grooves. The sublimation time depends very much on temperature, temperature gradient, humidity and air movement or wind above the sample. Sublimation is accelerated when the ice section lies under a light bulb, in direct sunlight and wind, (and probably also in a vacuum chamber, not yet tested). In general, the drier the air, the more distinct and clear the surface.
After the first (lower) surface of the sample is sufficiently clear, it is sealed off with a thin film of silicon oil (10−4 m2s−1). Thus protected against over-sublimation, the section is frozen onto a glass plate. The second (upper) surface is treated in the same manner. However, because of the better contrast of a pristine surface (no silicon oil and no cover glass), we seal off this surface just after the first mapping run is completed.
2.2. Mapping system
The system used to map the samples consists of an optical microscope (Leica DMLM), a CCD video camera (Hamamatsu C5405), a frame grabber (SCION LG3) and an xy-stage (Märzhäuser XY100). Images are usually taken in transmission. The process of image acquisition, i.e. the positioning of the sample on the xy-stage and subsequent image capture, is controlled by the public domain NIH Image software (developed at the US National Institutes of Health and available on the internet at http://rsb.info.nih.gov/nih-image/) together with the LG3 frame grabber, both running on an Apple G3 computer. As colour cameras offer no advantage for our purposes, all images are acquired in grey value. Black-and-white cameras give better contrast and sensitivity than colour cameras, and they produce fewer data (resolution: 1 byte or 256 grey values). The standard size chosen for a single image is 2.5 by 1.8 mm, but this can be changed depending on the lenses used in the microscope. Consecutive images are taken every 2 mm in the x direction. An overlapping of 0.5 mm is helpful for the later reconstruction of the full mosaic figure, giving us some freedom to find the best match between neighbouring images. A series of about 1500 images is needed to map a section 45 by 90 mm. The whole scan takes about 1 hour. The mapping system described above has been used at Dome C and in Dronning Maud Land during five field seasons. The main problem encountered so far is the alignment (matching) of the individual images as we deal with four pairs of horizontal axes: one pair for the camera (image), one for the xy-stage, one for the glass plate and another for the sample itself. These four pairs of axes should match as exactly as possible to avoid time-consuming corrections later. Another problem is the large size of the reconstructed images, of the order of 400MB. For example, to extract grain sizes using NIH Image’s particle analysis routines we have to scale the images down to 25%.
Information about the c-axis orientation of grains and subgrains is essential for the understanding of deformation on the grain scale. However, the fabric analyzers currently available (Reference Wang and AzumaWang and Azuma, 1999; Reference Wilson, Russell-Head and SimWilson and others, 2003) do not have the necessary resolution.
3. Results of Microstructure Mapping
In this section we compare the features which can be observed at different resolution levels, from a single microscopic image up to a mosaic in standard magnification for common texture and fabric analyses. This should give an idea of the degree of detail, and consequently the amount of new, relevant information on the polar ice microstructure, which can be obtained with this method.
3.1. Low-resolution (mesoscopic) view
A mosaic of the EDC (EPICA Dome C) core from 1291 m depth, 2 cm high and 4.5 cm wide, composed of about 300 images, is shown in Figure 2. It is just a quarter of the entire thick section (9 cm high and 4.5 cm wide), which encompasses 1280 images (20 images per row and 64 rows). The mosaic in Figure 2 demonstrates that grain boundaries and air inclusions are detected by microstructure mapping when the microscope is focused on the surface of the section. Notice that this sample comes from a depth where all air bubbles have already transformed into clathrates (i.e. air hydrates), which are seen as ‘little rings’, deeper in the section. Dark or black spots are defocused or decomposing air hydrates partly filled with gas. The ticks on the left and right margins, approximately 1 cm apart, serve as benchmarks to locate interesting features within the image or section, respectively. The outermost margins of the sections, over about the length of the ticks (1–2 mm), are often disturbed to such an extent that grain-boundary grooves and other interesting sublimation patterns have disappeared. Mosaic images like Figure 2 are the basis of all further analyses. Using image-processing software, we can determine the orientation of slip bands (Reference Faria and KipfstuhlFaria and Kipfstuhl, 2004), extract the grain boundary network to derive texture information like grain size and shape, and derive statistical data about the presence of sublimation grooves or subgrain boundaries within grains, air bubbles and air hydrates, as well as other visible features (work in progress).
A mosaic of about 300 images showing a 2 by 4.5 cm section from the Dome C ice core (depth 1291 m). Dark lines are highangle grain boundaries, while dark and black spots or rings are air hydrates. Also visible are internal grain boundaries (blurred, dark lines). The thick, black ticks on both sides of the sample are ~1 cm apart and indicate the scale. The white rectangle marks a single microphotograph (image number 749, 2.5 by 1.7 mm). For comparison, this microscopic image is shown in full resolution in Figure 3.

When shown at low resolution (of the order of 100 μm pixel−1), the grain-boundary network does not differ much from that extracted by other methods (Reference Arnaud, Gay, Barnola and DuvalArnaud and others, 1998; Reference Wang and AzumaWang and Azuma, 1999). Therefore, there is no reason to discuss the low-resolution image in Figure 2 in detail: most grain boundaries look rather ‘flat’ and seem to manifest the characteristic features of a so-called ‘foam texture’, with straight and equiaxed boundaries. In contrast, it is shown in section 3.2 that at higher resolution a significant number of grains show irregular boundaries, indicating that other processes, as well as normal grain growth, are important.
3.2. High-resolution (microscopic) view
Figure 3 illustrates how much detail is hidden in a mosaic image originally produced by mapping in microscopic resolution. We recognize many details and substructures not only within the ice matrix but also on grain boundaries (e.g. slip bands and grain-boundary steps). Most microstructural features shown in this figure can be observed in sections from any depth. For convenience, grains are numbered from 1 to 6 and interesting features are labelled with capital letters (A–J). Air inclusions and internal structures are not marked.
Microphotograph marked in Figure 2 in full resolution. Subgrain boundaries, irregular sublimation groove patterns, slip bands and air hydrates (the single black inclusion is a decomposing air hydrate) are visible at this higher magnification. Labelled features are described in the text. (EDC ice core, depth 1291 m, width 2.5 mm.)
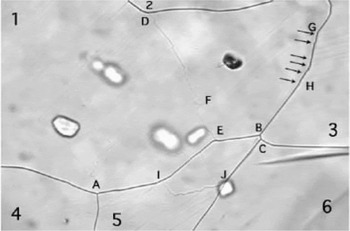
In the discussion below we concentrate on deformation- and grain-growth-related features. High-angle grain boundaries meet at three triple junctions (A, B and C). The parts of grains 2, 3, 4 and 6 visible in Figure 3 are free of sublimation features. Grain 3 shows slip bands ending at the boundary with grain 1, which is divided into two subgrains by a developing subgrain boundary between D and E. The left subgrain contains slip bands overlain by an irregular network of very faint sublimation lines, with some sublimation lines parallel to the slip bands and others perpendicular to them. Subgrain boundary DE shows steps with straight segments. Other parts are quite irregular. Some of the steps are accompanied by more prominent slip bands and sublimation grooves. These last two features are often not easy to differentiate at first sight: we need to focus the microscope deeper into the sample to distinguish them, for sublimation grooves soon become defocused, whereas slip bands remain almost unaltered (since they are interior features; see section 4.1). This lack of distinction could, in principle, cause some difficulties in the interpretation of certain digital images, but fortunately this is not the case in practice: straight sublimation grooves, parallel to slip bands, are often related to the slip process itself, and they hide slip bands behind them (see section 4.2). As evidenced by grains 1 and 3, slip bands are, in general, not evenly distributed over grains and subgrains. A closer look at the grain boundary separating grain 3 and grain 1 reveals tiny steps between G and H (marked by arrows), in a region of grain 3 where strong slip bands are visible. The steps may be produced by intense basal slip deformation. Grain 5 is divided by a strong but irregular subgrain boundary, the upper subgrain once again by a weak, straight subgrain boundary. The interior of both upper subgrains is free of features. In contrast, the lower subgrain is covered by an irregular pattern of sublimation grooves, most of them parallel or of similar orientation. It seems that the irregular subgrain boundary, IJ, moved downwards into the lower subgrain, leaving behind a recovered, thus clear, upper subgrain.
One important finding from Figure 3 is that it documents the interaction of strong and weak sublimation grooves, i.e. the interaction of grain and subgrain boundaries. This is most clearly manifested in grain 1 at D and E, but also in grain 5 at I and J, where the high-angle boundaries bow towards the subgrain boundaries. An explanation for this apparent interaction may be that grain-boundary migration is driven in those particular sites by stored strain energy, and not by grain-boundary curvature/interface energy, as expected to be the case during normal grain growth. We do not yet know the relevance of this apparent interaction. However, it indicates that the interaction between subgrain and highangle grain boundaries has to be taken into account to understand grain-boundary migration in detail.
4. Interpretation
Sublimation features are marks on the surface of an ice specimen, which are caused by preferred vaporization. As a consequence, such superficial marks become blurred and fade out of view as the microscope is focused deeper into the sample. Slip bands, air bubbles and hydrates, dust and ash particles belong to another category of features, called ‘interior’, since they are located inside the material and are not produced by sublimation. In this section we discuss how to distinguish and interpret interior and sublimation (surface) features.
4.1. Interior features
Figure 4 shows slip bands observed when the microscope is focused on the interior of the sample. At first sight it may be somewhat perplexing that the slip bands in Figure 4a seem to cross the grain boundary; but this is in reality just an illusion (a ‘depth effect’), caused by the fact that the grain boundary is inclined enough to become invisible, so that only the defocused boundary groove on the surface is seen.
(a) Straight and (b) kinked slip bands. Spacing of the bands ranges between ~10 and 20 mm. The misorientation in (b) is about 2°. White lines in (b) are the grooves of a tilt boundary visible on both surfaces of a thin section placed between crossed polarizers. Note that the left half of the grain is slightly darker than the right subgrain. Generally, slip bands are not evenly distributed in a grain. (EDC ice core, depth 1291 m (a) and 489 m (b), width 600 mm.)

We studied two EPICA cores; in each we observe grains with straight, bent and polygonized (broken) slip bands. Frequently, coarse and fine slip occur in the same grain and the distribution of slip bands is then inhomogeneous (e.g. Figs 3 and 4). The spacing of the slip bands varies between 5 and 20 mm for fine slip and 20 and 100 mm for coarse slip. The spacing of the slip bands seems to be roughly independent of depth and pressure. A remarkably high number of bent and polygonized slip bands is found at shallow depths just below the firn–ice transition (about 100 m). Subgrain boundaries perpendicular to the slip bands, therefore probably tilt boundaries (i.e. boundaries made up of edge dislocations), are already visible in grains with slip bands bent more than 1–2° (Fig. 4b; see also fig. 5 in Reference Wang, Kipfstuhl, Azuma, Thorsteinsson and MillerWang and others, 2003).
Complex sublimation line patterns. The faint, parallel lines are slip bands and thus indicate the orientation of the basal planes. Notice that sublimation grooves occur only on the convex side of grain boundaries. (a) Complex patterns of sublimation grooves at a grain corner (EDC core, depth 768 m, width 600 μm). (b) Transition zone between a high-angle grain boundary (left) and a tilt boundary (right) in a thin section (EDC core, depth 150–200 m, exact depth not known, width 600 mm). Blurred, defocused sublimation lines correspond to grooves in the bottom surface, while the sharp, black lines are focused grooves on the top surface. It should be noted that the sublimation groove associated with the subgrain (tilt) boundary becomes weaker as it gets more irregular and dissociates into intricate patterns and loops. (c) Multiple tilt boundaries in a grain bent over a large area (EDML core, depth 2105 m, width 600 μm). (d) Irregular, wavy grain boundary (EDML core, depth 154 m, width 1.2 μm). Arrows point to weak sublimation lines.
In our thick/thin sections we observe some grains exhibit slip bands, while others do not. In principle, one could argue that those grains with no visible slip bands should be either unstrained or fully recovered/recrystallized, but this would be a hasty conclusion. In fact, experience shows that the c-axis orientation relative to the plane of observation is crucial for the detection of slip activity. In other words, slip bands fade out of view whenever the c axis is not nearly perpendicular to the viewing axis of the microscope. Tilting of the thick section about one axis (a four-axes universal stage was not available) showed that slip bands tilted more than about 5–10° fade out and disappear (c axis tilted <10° out of the sample plane). Consequently, slip band analysis via microstructure mapping must be restricted to those grains showing visible slip bands.
4.2. Sublimation features
Common sublimation patterns
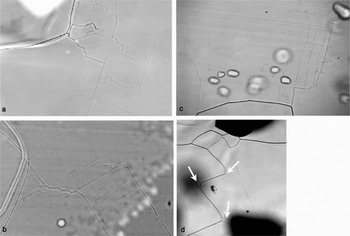
Figure 5 shows the most common types of sublimation features: complex patterns of sublimation grooves at corners of grains (Fig. 5a) and at transition zones between subgrain and high-angle grain boundaries (Fig. 5b), single or multiple subgrain and tilt boundaries perpendicular to slip bands (Fig. 5c) and wavy or irregular high-angle grain boundaries, together with other complex sublimation line patterns. Noteworthy is that complex sublimation line patterns are strongly related to corners of high-angle grain boundaries, and also that they occur more frequently in the marginal area (the ‘mantle’) of the grains than in their central parts (the grain ‘core’). Typical of complex sublimation line patterns are series of parallel lines, often interrupted by several alternated steps at right angles (zigzag-like lines) finally continuing in the original direction. Sometimes, irregular sublimation lines meet straight lines, follow or cross them and form loops, often called ‘subgrain islands’ (Reference Koo, Yoon and HenryKoo and others, 2000; Reference Ryde, Hutchinson and KumanoRyde and others, 2004). The complex patterns in Figure 5b, within the transition zone between the highangle grain boundary and the well-developed subgrain boundary coming from the lower-right corner, may indicate that the best configuration for the new triple junction had not yet been achieved. Figure 5c is a good example for a grain bent over a wide bulge, where multiple subgrain boundaries develop as demonstrated by Reference NakayaNakaya (1958). The developing subgrain boundaries start at a high-angle grain boundary, but fade out in weaker branches, leaving the centre of the grain undisturbed. Interesting to note also is that in Figure 5a–c the sublimation line patterns are commonly found on the convex side of the grain boundaries, while the concave side appears free of any sublimation features. This behaviour is also typical for extremely irregular or wavy grain−boundary segments, as in Figure 5d.
Subgrain boundaries
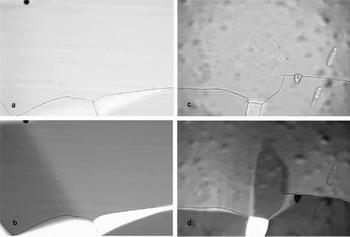
Slip bands and subgrain boundaries result from shearing, bending, twisting and consequent subdivision of a grain or parts of a grain. The c-axis misorientation caused by bending is best observed in thin sections placed between crossed polarizers, where it is manifest as a change in colour or grey shade. Microphotographs of thin sections prepared as described in section 2.1 and illuminated with normal and polarized light are shown in Figure 6. In both sections we observe that the grey shade changes not only across highangle grain boundaries (the wide dark lines) but also across the weak single line in Figure 6a and b and across the complex, weak line pattern in Figure 6c and d. This comparison proves that those weak sublimation grooves are indeed related to changes in orientation within a grain, and can therefore be interpreted as subgrain boundaries. Unfortunately, we cannot quantitatively estimate the misorientation angle directly from the difference in grey values. However, our observations of slip bands indicate that single, smooth/straight sublimation grooves like those shown in Figure 6a and b normally appear when the slip bands are tilted by just a few (one or two) degrees (Reference Wang, Kipfstuhl, Azuma, Thorsteinsson and MillerWang and others, 2003; Reference Faria and KipfstuhlFaria and Kipfstuhl, 2004). Additionally, in all mapped sections we commonly observe a progressive change in the character of most sublimation lines, as we move our attention from the core towards the boundary of a given grain. Such a change is manifold, being characterized, for instance, by a gradual transition of the grey values of sublimation lines, ranging from very faint (hardly visible) in the core to weak and finally dark black at the boundary. Together with this transition in intensity there is also a change in shape, from more irregular (zigzag-like) to smoothly curved and straight lines. Further, we observe in thin sections between crossed polarizers that the grey shade difference across a sublimation line is proportional to the intensity and smoothness of the sublimation line. Therefore, the strength of a sublimation line in a mapped image can be used as a qualitative measure of the c-axis misorientation across it.
Thin sections from two depths of the EDC ice core, illuminated with normal and polarized light. Slightly different orientations are indicated by contrasting shades of grey in (b) and (d). (a,b) Tilt boundary in a sample from ~150–200 m depth (exact depth not known), width 600 mm: (a) normal light; (b) polarized light. (c,d) Complex pattern of sublimation lines in a sample from 1134.6 m depth, width 600 mm: (c) normal light; (d) polarized light. Note the stepwise change in grey value on the left of the subgrain and several faint vertical subgrain boundaries.
There is, however, a particular type of straight sublimation line that can be very intense, yet at the same time manifests no shade difference (and consequently no c-axis misorientation) across it. As a rule, such a sublimation line is parallel to slip bands (Fig. 5b). We suggest two possible explanations for its origin: it could indicate a rotation of the basal planes about the c axis of the grain, in which case it would denote a ‘twist boundary’, or it could be generated by a strong and localized process of micro-shear, as proposed for other geological materials by Reference BonsBons (1999). It should be noted that neither twist boundaries nor micro-shear zones have been reported by Reference NakayaNakaya (1958), Reference Wilson, Hobbs and HeardWilson (1986) or Reference Zhang and WilsonZhang and Wilson (1997).
4.3. Interpretation of sublimation line features
Reference NakayaNakaya (1958) showed that subgrain boundaries tend to develop in regions of maximum stress/strain concentration. As evidence for strain localization we consider our finding that sublimation line features occur preferably at corners or bulges of high-angle grain boundaries. From our observations, we believe that in ice, as in other creeping rocks, strain localization is the rule rather than the exception (Reference BonsBons, 1999). In this sense, any apparent interaction between a subgrain boundary or sublimation line features and a highangle grain boundary may express such strain localization. We assume this explains the observations in Figure 5, that sublimation features are found on the convex side of highangle grain boundaries, while the concave sides appear free of sublimation features. High-angle grain boundaries probably migrate towards areas containing a higher density of deformation-related sublimation features (that is a higher density of stored strain energy, as sublimation lines indicate lattice defects) and leave undisturbed ice matrix behind them. Thus, grain-boundary migration may be driven in such cases by strain energy and not by grain-boundary curvature (surface tension/energy). It is surprising that the extremely wavy grain boundary from 154 m depth (Fig. 5d) also shows this behaviour, although it is generally argued that stored energy at such shallow depths should not be significant (Reference AlleyAlley, 1992; Reference Montagnat and DuvalMontagnat and Duval, 2000). However, there are good reasons to assume that stress and strain localization are particularly important at shallow depths, since the fabric there is isotropic, and consequently the grain-grain interaction should be strong, due to the difficult accommodation of intergranular incompatibility. Indeed, the most irregularly shaped grain boundaries are observed in the upper hundreds of metres. Strain localization is obviously an important aspect in the evolution of a single grain. What is remarkable is that the character of the observed patterns in individual grains does not change much down the core. Therefore, we are confident that concentration, strength and smoothness of sublimation grooves can be used to learn more about the deformation of a grain and finally to quantify the different processes controlling deformation and grain growth.
We assume that concentration, strength and smoothness of sublimation grooves reflect the evolution of the response of a grain to deformation. The more a grain or a part of a grain is strained, the more rich and intense sublimation patterns may be present. The most irregular patterns may characterize early stages of deformation, while a few strong and smooth lines correspond to stages of advanced recovery and annealing (e.g. subdivision of a grain). In this sense, microstructure mapping permits access to the deformation on the grain scale through optical microscopy. At this stage, the interpretations presented above should be regarded as preliminary, since statistical studies needed to draw firm conclusions are still in progress and the information about c-axis orientation is not yet available at the required resolution.
5. Discussion
The step forward with automated mapping is that digital images of entire sections in microscopic resolution are produced and the relevance of features can be investigated. Quantitative data about the occurrence of subgrain boundaries, slip lines and other microstructural features, like subgrain boundary loops or four junctions, become readily available and allow us to characterize the evolution of the microstructure on the grain scale.
As it is impossible to study the microstructure of polar ice under the conditions prevailing in the interior of an ice sheet, we have studied ice samples immediately after core extraction. We then repeated the mapping some time (hours and days) later. These analyses convinced us that there are only minor changes within the first hours and some days up to a few weeks after core extraction. It is very unlikely that the observed grain/subgrain-boundary patterns could be created during the less than 3–5 hours needed to prepare the fastest samples. Admittedly, there is a short period (of less than an hour) while the core is being pulled up from the borehole at 1 ms−1 and the pressure is dropping at a typical rate of ~1 kPa s−1. Nevertheless, we can hardly imagine that all mapped microstructural features are artefacts produced within this short time, seeing that most features are characteristic of slow deformation. Firn-core studies support this view. All microstructural features seen in deep ice cores are already present in firn and shallow ice cores, where the influence of the pressure release on the evolution of the microstructure should be negligible.
Now, if the visible sublimation line patterns are related to deformation, then microstructure mapping provides valuable information about the intracrystalline response of ice grains to deformation over a wide range of stages. Microstructure mapping can therefore fill the gap between observations on the ‘macroscale’, represented by classic texture and fabric studies, and those on the lattice scale, accessible only by electron microscopy (SEM/EBSD) and gamma-/X-ray diffraction studies (GRD/XRD). Provided that our interpretation of Figure 6 is correct, that is that the occurrence of sublimation line patterns on the convex side of grains is evidence of strain-induced boundary migration, then microstructure mapping may offer a means of characterizing and quantifying grain growth. The mosaic images contain all the necessary information to derive statistical data for investigating the role of strain-induced boundary migration, polygonization (subdivision of grains) and grain-boundary sliding. New phenomena, like subgrain islands, two-sided grains, twist boundaries and micro-shear, invariably call our attention to new views of the fundamental processes behind grain growth and inter-/intracrystal-line deformation. For the first time, layering and the effect of impurity load on grain growth and deformation can be studied at the grain scale. This is important for ice containing cloudy bands, where grain size also appears banded and switches with the cloudiness in ice.
Currently, a serious technical difficulty is the coupling of microstructure mapping data with c-axis orientation. Highresolution fabric data are needed to investigate how the features described above and the underlying processes are related to lattice orientation. Also mechanical tests (although performed at much higher deformation rates than in situ) are needed to investigate and compare the evolution of microstructural features of naturally and artificially deformed ice.
6. Conclusion
Through the method of microstructure mapping described here, imperfections of the ice matrix become optically visible on the surface when an ice specimen is carefully prepared and sublimated. We can distinguish not only grain and subgrain boundaries, but also more complex line patterns, probably related to various stages of deformation. Slip bands and other kinds of visible inclusions (ash particles, air bubbles and air clathrate hydrates) can also be observed.
Microstructure mapping is a tool not only to derive statistical data about inclusions, but also to study deformation on the grain scale and the interaction between neighbouring grains or within ensembles of a few tens/hundreds of grains. From the reconstructed mosaic images, qualitative and quantitative information can be derived to characterize the diverse deformation and recrystallization processes taking place in an ice sheet. Microstructure mapping should thus fill the gap between classic texture and fabric studies, where grain ensembles are treated statistically, and SEM/EBSD/GRD/XRD observations with extremely high resolution but very limited spatial range.
The method described in this work has been successfully applied to ice samples of the EPICA Microstructure Mapping Project, where it proved itself to be a fast means of documenting the microstructure of fresh ice-core samples during drilling. Our preliminary results suggest that intracrystalline deformation is highly inhomogeneous and all sublimation line patterns occur more or less independent of depth. This implies, for example, that stress/strain localization has to be taken into consideration to understand grain growth. Unfortunately, a coupling of these results to highresolution c-axis analysis on the grain and subgrain scale is not yet available.
Acknowledgements
F. Valero Delgado wrote the NIH Image macros. This work is a contribution to the European Project for Ice Coring in Antarctica (EPICA), a joint European Science Foundation/European Commission scientific programme, funded by the European Union and by national contributions from Belgium, Denmark, France, Germany, Italy, the Netherlands, Norway, Sweden, Switzerland and the United Kingdom. The main logistic support was provided by Institut Polaire Français–Emile Victor (IPEV) and Programma Nazionale di Ricerche in Antartide (PNRA) (at Dome C) and the Alfred Wegener Institute for Polar and Marine Research (AWI) (at Dronning Maud Land). This is EPICA publication No. 158.


