





Introduction
Bipolar disorder (BD) and schizophrenia (SCZ) are debilitating psychiatric disorders with a substantial global burden (Castelpietra et al., Reference Castelpietra, Knudsen, Agardh, Armocida, Beghi, Iburg and Monasta2022). BD manifests through alternating manic/hypomanic and major depressive episodes, while SCZ is characterized by delusions, hallucinations, disorganized thinking (speech), grossly disorganized or abnormal motor behavior, and negative symptoms (American Psychiatric Association, 2022). BD and SCZ were referred to as manic-depressive psychosis and dementia praecox, respectively, according to the Kraepelinian dichotomy (Craddock & Owen, Reference Craddock and Owen2005). Over a century, they are still two distinct disorders in current clinical practice, based on the Diagnostic and Statistical Manual of Mental Disorders (fifth edition text revision, DSM-5 TR) (American Psychiatric Association, 2022) and the Classification of Mental and Behavioral Disorders from International Classification of Diseases 11th revision (ICD-11). However, there is an ongoing debate between dichotomy and continuum (Cheniaux et al., Reference Cheniaux, Landeira-Fernandez, Lessa Telles, Lessa, Dias, Duncan and Versiani2008; Winokur, Monahan, Coryell, & Zimmerman, Reference Winokur, Monahan, Coryell and Zimmerman1996). BD and SCZ truly share certain risk factors, clinical symptoms, and antipsychotic treatments from an epidemiological and clinical perspective (Pearlson, Reference Pearlson2015). Furthermore, genetic studies have revealed high heritability and overlapping genetic susceptibility between BD and SCZ (Bipolar Disorder and Schizophrenia Working Group of the Psychiatric Genomics Consortium, Electronic address, 2018; Craddock, O’Donovan, & Owen, Reference Craddock, O’Donovan and Owen2005), emphasizing the need to explore their genetic relationship concerning the underlying pathophysiology in the brain.
Brain network connectivity provides an integrated summary of the large-scale circuit organization, making it a suitable intermediate phenotype for imaging-genetic analyses. Brain magnetic resonance imaging (MRI) studies have provided abundant evidence that abnormal functional connectivity (FC) and structural connectivity (SC) were found and related to cognitive function and clinical syndromes in patients diagnosed with BD and SCZ (Liang et al., Reference Liang, Huang, Guo, Wu, Li, Xu and Chen2022; Qiu et al., Reference Qiu, Dai, Zou, Zhao, Xia, Li and Wei2021). For example, aberrant FC in anterior cingulate cortex within default mode network (DMN) and visual network (VN) was associated with different psychosis symptoms in first-episode SCZ (Qiu et al., Reference Qiu, Dai, Zou, Zhao, Xia, Li and Wei2021). Unfortunately, those findings play a negligible role in clinical psychiatric diagnosis and treatment, due to lack of reproducibility and consistence (Marek et al., Reference Marek, Tervo-Clemmens, Calabro, Montez, Kay, Hatoum and Dosenbach2022).
Accumulating evidence suggests that genetic determinants play a significant role in shaping brain network connectivity and overlap with the genetic architecture of psychiatric disorders (Medland et al., Reference Medland, Grasby, Jahanshad, Painter, Colodro-Conde, Bralten and Group2022). A recent genome-wide association study (GWAS) study on FC and SC within resting-state networks (RSNs) was conducted to detect genetic architecture of within-RSN FC and SC properties (Tissink et al., Reference Tissink, Werme, de Lange, Savage, Wei, de Leeuw and van den Heuvel2023), advancing the understanding of the complex organization of the brain networks from a genetic viewpoint. We delve into the realm of imaging genetics, targeting a comprehensive understanding of how genetic factors contribute to brain connectivity abnormalities in BD and SCZ.
In this study, we hypothesized that SCZ and BD share part of their genetic basis but also show disorder-level differences in genetic factors alternating brain network connectivity. To test this, we first performed genome-wide inferred statistics (GWIS) to separate shared and disorder-unique genetic components and examined their associations with brain connectivity. We isolated trait-specific associations after accounting for shared genetic liability and to avoid inflated signals driven by overlapping genetic influences. This analytic framework enabled us to link genetic variation to brain connectivity patterns and their contribution to SCZ and BD.
Methods and materials
Data sources
In this study, we aim to dissect the genetic architecture underlying SCZ and BD and their relationship with brain network connectivity alterations. All of our following analyses are summary statistics based on Supplementary Table 1. For BD and SCZ, we used the GWAS results of BD conducted by Mullins et al. (Mullins et al., Reference Mullins, Forstner, O’Connell, Coombes, Coleman, Qiao and Andreassen2021) including 41,917 cases and 371,549 controls, and those of SCZ conducted by Trubetskoy et al. (Trubetskoy et al., Reference Trubetskoy, Pardiñas, Qi, Panagiotaropoulou, Awasthi and Bigdeli2022) including 76,755 cases and 243,649 controls. For brain connectivity, we used the GWAS results of 16 FC and SC within RSNs conducted by Tissink et al. (Reference Tissink, Werme, de Lange, Savage, Wei, de Leeuw and van den Heuvel2023) in the UK Biobank participants (N = 24,336). FC and SC were quantified as the average Pearson’s correlation coefficient and average fractional anisotropy of the connections within the referred seven canonical RSNs defined by Yeo et al. (Reference Yeo, Krienen, Sepulcre, Sabuncu, Lashkari, Hollinshead and Buckner2011), including the DMN, ventral attention network (VAN), dorsal attention network (DAN), visual network (VN), limbic network (LN), somatomotor network (SMN), and frontoparietal control network (FPCN). Additionally, a global measure of FC/SC was calculated for the whole-brain connections. These traits were derived using standardized parcellation and preprocessing pipelines as described in the original publication. All the above studies were carried out in the population of European ancestry.
Genome-wide inferred statistics
The overall pipeline of our study is shown in Figure 1. To detangle the relationship between SCZ and BD and identify the distinct genetic architecture for each one, we chose the GWIS (https://github.com/MichelNivard/EA_SZ/tree/ master/GWIS) (Nieuwboer et al., Reference Nieuwboer, Pool, Dolan, Boomsma and Nivard2016) to derive a secondary, genetically unique GWAS result for SCZ and BD by applying the following functions to the original GWAS data:
 $$ {\displaystyle \begin{array}{c} Unique\hskip0.42em SCZ\hskip0.42em \left({SCZ}_{uniq}\right)=\left(1+c\right) SCZ-\left(1-c\right) BD\\ {} Unique\hskip0.42em BD\hskip0.42em \left({BD}_{uniq}\right)=\left(1+d\right) BD-\left(1-d\right) SCZ\end{array}} $$
where
 $$ c=\frac{h_{BD}^2- Coh\left( BD, SCZ\right)}{h_{BD}^2+ Coh\left( BD, SCZ\right)}\hskip0.88em d=\frac{h_{scz}^2- Coh\left( BD, SCZ\right)}{h_{scz}^2+ Coh\left( BD, SCZ\right)} $$ $ {h}_{BD}^2 $
and
$ {h}_{BD}^2 $
and $ {h}_{scz}^2 $
means the heritability of BD and SCZ and Coh (BD, SCZ) means coheritability between BD and SCZ.
$ {h}_{scz}^2 $
means the heritability of BD and SCZ and Coh (BD, SCZ) means coheritability between BD and SCZ.
The workflow of the study. Note: BD; SCZ; BDuniq; SCZuniq; RSN-FC/SC; FUMA; LDSC; LAVA; GWIS.

In brief, we applied GWIS to estimate SCZ-unique (SCZuniq) and BD-unique (BDuniq) components by removing the linear shared genetic variance between SCZ and BD, which are based on DSM-defined diagnosis. These GWIS-derived components do not imply fully independent biological pathways but rather represent disorder-associated signals once the shared portion is removed. We consistently use the terms BD, SCZ, BDuniq, and SCZuniq throughout the manuscript. To further understand the biological implications of two GWIS-derived components, we subsequently subjected them to the Functional Mapping and Annotation (FUMA) platform (Watanabe, Taskesen, van Bochoven, & Posthuma, Reference Watanabe, Taskesen, van Bochoven and Posthuma2017) and SynGO (Koopmans et al., Reference Koopmans, van Nierop, Andres-Alonso, Byrnes, Cijsouw, Coba and Verhage2019) for functional annotation and enrichment analyses.
Global and local genetic correlation
For the first step, we chose the linkage disequilibrium-score regression (LDSC) (Bulik-Sullivan et al., Reference Bulik-Sullivan, Loh, Finucane, Ripke, Yang and Neale2015) to investigate the single nucleotide polymorphism (SNP)-based heritability and global genetic correlation between SCZ, BD, and 16 RSN-FC/SCs. The LDSC calculates the LD score using the 1000G EUR as the reference panel and generates a genome-wide genetic correlation (rg) for each trait pair. To examine genetic overlap at a finer resolution, we then applied the Local Analysis of [co]Variant Association (LAVA) (Werme, van der Sluis, Posthuma, & de Leeuw, Reference Werme, van der Sluis, Posthuma and de Leeuw2022). LAVA estimates local genetic correlation within 2495 genomic regions which were predefined by Werme et al. using 1000 Genomes (EUR) data with the minimum block size set to 2500 (locations are in reference to build hg19/GRCh37) (Werme et al., Reference Werme, van der Sluis, Posthuma and de Leeuw2022). For each genomic locus, LAVA generates a local genetic correlation (rg) for each trait pair. The nominally significant threshold was set as 0.05, and we applied false discovery rate (FDR) correction to control for multiple testing.
Omnigenic mendelian randomization
Since the genetic correlation studies only demonstrate covariations, not a directed causal relationship between two variables, we conducted the two-sample Mendelian randomization (MR) studies to establish the causal relationship between four disorder phenotypes (both SCZ/ SCZuniq and BD/ BDuniq) and 16 RSN-FC/SCs. The seminal study by Boyle et al. proposed an omnigenic model for complex disorders such as BD and SCZ, in which it is postulated that in the tissues relevant to the disorder, all the expressed genes contributed, in a different role, to the pathogenesis of the disorder (Boyle, Li, & Pritchard, Reference Boyle, Li and Pritchard2017). Based on the new disease model, omnigenic Mendelian randomization (OMR) (Wang et al., Reference Wang, Gao, Fan, Xue and Zhou2021) analysis provides a novel analytic framework for two-sample MR studies. The method is based on the concept of the omnigenic model, which uses genome-wide SNPs to serve as instrumental variables (IVs). OMR utilizes summary statistics from GWAS as input and relies on a composite likelihood framework for scalable computations. Each OMR analysis output includes two primary parameters: the causal effect (α) and the proportion of SNP horizontal pleiotropy effect in the outcome variable (γ). We used the R package ‘OMR’ to perform the OMR analyses between four disorder traits and 16 RSN-FC/SC traits. For each analysis, the brain network connectivity trait (RSN-FC/SC) was chosen as the exposure and the disorder trait as the outcome. The generated P values were corrected using Bonferroni multiple comparison method (0.05/64 = 7.81 x10⁻⁴).
Results
The GWIS analysis was first conducted to separate shared and disorder-unique genetic components, accounting for shared genetic liability. The annotation findings from two GWIS-derived genetic components of BD and SCZ are displayed in the Supplementary Tables 2–10, including SynGO and Multi-marker Analysis of GenoMic Annotation (MAGMA) annotation results. The top significant gene set in MAGMA gene-set analysis for both BDuniq and SCZuniq was the set named ‘Gene Ontology (GO): membrane protein complex’. Furthermore, for BDuniq, 14 of 221 fine-mapped genes were mapped to SynGO-annotated genes, while, 30 of 552 fine-mapped genes of SCZuniq GWAS were found to be associated with synaptic signaling and synaptic function, in the Supplementary Tables 7 and 8. Moreover, the tissue enrichment analysis using MAGMA identified the most significant associated brain region for BDuniq to be the hippocampus ( $ \beta $
= 0·041 [0·024,0·069], P = 5·22
$ \beta $
= 0·041 [0·024,0·069], P = 5·22 $ \times {10}^{-7} $
), and the most significant one for SCZuniq to be the frontal cortex BA9 (
$ \times {10}^{-7} $
), and the most significant one for SCZuniq to be the frontal cortex BA9 ( $ \beta $
= 0·037 [0·022,0·068], P = 7·28
$ \beta $
= 0·037 [0·022,0·068], P = 7·28 $ \times {10}^{-7} $
), detailed in the Supplementary Tables 9 and 10.
$ \times {10}^{-7} $
), detailed in the Supplementary Tables 9 and 10.
The global genetic correlation analyses between two disorder phenotypes and 16 neural FC and SC within RSNs indicated a positive rg between SCZ and FC_DAN (rg = 0.180 [0.059, 0.534], P = 0.0035), whereas SC_VN was the one correlated with BD with a negative coefficient (rg = −0.161 [−0.269, −0.478], P = 0.0032). After excluding the shared genetic liability using GWIS, the correlation between SCZuniq and FC_DAN remained with a smaller magnitude of significance (rg = 0.231 [0.072, 0.683], P = 0.0043), whereas the correlation between SCZuniq and SC_DAN became more significant (rg = −0.118 [−0.219, −0.349], P = 0.02). Meanwhile, the correlation between BDuniq and SC_VN remained less significant without the shared genetic liability with SCZ (rg = −0.152 [−0.270, −0.450], P = 0.011), and its correlation with the SC_DAN signaled a hint of significance (rg = 0.114 [0.001,0.338], P = 0.049). The correlation heatmap is displayed as Figure 2a, with detailed results shown in the Supplementary Table 11.
Genetic association analysis between disease traits and RSN-FC/SC. Note: (a) Heatmap showing genome-wide genetic association between disease traits (BD, BDuniq, SCZ, SCZuniq) and 16 RSN-FC/SC, positive and negative correlations are indicated by the color gradient; (b) The number of loci with significant genetic assocation between disease traits (BD, BDuniq, SCZ, SCZuniq) and 16 RSN-FC/SC. Each segment represents an RSN network or global connectivity measure, and the width corresponds to the number of loci reaching statistical significance BD; SCZ; BDuniq; SCZuniq; RSN-FC/SC; FC/SC within DMN, FC/SC_Default; FC/SC within VAN, FC/SC_Ventral_A; FC/SC within DAN, FC/SC Dorsal_A; FC/SC within VN, FC/SC_Visual; FC/SC within LN, FC/SC_Limbic; FC/SC within SMN, FC/SC_Somatomotor; FC/SC within FPCN, FC/SC_Frontoparietal.
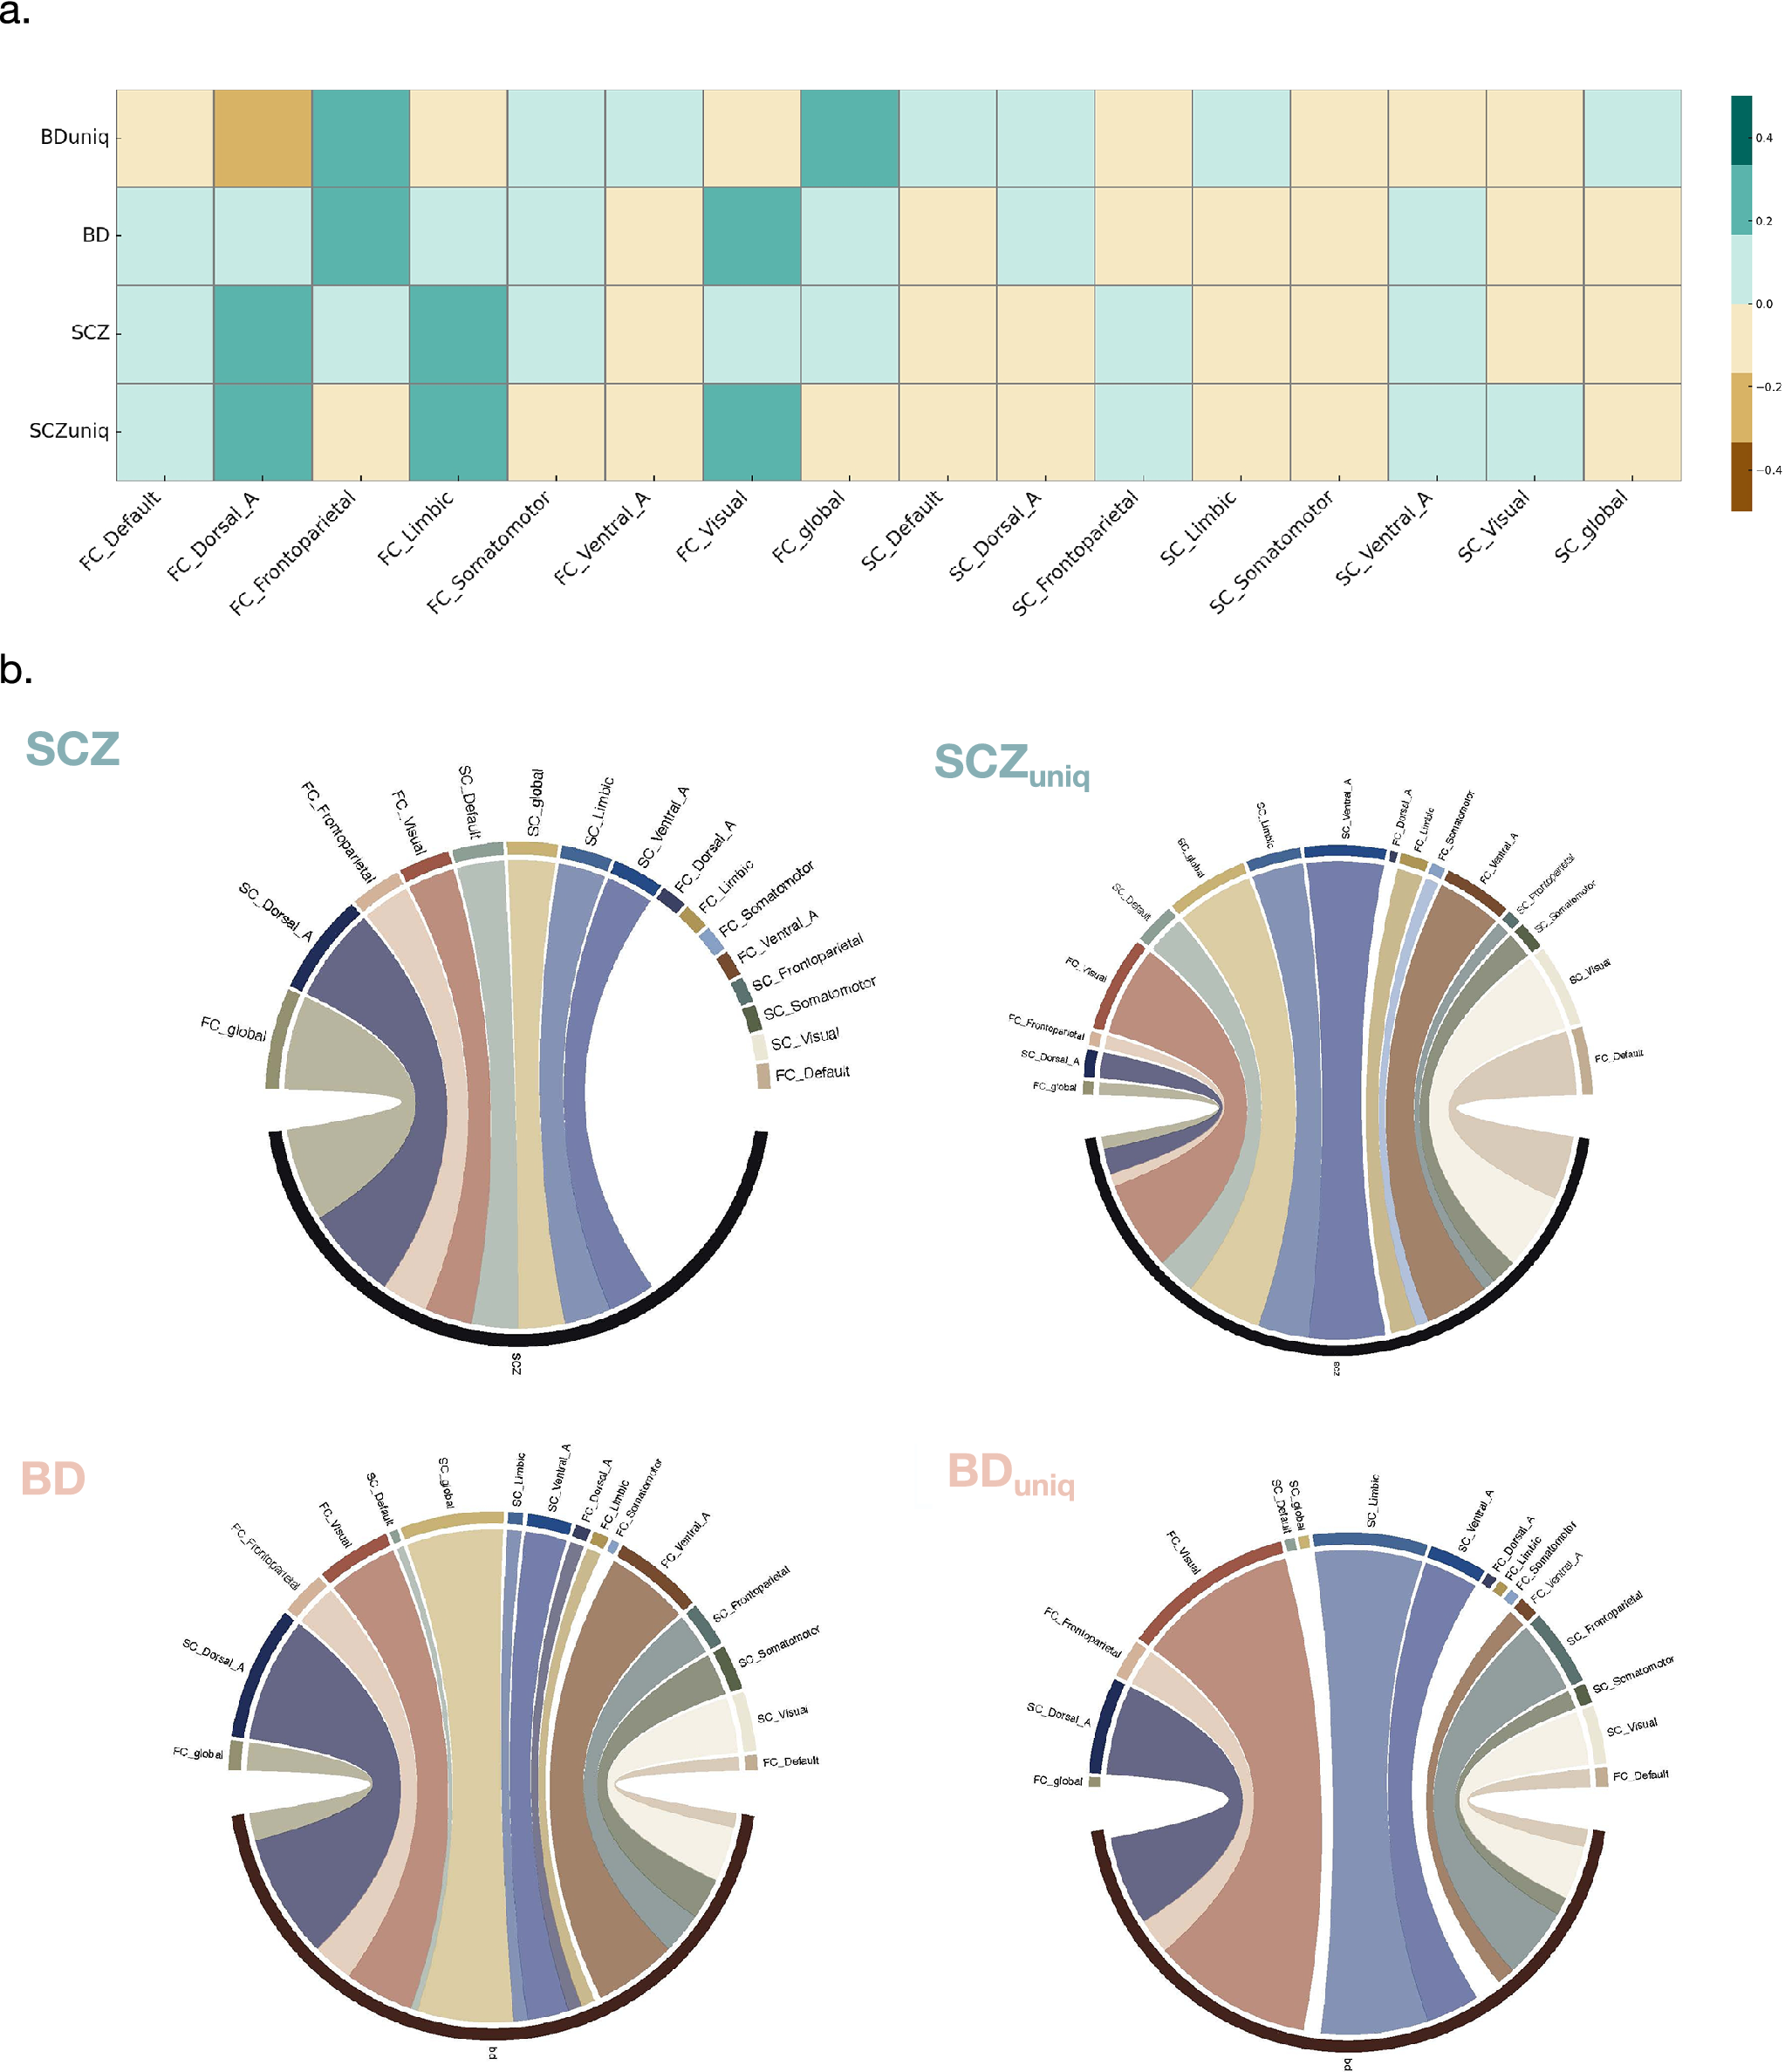
We then carried out an investigation of local correlation patterns using LAVA (Werme, van der Sluis, Posthuma, & de Leeuw, Reference Werme, van der Sluis, Posthuma and de Leeuw2022). Accounting for the shared genetic liability using GWIS, the bivariate local rg between SCZ/SCZuniq, BD/BDuniq and 16 neuroimaging traits identified 204 loci showing Bonferroni-corrected significance, shown in the Figure 2b and the Supplementary Table 12. For BD, the most significant signal arose from the locus chr3:71223282–72334704 with SC_LN, generating a P value of 1.64E-08 (r2 = 1); such signal receded with BDuniq (P = 1.29 x10⁻⁴) while the locus chr14:99474534–100786189 generated the strongest signal between BDuniq and SC_VN (rg = 1, P = 9.47 x10⁻⁷). Intriguingly, the most significant locus for the local rg with SCZ was chr11:114742318–116247377 for SC_LN (rg = 1, P = 8.28 x10⁻⁸) while the local rg in chr5:174662886–176180301 with FC_VN showed the strongest signal for SCZuniq (r2 = 0.622333, P = 1.34 x10⁻⁷). As for the number of significant loci, as detailed in the Supplementary Table 13, SCZ shared the most significant numbers with SC_VN (n = 13) whereas SCZuniq shared the most with SC_global (n = 6), SC_VAN (n = 6), and SC_VN (n = 6). As for BD, the highest numbers of local rg were shared with SC_DAN (n = 9); after excluding the common genetic liability with SCZ, BDuniq shared the most significant loci with FC_VN (n = 9).
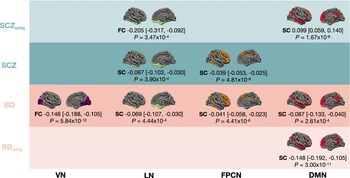
The OMR using the omnigenic model as IVs was applied from 16 RSN-FC/SC to four disorder traits (BD, BDuniq, SCZ, SCZuniq). The results were summarized in Figure 3 (also seen in the Supplementary Table 14). A shared overlap was detected for SC_LN and both disorders (for BD: $ \alpha $
= −0.0687 [−0.107, −0.0304], P = 4·43E-04; for SCZ:
$ \alpha $
= −0.0687 [−0.107, −0.0304], P = 4·43E-04; for SCZ: $ \alpha $
= −0.0666 [−0.103, −0.0298], P = 3.90 x10⁻⁴), and also for FPCN (for BD:
$ \alpha $
= −0.0666 [−0.103, −0.0298], P = 3.90 x10⁻⁴), and also for FPCN (for BD: $ \alpha $
= −0.0405 [−0.0579, −0.0232], P = 4.41 x10⁻⁶; for SCZ:
$ \alpha $
= −0.0405 [−0.0579, −0.0232], P = 4.41 x10⁻⁶; for SCZ: $ \alpha $
= −0.0393 [−0.0534, −0.0252], P = 4.81 x10⁻⁸). Additionally, FC_VN was found significantly associated with BD (
$ \alpha $
= −0.0393 [−0.0534, −0.0252], P = 4.81 x10⁻⁸). Additionally, FC_VN was found significantly associated with BD ( $ \alpha $
= −0.146 [−0.188, −0.105], P = 5.84 x10⁻¹²). Accounting for shared genetic liability, a significant causality was detected between SC_DMN and both BDuniq and SCZuniq, albeit with the opposite directions (for BDuniq:
$ \alpha $
= −0.146 [−0.188, −0.105], P = 5.84 x10⁻¹²). Accounting for shared genetic liability, a significant causality was detected between SC_DMN and both BDuniq and SCZuniq, albeit with the opposite directions (for BDuniq: $ \alpha $
= −0.148 [−0.192, −0.105], P = 3.0 x10⁻¹¹; for SCZuniq:
$ \alpha $
= −0.148 [−0.192, −0.105], P = 3.0 x10⁻¹¹; for SCZuniq: $ \alpha $
= 0.0994 [0.0587, 0.14], P = −1.67 x10⁻⁶). Besides, FC_LN (
$ \alpha $
= 0.0994 [0.0587, 0.14], P = −1.67 x10⁻⁶). Besides, FC_LN ( $ \alpha $
= −0·205 [−0·317, −0·0925], P = 3.47 x10⁻⁴) was causally associated with SCZuniq. All the results remained statistically significant after Bonferroni corrections (0.05/64 = 7.81 x10⁻⁴).
$ \alpha $
= −0·205 [−0·317, −0·0925], P = 3.47 x10⁻⁴) was causally associated with SCZuniq. All the results remained statistically significant after Bonferroni corrections (0.05/64 = 7.81 x10⁻⁴).
OMR results between disease traits and RSN-FC/SC. Note: Significant results of OMR between SCZ, BD, their GWIS-derived unique components (SCZuniq and BDuniq), RSN-FC/SC are shown for the significantly associated networks. Effect sizes and 95% confidence intervals are displayed for each phenotype–network pair, together with the corresponding P values. VN: Visual Network, LN: FPCN: FrontoParietal Control Network, DMN: Default Mode Network, FC: Fucntional connectivity, SC: Structural Connectivity.

Discussion
In the current study, we endeavored to detangle the shared and unique genetic architecture of BD and SCZ and their relationships with brain network connectivity alterations, specifically, connectivity within RSNs. Using the advanced mathematical algorithm, we generated new GWAS results for BD and SCZ, presumably eliminating their common genetic liability, only leaving the disorder-unique genetic components (BDuniq and SCZuniq). Further, we investigated their genetic relationships, both non-directional and directional, RSN connectivity alterations.
Many lines of evidence point to a remarkable overlap between BD and SCZ (Girgenti et al. (Reference Girgenti, LoTurco and Maher2012)). How to carve up the biological delineator for each disorder plays a pivotal role in understanding and improving the current nosology and treatment. While it remains enormously challenging to collect unique samples based on current phenomenology-oriented diagnosis criteria, utilizing genome-wide information gleaned from GWASs and mathematical algorithms could shed promising light on the shared and unique genetic underpinning of two disorders (Dang et al. (Reference Dang, Song, Lv, Yang and Luo2023)). Programs such as MiXeR (Frei et al., Reference Frei, Holland, Smeland, Shadrin, Fan, Maeland and Dale2019) quantify the number of causal variants shared by two phenotypes, but they fall short of providing detailed knowledge regarding these causal variants. The GWIS, on the other hand, applies functions to well-powered GWAS summary statistics and derives the secondary results. One of the main advantages of GWIS is that its results enable downstream analyses such as the calculation of genetic correlation and MR study, which take GWAS summary statistics as input. It is important to clarify that the GWIS-derived ‘unique’ components do not represent fully independent biological mechanisms. Rather, they capture both the residual genetic signal and the potential disorder-level differences that become apparent after the shared variance between SCZ and BD.
For GWIS-derived unique components, subsequent fine-mapping and tissue enrichment analyses revealed that both disorders are significantly enriched in the GO term membrane protein complex and the SynGO term synapse, consistent with prior evidence implicating synaptic and membrane-related dysfunction in both disorders (Liu et al. (Reference Liu, Caballero-Floran, Hergenreder, Yang, Hull, Pan and Ye2023)). There is a long history of hypotheses and emerging evidence concerning synapses and receptors on neuron membranes in BD and SCZ (Verschueren et al. (Reference Verschueren, Husain, Yuen, Sun, Paduchuri, Senbabaoglu and Martinez-Martin2020)). The SynGO database further underscores the critical role of synapse in their neuropathology. Although the two GWIS-derived unique components show overlapping pathway enrichments, these shared signals do not necessarily indicate identical biological mechanisms. Further work will be needed to clarify whether these overlaps reflect true convergence or arise from residual shared architecture. Moreover, the majority of brain tissues expressions were found to be associated with BDuniq and SCZuniq. Among them, the frontal cortex and hippocampus appeared among the top-enriched by SCZuniq and BDuniq, respectively, based on the ranking of enrichment P values. This provides a potential mechanistic clue in brain regions or networks whose synapse or neural dysfunctions may contribute to each condition. This suggests that apparently overlapping biological themes may still involve disorder-specific molecular mechanisms. Another explanation is that genetic heterogeneity underlies clinical heterogeneity, rather than dichotomous diagnostic heterogeneity.
Indeed, the subsequent global and local genetic correlation analyses corroborate our preliminary theory that different network connectivity is associated with each different condition. For example, the global genetic correlation analyses suggested the association of attention networks with both disorders, but the pattern of associations differed between them. Introduced by Corbetta and Shulman, attention networks are the frontoparietal systems which are activated when perceiving different kinds of objects in the surroundings (Corbetta & Shulman, Reference Corbetta and Shulman2011). Attention deficits have been identified by different studies as the key features of both SCZ and BD, especially of their psychotic symptoms. Larsson et al. carried out a co-segregating study of SCZ, BD and attention-deficit hyperactivity disorder (ADHD) and found an increased risk of predisposing to BD and SCZ for the first-degree relatives of ADHD probands (Larsson et al., Reference Larsson, Ryden, Boman, Langstrom, Lichtenstein and Landen2013). Our findings suggest that the DAN may play an important role, as SC_DAN showed relatively higher number of significant associated loci across BD (N = 9), SCZ (N = 6), BDuniq (N = 5), and SCZuniq (N = 2). Although altered attention network activities have been reported in both disorders, which may have been influenced by overlapping symptoms and clinical heterogeneity. The findings from the current study, by excluding genetic covariation between SCZ and BD, provided additional evidence that DAN may contribute to each disorder through partly overlapping yet distinct pathways.
Our study also detected a comprehensive association analysis at both the genome-wide and local levels, revealing a complex interplay of positive and negative genetic effects. Given the intrinsic genetic landscape and the ongoing debate around the dysconnectivity hypothesis, we utilized OMR to infer potential causal relationships from brain connectivity to the original and unique parts of BD and SCZ. Of note, both SCZ and BD showed negative association with the SC_LN. After excluding the shared genetic disposition, SCZuniq continued to show a stronger negative association with FC_LN, whereas BDuniq did not retain a similar pattern. It suggests that limbic-related genetic components may remain more specifically linked to SCZ than to BD. And LN is responsible for not only behavioral and emotional responses but also dopaminergic projections, contributing to neurophysiology and treatments of two disorders (Bi, Che, & Bai, Reference Bi, Che and Bai2022; Dugre, Bitar, Dumais, & Potvin, Reference Dugre, Bitar, Dumais and Potvin2019; Wang et al., Reference Wang, Zhang, Yu, Niu, Niu, Li and Liu2022). The limbic dysfunction has long been recognized as mea culpa of both SCZ and BD, especially their psychosis symptoms, which may partially align with our findings.
The frontoparietal network plays an important role in cognitive control and working memory, whose disruptions were found to be associated with core symptoms in both disorders (Baker et al., Reference Baker, Holmes, Masters, Yeo, Krienen, Buckner and Ongur2014; Dong et al., Reference Dong, Wang, Chang, Luo and Yao2018; Ye et al., Reference Ye, Sun, Gao, Dadashkarimi, Rosenblatt, Rodriguez and Scheinost2023). In our analysis, both SCZ and BD showed negative associations with SC_FPCN, but these associations did not remain significant after accounting for shared genetic liability in SCZuniq and BDuniq. This pattern suggests that reduced frontoparietal connectivity may reflect a general cognitive dysfunction shared by the two disorders. Meanwhile, the SC within DMN showed opposite effects on BDuniq and SCZuniq. A prior structural MRI study showed that overall reductions in SC in both disorders, but SCZ has additionally been associated with increased fractional anisotropy in certain fiber tracts within the default network (Ji et al., Reference Ji, Guevara, Guevara, Grigis, Labra, Sarrazin and Houenou2019). Other studies have found that SCZ patients displayed more impairments in SC than BD patients (Cea-Canas et al., Reference Cea-Canas, de Luis, Lubeiro, Gomez-Pilar, Sotelo, Del Valle and Molina2019; Repple et al., Reference Repple, Gruber, Mauritz, de Lange, Winter, Opel and Dannlowski2023). These heterogeneous findings may reflect differences in clinical state, symptom profiles, or medication effects, making it plausible that the GWIS-derived unique components capture disorder-level opposite effect in DMN involvement once the shared signal is removed.
Both SCZ and BD have been found to be associated with visual perception impairment (Adámek, Langová, & Horáček, Reference Adámek, Langová and Horáček2022; Fernandes, Silverstein, Almeida, & Santos, Reference Fernandes, Silverstein, Almeida and Santos2019). In line with this, our LAVA results showed that the VN exhibited one of the largest numbers of loci with significant local genetic correlation across SCZ, BD, BDuniq, and SCZuniq. The visual impairments in both disorders have been reported in the same direction, for example, the higher visual discrimination thresholds (Løchen et al., Reference Løchen, Kolskår, de Lange, Sneve, Haatveit, Lagerberg and Westlye2023), poorer visual acuity (Shoham et al., Reference Shoham, Lewis, Hayes, Silverstein and Cooper2023), and faster bi-stable switch (Killebrew et al., Reference Killebrew, Moser, Grant, Marjańska, Sponheim and Schallmo2024), compared to healthy controls. However, in the OMR analysis, only BD showed a significant association with VN connectivity. This discrepancy is expected. Although we describe the assumptions of the OMR framework, the results should still be interpreted cautiously. Therefore, our findings from genetic correlation and MR analysis provide suggestive evidence of possible directional effects but cannot establish definitive causal claims. Longitudinal individual level data will help refine these interpretations.
Although promising and guaranteeing further explorations, our study has a few limitations. First, the available brain connectivity GWAS are based on a modest sample size and lack an independent replication cohort, which may increase uncertainty in effect size estimates and the risk of false-positive associations. Our analyses were based on European-ancestry GWAS, which may limit generalizability to other populations. As more diverse imaging GWAS become available, future work can evaluate whether these network-genetic relationships hold across ancestries. Additionally, neuroimaging preprocessing needs standard and universal imaging preprocessing methods. Ongoing international efforts to harmonize MRI preprocessing across sites will likely improve the consistency and robustness of imaging-genetic associations. Last but not least, more dimensional and precise phenotype should be incorporated in the following genetic study to model clinical heterogeneity and comorbidity (Waszczuk et al., Reference Waszczuk, Jonas, Bornovalova, Breen, Bulik, Docherty and Waldman2023).
In summary, our findings separate the shared and disorder-unique genetic components of SCZ and BD and demonstrate how these components relate to patterns of brain network connectivity. The integrated genetic and network-level evidence provides a clearer view of the common and distinct biological components involved. Although further replication and individual-level imaging–genetic data will be needed, this framework may eventually support early diagnostic stratification and guide the development of more targeted interventions, including neurostimulation approaches that focus on altered connectivity rather than DSM categories.
Supplementary material
The supplementary material for this article can be found at http://doi.org/10.1017/S0033291726104413.
Data availability statement
All the GWAS summary statistics used in this study are publicly available. The SCZ and BD GWAS data are accessible on the Psychiatric Genomics Consortium website. The imaging GWAS summary statistics from Tissink et al. (Reference Tissink, Werme, de Lange, Savage, Wei, de Leeuw and van den Heuvel2023) are available through the corresponding repository (link provided in their publication).
Acknowledgments
This work was supported by STI2030-Major Projects (2022ZD0212400 to H.R.), the National Natural Science Foundation of China (grant number 82571712 to Q.W.), the Chinese National Programs for Brain Science and Brain-like Intelligence Technology-China Depression Cohort Study (2021ZD0200700 to Q.W.), the Chengdu Science and Technology - Key R&D Support Program (2025-YF09-00030-SN to Q.W.), and the Science and Technology Project of Sichuan Province (2023YFS0030 to Q.W.). Additionally, the National Natural Science Foundation of China (grant number 81920108018 to T.L.), the Key R & D Program of Zhejiang (2022C03096 to T.L.), the Project for Hangzhou Medical Disciplines of Excellence & Key Project for Hangzhou Medical Disciplines (grant number 202004A11 to T.L.), and grants from the Nanhu Brain-computer Interface Institute (T.L.) have also supported this research.
Author contribution
H.R and Y.L designed and conducted the major analyses and wrote the manuscript. Q.W., T.L., M.L. supervised the study and consulted with Ren and Liu about statistical analysis. Y.H., Y.T., L.X, Y.W., S.L., Y.Y., Q.M., M.D., S.T. and M.X. participated in data collection and analyses. All authors participated in the discussions and revisions of the paper.
Competing interests
The authors declare none.



 Open access

