


Introduction
The coronavirus disease 2019 (COVID-19) remains a significant concern in many countries throughout the world. The number of new cases continues to grow worldwide, and this situation expands the capacity of healthcare resources to its limit. A decisive mitigation approach and effective allocation of resources are essential in slowing the progress of the pandemic, therefore, early assessments to forecast the clinical course of the disease are critical. The levels of several inflammatory parameters are often elevated in the context of severe COVID-19, given the excessive immune response to viral infection resulting in a hyperinflammatory state [Reference Huang1]. Basic investigation such as complete blood count may prove useful in predicting the prognosis of COVID-19 patients. In addition to a reduced lymphocyte count [Reference Huang and Pranata2], the platelet count can be found in low levels in individuals with severe COVID-19 infection. This systematic review and meta-analysis aimed to evaluate thrombocytopenia as a prognostic biomarker in patients with COVID-19. We performed a diagnostic test accuracy meta-analysis to evaluate whether thrombocytopenia can be a suitable prognostic biomarker.
Material and methods
This is a Preferred Reporting Items for Systematic Reviews and Meta-Analyses (PRISMA) compliant systematic review and meta-analysis. The protocol was registered in International Prospective Register of Systematic Review (PROSPERO) with ID: CRD42020213974.
Eligibility criteria
In this study we include research articles (both prospective and retrospective observational studies) and letters containing research data that report COVID-19 confirmed adults with information on thrombocytopenia (categorical) and mortality/severity/intensive care unit (ICU) care/invasive mechanical ventilation (IMV) (categorical).
We excluded preprints, abstract-only articles, reviews, editorials/commentaries, non-research letters, studies with less than 20 patients, case reports and non-English language articles. Studies reporting only continuous variables of platelets were excluded. Preprint articles were excluded because of the varying credibility [Reference Henrina, Lim and Pranata3].
Search strategy and study selection
We performed a systematic literature search using PubMed, Embase and EuropePMC with keywords ‘COVID-19’ OR ‘SARS-CoV-2’ OR ‘2019-nCoV’ AND ‘thrombocytopenia’ OR ‘low platelet’ AND ‘Mortality’ OR ‘Death’ OR ‘non-survivor’ OR ‘severity’ OR ‘disease progression’ or ‘intubation’ OR ‘mechanical ventilation’ OR ‘intensive care unit’ from inception up until 12 October 2020. The PubMed (MEDLINE) search strategy was ((COVID-19) OR (SARS-CoV-2) OR (2019-nCoV)) AND ((thrombocytopenia) OR (low platelet)) AND ((mortality) OR (death) OR (non-survivor) OR (severity) OR (disease progression) or (intubation) OR (mechanical ventilation) OR (intensive care unit)). After recording the initial search and removal of duplicates, two independent authors performed title/abstract screening on the basis of inclusion and exclusion criteria.
Data extraction
Two authors independently performed data extraction of the included studies with the help of standardised extraction forms containing the rows and columns related to the first author, year of publication, study design, age, gender, hypertension, diabetes, chronic kidney diseases (CKD), lymphocyte counts, d-dimer levels and outcome of interests.
The main outcome was composite poor outcome, which is a composite of mortality, severity, ICU care and IMV. Mortality was defined as clinically validated mortality/death/non-survivor.
Severity was defined according to the included studies' parameters, which might be WHO−China Joint Mission on coronavirus disease definition, disease progression or others. ICU care and mechanical ventilation were defined as the need for ICU admission and IMV/intubation, respectively. The pooled effect estimates were presented as risk ratios (RRs). Additionally, diagnostic meta-analysis will use sensitivity, specificity, positive likelihood ratio (PLR), negative likelihood ratio (NLR), diagnostic odds ratio (DOR) and area under curve (AUC) for the effect estimates.
Risk of bias assessment
Risk of bias assessment of individual studies was performed by two independent authors using the Newcastle−Ottawa Scale [Reference Wells4], and any discrepancies were resolved by discussion.
Statistical analysis
To perform statistical analysis, we used STATA 16 (Stata Corp, College Station, TX, USA). We performed the meta-analysis of proportion for patients with thrombocytopenia. To perform pooled analysis for RRs, we used the DerSimonian & Laird method and Mantel−Haenszel with random-effects model regardless of heterogeneity. P-values were considered as statistically significant if ≤0.05. Heterogeneity of the pooled estimate was assessed using I-squared (I 2) and Cochrane Q test, a value of >50% or P-value <0.10 indicates a statistically significant heterogeneity. Restricted-maximum likelihood random-effects meta-regression was performed using one covariate at a time for age, gender, hypertension, diabetes mellitus, lymphocyte and d-dimer [Reference Higgins and Green5]. For the diagnostic meta-analysis, we displayed forest plot of sensitivity and specificity (a bivariate model) along with a summary receiver operating characteristic (SROC) curve [6]. Fagan's nomogram was plotted to evaluate relationship between the prior probability and posterior test probability [Reference Caraguel and Vanderstichel7]. Deek's funnel plot and asymmetry test were used to evaluate publication bias. We performed univariable meta-regression and subgroup analyses for the output of diagnostic meta-analysis using age, male, lymphocytes, d-dimer, hypertension, diabetes and CKD as covariates.
Results
There were 8963 patients from 23 eligible studies included in the systematic review and meta-analysis (Fig. 1) [Reference Asghar8–Reference Jiang30]. The baseline characteristics of the included studies can be seen in Table 1. Thrombocytopenia occurred in 18% (13–23%) of the patients. Male gender (coefficient: −0.004, P = 0.034), but not age (P = 0.290), lymphocyte (P = 0.905), d-dimer (P = 0.195), hypertension (P = 0.355), diabetes (P = 0.450) and CKD (P = 0.658) significantly influence the incidence. The incidence of composite poor outcome was 30%.
PRISMA flowchart.

Baseline characteristics of the included studies

CKD, chronic kidney disease; DM, diabetes mellitus; HT, hypertension; ICU, intensive care unit; IMV, invasive mechanical ventilation; PO, prospective observational; RO, retrospective observational; NOS, Newcastle−Ottawa scale.
Thrombocytopenia and composite outcome
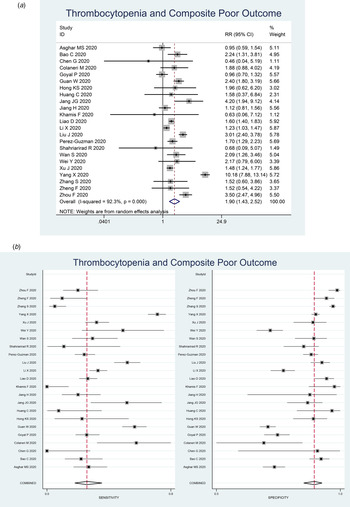
Thrombocytopenia was associated with composite poor outcome (RR 1.90 (1.43–2.52), P < 0.001; I 2: 92.3%, P < 0.001) (Fig. 2a). Subgroup analysis showed that thrombocytopenia was associated with mortality (RR 2.34 (1.23–4.45), P < 0.001; I 2: 96.8%, P < 0.001) and severity (RR 1.61 (1.33–1.96), P < 0.001; I 2: 62.4%, P < 0.001). Subgroup analysis for cut-off <100 × 109/l (9 studies) showed RR of 1.93 (1.37–2.72), P < 0.001; I 2: 83.2%, P < 0.001). Subgroup analysis for cut-off <150 × 109/l (seven studies) was borderline significant (RR 1.39 (0.99–1.95), P = 0.058; I 2: 76.2%, P < 0.001).
Forest-plot for thrombocytopenia and composite poor outcome (a) and pooled sensitivity and specificity (b).

Meta-regression analysis showed that the association did not vary significantly with age (P = 0.534), male (P = 0.117), lymphocyte (P = 0.910), d-dimer (P = 0.751), hypertension (P = 0.0647), diabetes (P = 0.812) and CKD (P = 0.509).
Diagnostic meta-analysis
Thrombocytopenia had a sensitivity of 0.26 (0.18–0.36), specificity of 0.89 (0.84–0.92), PLR of 2.3 (1.6–3.2), NLR of 0.83 (0.75–0.93), DOR of 3 (2, 4) and AUC of 0.70 (0.66–0.74). Pooled sensitivity and specificity is displayed in Figure 2b.
Fagan's nomogram showed that the posterior probability of poor outcome was 50% in patients with thrombocytopenia, and 26% in those without thrombocytopenia (Fig. 3). The Deek's funnel plot was relatively symmetrical with respect to the regression line and the asymmetry test was non-significant (P = 0.14) (Fig. 4).
Fagan's nomogram.

Deek's funnel plot and asymmetry test. The vertical axis displays the inverse of the square root of the effective sample size (1/root(ESS)).

A curve for prediction of composite poor outcome was generated (Fig. 5). The 95% prediction region was wide, however, meta-regression analysis showed that no reasons for the heterogeneity in the selected covariates, age, male, lymphocytes, d-dimer, hypertension, diabetes and CKD. Univariable meta-regression and subgroup analyses are displayed in Figure 6.
Summary receiver operating characteristic (SROC) with prediction and confidence contours.

Univariable meta-regression and subgroup analyses. Vertical lines represent pooled sensitivity and specificity, respectively.

Discussion
This study indicates that thrombocytopenia was associated with poor outcome in patients with COVID-19. Diagnostic test accuracy indicates sensitivity of 26% and specificity of 89% with AUC of 0.70. Meta-regression analysis showed that the association or diagnostic accuracy was not significantly influenced by age, male, lymphocytes, d-dimer level, hypertension, diabetes and CKD. There are varying cut-off points for thrombocytopenia, a cut-off point of <100 × 109/l showed a stronger association compared to <150 × 109/l. The varying cut-off point might also cause heterogeneity. Meta-regression analysis also showed that male gender was associated with reduced incidence of thrombocytopenia.
Comorbidities, such as diabetes mellitus, hypertension, chronic lung disease, cardiac disease and CKD [Reference Pranata31–Reference Pranata36] as well as individuals with advanced age and obesity are at higher risk for severe COVID-19 and mortality [Reference Pranata37, Reference Lim and Pranata38]. Several parameters such as C-reactive protein (CRP), procalcitonin (PCT), ferritin and D-dimer are frequently elevated in patients with poor prognosis [Reference Huang1]. Based on the aforementioned possible factors, meta-regression analyses were performed for several variables that may affect the prediction derived from thrombocytopenia, these include age, male, lymphocytes, d-dimer, hypertension, diabetes and CKD. On admission, a complete blood count is almost always ordered and often repeated at the discretion of the treating doctor, thus, did not add to the treatment costs. Since platelet count is simple, easy and inexpensive to perform, it is an ideal clinical prognostication tools. Low platelet count is a common laboratory finding in patients with severe COVID-19, in our meta-analysis, we found that thrombocytopenia was present in 18% of the patients [Reference Bao9, Reference Yang18].
Coagulopathy is one of the serious complications that can develop in patients with COVID-19, as well as acute respiratory distress syndrome (ARDS), cardiopulmonary collapse and multi-organ failure (MOF) [Reference Lim39]. Alteration in bleeding and clotting parameters can contribute to the development of coagulopathy-related events, such as pulmonary emboli (PE) and disseminated intravascular coagulation (DIC). In some patients, the prothrombin time (PT) and activated partial thromboplastin time (aPTT) is prolonged, while others may have a PT [Reference Xu, Zhou and Xu40, Reference Iba41]. Haematological changes, including lymphopenia and thrombocytopenia but normal white blood cell count, are also commonly observed in individuals contracted to severe acute respiratory syndrome coronavirus 2 (SARS-CoV-2) [Reference Huang and Pranata2]. However, it is still unclear how the novel coronavirus influence the haematopoietic system.
The pathophysiology of thrombocytopenia in COVID-19 is hypothetically caused by the alteration of platelets' production and consumption (and/or destruction) [Reference Zhang42]. It affects platelets' production by either directly or indirectly affecting the haematopoietic stem cells (HSCs), reduction of thrombopoietin production, and megakaryocyte maturation due to increase of specific inflammatory cytokines [Reference Prompetchara, Ketloy and Palaga43], and decrease of supplementary haematopoietic progenitor in the pulmonary vessels due to COVID-19-induced lung damage [Reference Lefrançais44]. Moreover, extensive lung damage and disseminated intravascular coagulation due to hyperinflammation cause further thrombocytopenia in COVID-19 due to the increase of platelet consumption [Reference Zhang42].
Coronaviruses may directly infect haematopoietic and bone marrow cells and cause aberrant haematopoiesis. Human aminopeptidase N (CD13) is a metalloprotease found on lung epithelial cells' surface, smooth muscle cells, fibroblasts and epithelial cells in the kidneys and small intestine, may serve as a receptor for the entry of novel coronavirus. It is speculated that the virus may invade bone marrow cells and platelets through CD13 receptors and cause growth inhibition and apoptosis, resulting in haematopoiesis dysfunction, reduced primary platelet production and eventual thrombocytopenia [Reference Yang18, Reference Xu, Zhou and Xu40, Reference Amgalan and Othman45].
Cytokine storm, a condition in which human body releases large amounts of inflammatory cytokines and cause hyperinflammation, is thought to play a central role in the pathophysiology of COVID-19 [Reference Huang1, Reference Lim39]. Excessive activation and proliferation of mononuclear macrophage system leads to secondary haemophagocytic lymphohistiocytosis (sHLH), in which cytokines are released excessively and an enormous number of blood cells are engulfed, contributing to reduced peripheral blood platelets. This proinflammatory state also causes immune damage to various organs, including the lungs, and is thought to affect the haematopoietic progenitor cells in the bone marrow, leading to reduced platelet synthesis [Reference Xu, Zhou and Xu40, Reference Iba41].
The lung is a reservoir for haematopoietic progenitors and a site of platelet biogenesis. Lung injury in COVID-19 pneumonia may be exacerbated by persistent hypertension and oxygen toxicity, leading to consolidation changes and pulmonary fibrosis. It is found that a considerable number of megakaryocytes releases platelet dynamically into pulmonary circulation [Reference Lefrançais44]. Injured capillary beds and diffuse alveolar damage in the lungs cause trapping of megakaryocyte and inhibit platelets' release from megakaryocytes, which causes reduced platelet formation in the systemic circulation [Reference Yang18, Reference Amgalan and Othman45]. Also, injured pulmonary endothelial cells and lung tissues will activate the coagulation system, resulting in platelet aggregation and micro-thrombosis in the lungs, which increases platelet consumption [Reference Xu, Zhou and Xu40].
Elevated levels of autoantibodies and immune complexes in patients with SARS-CoV-2 infection may result in platelet destruction and clearance by the immune system. The exact pathogenesis of immune-mediated thrombocytopenia in COVID-19 is still unclear, however, reticuloendothelial cells may recognise platelets as target tissue given the presence of antibodies and immune complexes deposited on the platelet surface. Furthermore, antibodies generated when the virus invades human cells may specifically bind to platelet antigens via molecular mimicry, causing substantial damage to the circulating platelets [Reference Xu, Zhou and Xu40, Reference Amgalan and Othman45, Reference Ahmed46]. The reason why thrombocytopenia is independently associated with poor outcome is biologically plausible because it might reflect a greater viral load of SARS-CoV-2, higher inflammatory response and extensive lung damage, as we previously described the hypothetical mechanism behind this phenomenon.
Sociodemographic may influence the findings in this meta-analysis, for example, certain infections such as dengue virus may cause thrombocytopenia [Reference Martina, Koraka and Osterhaus47]. Thrombocytopenia caused by dengue virus may differ from those caused by sepsis and disseminated intravascular coagulation, or COVID-19 [Reference Xu, Zhou and Xu40, Reference Venugopal48, Reference Bedet49]. Concurrent infections with such diseases were not reported among the studies. The prevalence of these infections may be higher in tropical regions [Reference Murray, Quam and Wilder-Smith50, Reference Bhatt51]. Clinical applications should not be generalised without considering these factors.
Clinical implications
This meta-analysis indicate that thrombocytopenia was associated with increased composite poor outcome with RR of 1.90. It has a low sensitivity but high specificity, thus is best used to rule in rather to rule out the possibility of composite poor outcome. The sensitivity and specificity are highly heterogeneous as demonstrated by Figure 2. In a 30% pre-test probability for composite poor outcome, thrombocytopenia may increase the probability to 50%. Meanwhile, Deek's funnel plot asymmetry test indicate low risk of publication bias. SROC curve showed a AUC of 0.70, indicating an acceptable diagnostic performance. Meta-regression analysis indicate that several assigned comorbidities did not affect the sensitivity and specificity for thrombocytopenia to predict poor outcome. Thus, thrombocytopenia might be used to rule in composite poor outcome, but not to rule it out. Finding from subgroup analysis based on cut-off points may indicate that a lower cut-off point was associated with a higher risk. To enhance the sensitivity and specificity, it is better to construct a prediction model using several variables.
Limitations
Most of the studies did not report the number of possible co-infections that can potentially cause thrombocytopenia or the number of bacterial infections. The definition for thrombocytopenia still varies among the included studies. Drug therapy, such as anticoagulants use were rarely reported by the studies.
Conclusion
This study indicates that thrombocytopenia was associated with poor prognosis in patients with COVID-19. Diagnostic test accuracy indicates sensitivity of 26% and specificity of 89% with AUC of 0.70.
Acknowledgement
None
Authors contribution
Raymond Pranata: This author helped in concept development, manuscript drafting, data acquisition, data analysis and statistical analysis. Michael Anthonius Lim: This author helped in data acquisition, data analysis and manuscript drafting. Emir Yonas: Investigation, extensive review and editing of the manuscript. Ian Huang: Data acquistition, investigation, extensive review and editing of the manuscript. Sally Aman Nasution: Investigation, extensive review and editing. Siti Setiati: Investigation, extensive review and editing. Idrus Alwi: Investigation, extensive eeview and editing. Tuty Kuswardhani: Investigation, extensive eeview and editing.
Financial support
None.
Conflict of interest
None.
Data availability
All data generated or analysed during this study are included in this published article


 Open access