1 Introduction
Coal is associated with extensive pollution in its mining and combustion processes, and its carbon intensity is the highest among the major fossil fuels. It therefore plays an important role in producing damages related to health, the environment and the climate. Thus, to adopt coal quantity controls can be a well-motivated strategy. As the world’s largest coal consumer this is especially true for China. China is the country that contributes the most to global emissions of carbon dioxide (CO $_{2}$
) and other greenhouse gases (GHGs) such as black carbon (Chen et al., Reference Chen, Zhi, Feng, Liu, Zhang, Li, Sheng and Fu2009), and the largest part of these emissions attributes to coal consumption (Boden, Marland & Andres, Reference Boden, Marland and Andres2016). From a national Chinese perspective the nationwide severe ambient air pollution, which is largely attributable to emissions from various coal using sectors (NRDC, 2014), and indoor air pollution in rural households as a result of using coal for cooking and heating (THUBERC, 2012), causes substantial health damages (Yang et al., Reference Yang, Wang, Zeng, Gao, Liang, Zhou, Wan, Yu, Jiang and Naghavi2013). To address these negative effects from coal use the China State Council (2013) set a cap on its annual coal consumption of 3000 Million Tons of Coal Equivalent to be reached by 2020. Although this Cap on Coal Consumption (CCC) policy scheme was motivated mainly by the need to address ambient air pollution (see Section 2 for more details), it also helps to address the other negative effects from coal use, which would be of benefit to both Chinese citizens and the rest of world.
$_{2}$
) and other greenhouse gases (GHGs) such as black carbon (Chen et al., Reference Chen, Zhi, Feng, Liu, Zhang, Li, Sheng and Fu2009), and the largest part of these emissions attributes to coal consumption (Boden, Marland & Andres, Reference Boden, Marland and Andres2016). From a national Chinese perspective the nationwide severe ambient air pollution, which is largely attributable to emissions from various coal using sectors (NRDC, 2014), and indoor air pollution in rural households as a result of using coal for cooking and heating (THUBERC, 2012), causes substantial health damages (Yang et al., Reference Yang, Wang, Zeng, Gao, Liang, Zhou, Wan, Yu, Jiang and Naghavi2013). To address these negative effects from coal use the China State Council (2013) set a cap on its annual coal consumption of 3000 Million Tons of Coal Equivalent to be reached by 2020. Although this Cap on Coal Consumption (CCC) policy scheme was motivated mainly by the need to address ambient air pollution (see Section 2 for more details), it also helps to address the other negative effects from coal use, which would be of benefit to both Chinese citizens and the rest of world.
However, going from a national level CCC strategy to implementing it as local level coal interventions, many issues emerge. Among the many we highlight three. First, coal-to-gas projects were first advocated by central governments and those for power plants were fully implemented in Beijing and then sprang up in other places. Soon, however, the shortage of gas supply was exacerbated and most of the projects, except the ones in Beijing, were suspended and canceled. Second, there have been big controversies over whether to substitute coal for other fuels or to still use coal but to make the combustion process cleaner (Wang, Reference Wang2015). Disputes also surround the allocation of scarce natural gas resource across sectors and sites (Ni, Reference Ni2013). Third, there is rich literature on assessing health damage from household coal use in China (Zhang & Smith, Reference Zhang and Smith2007), and the results collectively report it to produce almost the same magnitude of health damages compared with those from ambient air pollution (Yang et al., Reference Yang, Wang, Zeng, Gao, Liang, Zhou, Wan, Yu, Jiang and Naghavi2013). These findings have not been translated into stringent policies, however. Also, the CCC gives the lowest priority to interventions targeted at phasing out household coal use (discussed later).
We believe one common reason for these issues is that knowledge of the economic efficiency of different coal interventions is limited. Faced with mandatory coal quantity reduction targets, local governments naturally tend to adopt interventions in power plants and big boilers over those where benefits are widespread but affect millions of households. With this approach, the reduced coal amount with its quantity target is more easily measurable and perceived achievable. However, economic analysis of interventions is further needed if the CCC is to reduce health and environmental damages through implementing socially beneficial interventions. It is for this reason that in many countries, benefit-cost analysis (BCA) is often used, sometimes even mandatory in policy making process (Wiener, Reference Wiener2006; Graham, Reference Graham2008). However, to the best knowledge of the authors, BCA has not to date been used to formally guide policies in China.
This paper aims to provide an analytical framework to account for the social benefits and costs of coal reduction interventions. We describe this framework by conducting BCA of two interventions with different implementation priorities in current policies. One is coal-to-gas for power plants, the other is to phase out household coal use. We look from a social welfare perspective at project level, which corresponds to how the policies are implemented in cities and districts. We extend our BCA by following Jeuland and Pattanayak (Reference Jeuland and Pattanayak2012), Whittington, Jeuland, Barker and Yuen (Reference Whittington, Jeuland, Barker and Yuen2012) and use Monte Carlo simulations to characterize the uncertainty of the analysis. The CCC can be seen as part of the global initiative to reduce coal use to avoid global warming and is China’s core national strategy to address air pollution in China, and it is to be resolutely implemented (China State Council, 2014). The efficiency of this large-scale energy policy is of high policy relevance and our analysis provides implications for prioritizing coal reduction interventions in targeted sectors, and better ways to deploy alternatives such as natural gas and renewable energy.
2 The CCC: policy background, implementation and implicit priority till 2017
Responding to the PM $_{2.5}$
(fine particulate matter with diameter less than
$_{2.5}$
(fine particulate matter with diameter less than $2.5~\unicode[STIX]{x03BC}\text{m}$
) crisis in the winter between 2012 and 2013, the China State Council issued the National Action Plan on Air Pollution Prevention and Control (2013–2017) in September 2013 (China State Council, 2013). This National Action Plan first sets specific goals of air quality improvements and then lists ten actions which address all the key aspects of ambient air quality management (see Table A1 in the Appendix). The fourth action is to “Adjust the Energy Structure and Increase the Clean Energy Supply”.Footnote
2
This action, for the first time in China, clearly states that “mid and long-term national coal consumption control targets shall be established, and a target responsibility system shall be adopted for implementation and evaluation”. Meanwhile, three key regions, the Beijing–Tianjin and Hebei (BTH), Yangtze River Delta (YRD) and Pearl River Delta (PRD), are targeted specifically and are required to display negative growth of coal consumption.Footnote
3
Targets of the ten actions are then decomposed annually and geographically, with responsibility agreements signed between each level of government (provincial, municipal and district). As part of this policy process, each government level’s annual plan on reducing coal consumption are made, with three groups of government personnel involved: (1) leaders in party and government (e.g., the core leaders in the Beijing Municipal Government), (2) environmental and other relevant departmental officials (e.g., those in Beijing Municipal Environment Protection Bureau and some other bureaus), and (3) leaders in party and government in lower levels (e.g., the core leaders in the Chaoyang district in Beijing).
$2.5~\unicode[STIX]{x03BC}\text{m}$
) crisis in the winter between 2012 and 2013, the China State Council issued the National Action Plan on Air Pollution Prevention and Control (2013–2017) in September 2013 (China State Council, 2013). This National Action Plan first sets specific goals of air quality improvements and then lists ten actions which address all the key aspects of ambient air quality management (see Table A1 in the Appendix). The fourth action is to “Adjust the Energy Structure and Increase the Clean Energy Supply”.Footnote
2
This action, for the first time in China, clearly states that “mid and long-term national coal consumption control targets shall be established, and a target responsibility system shall be adopted for implementation and evaluation”. Meanwhile, three key regions, the Beijing–Tianjin and Hebei (BTH), Yangtze River Delta (YRD) and Pearl River Delta (PRD), are targeted specifically and are required to display negative growth of coal consumption.Footnote
3
Targets of the ten actions are then decomposed annually and geographically, with responsibility agreements signed between each level of government (provincial, municipal and district). As part of this policy process, each government level’s annual plan on reducing coal consumption are made, with three groups of government personnel involved: (1) leaders in party and government (e.g., the core leaders in the Beijing Municipal Government), (2) environmental and other relevant departmental officials (e.g., those in Beijing Municipal Environment Protection Bureau and some other bureaus), and (3) leaders in party and government in lower levels (e.g., the core leaders in the Chaoyang district in Beijing).
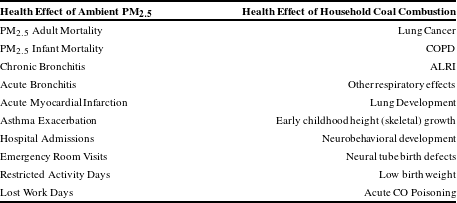
In upper level government plans on reducing coal consumption, tasks are the amount of coal to be reduced in total level, sectoral level and jurisdictional regional level. Then the plan provides some rough description on how these amounts can be possibly achieved by lower level governments. In lower level government plans, tasks are much more specific, with programs or projects with implementation details and projected quantifiable coal reduction amounts specified. No matter which level of the plans, similarities are: (1) amount of coal reduction is the key policy indicator, (2) responsible person for each task is made explicit, a sign indicating a strong bound of target responsibility, and (3) an implicit priority can be derived – coal reduction tasks start from those focusing on power plants (if they exist in the area), with both largest amount and highest ratio of coal reduction, and specific implementation instructions. Then tasks turn to those focusing on industry and utility boilers, with second largest amount and second ratio of coal reduction, and also implementation details. Last come those focusing on rural and suburban households, with both least amount and lowest ratio of coal reduction, with some unquantifiable principles, and some details on substituting some raw coal by “improved coal”.Footnote 4 This CCC policy is a typical case of current environmental governance scheme in China (Jin, Andersson & Zhang, Reference Jin, Andersson and Zhang2016). Figure 1 illustrates the main coal users, impacts, and the CCC Policy. Table A2 in the Appendix summarizes the detailed tasks in Chaoyang District (location in the map in Figure A1 in the Appendix) in year 2014 as an example on how the coal reduction targets are implemented at the very local level.
Coal main users, impacts, and the Cap on Coal Consumption Policy system in China. (a, b) Based on Yang et al. (Reference Yang, Wang, Zeng, Gao, Liang, Zhou, Wan, Yu, Jiang and Naghavi2013), WHO (2014), (c) based on Chen et al. (Reference Chen, Zhi, Feng, Liu, Zhang, Li, Sheng and Fu2009), Marland, Boden and Andres (Reference Marland, Boden and Andres2015), (d) based on Beijing Municipal Government (2013), (e) in the map of provincial coal control targets: yellow square: Beijing City; blue circles: Beijing–Tianjin–Hebei (BTH), Yangtze River Delta (YRD) and Pearl River Delta (PRD), (f) reduction ratio calculated as coal reduction target divided by the current coal consumption (in 2013).

3 Analytical framework for the estimation of benefits and costs
3.1 Intervention specification and benefit-cost typology
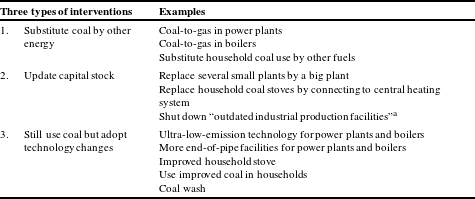
The main interventions related to coal in different sectors currently being discussed in China can be broadly grouped into three types: (1) to substitute coal, (2) to update capital stock and (3) to still use coal but to make the coal combustion processes cleaner. Table A3 in the Appendix provides examples for each type. In this paper, we look at the costs and benefits of two coal substitution alternatives in power plants and in households. The current CCC uses the amount of reduced coal as the enforcement indicator. Local authorities have some freedom to choose the alternatives to implement as long as they meet the upper assigned coal reduction target. This feature provides us the rationale to compare the social net benefits by the same amount of coal reduction in different sectors. We, therefore, set the unit of calculations for the power sector to be a representative power plant installed capacity in Beijing with an assumed 600,000-ton annual coal consumption (Jian, Reference Jian2013). The corresponding unit of calculation for households is 200,000 coal using households (3-ton annual consumption per household (China National Bureau of Statistics, 2012a , b ; THUBERC, 2012)).
We consider three household heating intervention scenarios:
-
(1) house reconstruction for thermal insulation, solar air heat collector system and a biomass pellet fuel heated bed (which is still at a pilot stage, but is proposed as a potential integrated solution) (THUBERC, 2012);
-
(2) electric-heating stove, such as that currently being promoted in Beijing (Beijing Municipal Government, 2013);
-
(3) electric-heating stove and house reconstruction for thermal insulation, as the latter is considered able to cut the energy needed for space heating (THUBERC, 2012).
We further account for that households may slip back to using coal (or never stop using coal), by defining two distinct households: (1) a full-use household exclusively uses the new fuel after the intervention, and (2) a nonuse household goes back to using coal even after the intervention. In the subsequent parts of this paper the two types of households are analyzed independently. We also treat those who to some extent use the new alternative fuel but not exclusively, i.e. they also use coal, as nonuse households to keep a conservative estimation of the benefits of the policy. The costs and benefits associated with the two sectors’ interventions are summarized in Table 1 with explanations for our estimations. Some key elements of the table, e.g. health effects, will be discussed in more details later. For those effects not quantified, we discuss their influence in footnotes in the main text.
Benefits and costs of phasing out coal in power plants or in households. a

a Items in shaded areas are not quantified.
3.2 Intervention costs
Intervention costs include one-time capital costs, changes in operation and maintenance (O&M) cost and incremental fuel costs from switching from coal to other fuels. Capital costs for power plants are investments in the new gas fired plant units, and the gas pipeline system.Footnote 5 For households the capital costs are new heating stoves, and reconstruction related costs.Footnote 6 The costs are annualized using social discount rates and based on assumptions on the expected life of the projects. For fuel cost, the fuel prices need special attention because in China the price of gas used in power generation is regulated and subsidized, whereas the price of coal fluctuates in accordance with the market, but it does not internalize coal’s environmental externalities. Information of how we account for the shadow price of gas and coal in base case model is provided in Table A5. For households, all the costs are relevant for a “full-use” household, whereas for a “nonuse” household only the capital cost is relevant in heating scenario 2. For heating scenarios 1 and 3 the saved fuel cost is also relevant due to the better thermal insulation capacity of the houses after the reconstruction. We do not quantify costs such as “learning” (costs of familiarization with a new technology) and “program” (cost of promoting intervention projects).Footnote 7
3.3 Health benefits
3.3.1 Health effects associated with coal-to-gas for power plant
This part of the estimation is to first link Chinese population exposure with emissions from certain sources (i.e., in this study a power plant unit in Beijing) and then link this with concentration-response (C-R) coefficients from epidemiological evidence. As summarized by Levy, Baxter and Schwartz (Reference Levy, Baxter and Schwartz2009), the effects for health endpoint $k$
from pollutant
$k$
from pollutant $j$
from a certain source,
$j$
from a certain source, $E_{jk}$
, can be calculated by:
$E_{jk}$
, can be calculated by:
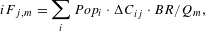
 $$\begin{eqnarray}E_{jk}=\mathop{\sum }_{i}Pop_{i}\cdot \unicode[STIX]{x1D6E5}C_{ij}\cdot \unicode[STIX]{x1D6FD}_{jk}\cdot I_{k},\end{eqnarray}$$
where $Pop_{i}$
is the population size within cell
$Pop_{i}$
is the population size within cell $i$
, and
$i$
, and $\unicode[STIX]{x1D6E5}C_{ij}$
is the contribution of the power plant emission to pollutant
$\unicode[STIX]{x1D6E5}C_{ij}$
is the contribution of the power plant emission to pollutant $j$
’s concentration in cell
$j$
’s concentration in cell $i$
(
$i$
( $\unicode[STIX]{x03BC}\text{g}/\text{m}^{3}$
). The concentration-response (C-R) coefficient with respect to pollution
$\unicode[STIX]{x03BC}\text{g}/\text{m}^{3}$
). The concentration-response (C-R) coefficient with respect to pollution $j$
and health endpoint
$j$
and health endpoint $k$
is given by
$k$
is given by $\unicode[STIX]{x1D6FD}_{jk}$
, and
$\unicode[STIX]{x1D6FD}_{jk}$
, and $I_{k}$
is the number of new cases of health endpoint
$I_{k}$
is the number of new cases of health endpoint $k$
in the population at risk in a given time period.
$k$
in the population at risk in a given time period.
To estimate $\sum _{i}Pop_{i}\cdot \unicode[STIX]{x1D6E5}C_{ij}$
, models such as CALPUFFFootnote
8
focusing on individual power plants (Zhou, Levy, Hammitt & Evans, Reference Zhou, Levy, Hammitt and Evans2003; Zhou, Levy, Evans & Hammitt, Reference Zhou, Levy, Evans and Hammitt2006), or Community Multi-scale Air Quality Model (CMAQ) focusing on a sector level (Zhou, Fu, Zhuang & Levy, Reference Zhou, Fu, Zhuang and Levy2010; Xu, Wang & Zhang, Reference Xu, Wang and Zhang2013) can be applied. In this study, we estimate on a single power plant unit. Instead of performing new CALPUFF modeling, we follow Cropper et al. (Reference Cropper, Gamkhar, Malik, Limonov and Partridge2012) to use an intake fraction (iF) approach. The fraction of emitted pollutant
$\sum _{i}Pop_{i}\cdot \unicode[STIX]{x1D6E5}C_{ij}$
, models such as CALPUFFFootnote
8
focusing on individual power plants (Zhou, Levy, Hammitt & Evans, Reference Zhou, Levy, Hammitt and Evans2003; Zhou, Levy, Evans & Hammitt, Reference Zhou, Levy, Evans and Hammitt2006), or Community Multi-scale Air Quality Model (CMAQ) focusing on a sector level (Zhou, Fu, Zhuang & Levy, Reference Zhou, Fu, Zhuang and Levy2010; Xu, Wang & Zhang, Reference Xu, Wang and Zhang2013) can be applied. In this study, we estimate on a single power plant unit. Instead of performing new CALPUFF modeling, we follow Cropper et al. (Reference Cropper, Gamkhar, Malik, Limonov and Partridge2012) to use an intake fraction (iF) approach. The fraction of emitted pollutant $m$
(either identical to pollutant
$m$
(either identical to pollutant $j$
or
$j$
or $j$
’s precursor) from a certain source that is eventually inhaled by the population,
$j$
’s precursor) from a certain source that is eventually inhaled by the population, $iF_{j,m}$
, is defined as (Bennett et al., Reference Bennett, McKone, Evans, Nazaroff, Margni, Jolliet and Smith2002; Levy et al., Reference Levy, Baxter and Schwartz2009),
$iF_{j,m}$
, is defined as (Bennett et al., Reference Bennett, McKone, Evans, Nazaroff, Margni, Jolliet and Smith2002; Levy et al., Reference Levy, Baxter and Schwartz2009),
 $$\begin{eqnarray}iF_{j,m}=\mathop{\sum }_{i}Pop_{i}\cdot \unicode[STIX]{x1D6E5}C_{ij}\cdot BR/Q_{m},\end{eqnarray}$$
where $Q_{m}$
(
$Q_{m}$
( $\unicode[STIX]{x03BC}$
g
$\unicode[STIX]{x03BC}$
g $/$
day) is the emissions of pollutant m from the source, and BR is the breathing rate (20 m
$/$
day) is the emissions of pollutant m from the source, and BR is the breathing rate (20 m $^{3}/$
day-person). In CALPUFF or CMAQ modeling studies,
$^{3}/$
day-person). In CALPUFF or CMAQ modeling studies, $iF_{j,m}$
is one of the key modeling results that can be used for the estimation of health impacts. Our study is such an application that the
$iF_{j,m}$
is one of the key modeling results that can be used for the estimation of health impacts. Our study is such an application that the $\sum _{i}Pop_{i}\cdot \unicode[STIX]{x1D6E5}C_{ij}$
can be calculated with BR,
$\sum _{i}Pop_{i}\cdot \unicode[STIX]{x1D6E5}C_{ij}$
can be calculated with BR, $iF_{j,m}$
and emission
$iF_{j,m}$
and emission $Q_{m}$
. Therefore Equation (1) becomes,
$Q_{m}$
. Therefore Equation (1) becomes,
 $$\begin{eqnarray}E_{jk}={iF_{j,m}\cdot Q}_{m}\cdot {\unicode[STIX]{x1D6FD}_{jk}\cdot I}_{k}/BR.\end{eqnarray}$$
We next clarify the choice of parameter values. We use $iF_{\text{p},\text{primary}\,\text{PM}_{2.5}}$
,
$iF_{\text{p},\text{primary}\,\text{PM}_{2.5}}$
, $iF_{\text{as},\text{SO}_{2}}$
, and
$iF_{\text{as},\text{SO}_{2}}$
, and $iF_{\text{an},\text{NO}_{\text{x}}}$
(the impact of primary PM
$iF_{\text{an},\text{NO}_{\text{x}}}$
(the impact of primary PM $_{2.5}$
, SO
$_{2.5}$
, SO $_{2}$
and NO
$_{2}$
and NO $_{\text{x}}$
emissions on ambient concentration of PM
$_{\text{x}}$
emissions on ambient concentration of PM $_{2.5}$
, secondary ammonium sulfate and secondary ammonium nitrate,Footnote
9
respectively) estimated in Zhou et al. (Reference Zhou, Levy, Hammitt and Evans2003). The authors estimated the impact of an 800MW coal fired power plant in Beijing on ambient air quality with CALPUFF modeling domain covering most of China. Compared to other
$_{2.5}$
, secondary ammonium sulfate and secondary ammonium nitrate,Footnote
9
respectively) estimated in Zhou et al. (Reference Zhou, Levy, Hammitt and Evans2003). The authors estimated the impact of an 800MW coal fired power plant in Beijing on ambient air quality with CALPUFF modeling domain covering most of China. Compared to other $iF_{j,m}$
estimates in China (Wang et al., Reference Wang, Hao, Ho, Li and Lu2006; Hao et al., Reference Hao, Wang, Shen, Li and Hu2007; Zhou et al., Reference Zhou, Fu, Zhuang and Levy2010, Reference Zhou, Hammitt, Fu, Gao, Liu and Levy2014), these
$iF_{j,m}$
estimates in China (Wang et al., Reference Wang, Hao, Ho, Li and Lu2006; Hao et al., Reference Hao, Wang, Shen, Li and Hu2007; Zhou et al., Reference Zhou, Fu, Zhuang and Levy2010, Reference Zhou, Hammitt, Fu, Gao, Liu and Levy2014), these $iF_{j,m}$
match best our objective, since they represent the aggregated national air quality impacts of one power plant located exactly in Beijing.Footnote
10
For
$iF_{j,m}$
match best our objective, since they represent the aggregated national air quality impacts of one power plant located exactly in Beijing.Footnote
10
For $Q_{m}$
, we apply the average emission of SO
$Q_{m}$
, we apply the average emission of SO $_{2}$
, NO
$_{2}$
, NO $_{\text{x}}$
and PM
$_{\text{x}}$
and PM $_{2.5}$
per Beijing power plant unit (Luo, Reference Luo2012). Once a unit becomes a gas fired one, PM
$_{2.5}$
per Beijing power plant unit (Luo, Reference Luo2012). Once a unit becomes a gas fired one, PM $_{2.5}$
and SO
$_{2.5}$
and SO $_{2}$
emissions will decrease to near zero. However, for NO
$_{2}$
emissions will decrease to near zero. However, for NO $_{\text{x}}$
, assuming equal heat supply, the gas fired plant will need higher generation efficiency, leading to even slightly higher NO
$_{\text{x}}$
, assuming equal heat supply, the gas fired plant will need higher generation efficiency, leading to even slightly higher NO $_{\text{x}}$
emission levels (Ni, Reference Ni2013). In our analysis, we conservatively assume zero emissions of PM
$_{\text{x}}$
emission levels (Ni, Reference Ni2013). In our analysis, we conservatively assume zero emissions of PM $_{2.5}$
and SO
$_{2.5}$
and SO $_{2}$
with intervention, whereas no significant changes in NO
$_{2}$
with intervention, whereas no significant changes in NO $_{\text{x}}$
emissions. For the health endpoint (
$_{\text{x}}$
emissions. For the health endpoint ( $k$
), we focus on estimating changes in mortality and in morbidity of chronic bronchitis, because the former usually accounts for more than 90% of health benefits, and the latter is usually the second largest (US EPA, 2011).
$k$
), we focus on estimating changes in mortality and in morbidity of chronic bronchitis, because the former usually accounts for more than 90% of health benefits, and the latter is usually the second largest (US EPA, 2011).
We now turn to the choice of $\unicode[STIX]{x1D6FD}_{jk}$
. Coal-to-gas for a power plant unit corresponds to a long-term marginal change in PM
$\unicode[STIX]{x1D6FD}_{jk}$
. Coal-to-gas for a power plant unit corresponds to a long-term marginal change in PM $_{\text{2.5}}$
concentration. We should, therefore, use C-R functions between long-term ambient air pollution and health endpoints. Evidences show that the C-R function may be concave across wide ranges of exposure (Burnett et al., Reference Burnett, Pope, Ezzati, Olives, Lim, Mehta, Shin, Singh, Hubbell, Brauer, Anderson, Smith, Balmes, Bruce, Kan, Laden, Pruss-Ustun, Turner, Gapstur, Diver and Cohen2014; Pope, Cropper, Coggins & Cohen, Reference Pope, Cropper, Coggins and Cohen2015), implying that a marginal pollution abatement effort may yield less benefits in China compared with developed countries, since the PM
$_{\text{2.5}}$
concentration. We should, therefore, use C-R functions between long-term ambient air pollution and health endpoints. Evidences show that the C-R function may be concave across wide ranges of exposure (Burnett et al., Reference Burnett, Pope, Ezzati, Olives, Lim, Mehta, Shin, Singh, Hubbell, Brauer, Anderson, Smith, Balmes, Bruce, Kan, Laden, Pruss-Ustun, Turner, Gapstur, Diver and Cohen2014; Pope, Cropper, Coggins & Cohen, Reference Pope, Cropper, Coggins and Cohen2015), implying that a marginal pollution abatement effort may yield less benefits in China compared with developed countries, since the PM $_{2.5}$
concentration is higher in China than in developed countries. Therefore, one should ideally use Chinese cohort mortality evidence, and to the best of our knowledge, at the time this paper was being written, there are two studies providing Chinese long-term exposure mortality evidence (Cao et al., Reference Cao, Yang, Li, Chen, Chen, Gu and Kan2011; Chen, Ebenstein, Greenstone & Li, Reference Chen, Ebenstein, Greenstone and Li2013). The C-R coefficients in these two studies are indeed smaller than those in developed countries, in line with the concave assumption of C-R function. However, the models in Chen et al. (Reference Chen, Ebenstein, Greenstone and Li2013) have been found to be overfitting, resulting in implausible causal inference (Gelman & Zelizer, Reference Gelman and Zelizer2015). Cao et al. (Reference Cao, Yang, Li, Chen, Chen, Gu and Kan2011) is based on total suspended particle (TSP), rather than PM
$_{2.5}$
concentration is higher in China than in developed countries. Therefore, one should ideally use Chinese cohort mortality evidence, and to the best of our knowledge, at the time this paper was being written, there are two studies providing Chinese long-term exposure mortality evidence (Cao et al., Reference Cao, Yang, Li, Chen, Chen, Gu and Kan2011; Chen, Ebenstein, Greenstone & Li, Reference Chen, Ebenstein, Greenstone and Li2013). The C-R coefficients in these two studies are indeed smaller than those in developed countries, in line with the concave assumption of C-R function. However, the models in Chen et al. (Reference Chen, Ebenstein, Greenstone and Li2013) have been found to be overfitting, resulting in implausible causal inference (Gelman & Zelizer, Reference Gelman and Zelizer2015). Cao et al. (Reference Cao, Yang, Li, Chen, Chen, Gu and Kan2011) is based on total suspended particle (TSP), rather than PM $_{2.5}$
. Thus, applicability of these two studies is limited. Recently, an integrated exposure-response (IER) model was developed by integrating available relative risk (RR) evidences for the whole PM
$_{2.5}$
. Thus, applicability of these two studies is limited. Recently, an integrated exposure-response (IER) model was developed by integrating available relative risk (RR) evidences for the whole PM $_{2.5}$
exposure range from ambient air pollution to active smoking (Burnett et al., Reference Burnett, Pope, Ezzati, Olives, Lim, Mehta, Shin, Singh, Hubbell, Brauer, Anderson, Smith, Balmes, Bruce, Kan, Laden, Pruss-Ustun, Turner, Gapstur, Diver and Cohen2014), that can be applied within the range of Chinese ambient PM
$_{2.5}$
exposure range from ambient air pollution to active smoking (Burnett et al., Reference Burnett, Pope, Ezzati, Olives, Lim, Mehta, Shin, Singh, Hubbell, Brauer, Anderson, Smith, Balmes, Bruce, Kan, Laden, Pruss-Ustun, Turner, Gapstur, Diver and Cohen2014), that can be applied within the range of Chinese ambient PM $_{2.5}$
concentration. However, the RRs in this IER model cannot be directly converted to C-R coefficients, and we therefore, in this paper opt to follow Zhou et al. (Reference Zhou, Fu, Zhuang and Levy2010, Reference Zhou, Hammitt, Fu, Gao, Liu and Levy2014) who have accounted for the effect of lower C-R coefficients in China in an analytical context similar to ours: we use a 1% increase in all-cause mortality per 1-
$_{2.5}$
concentration. However, the RRs in this IER model cannot be directly converted to C-R coefficients, and we therefore, in this paper opt to follow Zhou et al. (Reference Zhou, Fu, Zhuang and Levy2010, Reference Zhou, Hammitt, Fu, Gao, Liu and Levy2014) who have accounted for the effect of lower C-R coefficients in China in an analytical context similar to ours: we use a 1% increase in all-cause mortality per 1- $\unicode[STIX]{x03BC}$
g
$\unicode[STIX]{x03BC}$
g $/$
m
$/$
m $^{3}$
increase in annual PM
$^{3}$
increase in annual PM $_{2.5}$
concentrations as central estimate, a lower bound of 0.1% and an upper bound of 2.0% in a triangular distribution. It is worth noting that PM
$_{2.5}$
concentrations as central estimate, a lower bound of 0.1% and an upper bound of 2.0% in a triangular distribution. It is worth noting that PM $_{2.5}$
health effects overall are very large because there are many sources of PM
$_{2.5}$
health effects overall are very large because there are many sources of PM $_{2.5}$
in big cities like Beijing. Due to the concavity in the C-R function, marginal interventions to reduce PM
$_{2.5}$
in big cities like Beijing. Due to the concavity in the C-R function, marginal interventions to reduce PM $_{2.5}$
will have lower benefits now relative to a future where PM
$_{2.5}$
will have lower benefits now relative to a future where PM $_{2.5}$
emissions from other sources are lowered. And coordinated PM
$_{2.5}$
emissions from other sources are lowered. And coordinated PM $_{2.5}$
reducing strategies will have greater overall effect than each intervention evaluated individually.
$_{2.5}$
reducing strategies will have greater overall effect than each intervention evaluated individually.
3.3.2 Health effects associated with phasing out household coal use interventions
Most of the research on health effects from household fuel use is based on a “binary exposure classification” which separates the study population into those exposed to certain fuel usage and those not exposed (Desai, Mehta & Smith, Reference Desai, Mehta and Smith2004; Smith et al., Reference Smith, Bruce, Balakrishnan, Adair-Rohani, Balmes, Chafe, Dherani, Hosgood, Mehta, Pope and Rehfuess2014; WHO, 2014). The fraction of disease $k$
in the population by age (
$k$
in the population by age ( $s$
) and gender (
$s$
) and gender ( $t$
) group attributable to exposure (
$t$
) group attributable to exposure ( $AF_{kst}$
) can be calculated by
$AF_{kst}$
) can be calculated by
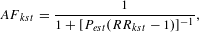 $$\begin{eqnarray}AF_{kst}=\frac{1}{1+[P_{est}(RR_{kst}-1)]^{-1}},\end{eqnarray}$$
where $P_{est}$
is the percentage of the population exposed and
$P_{est}$
is the percentage of the population exposed and $RR_{kst}$
is the relative risk for disease
$RR_{kst}$
is the relative risk for disease $k$
. We quantify the three major health outcomes following WHO (2014): acute lower respiratory infection (ALRI) for children under 5 years old, chronic obstructive pulmonary disease (COPD) and lung cancer for adults over 30 years old. Then the health effects from disease
$k$
. We quantify the three major health outcomes following WHO (2014): acute lower respiratory infection (ALRI) for children under 5 years old, chronic obstructive pulmonary disease (COPD) and lung cancer for adults over 30 years old. Then the health effects from disease $k$
attributable to exposure in the population by age (
$k$
attributable to exposure in the population by age ( $s$
) and gender (
$s$
) and gender ( $t$
) group (
$t$
) group ( $E_{kst}$
) are estimated by,
$E_{kst}$
) are estimated by,
 $$\begin{eqnarray}E_{kst}=AF_{kst}\cdot I_{kst}\cdot Pop_{st},\end{eqnarray}$$
where $Pop_{st}$
is the population size by age
$Pop_{st}$
is the population size by age $s$
and gender
$s$
and gender $t$
group. Parallel to that for power plants, we clarify that: improved coal, improved stove, or improved emission ventilation can mitigate exposure level to different extent. We follow Desai et al. (Reference Desai, Mehta and Smith2004) and set a ventilation coefficient (a multiplier of
$t$
group. Parallel to that for power plants, we clarify that: improved coal, improved stove, or improved emission ventilation can mitigate exposure level to different extent. We follow Desai et al. (Reference Desai, Mehta and Smith2004) and set a ventilation coefficient (a multiplier of $P_{est}$
) to account for the variability of the actual exposure level so that we do not overestimate health benefits. Further, for COPD and lung cancer, we only quantify the completely prevented cases. We choose not to quantify those who have developed the early stages of COPD or have accumulated a high risk for lung cancer over many years’ exposure because it is difficult to know to what extent the onset of disease for such individuals could be reduced by an end in exposure (Hutton, Rehfuess, Tediosi & Weiss, Reference Hutton, Rehfuess, Tediosi and Weiss2006). Lastly, similar to that for the power sector, the IER (Burnett et al., Reference Burnett, Pope, Ezzati, Olives, Lim, Mehta, Shin, Singh, Hubbell, Brauer, Anderson, Smith, Balmes, Bruce, Kan, Laden, Pruss-Ustun, Turner, Gapstur, Diver and Cohen2014) provides a possibility to estimate health impacts based on actual indoor PM
$P_{est}$
) to account for the variability of the actual exposure level so that we do not overestimate health benefits. Further, for COPD and lung cancer, we only quantify the completely prevented cases. We choose not to quantify those who have developed the early stages of COPD or have accumulated a high risk for lung cancer over many years’ exposure because it is difficult to know to what extent the onset of disease for such individuals could be reduced by an end in exposure (Hutton, Rehfuess, Tediosi & Weiss, Reference Hutton, Rehfuess, Tediosi and Weiss2006). Lastly, similar to that for the power sector, the IER (Burnett et al., Reference Burnett, Pope, Ezzati, Olives, Lim, Mehta, Shin, Singh, Hubbell, Brauer, Anderson, Smith, Balmes, Bruce, Kan, Laden, Pruss-Ustun, Turner, Gapstur, Diver and Cohen2014) provides a possibility to estimate health impacts based on actual indoor PM $_{2.5}$
concentration changes. However, we choose to still adopt the “binary exposure classification” method which only classify exposure by exposed and not exposed to household coal usage. The smoke from household coal combustion is a mixture of PM
$_{2.5}$
concentration changes. However, we choose to still adopt the “binary exposure classification” method which only classify exposure by exposed and not exposed to household coal usage. The smoke from household coal combustion is a mixture of PM $_{2.5}$
and many other harmful emissions, which may result in toxicity and health impacts different to that from only PM
$_{2.5}$
and many other harmful emissions, which may result in toxicity and health impacts different to that from only PM $_{2.5}$
. Therefore, we utilize the RR evidences for household coal usage in WHO (2014), rather than those for PM
$_{2.5}$
. Therefore, we utilize the RR evidences for household coal usage in WHO (2014), rather than those for PM $_{2.5}$
in the IER. Similarly, the reason why a full relative risk is used for household coal use, whereas only a more limited set of coal combustion emissions are accounted for in the power plant intervention, is because coal combustion in household coal stoves and in power plants are very different; the latter is much more complete and the end-of-pipe treatments in power plants are effective, therefore generating much less of emissions other than SO
$_{2.5}$
in the IER. Similarly, the reason why a full relative risk is used for household coal use, whereas only a more limited set of coal combustion emissions are accounted for in the power plant intervention, is because coal combustion in household coal stoves and in power plants are very different; the latter is much more complete and the end-of-pipe treatments in power plants are effective, therefore generating much less of emissions other than SO $_{2}$
, NO
$_{2}$
, NO $_{\text{x}}$
and PM.
$_{\text{x}}$
and PM.
3.3.3 Monetize health effects
We use the value of a statistical life (VSL) to monetize mortality reductions. VSL is the marginal rate of substitution between mortality risk and income (Hammitt, Reference Hammitt2000). In China ten VSL studies have been conducted to date and the estimates are from US$150,000 to US$800,000 (Huang, Andersson & Zhang, Reference Huang, Andersson and Zhang2015). Currently there is no “official VSL” in China and we therefore use this range for our estimations. For household intervention, we discount the health benefits related with chronic diseases which have a delay of onset. For their mortality reductions, VSL is adjusted based on income growth assumptions (4%–7%, explained in Table A5) over the years between pollution exposure and health effect onset (hereinafter latency), and by income elasticity of VSL (1–2, see Hammitt & Robinson, Reference Hammitt and Robinson2011). The estimated benefits are then multiplied by the discount factor, $e^{-d\cdot r}$
, where
$e^{-d\cdot r}$
, where $d$
is the years of delay in onset of symptoms (15–25 years) and r is social discount rate. We do not discount for power plants intervention because nearly all of the health impacts of ambient PM
$d$
is the years of delay in onset of symptoms (15–25 years) and r is social discount rate. We do not discount for power plants intervention because nearly all of the health impacts of ambient PM $_{2.5}$
were observed within 2 years of exposure, therefore the effect of discounting is minimalFootnote
11
(Levy et al., Reference Levy, Baxter and Schwartz2009). For morbidities related to power plants, we follow US EPA (2011) and set the value of a statistical case (VSC) of chronic bronchitis to be around 5.5% of the VSL. Regarding household morbidity, we apply the same VSC/VSL ratio and discount factor for COPD morbidity reduction. For lung cancer cases, since the probability of dying, conditional on getting this disease, almost equals one, we do not monetize its morbidity risk to avoid double counting. Avoided ALRI is monetized with information on the cost of illness (Ministry of Health of China, 2012).
$_{2.5}$
were observed within 2 years of exposure, therefore the effect of discounting is minimalFootnote
11
(Levy et al., Reference Levy, Baxter and Schwartz2009). For morbidities related to power plants, we follow US EPA (2011) and set the value of a statistical case (VSC) of chronic bronchitis to be around 5.5% of the VSL. Regarding household morbidity, we apply the same VSC/VSL ratio and discount factor for COPD morbidity reduction. For lung cancer cases, since the probability of dying, conditional on getting this disease, almost equals one, we do not monetize its morbidity risk to avoid double counting. Avoided ALRI is monetized with information on the cost of illness (Ministry of Health of China, 2012).
3.4 Environmental benefits
For the power plant sector, the net change on GHG emissions from switching from combusting coal to natural gas is the annual consumption multiplied by their emission factors of CO $_{2}$
, CH
$_{2}$
, CH $_{4}$
and N
$_{4}$
and N $_{2}$
O, which are the three major GHGs in standard carbon accounting (UNFCCC, 2010). The household sector is more complicated. Whichever heating scenario, for “full-use” households coal will be replaced by certain amount of other fuel or energy (e.g., LPG, electricity or solar). For “nonuse” households, changes in fuel quantities and GHG emissions are also relevant for heating scenarios 1 and 3, since the coal needed for space heating will be reduced due to better thermal insulation capacity brought by the interventions. For the corresponding net change of GHG emissions, besides CO
$_{2}$
O, which are the three major GHGs in standard carbon accounting (UNFCCC, 2010). The household sector is more complicated. Whichever heating scenario, for “full-use” households coal will be replaced by certain amount of other fuel or energy (e.g., LPG, electricity or solar). For “nonuse” households, changes in fuel quantities and GHG emissions are also relevant for heating scenarios 1 and 3, since the coal needed for space heating will be reduced due to better thermal insulation capacity brought by the interventions. For the corresponding net change of GHG emissions, besides CO $_{2}$
, CH
$_{2}$
, CH $_{4}$
and N
$_{4}$
and N $_{2}$
O which apply the same analytical process as that in the power plants, the black carbon emissions from household coal use have a strong greenhouse effect. Therefore, whether or not to include it in the carbon accounting may substantially influence the level of environmental benefits. We follow Jeuland and Pattanayak (Reference Jeuland and Pattanayak2012) and test the influence of black carbon using emission factors of coal used in households estimated by Bond, Venkataraman and Masera (Reference Bond, Venkataraman and Masera2004). Environmental benefits from net reductions of GHGs are estimated by multiplying the CO
$_{2}$
O which apply the same analytical process as that in the power plants, the black carbon emissions from household coal use have a strong greenhouse effect. Therefore, whether or not to include it in the carbon accounting may substantially influence the level of environmental benefits. We follow Jeuland and Pattanayak (Reference Jeuland and Pattanayak2012) and test the influence of black carbon using emission factors of coal used in households estimated by Bond, Venkataraman and Masera (Reference Bond, Venkataraman and Masera2004). Environmental benefits from net reductions of GHGs are estimated by multiplying the CO $_{2}$
equivalent emission amount of different GHGs speciesFootnote
12
with the social cost of carbon (SCC), the economic damages associated with a marginal increase in CO
$_{2}$
equivalent emission amount of different GHGs speciesFootnote
12
with the social cost of carbon (SCC), the economic damages associated with a marginal increase in CO $_{2}$
emissions. Our study estimates the benefits and costs within a national scope, implying that the SCC for China is the most relevant monetary unit value in this study (Gayer & Viscusi, Reference Gayer and Viscusi2013). We set the SCC for China as a quarter of the global SCC, following the ratio suggested in Nordhaus (Reference Nordhaus2011). The global SCC (USD/ton CO
$_{2}$
emissions. Our study estimates the benefits and costs within a national scope, implying that the SCC for China is the most relevant monetary unit value in this study (Gayer & Viscusi, Reference Gayer and Viscusi2013). We set the SCC for China as a quarter of the global SCC, following the ratio suggested in Nordhaus (Reference Nordhaus2011). The global SCC (USD/ton CO $_{2}$
) is set as a triangular distribution with 40 as base estimate, 12 as a lower bound and 200 as an upper bond, based on US EPA (2013). We also examine difference between assumptions taking the global SCC or only Chinese portion of SCC in sensitivity analysis.
$_{2}$
) is set as a triangular distribution with 40 as base estimate, 12 as a lower bound and 200 as an upper bond, based on US EPA (2013). We also examine difference between assumptions taking the global SCC or only Chinese portion of SCC in sensitivity analysis.
3.5 Data, modeling, sensitivity and scenario analysis
Following Jeuland and Pattanayak (Reference Jeuland and Pattanayak2012) and Whittington et al. (Reference Whittington, Jeuland, Barker and Yuen2012), we use a Monte Carlo simulation based approach to provide cumulative distribution of net present value (NPV) and the rankings of sensitive factors for our interventions. With these results one can tell: (1) whether there is a clear ranking of the efficiency of the interventions, (2) the overall variability of NPV outcomes, and (3) what factors are more influential to outcomes and therefore worthy to be further looked at. To perform the simulations, based on an extensive literature review, we specify base values, ranges and likely correlations for all the parameters (summarized in Tables A5 and A6). Then Monte Carlo simulation is performed in the spreadsheet-based application Oracle Crystal Ball, with 10,000 times of realization for the NPV of each intervention. In each time of realization, all the parameters in Tables A5 and A6 are stochastically draw within their value range, with a uniform distribution assumption unless otherwise specified in Table A5.
We further test some factors’ influence on the efficiency of interventions by scenario analysis. These factors are of relevance for different reasons, and they should or could not be subjected to probabilistic risk analysis, i.e. treated as stochastic. First, we construct a power plant unit with worse performance than the current units in use (“dirtier” for short, with year 2000 emission level in Table A7, and upper bound level of coal used per kWh electricity generated in Table A5) to test if the intervention examined could then be justified. Since the actual performance of power plants can be very different in different locations, and change rapidly in a dynamic China, knowing for which power plants the interventions could be beneficial would help decision makers on the order of interventions among power plants with different performance. Second, we test hypothetical scenarios with considerably lower gas prices. In economic impact modeling research, since the results have been found to be very sensitive to fuel prices, it is recommended to specify and examine the effect of plausible fuel price changes in energy market (Morgenstern, Reference Morgenstern2015). China’s proven shale gas reserve is the largest in the world (Hu & Xu, Reference Hu and Xu2013) and if massively exploited, the current high gas price might significantly decrease. Various reasons can possibly lead to this change, for example a more aggressive version of the current CCC policy. If many coal plants were required to shut down in favor of gas plants, incentives for natural gas exploration and development would become stronger, and if this resulted in an abundance of gas supply, gas price would possibly fall. We use three hypothetical gas price scenarios with reference to that in the three major regional markets, North America (where the price is the lowest and where shale gas plays a big role), Europe, and Asia-Pacific (Birol, Reference Birol2013) and test if conversion from coal-to-gas in power plants can be socially beneficial.
For households, we first address the “use rate” issue. Although experimental studies strongly support the short-term improvement brought by household solid fuel use interventions, long-term field evidence (Hanna, Duflo & Greenstone, Reference Hanna, Duflo and Greenstone2012) display a low use rate of improved stoves or new fuel. In reality, because interventions are usually implemented for an aggregated number of households (e.g., in a village), policy makers may be more concerned about how high a real use rate would be sufficient to generate a positive NPV. We assume that among the 200,000 households that would apply the intervention, the proportion of full-use and nonuse households will be $x$
and (
$x$
and ( $1-x$
). Therefore, by solving for
$1-x$
). Therefore, by solving for $x$
in Equation (6), we provide a break-even use rate for a positive NPV,
$x$
in Equation (6), we provide a break-even use rate for a positive NPV,
 $$\begin{eqnarray}x\cdot 200000\cdot NPV_{\text{full-use}}+(1-x)\cdot 200000\cdot NPV_{\text{nonuse}}=0.\end{eqnarray}$$
We further test how different carbon accounting (applying the UNFCCC method or to further add black carbon) will influence this break-even use rate. Environmental benefits based on different carbon accounting methods would provide references for potential scale of subsidies, which would in turn influence the cost burden of households and their real use rate.
Finally, the above scenarios are further divided into six scenarios with different combinations of SCC at Chinese portion or at global level, and social discount rates (1%, 3% and 5%). In this way, we can test their influence in our simulations without the need to construct any specific nonlinear relationship between the SCC and the social discount rate.
4 Results
4.1 Health effects attributable to one coal fired power plant unit or to 200,000 coal using households
We begin by presenting the physical health effects. Table 2 summarizes the mortality and morbidity changes attributable to a single coal fired power plant unit in Beijing by pollutant type, and to household coal use by disease type. For power plants, the results show that the emissions from one plant unit annually result in 292 premature deaths and 279 cases of chronic bronchitis in total, at median value. Among the three emissions NO $_{\text{x}}$
causes the most deaths and cases of chronic bronchitis. Recall that the coal-to-gas intervention for power plants can only reduce emissions of PM
$_{\text{x}}$
causes the most deaths and cases of chronic bronchitis. Recall that the coal-to-gas intervention for power plants can only reduce emissions of PM $_{2.5}$
and SO
$_{2.5}$
and SO $_{2}$
, not NO
$_{2}$
, not NO $_{\text{x}}$
, therefore the avoided premature deaths/cases of illness is only the sum of those from PM
$_{\text{x}}$
, therefore the avoided premature deaths/cases of illness is only the sum of those from PM $_{2.5}$
and SO
$_{2.5}$
and SO $_{2}$
, which gives a total number of 68 deaths and 64 cases of chronic bronchitis avoided from such an intervention, at median value. For households, most premature deaths attributable to household coal use are from COPD and lung cancer. Note that for the households the number of 155 as the sum of chronic and acute deaths is only roughly comparable with the total premature deaths in the power plant sector. To better compare health effects between power plants and households, one should use the monetized benefits (presented later) which discount future health benefits to the same base year.
$_{2}$
, which gives a total number of 68 deaths and 64 cases of chronic bronchitis avoided from such an intervention, at median value. For households, most premature deaths attributable to household coal use are from COPD and lung cancer. Note that for the households the number of 155 as the sum of chronic and acute deaths is only roughly comparable with the total premature deaths in the power plant sector. To better compare health effects between power plants and households, one should use the monetized benefits (presented later) which discount future health benefits to the same base year.
Health effects attributable to 600,000-ton coal used in power plants or in households. a
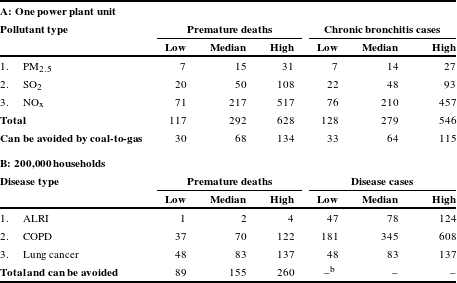
a All cases per year. Low and high correspond to the 10th and 90th percentile outcomes from the simulations. Cells for subitems and total are all from simulations therefore total numbers do not equal the summation of subitems.
b Since symptoms and outcomes are different, a summation is not informative.
Annual benefits and costs of 600,000-ton coal reduction in power plants or in households. a
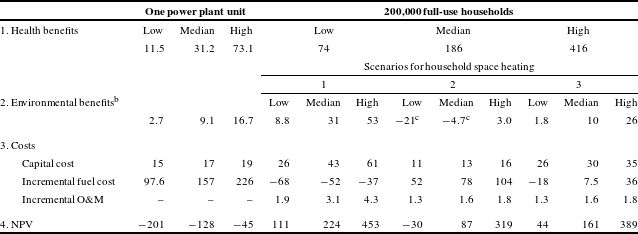
a All in million in 2011 USD. Low and high correspond to the 10th and 90th percentile outcomes from the simulations. Cells for subitems and NPV are all from a simulation process and therefore NPV estimates do not equal the summation of subitems.
b Based on UNFCCC carbon accounting.
c The reason for the potential negative values for environmental benefits for heating scenario 2 is that electricity is a secondary energy (i.e. a product of other energy sources like coal, wind, solar, etc.) and therefore does not necessarily have a lower carbon intensity than coal.
4.2 Benefits and costs of reducing the same amount of coal in power plants or in households
The simulated low, median and high estimates of benefits and costs in power plants and in households are presented Table 3. For power plants, the incremental fuel cost dominates all monetized items and makes the total cost having a larger order of magnitude than benefits. For households, in most cases, benefits exceed costs, resulting in positive net social benefits. The results support scenario 1’s potential in cost saving. For scenario 2, coal-to-electricity, the incremental fuel costs are high and the simulations suggest that even if benefits are expected to exceed the costs, there is a chance for the opposite. Scenario 3 shows that when house thermal insulation reconstruction is added, it indeed saves fuel cost and pulls down the total cost.
Net benefits of coal-to-gas for power plants and phasing out household coal use.

The cumulative distribution of the net benefits of different intervention scenarios are presented in Figure 2. For power plants, though the outcomes spread across a considerable range due to the variable parameters, it is close to certain that NPVs are negative. For households, the spreads of outcomes are much wider in the full-use scenarios, simply because more parameters, especially those for health benefits, are involved in the estimation. In contrast, for the nonuse situation, only parameters related with costs and environmental benefits contributes to variability, resulting in a narrower spread. The distribution in reality will lie somewhere between the two sets of curves. Comparing different heating scenarios, though the scenario 1 has the most cases of positive NPV in full-use, it also has a larger risk of negative NPV than the scenario 2 if the use rate is low. Instead, when the use rate is 0, scenario 3 still has a higher chance of positive NPVs, simply attributable to benefits from better insulation. Scenario 2 by simply switching from coal to electricity, has the largest chance of negative NPVs.
Top 10 parameters contributing to uncertainty of the social net benefits 2011 emission level for power plant. Use rate equals 1 for households. The thick line in the center shows the outcome estimated with base value of parameters. Results for heating scenario 2 and 3 are similar to that for heating scenario 1, and are available from the authors upon request.

4.3 Parameters that contribute most to the variation in social net benefits
Figure 3 shows the top 10 parameters contributing to uncertainty in the NPVs of interventions. As shown in the figure, none of the most significant parameters alone can change the outcome of the analysis, i.e. the NPV always stays negative or positive. For power plants, the gas price dominates the uncertainty, followed by the quantity of coal use per kWh electricity generated, then the price and quantity for coal. Moreover, Figure 3 also reveals that factors such as VSL, $iFs$
, emission level of SO
$iFs$
, emission level of SO $_{2}$
and C-R coefficients are high ranking factors contributing to uncertainty. These are often the key sensitive parameters in estimating health effects from power plants and industry (Stevens, Wilson & Hammitt, Reference Stevens, Wilson and Hammitt2005; Levy et al., Reference Levy, Baxter and Schwartz2009). For households, though different heating scenarios have varying net benefits, the rankings of parameters’ contribution to the uncertainty are very similar. The most important parameters in shifting outcomes are all benefit related ones. This is because that most of the benefits in households come from avoided chronic health outcomes with a long latency. Price and quantity of coal, disease or intervention technology specific parameters are less sensitive.
$_{2}$
and C-R coefficients are high ranking factors contributing to uncertainty. These are often the key sensitive parameters in estimating health effects from power plants and industry (Stevens, Wilson & Hammitt, Reference Stevens, Wilson and Hammitt2005; Levy et al., Reference Levy, Baxter and Schwartz2009). For households, though different heating scenarios have varying net benefits, the rankings of parameters’ contribution to the uncertainty are very similar. The most important parameters in shifting outcomes are all benefit related ones. This is because that most of the benefits in households come from avoided chronic health outcomes with a long latency. Price and quantity of coal, disease or intervention technology specific parameters are less sensitive.
4.4 Scenario analysis on power plant performance, gas price, carbon accounting, SCC and social discount rate
We construct different scenarios with different SCC and discount rate combinations for “standard” and “dirty” power plants under different gas price levels. Specific scenario settings for these different plants, values taken for the SCC and the discount rate, and each scenario’s simulation results are all summarized in Table 4. For all SCC and discount rate levels, simulated NPVs for a “dirty” unit are better (to be interpreted as NPV being positive) than those for a “standard” unit. This means that for a power plant, everything else equal, the lower the efficiency and the higher the emission level is, the better it is to regulate it. Comparing different gas price levels (columns in upper part of Table 4), only if the gas price in China somehow decreases to a level well below 2 yuan $/$
m
$/$
m $^{3}$
, could NPV for coal-to-gas conversion for “standard” power plants be positive. However, if targeted at the “dirty” plants, a 3 yuan
$^{3}$
, could NPV for coal-to-gas conversion for “standard” power plants be positive. However, if targeted at the “dirty” plants, a 3 yuan $/$
m
$/$
m $^{3}$
gas price is enough. Finally, for both types of power plants, different assumptions for the SCC and the discount rate do not significantly influence the outcomes.
$^{3}$
gas price is enough. Finally, for both types of power plants, different assumptions for the SCC and the discount rate do not significantly influence the outcomes.
Scenario analysis for phasing out coal in power plants and in households. a

a Low and high correspond to the 10th and 90th percentile outcomes from the simulations.
b China portion is one quarter of the global SCC.
c Global SCC values corresponds to different discount rate assumptions, the lower the discount rate, the higher the SCC.
d Hypothetical gas prices are around the three major regional markets’ 2012 price level.
e “Standard” unit is simulated based on 320g coal per kWh electricity generated (g/kWh) and 2011 emission level in Table A5.
f “Dirty” unit is a low efficiency and high pollution plant unit and is simulated based on 360g coal used per kWh electricity generated and 2000 emission level in Table A7.
g For households, simulation results marked as “ $+$
” mean that even with no households using the new new fuel after the intervention, NPV is positive.
$+$
” mean that even with no households using the new new fuel after the intervention, NPV is positive.
Regarding what use rate among household interventions can realize net social benefits, we also analyze the three heating scenarios under carbon accounting with or without black carbon, and under different SCC and discount rate combinations. As shown in the bottom half of Table 4, in all the scenarios examined, the break-even use rates, at median level, do not have to be high. A lower discount rate with higher SCC, and with global SCC assumptions, further reduce the break-even ratio. When black carbon is included in the carbon accounting, the environmental benefits increase and the break-even ratios slightly decrease. Our break-even use rate results are more optimistic compared to Whittington et al. (Reference Whittington, Jeuland, Barker and Yuen2012) who also looked at behavioral indicators in programs in developing countries. In their results, often a considerable use rate is necessary to generate a positive NPV. One reason for this difference is that our study looks at phasing out coal stoves, which are used more for space heating than for cooking. In heating scenario 1 and 3 the houses have been renovated with better thermal insulation therefore less coal is needed for space heating. Even with a low use rate these interventions can easily have a positive NPV as they save fuel cost and bring environmental benefits.
5 Discussion
Under the current CCC context in China, this study estimates the social economic impacts, such as health, environmental and climate effects, of coal substitution interventions in power plants and households. A BCA model based on methods and evidence from multiple disciplines is constructed for the different interventions examined. We parameterize the model with information from the literature and publicly available sources, and simulate the results using Monte Carlo methods. We show that: (1) The reduction of a specific amount of coal does not translate into a fixed amount of net benefits, rather there is a considerably wide range of likely outcomes for the different interventions across the sectors (power plants and households). (2) Coal-to-gas for standard power plants (e.g., the ones in Beijing) is not socially beneficial – even for the ones with low efficiency and high pollution can the intervention be justified only if the gas price in China significantly decreases. (3) Although a lot of uncertainties are involved, to phase out household coal use can bring net social benefits. Moreover, interventions with house thermal insulation reconstruction integrated should be prioritized.
In summary, it will be more beneficial to first phase out coal use in households, rather than in the conventionally policy-focused sectors, such as power plants. The gas fired power plants examined in our study are already in operation. Because Beijing is prioritized, its gas supply to these power plants will always be guaranteed, even if alternative, more efficient uses are foregone. Hence, there is a risk that policies will not be reconsidered in Beijing despite the analysis suggesting robust evidence of a negative NPV. However, since different coal interventions, as shown in Table A3, are being considered, or already implemented, the same BCA analytical process used here can also be applied to inform policy makers about the efficiency of those other interventions, and the analysis conducted in this study can be useful to better allocate their limited gas resource to generate more socially beneficial outcomes in Beijing and other places in China (and in other countries).
Although the analytical framework in this study can be widely used, a number of caveats and extensions of this analysis should be highlighted. First, whether the conclusion for power plants in this study can be generalized to other places and countries, or to industry and utility boilers, would need further research. More importantly, we do not suggest that coal-to-gas conversion for power plants will always result in social losses. To continue to build conventional coal power plants is committing to enormous future CO $_{2}$
emissions, and therefore, substituting coal with gas has value in certain circumstances (e.g., to balance the intermittency of wind and solar energy). What our results suggest is that without significant technology or fuel market changes in the near term, relative fuel price will influence the economic efficiency a lot and cleaner fuels should be more effectively allocated across sectors and sites.
$_{2}$
emissions, and therefore, substituting coal with gas has value in certain circumstances (e.g., to balance the intermittency of wind and solar energy). What our results suggest is that without significant technology or fuel market changes in the near term, relative fuel price will influence the economic efficiency a lot and cleaner fuels should be more effectively allocated across sectors and sites.
For the household sector, our modeling does not predict the behavior of households. For some of the scenarios with household interventions, not only positive net social benefits but also positive net private benefits are observed. Possible reasons for why households have not invested in technology or changed their behavior in a way that would provide net private benefits include liquidity constraints, lack of (or irresponsive to) information, or behavior that fails to optimize quantifiable private benefits that could be addressed with nudges (Graham, Reference Graham2016). For example, the main benefits are nonfinancial health benefits that in some cases involve latency. It may, therefore, be difficult for individual households to accurately conduct their own private BCA and realize that it would be in their self-interest to invest in the new technology and to change their energy source. Since we are conducting a BCA of the interventions, such behavioral aspects are not covered by our modeling.
It should be stressed that the modeling itself does not provide direct evidence against the current “improved coal policy” for households. There is a lack of scientifically reliable information of emissions and health risks from improved coal (WHO, 2014), but its use is a favored policy. The improved coal is being massively promoted to be used for households in rural areas for heating (China State Council, 2013). However, two facts suggest abandonment of this policy. One is that improved coal cannot force out the raw coal in the market. A price reduction of the raw coal was immediately observed after the provision of the subsidized improved coal in rural areas (Miyun County Government, 2014). Moreover, the easier it is to accesses coal, the higher the likelihood for households to continue (or to go back to) the use of coal. Therefore, there is no point in promoting the supply of improved coal for households.
We have above discussed nonquantified benefits and costs, but there are potential effects and distributional impacts not considered. Specifically, if the interventions in this paper are implemented at a large scale, significant air quality improvement could result and other benefits, e.g. the hedonic value of clean air and blue skies, may need to be taken into account, and there might be general equilibrium effects not covered by our analysis. But we are in this study examining specific small scale interventions and we believe that any hedonic value of clean air would be small (if existent) and hence not influence our conclusions, and that a general equilibrium analysis is outside the scope of the study. Moreover, it could be argued that multiple and overlapping policies affecting Chinese coal consumption could also affect our analysis and conclusions. For instance, if investments for coal-to-gas projects are being taken for compliance with other policies, the marginal cost of compliance under the CCC may be zero. However, in this study, we are examining the benefits and technical costs of implementing the goals of specific policies and are not examining the costs of specific policy mechanisms. Hence, we believe it is better to interpret the estimated benefits and costs in this paper as for actual project interventions at the very local level, rather than for certain policy mechanisms.
Regarding distributional effects and type of intervention, they are of relevance also for small scale interventions like the ones examined here. For the benefits, there are spatial, demographic distributional differences for health benefits depending on the type of intervention, and whereas power plant interventions lead to fully socialized benefits, household interventions would lead to greater private benefits. On the cost side, since we are examining interventions in power plants, where investments and the increase in fuel costs will likely be covered by the government, and household interventions, where the costs most likely will have to be covered by the households themselves, this distributional difference is also of interest. However, we argue that is mainly of political relevance in our case, and less of economic relevance, since we can consider all costs being financed by households, including government expenses, and the government could also finance the household investments by lump sum transfers and fuel subsidies to the households. Hence, we argue that we can ignore the distributional impacts in our BCA, but that they are of relevance for a discussion on why some policies are favored from political perspectives.
Our findings reinforce the assertion that when implementing well-motivated macro policies, it is important to consider economic efficiency of micro interventions in order to better allocate resources among targeted sectors and achieve macro policy objectives in the most efficient way. A real-world decision process is often based on limited knowledge of sometimes very long impact chains with many factors involved. Different disciplines’ research efforts keep producing, or collecting, more detailed information on single or groups of factors, yet uncertainty still remains, and decisions in the end have to be made. Similar to Whittington et al. (Reference Whittington, Jeuland, Barker and Yuen2012) where they looked at water, sanitation, and preventive health development programs, we show in a Chinese energy policy setting that with information from different sources it is possible to provide detailed information on a policy program’s expected welfare effects, the cumulative probabilistic distributions of the intervention’s net benefits, and which individual factors can contribute to the uncertainty. Compared with point estimates of benefits and costs, these results and the analytical process, though not precise, are more useful in decision making. They add transparency and confidence when screening and choosing interventions, and gather attention and discussion on the real relevant issues.
Appendix
Beijing City, spans about 160 km from west to east. Darker gray level for more populated districts. White squares for the four power plants.


Coal reduction tasks breakdown in Chaoyang District of Beijing (Chaoyang District Government, 2014).

Technically feasible interventions at local project level for power plants, boilers and households.


Definition of model parameters, values and ranges.

Assumed parameter correlations.