

1. Introduction
The global sugar industry has an interesting web of distortionary policies. The U.S. sugar program relies on price floors and trade barriers to protect domestic producers, but the market had been trending slowly toward liberalization. Mexico gained unlimited, tariff-free access to U.S. markets in 2008; however, import restrictions were reinstated subsequently. With decreased U.S. trade barriers, imports from Mexico grew and prices fell substantially (U.S. Department of Agriculture, Economic Research Service [USDA-ERS], 2017). Falling prices caused U.S. sugar program expenditures to increase significantly in 2012 and 2013. Complaints were filed with the U.S. International Trade Commission (USITC) by a U.S. producer group in 2014 accusing Mexico of dumping subsidized sugar onto the U.S. market, and an agreement was signed in December 2014 rolling back Mexico’s access to the U.S. sugar market. Accordingly, this research employs a dynamic partial equilibrium trade model to estimate the price and welfare effects of the 2014 U.S.-Mexico sugar agreement that restricts U.S. imports of Mexican sugar by comparing market simulations with and without the agreement in place.
This study begins with a discussion of the unique background of the global sugar industry, focusing on the production and trade policies of the United States and Mexico. Previous research is examined to build the foundation to investigate the economic implications of the agreement governing U.S.-Mexico sugar trade. The partial equilibrium model of the sugar market and data are then outlined in detail, followed by results, policy implications, and potential for future research. Key findings indicate that the current agreement limiting Mexico’s access to the U.S. market is expected to increase the U.S. sugar price. Removing this agreement in exchange for the former liberalization scenario leads to an increase in U.S. consumer surplus at the cost of substantial losses to producers and a moderate increase in Mexican producer surplus.
2. Background
Global sugar markets are among the most distorted of any agricultural commodity. Mitchell (Reference Mitchell2004) found that 60% of sugar trade and 80% of production takes place at prices above the global market equilibrium. Countries protect domestic markets through two general policy schemes: domestic support and trade barriers. Domestic support includes subsidies, production controls, or price floors, and many nations use a blend of these policies to protect domestic markets. Since the 1995 Uruguay Round Agreements on Agriculture (URAA) of the General Agreement on Tariffs and Trade (GATT), most trade barriers in the sugar market have been tariff rate quotas (TRQs). TRQs encompass relatively small tariff levels until a quota is fulfilled, followed by higher tariffs on additional imports. The out-of-quota tariff rate is often prohibitively high, and the TRQ acts as if it were a hard quota (McMinimy, Reference McMinimy2016). The remainder of this section characterizes domestic and trade policies of the United States and Mexico for sugar as the two trade partners are the focus of this analysis.
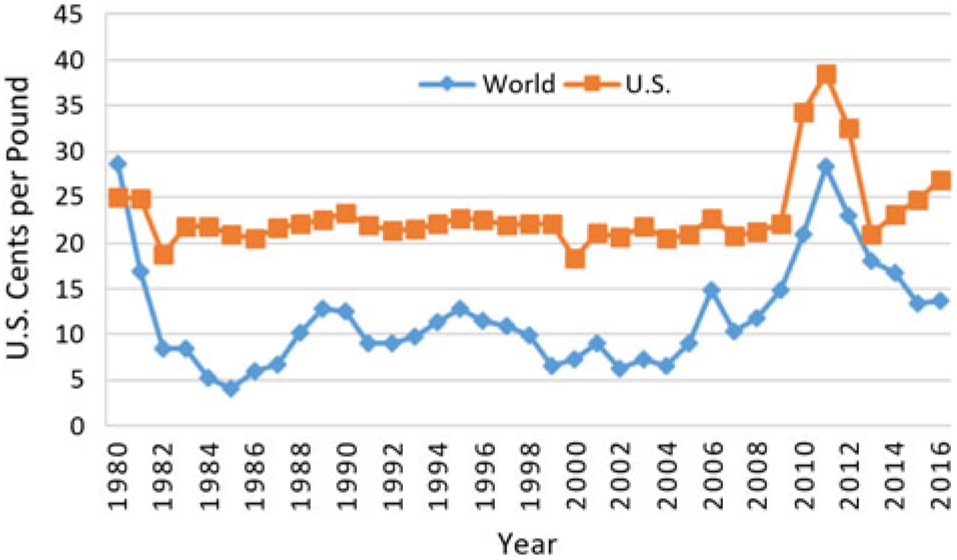
The United States protects the domestic sugar industry through price floors, production controls, and TRQs. U.S. prices are consistently about double that of the Caribbean Free on Board (f.o.b.) price for raw sugar, a representative world price (Elobeid and Beghin, Reference Elobeid and Beghin2006). This historical difference is illustrated in Figure 1. The relatively high prices in the United States are attributable to U.S. domestic support and trade barriers (USDA-ERS, 2017). The U.S. domestic sugar program provides guaranteed prices for both sugarcane and beets, each of which is processed into a homogeneous raw sugar product. The U.S. sugar program generally operates at no cost to the federal budget by restricting the quantity of sugar on the market, both domestically produced and imported. The Commodity Credit Corporation (CCC) of the USDA has the authority to issue loans and purchase sugar through the Food and Agriculture Act of 1977 (Anderson, Reference Anderson2009). The CCC sets loan rates below expected prices for sugar in the United States based on annual forecasts, and loan sizes are based on historical yields for each producer. The loan rate serves as a price floor. If market prices are above the loan rate, producers sell their sugar crop on the market and pay back the loan. If the domestic price is below the loan rate, producers turn the crop over to the CCC and are paid the loan rate. All excess sugar acquired by the CCC is sold to ethanol plants for conversion to fuel, as the Agricultural Act of 2014 prohibits human consumption of forfeited sugar (McConnell, Reference McConnell2016). Loan forfeitures are costly to the government as the prices paid by ethanol plants are generally lower than the returns from sugar sales in the United States. Therefore, the program is directed to be managed in a way that prevents loan forfeitures so that there is no cost to the federal budget, as is required by the Food, Conservation, and Energy Act of 2008 (Anderson, Reference Anderson2009). The CCC sets an overall sugar crop production quota, and sugarcane and sugar beets are allocated 45.65% and 64.35% of the quota, respectively (McConnell, Reference McConnell2016).
U.S. and world raw sugar prices, 1980–2016 (source: USDA-ERS, 2017)
The U.S. government heavily restricts competition from foreign suppliers to further protect prices and sugar program expenditures. Under the URAA, the United States must import 1.139 billion metric tons of raw or refined sugar each year. The required level of sugar imports is met by supply from 40 countries, mostly trading under the TRQ system. For raw sugar, the current in-quota tariff rate is 0.625 cents per pound, and the current out-of-quota tariff rate is 15.36 cents per pound (McConnell, Reference McConnell2016). Raw sugar is also imported through three reexport programs designed to benefit U.S. refiners without adding any additional supply to the U.S. market because sugar imported though these programs is prohibited for human consumption.
The North American Free Trade Agreement (NAFTA) was signed in 1994, liberalizing the North American market, but U.S.-Mexican sugar trade was not fully liberalized until 2008, when Mexico gained unfettered, duty-free access to the U.S. market. The next few years saw commodity prices increase across the board, especially for crops that could be converted into biofuel such as corn and sugar. Increased demand led to substantial global sugar production expansion (McConnell, Dohlman, and Haley, Reference McConnell, Dohlman and Haley2010), and poor weather conditions for sugar production in the United States and Mexico allowed sugar prices to remain high, despite liberalized trade with Mexico (Knutson, Westhoff, and Sherwell, Reference Knutson, Westhoff and Sherwell2010). In 2012 and 2013, the influx of Mexican sugar imports, along with more favorable weather conditions, decreased the price of sugar in the United States and led to $259 million in federal expenditures because of sugar loan defaults. U.S. intervention in the sugar markets is intended to prevent loan forfeitures. This event exposed the Mexican government’s practice of subsidizing its domestic sugar production.
Mexico’s sugar program similarly distorts its domestic and foreign markets, owning and operating as much as 20% of the country’s sugar industry in recent years (DeLong and Schmitz, Reference DeLong and Schmitz2015). The Mexican government sets annual reference prices that mills pay to refineries for semirefined sugar, known as standard sugar in Mexico, and sugarcane growers receive 57% of the reference standard sugar price (Flores and Harrison, Reference Flores and Harrison2016). By owning the mills and setting the price, the Mexican government supports sugar production and pays growers prices well above the market value, costing U.S. producers an estimated $1.6 billion annually (DeLong and Schmitz, Reference DeLong and Schmitz2015). As such, these subsidizing practices coupled with unrestrained access led to a trade dispute with the United States that culminated in 2014.
3. Antidumping and countervailing suspension agreements
In March 2014, the American Sugar Alliance, a coalition of sugarcane and beet producers dedicated to preserving and protecting the U.S. sugar industry, filed antidumping and countervailing petitions with the USITC in response to the Mexican government’s subsidization of sugarcane production. Because the subsidies appeared to distort prices, the USITC levied temporary tariffs on Mexican sugar imports and launched investigations into the Mexican government’s sugar subsidizing practices and subsequent dumping onto the U.S. market. The U.S. Department of Commerce (USDOC) and USITC joint investigation determined that Mexican sugar subsidies ranged from 2.99% to 17.01%, substantially injuring U.S. producers (U.S. Department of Commerce, International Trade Commission, 2015). An agreement, officially named the Antidumping and Countervailing Duty Suspension Agreements on Sugar from Mexico, was reached in December 2014 between the USDOC, the Mexican government, and producers from both countries. This allowed the USDOC to suspended the investigations and pay back the temporary tariffs in exchange for compliance with six stipulations: (1) a quantitative restriction on imports based on U.S. needs;Footnote 1 (2) subjection of imported sugar to price floors above the CCC loan rate;Footnote 2 (3) a maximum of 53% of exports to the United States to be refined sugar, having a polarity greater than 99.5%; (4) a seasonal limit on all sugar imports; (5) adoption of a production allocation system in order to reduce the quantity of sugar supplied domestically in Mexico; and (6) establishment of an export licensing mechanism so that only licensed Mexican exporters may sell sugar in the United States (U.S. Department of Commerce, International Trade Commission, 2015).
4. Literature review
Previous research investigates the distortion of sugar markets by employing equilibrium models to understand the effects of policy changes. Ex ante analyses of sugar policy are widespread in the literature, particularly focusing on the potential impacts of NAFTA (Abler et al., Reference Abler, Beghin, Blandford and Elobeid2008; Devadoss, Kropf, and Wahl, Reference Devadoss, Kropf and Wahl1995; Kennedy and Schmitz, Reference Kennedy and Schmitz2009; Knutson, Westhoff, and Sherwell, Reference Knutson, Westhoff and Sherwell2010; Schmitz and Lewis, Reference Schmitz and Lewis2015). Previous research has also produced ex post analyses regarding the effects of NAFTA and its subsequent side agreements (Schmitz, Reference Schmitz2018). The simulated scenarios are sometimes large and multilateral, and they often model the removal of substantial trade barriers in the global sugar market that may be unrealistic in the near term (Beghin and Elobeid, Reference Beghin and Elobeid2014; Elobeid and Beghin, Reference Elobeid and Beghin2006; van der Mensbrugghe, Beghin, and Mitchell, Reference van der Mensbrugghe, Beghin and Mitchell2003).
A group of partial equilibrium studies has focused on this trade dispute in recent years, without specifically addressing the 2014 trade agreement limiting imports of Mexican sugar to the United States. DeLong and Schmitz (Reference DeLong and Schmitz2015) estimated that Mexican intervention in the sugar market cost U.S. producers up to $1.6 billion annually, with ambiguous effects on Mexican producers. Schmitz (Reference Schmitz2018) simulated the imposition of price floors agreed on in the 2014 U.S.-Mexico agreement to sugar traded when NAFTA was in place (2008–2014). Simulation results estimated that U.S.-imported Mexican sugar fell below the theoretical price floor in three of seven years, and on average, U.S. producers were estimated to have gained approximately $140 million whereas Mexican producers lost $220 million, annually. Ex post analyses of bilateral trade agreements are relatively rare in the literature, but Schmitz and Lewis (Reference Schmitz and Lewis2015) developed a partial equilibrium sugar trade model to compare the realized prices with unlimited U.S. imports from Mexico to the previous policy of limiting Mexican trade through a TRQ system. Their research found substantial U.S. producer losses and U.S. consumer gains by NAFTA’s implementation.
5. Model description and scenario design
This study utilizes the FAPRI (Food and Agricultural Policy Research Institute at Iowa State University) international sugar model to simulate specific policy changes in the U.S. and Mexican sugar markets, as well as their interactions with the world market. The partial equilibrium model is designed as a system of dynamic, nonspatial, econometric-based submodels to generate estimated values for supply, demand, prices, and trade flows. Current domestic agriculture and trade policies are explicitly specified in the model to establish a baseline scenario. Changes in U.S. sugar policy are simulated to estimate potential changes from the baseline.
The model defines only raw sugar production and trade, with sugarcane and sugar beet production tied to raw sugar through the extraction rate. Sugar is modeled as a homogeneous product, with no differentiation in the quality of the product on the market nor its origin crop (sugarcane or sugar beet). The model construction follows Elobeid and Beghin (Reference Elobeid and Beghin2006), with the only divergence being the aggregation of the European Union and eastern Europe submodels, a necessary change given updated data availability. Twenty-eight countries/regions,Footnote 3 including a rest-of-the-world aggregate (ROW), are represented to describe the world sugar market from 1980 to 2021. The modeled countries comprise approximately 90% of world sugar production, 81% of world sugar consumption, and 92% of world sugar trade over the data period used, and ROW represents the remainder of each category.
The model operates as 28 submodels representing each country or region interacting with the world model to determine a world price. The submodels include behavioral equations to simulate production of sugar crops, as detailed in Elobeid and Beghin (Reference Elobeid and Beghin2006). The general structure for behavioral supply equations is defined by equations (1–3) as follows:
Area harvested of sugarcane or beet crop in time t:
 $$A{H_t} = f(A{H_{t - 1}},\,SC{P_{t - 1}},\,AC{P_{t - 1}},\,T)$$
(1)
$$A{H_t} = f(A{H_{t - 1}},\,SC{P_{t - 1}},\,AC{P_{t - 1}},\,T)$$
(1)
Yield of sugarcane or beet crop in time t:
 $${Y_t} = f({Y_{t - 1}},T)$$
(2)
$${Y_t} = f({Y_{t - 1}},T)$$
(2)
Production of sugarcane or beet crop in time t:
 $$Q{C_t} = A{H_t} \times {Y_t},$$
(3)
$$Q{C_t} = A{H_t} \times {Y_t},$$
(3)
where AH designates acreage, SCP is the real price faced by sugarcane or sugar beet producers for their crop, ACP represents the real market price of alternate crops,Footnote 4 T denotes a trend variable, Y is sugar crop yield, QC is the quantity of sugar crop (sugarcane or beet) produced, and subscripts express the time period. Parameters are econometrically estimated by Elobeid and Beghin (Reference Elobeid and Beghin2006) for each country submodel, with the exception of the U.S. model, which has newly estimated parameter values as described in Section 6. The extraction rate is the amount of raw sugar derived from sugar crops and is used as the link between crop and raw sugar production, determined by equation (4) as
 $$E{R_t} = {{QR{S_t}} \over {Q{C_t}}},$$
(4)
$$E{R_t} = {{QR{S_t}} \over {Q{C_t}}},$$
(4)
where ER designates the extraction rate, and QRS is the quantity produced of raw sugar.
Several countries produce both sugarcane and sugar beets, and the total production of the two crops is used in this calculation. Extraction rates are calculated when historical data are available and are then held constant to convert projected crop production into raw sugar available for trade on the world market. When available, producer or farm gate prices are used for sugar crops for the supply equations. However, not all countries have this data accessible, so price transmission equations are used to convert raw sugar prices to sugar crop prices. Transmission equations are defined in equations (5–7) as follows:
 $$P{P_t} = {1 \over 2} \times RP{P_{t - 1}} + {1 \over 2} \times RP{P_t}$$
(5)
$$P{P_t} = {1 \over 2} \times RP{P_{t - 1}} + {1 \over 2} \times RP{P_t}$$
(5)
 $$RP{P_t} = {{DS{P_t}} \over D}$$
(6)
$$RP{P_t} = {{DS{P_t}} \over D}$$
(6)
 $$DS{P_t} = W{P_t} \times NE{R_t} \times (1 + r),$$
(7)
$$DS{P_t} = W{P_t} \times NE{R_t} \times (1 + r),$$
(7)
where PP represents the producer price of sugar crops, RPP is the real price of sugar crops, DSP is the domestic raw sugar price, D represents the GDP deflator, WP is the world price of sugar represented by the Caribbean f.o.b. raw sugar price, NER represents the nominal exchange rate, and r is the ad valorem tariff rate. Producer price is determined by the real price of sugar from both the previous and current time periods to more accurately reflect how producers observe prices. The model incorporates within-TRQ ad valorem tariffs as price distorting trade policies where tariffs are a function of the price of sugar in the importing country. To impose other policies into the model, such as supply or trade restrictions, production or trade are simply constrained to reflect the policy.
Behavioral demand equations are described in equation (8), where per capita consumption of raw sugar, PCC, in time t is
 $$PC{C_t} = f(RC{P_t},GD{P_t}),$$
(8)
$$PC{C_t} = f(RC{P_t},GD{P_t}),$$
(8)
where RCP represents the real price that consumers face, and GDP is the real gross domestic product of the country.
Ending stocks, ES, in time t are included in equation (9):
 $$E{S_t} = f(E{S_{t - 1}},\,PC{C_t},\,US{P_t}),$$
(9)
$$E{S_t} = f(E{S_{t - 1}},\,PC{C_t},\,US{P_t}),$$
(9)
where USP is the price of raw sugar in the United States.
Crops compete with sugar production on the supply side; however, only a handful of countries have strong enough substitute crop relationships to make a large impact on production choice given government influence in many countries’ production decisions. The cross-price effects in production are based on FAPRI elasticity of substitution estimates. Sugar crops also have multiple uses. Countries with high levels of sugarcane output, such as Brazil, oftentimes convert sugarcane to alcohol to use as a fuel source (Barros, Reference Barros2016). This model does not incorporate the substitution links in consumption dynamically. Instead, a constant ratio is used based on historical data. The prices of substitute sweeteners are not included in the FAPRI/CARD (Center for Agricultural and Rural Development at Iowa State University) sugar model as attempts to estimate parameters with high-fructose corn syrup (HFCS) price included produced unreliable results.
Country submodels are used to predict raw sugar production, consumption, and ending stocks. These four values are used to determine the quantity traded for each country. The sign of the solution from the net trade equation determines whether a country is a net importer or exporter. Net trade, NT, is calculated in equation (10) as
 $$N{T_t} = QR{S_t} + E{S_{t - 1}} - CR{S_t} - E{S_t} = 0,$$
(10)
$$N{T_t} = QR{S_t} + E{S_{t - 1}} - CR{S_t} - E{S_t} = 0,$$
(10)
where CRS is the consumption of raw sugar. By setting equation (10) equal to zero, the world market clears, and an equilibrium price can be solved for.
To explicitly model the U.S. market, additional equations are required. The U.S. Trade Representative currently sets the overall TRQ level based on expected production and consumption, with a minimum within-TRQ quantity required by World Trade Organization (WTO) agreements. Therefore, TRQ allocations and fulfillments are determined by
 $$TRQ{A_t} = f(US{Q_{t - 1}},\,US{C_{t - 1}})$$
(11)
$$TRQ{A_t} = f(US{Q_{t - 1}},\,US{C_{t - 1}})$$
(11)
 $$TRQ{F_t} = f(US{Q_t},\,US{P_t},\,W{P_t}),$$
(12)
$$TRQ{F_t} = f(US{Q_t},\,US{P_t},\,W{P_t}),$$
(12)
where TRQA is the total allotment for U.S. imports of raw sugar through TRQ programs, USQ represents U.S. quantity produced, USC is U.S. consumption, and TRQF represents the fulfillments of the total TRQ allocation. TRQ allocations must be greater than the minimum quantity from WTO agreements, and TRQ fulfillments must be less than the allocation. Fulfillments are estimated as a percentage of the allocation. Tariff-free imports are specified in equation 13 as follows:
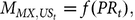 $${M_{MX,U{S_t}}} = f(P{R_t}),$$
(13)
$${M_{MX,U{S_t}}} = f(P{R_t}),$$
(13)
where MMX,US is U.S. sugar imports from Mexico, and PR is the ratio of Mexican raw sugar price to U.S. raw sugar price. Imports from Mexico must be less than the limit specified by the U.S.-Mexico agreement as defined in equation (14):
 $$M{L_t} = (US{C_t} \times 1.135) - E{S_{t - 1}} - US{Q_t} - TRQ{F_t} - M{P_t},$$
(14)
$$M{L_t} = (US{C_t} \times 1.135) - E{S_{t - 1}} - US{Q_t} - TRQ{F_t} - M{P_t},$$
(14)
where ML denotes Mexico’s limit on exports to the United States, and MP is imports from other import programs. Other program imports are held constant at just below 400,000 metric tons, the average over the last decade.
The initial step in analyzing the U.S.-Mexican sugar trade agreement is to simulate the sugar market as it is now, with U.S. imports of Mexican sugar restricted by equation (14). This scenario will be referred to as S1, where Mexican sugar exports to the United States are subject to both a quantitative restriction and price floors. In S2, Mexico can export unlimited, duty-free sugar to the United States with no restrictions or price floors as NAFTA was originally implemented. Both simulated scenarios use data for the period 1980–2017 aside from farm gate crop prices, which are only available through 2013. The scenarios are simulated from 2018 to 2021, with S1 describing current U.S. policies remaining the same and S2 simulating the reimplementation of free sugar trade between the United States and Mexico as was the case with NAFTA.
Model calibration and sensitivity analysis follows the same procedure as in Elobeid and Beghin (Reference Elobeid and Beghin2006). Each equation is calibrated using historic data to establish the baseline. The difference between the computed value and the actual value is the calibration, which is then added to the computed value to match historical data. Calibrations are held constant when simulating future values. Sensitivity analysis was conducted to justify model results and is discussed in the Section 8.
6. Data and parameter estimation
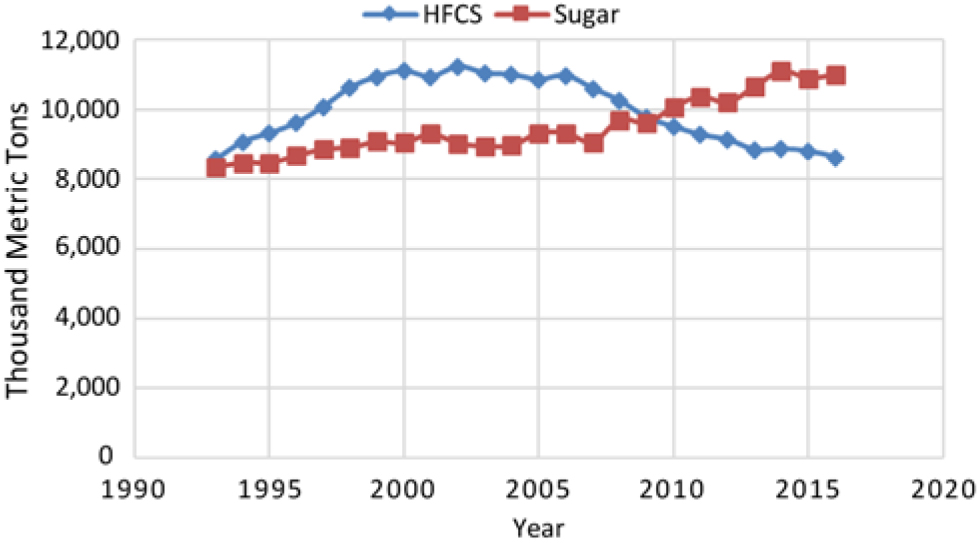
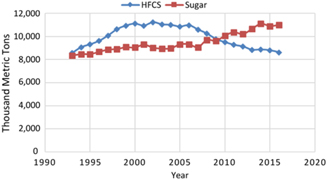
For all non-U.S. parameters, data from 1980 to 2001 were used to estimate the parameter values gleaned from Elobeid and Beghin (Reference Elobeid and Beghin2006). The high level of government intervention in all sugar production and biological characteristics of sugarcane combine to make sugar highly inelastic in supply. Sugar consumption is also highly inelastic in demand as it is a major ingredient in a variety of food and beverage products. The inelastic nature of supply and demand at the time of parameter estimation is similar today (Elobeid and Beghin, Reference Elobeid and Beghin2015). HFCS is a strong sweetener substitute for sugar, but after peaking in the early 2000s, U.S. consumption of HFCS has returned to early 1990s levels as is shown in Figure 2 (USDA-ERS, 2017).
U.S. high-fructose corn syrup (HFCS) versus refined sugar consumption, 1993–2016 (source: USDA-ERS, 2017)
Data cover the historical time frame of 1980 through 2017. Sugarcane and beet crop data for acreage, yield, and production were obtained from the Food and Agricultural Organization (FAO, 2016) of the United Nations. Historical centrifugal sugar production, consumption, and carryover stock data were collected from the “Production, Supply, and Distribution” query view of the USDA, Foreign Agricultural Service (2016). Exchange rates were accessed from the World Bank. Macroeconomic data including nominal GDP, GDP deflators, and population from the International Monetary Fund were employed to project consumption. GDP deflators are updated to represent 2015 as the base year.
Sugar prices for the world, the United States, and Mexico were obtained from the USDA-ERS. Statistics for farm and producer crop prices are from the OECD-FAO Agricultural Outlook (Organization for Economic Cooperation and Development [OECD], 2016). As noted previously, published producer prices are used for most countries, and price transmission equations are used when necessary. The USDA’s Global Agricultural Information Network reports provided Mexico’s standard price data as well as Brazil’s sugar use data (Barros, Reference Barros2016).
Parameters for behavioral equations that describe U.S. supply and demand were estimated using ordinary least squares (OLS) and linear specifications with annual data from (USDA-ERS, 2017) for the 1980–2013 time frame. OLS and linear specifications were used to save degrees of freedom, given the relatively small annual time series used for estimation. Parameters for all other modeled regions are from Elobeid and Beghin (Reference Elobeid and Beghin2006). Parameter estimates largely reflect those employed in the FAPRI/CARD model and database and are included in online supplementary Appendix 1.
7. Results
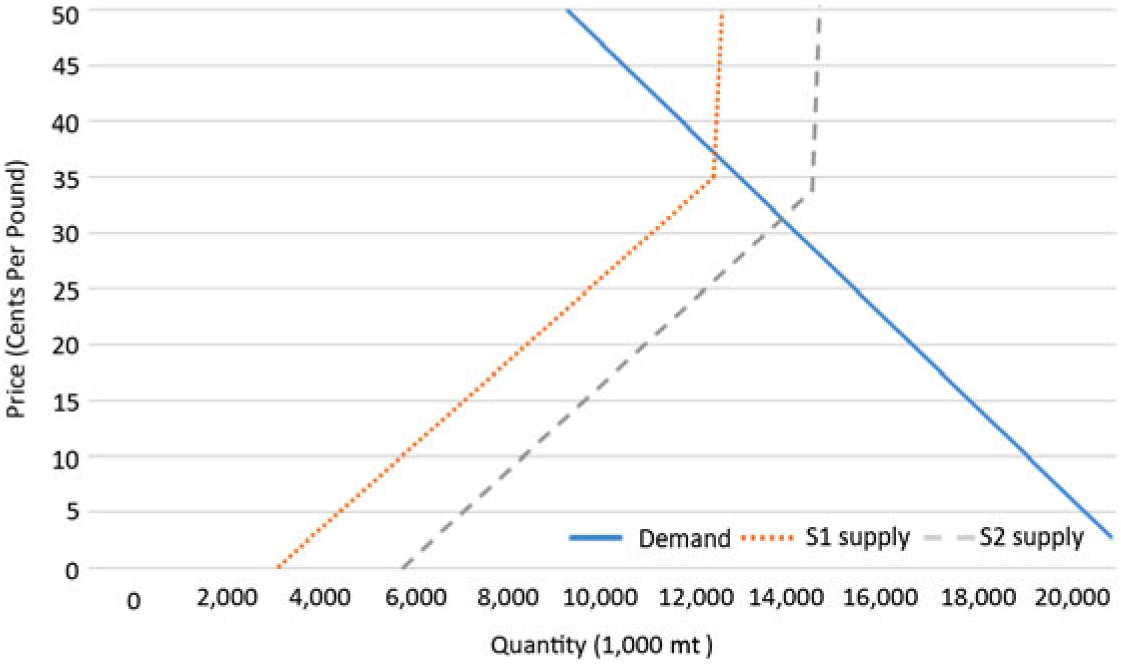
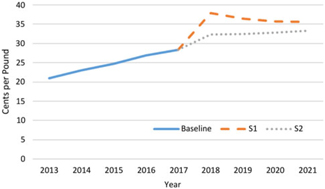
Figure 3 represents the simulated sugar market in 2018, the first year of model projection. There is a notable difference in U.S. sugar supply between S1 and S2. Both simulated supply curves feature a kink where supply moves from being somewhat inelastic to nearly perfectly inelastic. This represents an import limit being reached in both scenarios. The S2 kink is caused by total TRQ imports reaching the set allotment, and the S1 curve kinks when U.S. imports from Mexico reach their specific limit. It is important to note that the kink happens after the equilibrium price in S2 and before it in S1, causing the market price of S1 to be higher. Figure 4 visualizes the price effects of implementing this restriction on U.S. sugar imports from Mexico.
2017 U.S. sugar market supply and demand curves (source: authors’ representation)
Simulated U.S. raw sugar prices (source: authors’ simulation)

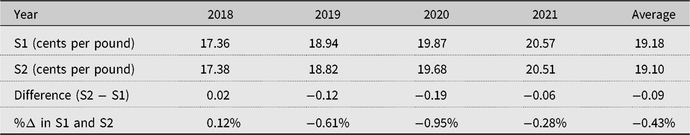
Under the stable market projection simulated, expected prices for S1 decrease gradually. Table 1 shows the simulated prices for U.S. raw sugar, as well as for sugar crops in the United States. Reexpanding Mexico’s access decreases the price of raw sugar considerably, a 10% approximate average decrease across the simulated time frame. The decrease is especially large in year 1, when there is a nearly 15% decrease in price compared with the baseline scenario of limited U.S. sugar imports from Mexico. The degree of price increases levels off to approximately 6.5% by year 4, the final year of simulation, showing the projected market adjustment to unlimited trade with Mexico. Naturally, simulated sugar crop prices had a similar effect, with sugarcane farm prices decreasing approximately 3% to 7% and sugar beet farm prices dropping about 5% to 10%. However, the expected price decreases do not lead to substantially reduced production in either crop. Sugarcane production was virtually unchanged between the two simulated scenarios, and sugar beet production decreased less than 1% after the theoretical reimplementation of full NAFTA provisions. These meager decreases are driven by the lack of flexibility sugar crop producers have in planting decisions, a freedom they forgo in exchange for considerable market protection from the U.S. government, as reflected by parameter values in the model. U.S. sugar consumption remains virtually unchanged between the two scenarios because of the inelastic nature of sugar demand.
Simulated U.S. sugar prices
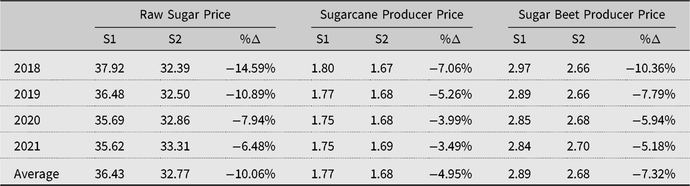
Notes: S1 is the baseline scenario that limits U.S. imports of sugar from Mexico. S2 is the scenario that allows unlimited U.S. imports of sugar from Mexico, as if the North American Free Trade Agreement were still in place. The third column of each price category is the percentage change between S1 and S2.
The focus of the 2014 trade agreement was to limit Mexico’s access to U.S. sugar markets, and a binding quota that increases annually does curb Mexican sugar exports to the United States, per our simulations (Table 2). Under S2, unlimited imports are relatively constant throughout the simulation. Allowing for unlimited imports of Mexican sugar increases the quantity of sugar from Mexico to the United States compared with the limited baseline of S1. The difference between the two simulated scenarios is largest in the first year and decreases in each subsequent year because of the model’s reliance on lagged variables for prediction. The lagged variables are still influenced by old policies even though a change has been made. In reality, producers are able to observe policy changes, and savvy producers may be able to alter production ahead of time in order to account for these changes. However, producers often are largely unaware of the effects a policy will have in a given year, so this effect of lagged variables is not far-fetched. On average, imports from Mexico are approximately 18% higher in S2 than S1.
Simulated U.S. sugar quantities
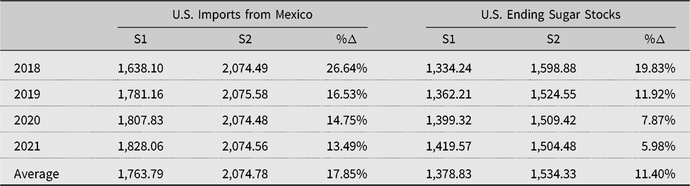
Notes: S1 is the baseline scenario that limits U.S. imports of sugar from Mexico. S2 is the scenario that allows unlimited U.S. imports of sugar from Mexico, as if the North American Free Trade Agreement were still in place. The third column of each category is the percentage change between S1 and S2.
Source: Authors’ simulation.
Carryover stocks are an important driver of model results. Because the ending stock equation (equation 9) is a function of beginning stock, consumption, and price, there are considerable differences in carryover inventories between S1 and S2. The amount of sugar on the market at the end of each period is consistently as large as the amount traded with Mexico, the United States’ biggest sugar trade partner. As Table 2 shows, the raw price of sugar in the United States has an inverse relationship with the amount of inventory that is carried over into the next period, as suppliers are likely to sell more of their inventory with higher prices. With S1 prices significantly higher than S2 prices, about 6% to 20% more sugar is held over from one period to the next in S2. As prices begin to converge, so do ending stock levels.
Table 3 summarizes TRQ allocations and fulfillments over the simulated period. TRQ allocations are similar between the two scenarios, both well above the 1.139 billion metric ton minimum U.S. import level required per the URAA. However, there is significant variation for sugar imported into the United States through these programs. As raw sugar prices are higher in S1 compared with S2, fulfillments are also considerably larger. Total import quantity for both simulations is largest in year 1 of projections (2018), when S1 prices are highest and the difference between S1 and S2 prices is greatest. In S2, a substantial amount of Mexican sugar imported into the United States keeps U.S. prices low, and, subsequently, TRQ fulfillments are lower in this scenario despite the consistently rising price.
U.S. tariff rate quota (TRQ) allocations and fulfillments
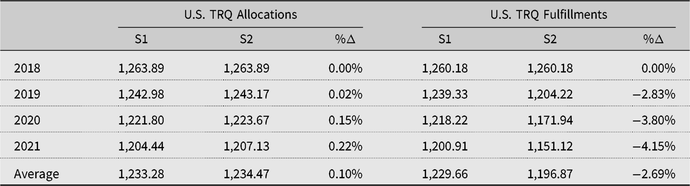
Notes: S1 is the baseline scenario that limits U.S. imports of sugar from Mexico. S2 is the scenario that allows unlimited U.S. imports of sugar from Mexico, as if the North American Free Trade Agreement were still in place. The third column of each category is the percentage change between S1 and S2.
Source: Authors’ simulation.
The U.S.-Mexico sugar agreement has less than a 1% expected impact on the world sugar price (Table 4). After negligible world price increases compared with the baseline in year 1 (2018), simulations show minor world price decreases for the remainder of the time frame analyzed. This effect is driven by the U.S. market being opened up to the rest of the world besides Mexico. Because of geographic proximity and NAFTA liberalization, Mexico has an advantageous trade position with the United States relative to the rest of the world, even compared with countries with large TRQ allotments through regional trade agreements (RTAs). When Mexico’s access is limited, simulated prices rise and U.S. sugar imports from other TRQ countries increase and come closer to fulfilling their respective quota allotments.
Simulated world raw sugar prices
Notes: S1 is the baseline scenario that limits U.S. imports of sugar from Mexico. S2 is the scenario that allows unlimited U.S. imports of sugar from Mexico, as if the North American Free Trade Agreement were still in place. The third row is the difference between S1 and S2 (S2 − S1), and the fourth row is the percentage change between S1 and S2.
Source: Authors’ simulation.
Simulation results project that restricting Mexico’s access does, as the policy intended, increase U.S. domestic prices above levels realized during full NAFTA implementation. This analysis suggests that removing the limits from the agreement would increase sugar imports from Mexico and decrease the price of sugar in the United States. By 2021, the end of the simulated period, the market begins to adjust to the new policy regime as prices between S1 (current policy) and S2 (trade liberalization) begin to converge. Unless domestic policies are altered, total imports are expected to continue growing, even with imports from Mexico limited. Current policies do not allow domestic production to expand, as a more market-based strategy would permit, so prices and imports are expected to continue to grow. Similar to other policies within the U.S. sugar program, the 2014 agreement benefits those who produce sugar by increasing prices.
As model results show, the U.S.-Mexico sugar agreement increases the expected price of sugar in the United States by decreasing the expected quantity of imports from Mexico, leading to welfare changes within the market. Supply is disaggregated by source to properly calculate the welfare changes for U.S. and Mexican sugar producers. Behavioral equations for U.S. domestic supply, U.S. supply from Mexico, and U.S. demand are used to estimate the relevant welfare changes from the agreement. Table 5 shows the welfare changes for the United States and Mexico given the simulated price and quantity changes. Given the restoration of NAFTA-like sugar policies, projected U.S. producer surplus decreases more than $2.6 billion over the 4-year simulated period, whereas U.S. consumer surplus would be expected to increase more than double that by approximately $6.7 billion. Changes in expected prices lead to a total surplus increase of more than $4 billion over the simulated time frame. Mexican producers are also expected to have welfare increase by more than $150 million over the 4-year period. The magnitude of this change is considerably smaller than the expected impacts for U.S. agents, as Mexican producers are expected to trade a much higher volume to the United States but at a lower price. Government revenues are also affected by this agreement through changes in imports through the TRQ system, with the model assuming only in-quota tariff rates applying to such trade, and lower sugar prices in the United States with the liberalized trade with Mexico inflicts a decrease in imports from TRQ countries, meaning less government revenue is obtained from this source. Because simulated prices remain well above the expected loan rate, even with a reversion to NAFTA-like policies, there are no welfare changes attributable to government expenditure.
Welfare effects of U.S.-Mexico sugar agreement (millions of 2015 U.S. dollars)
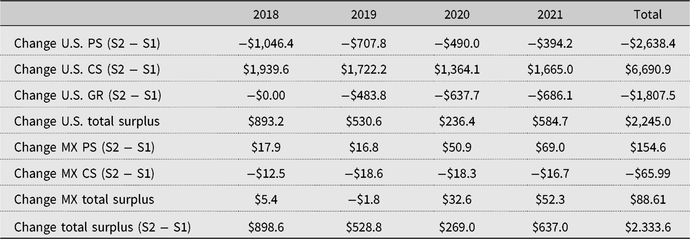
Notes: S1 is the baseline scenario that limits U.S. imports of sugar from Mexico. S2 is the scenario that allows unlimited U.S. imports of sugar from Mexico, as if the North American Free Trade Agreement were still in place. CS, consumer surplus; GR, government revenue; MX, Mexico; PS, producer surplus.
Source: Authors’ calculations.
Inelastic supply and demand functions yield relatively small welfare changes given a change in U.S. prices. However, the magnitude of estimated welfare changes is quite large because the United States consumes more sugar per capita than any other country, totaling more than 24 billion pounds in 2016. Previous studies have analyzed welfare impacts of various policy changes, providing examples to compare with our results.Footnote 5
In comparison, Schmitz and Lewis (Reference Schmitz and Lewis2015) investigated the welfare impacts of NAFTA after it had been in place for 6 years and estimated a loss in U.S producer surplus equal to approximately $1.3 billion, whereas U.S. consumers and Mexican producers would gain $1.7 billion and $833 million of surplus, respectively. Our welfare estimates are quite similar to that of Schmitz and Lewis (Reference Schmitz and Lewis2015), especially for U.S. consumer surplus changes. Our producer surplus changes for both U.S. and Mexican producers are similar, yet lower in magnitude, than findings by Schmitz and Lewis (Reference Schmitz and Lewis2015). Our simulated welfare impacts of the overall U.S. sugar policy are larger in magnitude than those found by Koo (Reference Koo2002), who estimated an annual $2.5 billion increase in consumer surplus and a $1 billion decrease in producer surplus with the abolition of the entire U.S. sugar program. Beghin et al. (Reference Beghin, El Osta, Cherlow and Mohanty2003) estimated the entire U.S. sugar program costs U.S. consumers between $2 billion and $2.5 billion annually, while benefiting producers between $1.1 billion and $1.4 billion annually. Although these studies all analyze different changes to U.S. sugar policy, the expected welfare changes show that U.S. producers benefit from a heavily protected domestic sugar market at the cost of U.S. consumers.
8. Sensitivity analysis
To test the sensitivity of results, we simulate the baseline and reform scenarios with price responses both doubled and halved to substantiate model results, following the approach in Elobeid and Beghin (Reference Elobeid and Beghin2006). The effective price floors guaranteed by the U.S. sugar program were suspended from this portion of the analysis because the exaggerated price responses produce results that would trigger large loan forfeitures, and the calculation of these forfeitures is beyond the scope of this analysis.
Doubling the price responses of production, use, and inventory is expected to produce more moderate price changes because agents are more sensitive to prices, but quantities of production, use, and trade are expected to be magnified. Table 6 compares baseline results with the results with price responses doubled and halved. Both doubled parameters used for S1 and S2 show lower prices than the baseline equivalent, but the percentage changes from S1 to S2 are larger with doubled price responses, as expected. This is driven by the low price produced by doubled price responses for S2, caused by Mexico’s production expansion with more sensitive price responses. Because Mexico has full access to U.S. markets and its production is allowed to broaden more easily in S2, there is a large influx of Mexican sugar on the U.S. market in this case. When the relatively high imports of Mexican sugar are curbed by the current trade agreement, prices rise greatly in S1 compared with S2 but are still considerably smaller than baseline values. Halving price response parameters is expected to magnify price changes in tandem with dampened changes in production, consumption, and trade. Both S1 and S2 prices are substantially higher in the halved case compared with the baseline. This is because the U.S. price response for sugar consumption is relatively low with respect to most countries, and halving the parameter values magnifies this effect.
U.S. raw sugar prices (doubled and halved price responses vs. baseline)
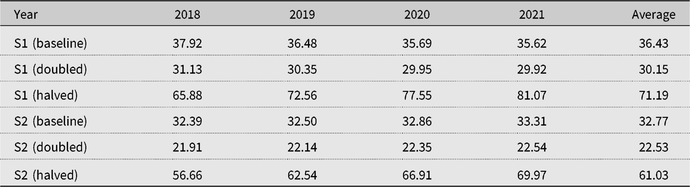
Notes: S1 is the baseline scenario that limits U.S. imports of sugar from Mexico. S2 is the scenario that allows unlimited U.S. imports of sugar from Mexico, as if the North American Free Trade Agreement were still in place. “Doubled” represents the scenario with all price responses doubled, “halved” represents the scenario with all price responses halved, and “baseline” represents the original simulation.
Source: Authors’ simulation.
Table 7 displays the relatively large increases in S2 imports from Mexico because of Mexico’s responsive sugar production. S1 imports from Mexico increase from the last year of data (2017), but they do not reach the levels of the highs that were observed in 2013 and 2014. Table 7 also shows imports from Mexico under this halved price response scenario. Unlimited S2 imports begin higher than S1, but the two scenarios begin to converge and stabilize by 2019 (year 2). With such high prices, TRQ imports are large under both scenarios, and U.S. domestic supply is relatively stable. This causes Mexico to export about the same quantity to the United States under both unlimited and restricted cases, as Mexico’s production is less responsive to the increase in U.S. price. Although the magnitudes are smaller for results in the case where price response parameters are halved, results have the same sign as those from the scenarios that employ baseline parameters.
U.S. imports from Mexico (doubled and halved price responses)
Notes: S1 is the baseline scenario that limits U.S. imports of sugar from Mexico. S2 is the scenario that allows unlimited U.S. imports of sugar from Mexico, as if the North American Free Trade Agreement were still in place. “Doubled” represents the scenario with all price responses doubled, “halved” represents the scenario with all price responses halved, and “baseline” represents the original simulation.
Source: Authors’ simulation.
Welfare effects were calculated based on the results of the sensitivity analysis, largely reflecting the qualitative results from the original welfare impacts. Table 8 displays the welfare effects of the policy change with doubled and halved price responses. The qualitative welfare effects on the U.S. market were the same as in the original analysis, but the magnitude of these changes was larger in both scenarios because of more drastic price changes. The effects on the Mexican market were quite different, however, as the doubled scenario yielded welfare losses to both Mexican producers and consumers, and the halved scenario produced welfare gains for Mexican consumers but losses for producers, the opposite of the calculations from the original results. In both cases, effects on Mexican producers and consumers were much smaller in magnitude than the effect on U.S. welfare. The ambiguity of the welfare impacts for Mexican producers and consumers is in line with some previous findings. Kosse and Devadoss (Reference Kosse and Devadoss2016) investigated a very similar trade agreement in the tomato market after a dispute between the United States and Mexico led to price floors and restrictions on U.S. imports of Mexican tomatoes. Findings were similar, as limited trade benefitted U.S. producers and hurt U.S. consumers, while having smaller and ambiguous effects on welfare in the Mexican market. Overall, sensitivity analyses corroborate results of the simulation of the U.S.-Mexico sugar trade agreement by showing that although the magnitudes of changes vary, the directions of simulated changes compared to the baseline scenario are largely maintained, with the welfare impacts on the Mexican sugar market being more unclear than the effects on the U.S. market.
Welfare calculations for sensitivity analysis (millions of 2015 U.S. dollars)

Notes: S1 is the baseline scenario that limits U.S. imports of sugar from Mexico. S2 is the scenario that allows unlimited U.S. imports of sugar from Mexico, as if the North American Free Trade Agreement were still in place. “Doubled” represents the scenario with all price responses doubled, “halved” represents the scenario with all price responses halved, and “baseline” represents the original simulation. CS, consumer surplus; GR, government revenue; MX, Mexico; PS, producer surplus.
Source: Authors’ simulation.
9. Limitations and further considerations
This research thoroughly examines the 2014 U.S.-Mexico sugar agreement. Simulated economic impacts of the agreement show that U.S. producers experience welfare gains at the loss of U.S. consumers and Mexican producers. The global sugar industry is large and multifaceted, making it difficult to model in great detail. As such, there are several limitations present within this analysis that leave a number of areas on which future studies could focus and improve.
Annual time series data were employed in tandem with OLS specifications for parameter estimation. However, data with greater observations would allow for a more detailed approach for parameter estimation to capture more market forces that affect producer decisions. A two-stage least squares method was explored to capture the multiyear nature of sugarcane production, but the data available were insufficient to employ this approach.
Not only is sugar a product derived from multiple sources, but it is also a product with multiple uses. As previously mentioned, some countries use sugarcane as a major fuel source, and the explicit modeling of sugarcane ethanol demand would improve the robustness of the results, specifically in countries such as Brazil. Finally, sugar has a strong substitute in HFCS. This analysis used a constant ratio of HFCS to total sweetener when determining a country’s sweetener use, and explicit treatment of HFCS in the modeling framework will improve future analysis.
As noted, only raw sugar is modeled in this analysis, and the inclusion of refined sugar would expand estimates of price and welfare effects. Although beyond the scope of this work, additions to the modeling structure to account for refined sugar and sugar substitutes would be especially beneficial for the analysis of future proposed policy given the recent political focus on refined sugar. A further contention pertaining to this bilateral trade relationship arose in 2016 when the U.S. sugar industry alleged there was a loophole in the agreement that allowed continued dumping of Mexican sugar in the U.S. market. In June 2017, additions to the agreement were made targeting the trade of refined sugar and emphasizing the importance of refined sugar’s explicit inclusion in analyzing the most recent policy override. A more intricate modeling of the sugar production system of Mexico would also allow for the explicit investigation of Mexican subsidization. However, such an investigation is outside the scope of this analysis because of data limitations pertaining to Mexico’s production system.
Despite these limitations, this research thoroughly examines the 2014 bilateral sugar trade agreement between the United States and Mexico to estimate the price and welfare impacts of the pact, and the model performs well when comparing model predictions to historical, observed values. After 2014, restrictions were reimposed on U.S. imports of Mexican sugar, providing a unique opportunity to test our model given the policy change. We validated the model by comparing model predictions to actual, observed values for prices, trade, and consumption in the U.S. sugar market over these years and found our model performed relatively well. Predicted prices from 2015 to 2017 were approximately 8% higher than observed prices on average, and U.S. imports from Mexico were approximately 6% higher than observed quantities on average. U.S. consumption is relatively inelastic and steady, and our results were within 2% as observed consumption quantities in all three years. The overestimation of price increases could be a function of dumping practices continuing to occur by Mexico, as was alleged by U.S. producers. These findings provide a clearer picture of how the U.S. restriction on sugar imports from Mexico may increase domestic prices to achieve the overall objectives of the U.S. sugar program.
10. Conclusion
This research employs a dynamic, partial equilibrium trade model to estimate the price and welfare effects of the 2014 U.S.-Mexico sugar trade agreement compared to the previous regime of free trade between the countries. The agreement restricts Mexico’s access to the U.S. sugar market in response to Mexico’s alleged dumping of subsidized sugar, when Mexico gained unlimited, tariff-free access to the U.S. market in 2008 with the full implementation of NAFTA. Our simulation results indicate that the agreement is expected to protect U.S. sugar prices and contribute to increased U.S. producer welfare at the expense of U.S. consumers and Mexican producers. Results show that U.S. prices are expected to decrease by an average of 10% across the 4-year simulated period given the reimplementation of NAFTA-like policies. This would cause an estimated decrease in U.S. producer surplus of approximately $2.6 billion and an increase in consumer surplus of more than $6.5 billion, both across that time span. When considering the stated objectives of the current U.S. sugar program, the agreement is successful in protecting domestic producers and minimizing government expenditures by increasing U.S. prices. However, this research highlights that limiting imports harms domestic consumers and benefits producers to a lesser extent causing an overall surplus loss as a result of import protection. This is an important lesson to reiterate as further trade restrictions are likely to have similar impacts.
This modeling framework is well suited to examine a variety of other policy changes within the sugar market, such as pending changes to the European Union sugar program. The European Union began moving to a more market-based approach to sugar production in 2017 by abolishing their U.S.-style allotment system (European Commission, 2016). Formerly the largest exporter of beet-sourced sugar, this move could have large implications for the global sugar industry, especially for the many nations in RTAs with the European Union. Continued policy changes are expected in the future, and this modeling framework is well suited to investigate the impacts of sugar trade agreements and other policies with alterations to the modeling framework. The June 2017 additions to the U.S.-Mexico sugar agreement make substantial changes to sugar policy less likely moving forward (Lawder and Prentice, Reference Lawder and Prentice2017). However, the U.S. position on sugar trade within the context of other trade agreements will continue to be of importance, given the relatively high level of protection that remains in the domestic sugar market relative to other sectors. The Trans-Pacific Partnership was scheduled to expand trade limits for several countries in 2017, and although the United States exited the pact, the remaining nations have moved forward with the partnership in absence of the United States (Nguyen and Ananthalakshmi, Reference Nguyen and Ananthalakshmi2017). Regional trade expansion such as this will have implications for the global sugar market that merit continued study.
Supplementary material
To view supplementary material for this article, please visit https://doi.org/10.1017/aae.2019.1
Acknowledgement
We would like to thank the three anonymous reviewers for their helpful comments and suggestions.


 Open access