


Nomenclature
Latin
- $D$
$D$
-
diameter
-
$f_m^s\left( t \right)$
-
modal forces
-
$i,j,k$
-
indices
-
$J$
-
advance ratio
-
$k$
-
number of neighbouring points
-
${\bf{M}}$
-
mass matrix
-
${m_j}$
-
generalised mass
-
$n$
-
rotational frequency
-
$N$
-
number of inner time steps
-
$nx$
-
number of points in
$x$
-
$ny$
-
number of points in
$y$
-
$nz$
-
number of points in
$z$
-
$p$
-
pressure
-
${\bf{p}}$
-
a given point
-
$\mathbb P$
-
power parameter
-
$R$
-
residual vector
-
${\bf{R}}$
-
radius
-
$s$
-
solid (blade)
-
$t$
-
real-time step or time
-
$V$
-
axial velocity
-
$W$
-
vector of conserved variables
-
${w_i}$
-
interpolation weights


Greek
-
$\alpha _m^s$
-
modal amplitude
-
${\zeta _m}$
-
structural damping coefficient
-
${\eta _m}$
-
mode shape of the
${m^{th}}$
mode -
$\tau $
-
pseudo time step
-
$\phi _m^s\left( p \right)$
-
supplied mode shapes
-
${\phi ^s}\left( t \right)$
-
deformed blade shape at time t
-
$\phi _0^s$
-
rigid shape
-
${\omega _m}$
-
modal frequency


Acronyms
- ADT
-
alternating digital tree
- BILU
-
block incomplete lower-upper
- BLADE
-
Bristol Laboratory for Advanced Dynamic Engineering
- CFD
-
computational fluid dynamics
- CSD
-
computational structural dynamics
- eVTOL
-
electric vertical take off and landing
- FE
-
finite element
- FEM
-
finite element method
- HMB3
-
helicopter multi block 3
- IDW
-
inverse distance weighting
- IMPACTA
-
${\rm{im}}$
proving the
${\rm{p}}$
ropulsion
${\rm{a}}$
erodynamics and a
${\rm{c}}$
oustics of
${\rm{t}}$
urboprop
${\rm{a}}$
ircraft
- JORP
-
joint open rotor program
- MENtOR
-
methods and experiments for novel rotorcraft
- MLS
-
moving least squares
- MUSCL
-
Monotone Upstream-Centred Scheme for Conservation Laws
- NASTRAN
-
${\rm{NA}}$
SA
${\rm{str}}$
uctural
${\rm{an}}$
alysis
- RANS/URANS
-
unsteady/ Reynolds-averaged Navier-Stokes
- SOL
-
NASTRAN solution
- SR
-
single rotation
- SST
-
shear stress transport


1.0 Introduction
Stall flutter is defined as the oscillation of a body due to the partial or full separation of the flowfield around it [Reference Fung1]. Propeller blades have operating conditions, within their flight envelop, that can lead to stall. Where the blades have relatively high rotational rates with low axial velocity, i.e. low advance ratio, $J = \frac{V}{{nD}}$
, (where
$J = \frac{V}{{nD}}$
, (where $V$
is the axial velocity,
$V$
is the axial velocity, $n$
is the rotational frequency and
$n$
is the rotational frequency and $D$
is the propeller diameter). Furthermore, blade stall characteristics also depend on the blade pitch angle. Stall conditions can occur on the runway, during take-off of turbo-prop aircraft, or they may appear in new electric vertical take off and landing (eVTOL) or tilt rotor aircraft in the transition stages from hover to forward flight. There is also a constant demand for better-performing, quieter blades, which often means thinner blade sections. Other design characteristics, such as larger twist, swept tip sections, and tip anhedral, can make the blades more susceptible to stall. Higgins [Reference Higgins2], shown that stall flutter is driven by the design, but the non-linear, stalled aerodynamics, means that the flutter boundary of stall flutter is significantly reduced in comparison with bending-torsion flutter. Aside from the work by Higgins, there are no other high-fidelity numerical propeller stall flutter studies. Delamore-Sutcliffe [Reference Delamore-Sutcliffe and Greenwell3] developed a low-order model based on an eigenvalue solution, which assesses blade stability. This model was validated using the experimental data of Baker [Reference J.E.4]. However, the model assumptions limit its capabilities for application in modern propeller designs. There are very few experimental stall flutter studies, and even if data exists, these often come from accidental occurrences of flutter during performance testing, which led to the test runs being shut down [Reference Higgins, Barakos and Filippone5]. One of the most comprehensive sets of blade flutter experiments was conducted by NASA on the single rotation (SR) blades [6–Reference Kaza, Mehmed, Williams and MOSS8] between 1970 and 1990. Blade deformations, both static and dynamic, were tested during an extensive campaign, which concluded that classical flutter is sufficiently understood; therefore, propellers can be designed to avoid this [9]. However, the aerodynamic non-linearity of stall flutter is a much more challenging concept. Dowty Rotol also reported an experimental test campaign where initial testing had to be cancelled due to concerning amounts of noise from strain gauges indicating flutter [Reference Armstrong, Pucher, Williams, Watts, Jones and Gibson10]. In recent years, experimental tests for the methods and experiments for NOvel Rotorcraft (MENtOR) propeller blade have been conducted on the UK National Rotor Rig [Reference Zagaglia, Croke, Green and Barakos11]. These campaigns have also considered the onset of stall on these blades [Reference Croke, Zagaglia, Woodgate, Green and Barakos12] and in further work to explore the frequencies from the strain gauges and compare with the modal frequencies of the propeller blades in stalled flow [Reference Croke, Zagaglia, McKechnie, Green and Barakos13]. The novelty of the work is that 3D finite elements (FE) are used for the structural representation of the blade, and this is combined with numerical analyses compared with the limited available experimental data. Dynamic fluid/structure interaction computations were used for the study of stall flutter, and it was evident that the frequency content of the blade response was driven by both its natural modes of oscillation and the frequency content of the stalled part of the flow. This was confirmed by on-the-blade and off-the-blade comparisons of the simulation results in terms of their frequency content and associated amplitudes. This work is a positive step in the increase of fidelity of the simulations of stall flutter and puts forward a method that is of high fidelity in comparison to the use of beam-based models or simplified stalled-flow aerodynamic models.
$D$
is the propeller diameter). Furthermore, blade stall characteristics also depend on the blade pitch angle. Stall conditions can occur on the runway, during take-off of turbo-prop aircraft, or they may appear in new electric vertical take off and landing (eVTOL) or tilt rotor aircraft in the transition stages from hover to forward flight. There is also a constant demand for better-performing, quieter blades, which often means thinner blade sections. Other design characteristics, such as larger twist, swept tip sections, and tip anhedral, can make the blades more susceptible to stall. Higgins [Reference Higgins2], shown that stall flutter is driven by the design, but the non-linear, stalled aerodynamics, means that the flutter boundary of stall flutter is significantly reduced in comparison with bending-torsion flutter. Aside from the work by Higgins, there are no other high-fidelity numerical propeller stall flutter studies. Delamore-Sutcliffe [Reference Delamore-Sutcliffe and Greenwell3] developed a low-order model based on an eigenvalue solution, which assesses blade stability. This model was validated using the experimental data of Baker [Reference J.E.4]. However, the model assumptions limit its capabilities for application in modern propeller designs. There are very few experimental stall flutter studies, and even if data exists, these often come from accidental occurrences of flutter during performance testing, which led to the test runs being shut down [Reference Higgins, Barakos and Filippone5]. One of the most comprehensive sets of blade flutter experiments was conducted by NASA on the single rotation (SR) blades [6–Reference Kaza, Mehmed, Williams and MOSS8] between 1970 and 1990. Blade deformations, both static and dynamic, were tested during an extensive campaign, which concluded that classical flutter is sufficiently understood; therefore, propellers can be designed to avoid this [9]. However, the aerodynamic non-linearity of stall flutter is a much more challenging concept. Dowty Rotol also reported an experimental test campaign where initial testing had to be cancelled due to concerning amounts of noise from strain gauges indicating flutter [Reference Armstrong, Pucher, Williams, Watts, Jones and Gibson10]. In recent years, experimental tests for the methods and experiments for NOvel Rotorcraft (MENtOR) propeller blade have been conducted on the UK National Rotor Rig [Reference Zagaglia, Croke, Green and Barakos11]. These campaigns have also considered the onset of stall on these blades [Reference Croke, Zagaglia, Woodgate, Green and Barakos12] and in further work to explore the frequencies from the strain gauges and compare with the modal frequencies of the propeller blades in stalled flow [Reference Croke, Zagaglia, McKechnie, Green and Barakos13]. The novelty of the work is that 3D finite elements (FE) are used for the structural representation of the blade, and this is combined with numerical analyses compared with the limited available experimental data. Dynamic fluid/structure interaction computations were used for the study of stall flutter, and it was evident that the frequency content of the blade response was driven by both its natural modes of oscillation and the frequency content of the stalled part of the flow. This was confirmed by on-the-blade and off-the-blade comparisons of the simulation results in terms of their frequency content and associated amplitudes. This work is a positive step in the increase of fidelity of the simulations of stall flutter and puts forward a method that is of high fidelity in comparison to the use of beam-based models or simplified stalled-flow aerodynamic models.
2.0 Simulation methodology
2.1 Methodology of the study
To minimise our computational resources, simulation cases were first conducted using the static aeroelastic method with steady flow assumptions. The results of these cases would indicate if the flow was attached or separated. These calculations were of very low cost compared to the dynamic aeroelastic methods, and hence if the flow was displaying periodic behaviour then only the static aeroelastic methods are required. However, if the flow displays separated regions with aperiodic loading then the dynamic aeroelasticity methods are required. The blade pitch angles and rotational speeds were set to match the experimental cases, validation data was obtained for the static aeroelastic cases. Then the numerical work could explore more conditions that could not be achieved experimentally as well as a conceptually softened blade.
2.2 CFD solver
This work uses the Helicopter Multi-Block 3 (HMB3) computational fluid dynamic (CFD) solver that has been developed for rotorcraft flows and helicopter blade design [Reference Steijl, Barakos and Badcock14, Reference Steijl and Barakos15]. However, HMB3 has also been used for propeller cases. These were mainly validation cases in both installed and isolated flight conditions [Reference Barakos and Johnson16, Reference Higgins, Zarev, Barakos and Green17], using data from experimental campaigns such as the joint open rotor program (JORP) [Reference Scrase and Maina18], and the ${\rm{im}}$
proving the
${\rm{im}}$
proving the ${\rm{p}}$
ropulsion
${\rm{p}}$
ropulsion ${\rm{a}}$
erodynamics and a
${\rm{a}}$
erodynamics and a ${\rm{c}}$
oustics of
${\rm{c}}$
oustics of ${\rm{t}}$
urboprop
${\rm{t}}$
urboprop ${\rm{a}}$
ircraft (IMPACTA) propellers [Reference Gomariz-Sancha, Maina and Peace19, Reference Knepper and Bown20]. Comparisons with experimental inflow investigations at the University of Glasgow for model propeller blades in axial flight and at yaw [Reference Zarev and Green21] have also been conducted.
${\rm{a}}$
ircraft (IMPACTA) propellers [Reference Gomariz-Sancha, Maina and Peace19, Reference Knepper and Bown20]. Comparisons with experimental inflow investigations at the University of Glasgow for model propeller blades in axial flight and at yaw [Reference Zarev and Green21] have also been conducted.
In HMB3, the Navier-Stokes equations are solved using the cell-centred, finite volume approach on multi-block grids. The unsteady/ Reynolds-averaged Navier-Stokes (RANS/URANS) system of ordinary differential equations after discretisation are:
 \begin{equation}\frac{{dW}}{{dt}} + \frac{{dW}}{{d\tau }} + R(W) = 0,\end{equation}
where, $W$
is the vector of conserved variables,
$W$
is the vector of conserved variables, $R$
is the residual vector,
$R$
is the residual vector, $t$
is the real time step and
$t$
is the real time step and $\tau $
is the pseudo time step, of a dual-time stepping method. The steady state discretisation is the same other than the pseudo time step term,
$\tau $
is the pseudo time step, of a dual-time stepping method. The steady state discretisation is the same other than the pseudo time step term, $\left( {\frac{{dW}}{{d\tau }}} \right)$
, is removed.
$\left( {\frac{{dW}}{{d\tau }}} \right)$
, is removed.
Using the middleware to couple HMB3 to MSC/NASTRAN.

The convective fluxes are evaluated using Osher’s approximate Riemann solver [Reference Osher and Chakravarthy22], and the viscous terms with second-order central differences in space. To provide high-order accuracy in space, the Monotone Upstream-centred Scheme for Conservation Laws (MUSCL) with the developments of Leer [Reference van Leer23] is employed.
For steady-state calculations, a non-inertial reference frame is used. Therefore, a source term and mesh velocities are added to account for the centripetal and Coriolis accelerations [Reference Steijl, Barakos and Badcock14]. For the unsteady time-marching method, the temporal integration is performed with the implicit dual-time stepping technique of Jameson [Reference Jameson24]. For each time step there is a pseudo-time $\tau $
where the solution is marched to steady state. The linearised system is then solved with the generalised conjugate gradient (CG) method with a block incomplete lower-upper (BILU) factorisation [Reference Axelsson25].
$\tau $
where the solution is marched to steady state. The linearised system is then solved with the generalised conjugate gradient (CG) method with a block incomplete lower-upper (BILU) factorisation [Reference Axelsson25].
2.3 Fluid structure interaction
2.3.1 Static aeroelasticity
An in-house computer code coined ‘Middleware’ is used. Middleware is a communications utility within the HMB3 toolset. This facilitates data exchanges and data reformatting between the CFD solver and the structural solver (MSC-NASTRAN). The tool takes a CFD flow solution, passes forces and moments to the structural model, and then converts the deformed structure back onto the CFD mesh. This is an iterative process between the fluid and structural domains until the deformations converge. This iterative process is termed loose coupling and is applicable to cased where a periodic or steady state solution is sought. The process is demonstrated in Fig. 1. The converged flow solution for a rigid structure and its surface mesh is passed to Middleware. Middleware takes that flow solution and calculates the aerodynamic loads according to the structural model, e.g., the required MSC-NASTRAN force input will vary depending if a beam or 3D FE model is to be used. When this file is generated, MSC-NASTRAN is started and the deformation is calculated. For rotating blades the centrifugal effects are accounted for in the structural model. This is done using the MSC-NASTRAN RFORCE terms. After the structural deformation is calculated, Middleware post-processes the deformation and interpolates the deformation onto the CFD surface mesh. A set of grid points are generated on the aerodynamic surface of the blade. These points have a similar resolution to that of the finite element method (FEM) mesh. Each of these points is then connected to the nearest FEM grid point with a rigid bar element. This helps because it is easier to have a well-defined set of points that represent the deformed surface and can be used for the interpolation of the mesh deformation. When the FEM mesh deforms, the rigid bars also translate and rotate their corresponding mesh points to represent the deformed structural shape. Middleware then passes this deformed surface mesh back to HMB3 where the deformed volume mesh is calculated, and the CFD simulation continues with the now deformed mesh. This deformation causes a change in the aerodynamic loads, which is why it is an iterative process between fluid and structure through Middleware.
The mesh deformation procedure is the same for the static (middleware) and the dynamic aeroelastic method (modal method). This is discussed in section 2.3.2.
2.3.2 Dynamic aeroelasticity
The dynamic aeroelasticity method of HMB3 is based on the modal method [Reference Babu, Loupy, Dehaeze, Barakos and Taylor26]. This is used here for stalled flow cases with dynamic fluid-structure interaction. However, it could also be used for static cases. This is not done because it would require unnecessary expense over our Middleware method. The method uses structural modes and frequencies from a modal FE or beam solution, and projects the forces to the mode shapes. From this, deformations can be obtained for each of the structural modes. Like Middleware, the mesh deformation procedure is based on the inverse distance weighting interpolation and is described in section 2.3.4.
The same finite element model that is used for Middleware calculations is also used with the modal method. Here the NASTRAN model is used to obtain the structural mode shapes and frequencies. The structural model itself is a full FEM, it has interface connection between each of the parts, and the material properties are supplied to each part. For non-matching connections (termed ‘glue’ connections in MSC-NASTRAN), eigenmode result requirements and structural solver limitations, an implicit nonlinear solution method is used (SOL400). This solver allows loads to be applied, glue connections and an eigen analysis in a singular calculation. In our case, the load is centrifugal load and including this in the eigenmode calculation accounts for rotational stiffening. It is essential that the employed unit system matches that of the CFD simulation. This is because the mode shapes are mass scaled, and each displacement vector is divided by the generalised mass. The representative length of each of these vectors is crucial for the modal force calculation to be correct.
Before the CFD calculation begins, the CFD solver takes the supplied mode shapes and interpolates each of the eigenmodes onto the CFD mesh, this is conducted using the MLS method. The CSD to CFD mesh interpolation only needs to be done at the start of the simulation and then the interpolated eigenmode deformed shapes for the CFD mesh can be used throughout the rest of the simulation for every time step. Also, the transfer of the aerodynamic loads to the structure can be applied directly to these deformed CFD mesh shapes rather than requiring further interpolation.
2.3.3 Computation of modal loads and amplitudes
At each time step, the pressure $p$
of the CFD solution is integrated over the undeformed mesh points to compute the modal forces
$p$
of the CFD solution is integrated over the undeformed mesh points to compute the modal forces $f_m^s\left( t \right)$
on the blade (
$f_m^s\left( t \right)$
on the blade ( $s$
). This is done for each of the supplied mode shapes
$s$
). This is done for each of the supplied mode shapes $\phi _m^s\left( p \right)$
. The following holds:
$\phi _m^s\left( p \right)$
. The following holds:
 \begin{equation}f_m^s(t) = \mathop \sum \limits_{p = 1}^{{n_s}} {\bf{p}} ({p,t}).\phi _m^s (p),\end{equation}
where, ${n_s}$
is the number of CFD mesh points on the blade,
${n_s}$
is the number of CFD mesh points on the blade, ${\bf{p}}\left( {p,t} \right)$
describes the pressure at point
${\bf{p}}\left( {p,t} \right)$
describes the pressure at point ${\bf{p}}$
and
${\bf{p}}$
and $\phi _m^s\left( p \right)$
is the modal shape at point
$\phi _m^s\left( p \right)$
is the modal shape at point $p$
for the
$p$
for the ${m^{th}}$
mode of the blade (
${m^{th}}$
mode of the blade ( $s$
). To resolve the mode shape correctly, mode scaling is critical. The mode shapes are scaled in MSC-NASTRAN with a generalised mass (
$s$
). To resolve the mode shape correctly, mode scaling is critical. The mode shapes are scaled in MSC-NASTRAN with a generalised mass ( ${m_j}$
) of
${m_j}$
) of $1{\rm{\;\;}}kg$
. Therefore, the modal forces have units of
$1{\rm{\;\;}}kg$
. Therefore, the modal forces have units of $N/m.kg$
. The mode shapes are:
$N/m.kg$
. The mode shapes are:
 \begin{equation}{m_m} = {\eta _m}^T [{\bf{M}}]{\eta _m},\end{equation}
Here, ${\eta _m}$
is the mode shape of the
${\eta _m}$
is the mode shape of the ${m^{th}}$
mode, and
${m^{th}}$
mode, and ${\bf{M}}$
is the mass matrix [27]. The deformed shape is computed from:
${\bf{M}}$
is the mass matrix [27]. The deformed shape is computed from:
 \begin{equation}{\phi ^s} (t) = \phi _0^s + \mathop \sum \limits_{m = 1}^{n_m^s} \alpha _m^s (t)\phi _m^s,\end{equation}
as the sum of the rigid shape $\phi _0^s$
plus the sum of the modal amplitudes
$\phi _0^s$
plus the sum of the modal amplitudes $\alpha _m^s\left( t \right)$
multiplied by their corresponding mode shapes
$\alpha _m^s\left( t \right)$
multiplied by their corresponding mode shapes $\phi _m^s$
. The modal amplitudes are computed using:
$\phi _m^s$
. The modal amplitudes are computed using:
 \begin{equation}\frac{{{\partial ^2}\alpha _m^s}}{{\partial {t^2}}} + 2{\zeta _m}{\omega _m}\frac{{\partial \alpha _m^s}}{{\partial t}} + \omega _m^2\alpha _m^s = f_m^s (t).\end{equation}
Here, ${\zeta _m}$
is the structural damping coefficient,
${\zeta _m}$
is the structural damping coefficient, ${\omega _m}$
is the modal frequency and
${\omega _m}$
is the modal frequency and $f_m^s (t)$
is the modal forcing term of Equation (2).
$f_m^s (t)$
is the modal forcing term of Equation (2).
At the start of each calculation, a large damping coefficient is used, typically ${\zeta _m} = 0.3$
. The aim here is to get the blade to deform to an approximate averaged deformed position; this approximates the static aeroelastic deformation. The value needs to be sufficient enough to avoid a drastic instability and diverge during the early steps of the simulation. After that, the damping is reduced to
${\zeta _m} = 0.3$
. The aim here is to get the blade to deform to an approximate averaged deformed position; this approximates the static aeroelastic deformation. The value needs to be sufficient enough to avoid a drastic instability and diverge during the early steps of the simulation. After that, the damping is reduced to ${\zeta _m} = 0.01$
, which is based on previous studies [Reference Higgins2].
${\zeta _m} = 0.01$
, which is based on previous studies [Reference Higgins2].
The leap-frog method [Reference Rapaport28, Reference Beeman29] is used to solve Equation (5). To ensure stability of higher-order modes, each time step is solved with $N$
inner time steps of size
$N$
inner time steps of size ${\rm{\Delta }}{t_i} = {\rm{\Delta }}t/N$
(where
${\rm{\Delta }}{t_i} = {\rm{\Delta }}t/N$
(where $i$
is the counter to
$i$
is the counter to $N$
). The modal force at the time
$N$
). The modal force at the time ${t_i} = t + i{\rm{\Delta }}{t_i}$
is :
${t_i} = t + i{\rm{\Delta }}{t_i}$
is :
 \begin{equation}f_m^s ({t_i}) = f_m^s (t) + \frac{{i \left( {f_m^s ({t + {\rm{\Delta }}t}) - f_m^s (t)} \right)}}{N}\end{equation}
The m-th amplitude $\alpha _m^s$
is then assessed for inner time-step
$\alpha _m^s$
is then assessed for inner time-step ${t_{i + 1}}$
:
${t_{i + 1}}$
:
 \begin{equation}\left[ \alpha_{m}^{s} \right]_{{t_{i + 1}}} = \left[\alpha_{m}^{s} \right]_{{t_i}} + {\left[ {\frac{{\partial \alpha _m^s}}{{\partial {t_i}}}} \right]_{{t_i}}}{\rm{\Delta }}{t_i} + \frac{1}{2}{\left[ {\frac{{{\partial ^2}\alpha _m^s}}{{\partial t_i^2}}} \right]_{{t_i}}}{\rm{\Delta }}t_i^2\end{equation}
Then the time derivative of the amplitudes is then computed as:
 \begin{align}{{{\left[ {\frac{{{\partial ^2}\alpha _m^s}}{{\partial t_i^2}}} \right]}_{{t_{i + 1}}}}} {}& = {{\left[ {f_m^s} \right]}_{{t_i}}} - \omega _m^2{{[\alpha _m^s]}_{{t_i}}} - 2\zeta {\omega _m}{{\left[ {\frac{{\partial \alpha _m^s}}{{\partial {t_i}}}} \right]}_{{t_i}}}\nonumber \\ {{{\left[ {\frac{{\partial \alpha _m^s}}{{\partial {t_i}}}} \right]}_{{t_{i + 1}}}}} {} & = {{\left[ {\frac{{\partial \alpha _m^s}}{{\partial {t_i}}}} \right]}_{{t_i}}} + \frac{1}{2}\left( {{{\left[ {\frac{{{\partial ^2}\alpha _m^{}}}{{\partial t_i^2}}} \right]}_{{t_i}}} + {{\left[ {\frac{{{\partial ^2}\alpha _m^s}}{{\partial t_i^2}}} \right]}_{{t_{i + 1}}}}} \right){\rm{\Delta }}{t_i} \end{align}
This method has been summarised in Fig. 2.
Modal method process.

2.3.4 Deformation of the volume mesh
After the surface mesh is deformed with the moving least squares method (MLS), the volume mesh is then deformed to that surface with the inverse distance weighting (IDW) method [Reference Shepard30]. This method was incorporated into HMB3 directly. The IDW method interpolates values at an unknown point by taking the weighted average of a known set of neighbouring points. The weighting factor given to a known point is proportional to the inverse distance between the known and unknown points. Biava et al. [Reference Biava and Barakos31] have shown that even after mesh deformation, the mesh was still of high quality.
Given $N$
samples
$N$
samples ${{\bf{u}}_i} = u\left( {{{\bf{x}}_i}} \right)$
for
${{\bf{u}}_i} = u\left( {{{\bf{x}}_i}} \right)$
for $i = 1,2, \ldots ,N$
, the IDW interpolated value of the function
$i = 1,2, \ldots ,N$
, the IDW interpolated value of the function ${\bf{u}}$
at a point
${\bf{u}}$
at a point ${\bf{x}}$
is:
${\bf{x}}$
is:
 \begin{align}{\bf u}({\bf x}) = \left(\begin{array}{l@{\quad}l} {\dfrac{{\mathop \sum \limits_{i = 1}^N {w_i}({\bf x}){{\bf u}_{\bf i}}}}{{\mathop \sum \limits_{i = 1}^N {w_i}({\bf x})}},} {}& {\rm{if}}\ d({\bf x},{\bf x}_{\bf i}) \ne \boldsymbol{0}\ {\rm{for\ all}}\ {\bf i}\\[3pt] {{{\bf u}_{\bf i}},} & {}{{\rm{if}}\ d({{\bf x},{{\bf x}_{\bf i}}}) = \boldsymbol{0}\ {\rm{for\ some}}\ {\bf i}}\end{array} \right.,\end{align}
where
 \begin{equation}{w_i}({\bf x}) = {\boldsymbol{1} \over {{\bf d}{{({\bf x},{{\bf x}_{\bf i}})}^{\mathbb P}}}}\end{equation}
In these equations, $\mathbb{P}$
is the power parameter that can be any positive real number, and
$\mathbb{P}$
is the power parameter that can be any positive real number, and $d(({\bf x}), ({\bf y}))$
is the Euclidean distance between
$d(({\bf x}), ({\bf y}))$
is the Euclidean distance between $({\bf x})$
and
$({\bf x})$
and $({\bf y})$
.
$({\bf y})$
.
With larger meshes, the original form of the IDW method scales linearly and becomes more expensive. Therefore, Renka’s method [Reference Renka32] is a reduction of the formulation where a sphere is considered for each volumetric grid point of radius $\bf{R}$
and only considers
$\bf{R}$
and only considers $k$
nearest neighbours. This is shown in Fig. 3. The interpolation weights are:
$k$
nearest neighbours. This is shown in Fig. 3. The interpolation weights are:
 \begin{equation}{w_i}(\bf{x}) = {\left( \frac{{{\rm{max}}({\boldsymbol{0},\bf{R} - d({\bf{x},{\bf{x}_i}})} )}}{{\bf{Rd}( {\bf{x},\bf{x}_{i}} )}} \right)^2},\quad \bf{i} = \boldsymbol{1},\boldsymbol{2}, \ldots ,\bf{k}.\end{equation}
Illustration of the point selection process in order to compute the IDW weights.

The efficiency of this method depends on the efficiency of the spatial search of each of the spheres to find $k$
nearest points. For this, an alternating digital tree (ADT) structure is used. Alongside this, a blending function is used to help smooth the mesh deformations after the interpolation. This means that the interpolated displacement tends to zero as the distance from the surface approaches
$k$
nearest points. For this, an alternating digital tree (ADT) structure is used. Alongside this, a blending function is used to help smooth the mesh deformations after the interpolation. This means that the interpolated displacement tends to zero as the distance from the surface approaches $\bf{R}$
.
$\bf{R}$
.
2.4 CFD mesh
The CFD mesh utilises the Chimera method with bodyfitted, structured, multi-block mesh. For this, we have a background domain and a blade domain which can be observed in Figs 4a and 4(b)-(d) respectively. The background mesh has 11.5M cells, and the blade mesh has 6.6M cells, resulting in 18.1M cells in the overall mesh. For the blade mesh, the chimera boundary extends 0.5 local sectional chord lengths off surface, with a wall distance of ${10^{-5}}$
root chords. There is a centre-body in the background mesh, which is a perfect cylinder running the entire length of the domain and has a radius of 0.5 root chords. The inflow, outflow boundaries and the outer cylindrical surfaces (shown in green, pink and red in Fig. 4(a)) have far-field conditions.
${10^{-5}}$
root chords. There is a centre-body in the background mesh, which is a perfect cylinder running the entire length of the domain and has a radius of 0.5 root chords. The inflow, outflow boundaries and the outer cylindrical surfaces (shown in green, pink and red in Fig. 4(a)) have far-field conditions.
MENtOR background and blade CFD mesh.

2.5 The MENtOR propeller blade
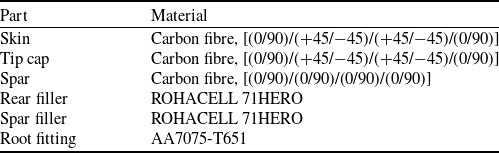
The MENtOR blade used for this project is of a similar design to an eVTOL tiltrotor blade. It uses three aerofoils: the NACA 64-128 at the root, the Vertol V23010_1.58 at 60%R and the Vertol V43015_2_48 at the blade tip. The twist and chord distribution can be seen in Fig. 5 (a). The blade is composed of six main parts: blade skin, tip cap, spar, rear filler, spar filler and the root fitting. The blade sections can be observed in Fig. 5(b), and the materials used are listed in Table 1. The propeller is composed of four blades, each with a radius of $625$
mm and a mass of
$625$
mm and a mass of $290.3$
g.
$290.3$
g.
MENtOR Blade, parts and materials

MENtOR background and blade CFD mesh.

2.6 Finite element models
The finite element model consists of 1.9M tetrahedral elements and is shown in Fig. 6. For static aeroelastic analyses, the linear static SOL101 solver of MSC-NASTRAN is used. The aerodynamic loads are precomputed and formatted for MSC-NASTRAN, and the centrifugal force is applied using the MSC-NASTRAN RFORCE command. For dynamic aeroelastic analyses, the implicit, nonlinear, SOL400 method is used. This allows for an eigenmode analysis using non-matching interfaces (also known as ‘glue’ boundaries) between mesh parts.
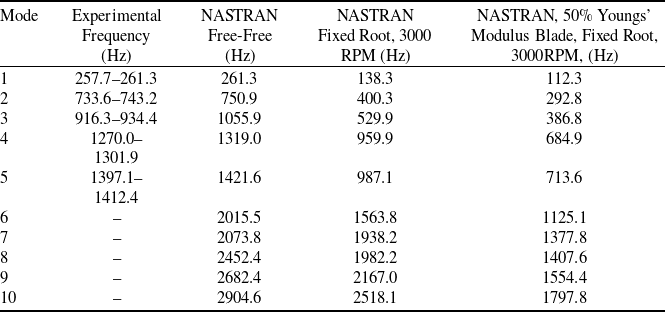
A physical tap test using free-free conditions was conducted by the Bristol Laboratory for Advanced Dynamic Engineering (BLADE), and was also replicated numerically. The frequency comparison can be seen in Table 2, and the mode shape comparison in Fig. 7. This validates the FE model, before simulating the blades on the propeller rig. The use of the centrifugal term in the eigenmode analysis accounts for the centrifugal stiffening for the combined CFD/CSD simulation.
Free-free structural frequency comparisons and numerical, fixed root, modal frequencies for the baseline blade and the softened blade

FEM mesh views.

Mode shape comparison between tap test and FEM, and fixed root, 3000RPM results.

Tap tests were conducted at Bristol University, as part of the MENtOR project [33].
3.0 Results and discussion
3.1 Static aeroelasticity
Computations with steady flow assumptions were first conducted, and the blade torque was compared with wind tunnel data. These are presented in Figs 8 and 9, for pitch angles, $16$
,
$16$
, $25.5$
and
$25.5$
and $35.7$
degrees at the 75% radial section,
$35.7$
degrees at the 75% radial section, $1080$
revolutions per minute and at advance ratios from
$1080$
revolutions per minute and at advance ratios from $0.08$
to
$0.08$
to $1.3$
. The advance ratios were restricted by what was achievable in the wind tunnel, between power limits and reversed blade thrust. Figure 8 compares the numerical thrust and torque to experimental values. It can be observed that the simulation resolved the torque quite well. The comparisons suffer at the lower advance ratio and high collective pitch due to the steady, periodic flow assumptions used for this analysis. It can be observed in that the numerical torque is slightly less than the experimental torque for all advance ratios. However, this is expected due to the numerical simulation only containing the blade with no spinner or rig present.
$1.3$
. The advance ratios were restricted by what was achievable in the wind tunnel, between power limits and reversed blade thrust. Figure 8 compares the numerical thrust and torque to experimental values. It can be observed that the simulation resolved the torque quite well. The comparisons suffer at the lower advance ratio and high collective pitch due to the steady, periodic flow assumptions used for this analysis. It can be observed in that the numerical torque is slightly less than the experimental torque for all advance ratios. However, this is expected due to the numerical simulation only containing the blade with no spinner or rig present.
Thrust obtained from simulations and comparison between estimated torque and recent wind tunnel experiments performed by Croke et al. [Reference Croke, Zagaglia, Woodgate, Green and Barakos12]. MENtOR blade, 1080RPM, pitch angles of 16, 25.5 and 35.7 degrees.

Static aeroelastic tip displacements. MENtOR blade, 1080RPM, pitch angles of 16, 25.5 and 35.7 degrees.

The displacements induced from the aerodynamic forces and moments are presented in Fig. 9. As expected, the tip quarter chord deformation plot follows the same trend as the loads. However, the lower advance ratio (stalled cases) suffered with the the steady flow assumption and require unsteady modelling. The results show how stiff the blades are, with the maximum recorded displacement approaching 2.4 mm, and the maximum change in pitch angle at the tip reaching −0.025 degrees. Here, negative results indicate pitch down deformations.
3.2 Dynamic aeroelasticity
Due to the limitations of the steady flow assumptions, the modal method was then used. These cases were for advance ratios of $0.3$
,
$0.3$
, $3000$
revolutions per minute and the pitch angles of
$3000$
revolutions per minute and the pitch angles of $32$
,
$32$
, $35.6$
(baseline blade and softer blade) and
$35.6$
(baseline blade and softer blade) and $40.0$
degrees at the 75% radial section. The flow around the blades can be seen in Fig. 10.
$40.0$
degrees at the 75% radial section. The flow around the blades can be seen in Fig. 10.
Instantaneous view of the flow around the MENtOR blade, 3000 RPM, advance ratio J=0.3, pitch angles of 35.6 degrees at 75%R, time-marching simulation.

The modal amplitudes can be observed in Fig. 11; the largest deformations were associated with the first mode, which is the first bending mode. This was expected as it had the lowest frequency, and the modal force projection varied by a small factor. The mode shape for the first bending mode bends against the thrust direction, hence the amplitude is negative. This is the main contribution towards the aeroelastic coning of the blade. It can be clearly observed that the softer blade cones twice as much than the baseline blade. This increase was expected given the lower eigen-frequencies of the softer blade. Mode 2 displacements are approximately the same for all cases. For the baseline blade, the oscillations grow as the flow becomes more stalled. The oscillations are significantly larger for the softer blade as expected. Mode 4 is the first torsional mode. Three pitch angles for the baseline blades show that the modal amplitudes operate within a band and are of small magnitude. The softer blade results show increasing amplitude, indicating torsional divergence of this mode. We see similar results for mode 5 (second torsional mode) for the baseline blades and larger modal amplitudes of the softer blade, but these do not diverge like mode 4. Due to the stalled nature of these flows, the amplitudes are aperiodic for most modes. However, it can be observed that the fluctuations are larger as the pitch angle increases. The higher order modes were found to have a very small contribution to the computed deformed shape.
Time history of modal amplitudes. MENtOR blade, 3000 RPM.

Similar observations can be made for the modal forces. The unsteadiness of the flow is evident from the fluctuations of the forces. As the blade pitch angle increases, the fluctuations also increase and the deformations also tend to increase. The softer blade and the baseline blade, at 35.6 degrees pitch, have projected forces of similar magnitudes and fluctuations. Overall, each mode is aperiodic, and there is also some frequency beating, particularly in the ${5^{th}}$
mode. This is shown in Fig. 11(d), where the baseline blade repeatedly shows quiescent periods, followed by larger amplitude activity.
${5^{th}}$
mode. This is shown in Fig. 11(d), where the baseline blade repeatedly shows quiescent periods, followed by larger amplitude activity.
Frequency content of modal amplitudes for the MENtOR blade. Black dashed lines are the BPF and their harmonics, orange dashed lines are the eigen-modes and their harmonics, 3000 RPM, advance ratio J=0.3, pitch angles of 32, 35.6 and 40 degrees at 75%R.

3.3 Frequency analyses
To observe the frequencies of the modal deformations and forces, Fourier transforms were conducted. Firstly, the mean values are removed from each of the signals. The signals were also processed using a Hanning [Reference Essenwanger34] windowing method, and zero damping was applied before the Fourier transform was computed. The spectra of the baseline blades can be seen in Figs 12 and 13 for the modal amplitudes and forces, respectively. The black dashed lines indicate the blade passing frequency and its harmonics. The orange dashed lines indicate the modal frequencies and their harmonics for the 3000 RPM fixed root case. For attached flows, peaks would only occur on the blade passing frequency or on structural modes and their harmonics. Also, there would be minimal broadband content in the signals. Figure 12 shows that the largest amplitudes tend to occur at the frequency for the given structural mode. However, there is significant non-harmonic and broadband content that grows in amplitude as the pitch angle is increased. This increase in broadband amplitude is attributed to the stalled flow and can be observed in the structural deformation. In Fig. 13, it is observed that there are more non-harmonic features, which grow in amplitude as the pitch angle increases. The modal amplitudes and forces for the blade can be found in Figs 14 and 15, respectively. Comparing the modal amplitudes, it is observed that the modal amplitudes are much larger on softer the than that of the baseline blades. This is expected because the modal frequencies of the softer blade are reduced and at the same time a similar forcing will lead to larger deformations. Again, the largest amplitudes occur at the modal frequency for each of the modes, and typically are singular sharp peaks. However, for mode 4, a number of large amplitude, non-harmonic frequencies as well as a strong amplitude on the blade passing frequency are observed, unlike the other modes. Figure 15, shows more harmonic content and non-harmonic content where more of the peaks occur on the blade passing frequency or the structural mode and their harmonics.
Frequency content of modal forces for the MENtOR blade. Black dashed lines are the BPF and their harmonics, orange dashed lines are the eigen-modes and their harmonics, 3000 RPM, advance ratio J=0.3, pitch angles of 32, 35.6 and 40 degrees at 75%R.

Frequency content of modal amplitudes for the softened MENtOR blade. Black dashed lines are the BPF and their harmonics, orange dashed lines are the eigen-modes and their harmonics, 3000 RPM, advance ratio J=0.3, pitch angle of 35.6 degrees at 75%R.

Frequency content of modal forces for the softened MENtOR blade. Black dashed lines are the BPF and their harmonics, orange dashed lines are the eigen-modes and their harmonics, 3000 RPM, advance ratio J=0.3, pitch angle of 35.6 degrees at 75%R.

Figure 16(a and b) presents the deformations for the blade tip, as absolute quarter-chord point displacements and as changes in the local pitch angle for the baseline blades. The quarter-chord is displaced by $8.5$
mm,
$8.5$
mm, $8.7$
mm and
$8.7$
mm and $9.0$
mm for the
$9.0$
mm for the $32$
,
$32$
, $35.6$
and
$35.6$
and $40.0$
degree cases, respectively. The minimum to maximum deviations are around
$40.0$
degree cases, respectively. The minimum to maximum deviations are around $1mm$
for the
$1mm$
for the $32.0$
and
$32.0$
and $35.6$
cases and
$35.6$
cases and $1.5$
mm for the
$1.5$
mm for the $40.0$
degree case. The local changes in pitch angle suggest that the propeller deforms dynamically at very high frequencies, but at small magnitudes of
$40.0$
degree case. The local changes in pitch angle suggest that the propeller deforms dynamically at very high frequencies, but at small magnitudes of $0.05$
degrees on average. This small change in pitch angle is not enough for the blade to diverge, and the oscillations are bounded. In Figs 16(c and d) results are shown for the
$0.05$
degrees on average. This small change in pitch angle is not enough for the blade to diverge, and the oscillations are bounded. In Figs 16(c and d) results are shown for the $35.6$
degree case with the softer blade. The average displacement magnitude for the quarter chord point on the tip is near
$35.6$
degree case with the softer blade. The average displacement magnitude for the quarter chord point on the tip is near $13.5$
mm with fluctuations of
$13.5$
mm with fluctuations of $2$
mm. The local pitch angle, however, continues to increase over time, showing fluctuations of
$2$
mm. The local pitch angle, however, continues to increase over time, showing fluctuations of $3.0$
degrees and growing. All of these cases demonstrate stall flutter where the unsteady stalled loads induce fluctuations in the structural deformation. One thing to consider is that as the deformations grow, it becomes more challenging to generate high quality grids as the cell skewness can deteriorate with more deformation.
$3.0$
degrees and growing. All of these cases demonstrate stall flutter where the unsteady stalled loads induce fluctuations in the structural deformation. One thing to consider is that as the deformations grow, it becomes more challenging to generate high quality grids as the cell skewness can deteriorate with more deformation.
Tip deflections and twist for the MENtOR blade, 3000 RPM, advance ratio J=0.3, pitch angles of 32, 35.6 (baseline and softened blade) and 40.0 degrees at 75%R.

3.4 Analyses of flow probes
To investigate the non-harmonic flow content of the stalled flow and its relationship to the structure, a grid of probes were placed in the flow domain. These probes can extract all flow quantities. However, in this case we used the pressure. The probes were positioned as shown in Fig. 17. They were equally spaced and numbered with grid indexing as: ( $i{\rm{\;\;}} + {\rm{\;\;}}nx{\rm{\;\;}} \times j{\rm{\;\;}} + {\rm{\;\;}}ny{\rm{\;\;}} \times nx{\rm{\;\;}} \times k)$
. The probe positions are considered with respect to the locations of the anti-nodes. The first bending mode peaks near probe 32, as shown in Fig. 17(a). The probe is also away from the tip vortex. Comparisons are shown for the softer blade as the larger deformations make it easier to find the frequencies in the probes. The comparison of modal amplitude for the first mode and the frequency content of pressure at probe 32 is shown in Fig. 18. The first non-harmonic frequency, around 20Hz, is seen in both the probe signal and in the modal amplitude of mode 1. The first BPF is also matched for both probe and modal amplitude. However, there were frequencies in the probe signal that were not found in the modal amplitude of the first mode.
$i{\rm{\;\;}} + {\rm{\;\;}}nx{\rm{\;\;}} \times j{\rm{\;\;}} + {\rm{\;\;}}ny{\rm{\;\;}} \times nx{\rm{\;\;}} \times k)$
. The probe positions are considered with respect to the locations of the anti-nodes. The first bending mode peaks near probe 32, as shown in Fig. 17(a). The probe is also away from the tip vortex. Comparisons are shown for the softer blade as the larger deformations make it easier to find the frequencies in the probes. The comparison of modal amplitude for the first mode and the frequency content of pressure at probe 32 is shown in Fig. 18. The first non-harmonic frequency, around 20Hz, is seen in both the probe signal and in the modal amplitude of mode 1. The first BPF is also matched for both probe and modal amplitude. However, there were frequencies in the probe signal that were not found in the modal amplitude of the first mode.
Probe numbering scheme and probes 19 and 32 with respect to first five mode shapes of the blade.

Comparison of the frequencies and peak amplitudes of mode 1 with scaled pressure data of probes 19 and 32, softer blade, 35.6 degrees.

Probe positions and visualisation of the first five mode shapes of the blade. Magenta ellipses show examples of regions with grouped anti-nodes.

Comparison of the frequencies and peak amplitudes of modes 3 and 5 with scaled pressure data of probes 19 and 32, 35.6 degree, baseline blade.

For this, we need to consider other modes, as identified and shown in Fig. 19. Modes 3, 4 and 5 have large mode shape deformations near the same location. The comparison is shown in Fig. 20. In these modes, the frequencies for the harmonic and non-harmonic features are matched. This suggests that the non-harmonic features are driving the deformation of the blade structure. To further explore this, Probe 19, also shown in Fig. 17 was considered. This probe is below and behind the blade which places it into a more turbulent region of the flow. In Figs 18 and 20, it can be observed that there is more broadband content due to the growth of turbulence in that region. However, the major harmonic and non-harmonic content in the flow is clearly present. Comparing probe 19 with probe 32 larger modal amplitudes in probe 19 are seen in the torsional content. However, not all of mode 1, non-harmonic peaks are found in probe 19, compared to probe 32. This is due to where the probes are located, regarding proximity with the anti-nodes of the mode shapes. For a given mode shape, if a probe is located in an area where there are large modal deformations then it is expected that that frequencies of that modal amplitude will have similar frequency content to the probe. The opposite of which is also true. However, there are regions where multiple modes show large deformations, in these cases the pressure probes contain the frequencies of several modes, and the deformations receives inputs from several modes amplitude will primarily reflect the frequency of its respective mode. In Fig. 19, the magenta ellipses show some regions where the modal deformations are overlapped across multiple modes.
4.0 Conclusions and future work
This paper presented results for numerical simulation of propeller fluid/structure interactions, pertinent to stall flutter. An in-house Navier-Stokes method was used and the structural representation of the blades was via 3D FE models. The models were used for extracting the normal modes of the blades, and modal-based time-marching simulations were conducted. A small number of quasi-steady simulations were also performed to allow for comparisons with available experimental data, at pre-stall conditions, where the flow is steady.
For the investigated cases and propellers, the simulation results provided good estimates for the necessary power. Given the uncertainties in experiments and CFD simulations, the agreement was seen as adequate and provided confidence in the obtained results for the deformations and vibrations of the blades. The main set of results was for stalled cases, simulated using dynamic fluid/structure interaction. The results showed that the stalled flow resulted in increased vibration of the blades compared to attached flow cases. As stall progressed, larger amplitudes of oscillations in bending and torsion with a beating effect were seen on the results. This is due to the nature of the stalled flow with periods of re-attaching and periods of vortex shedding. Softening the blade structure provided larger deformations, and the blade was diverging in torsion. The rest of the cases showed bounded oscillations, indicative of onset of stall flutter. Unfortunately the flutter conditions were outside the range of safe operation of the wind tunnel used for providing the validation data of section 2.3.1.
The stall flutter phenomenon was driven by the flow as the probe analyses showed. Interestingly, probes close to anti-nodes for different modes showed significant non-harmonic unsteady content. Again, this is expected in stall flutter. The frequencies correspond to the structural modes. However the amplitude depends on the forcing generated by the unsteady flow.
The current research highlights the potential of modern CFD and fluid/structure interaction methods and sets requirements for future investigations and experiments. These include the measurement of time-resolved velocities in the flow and their correlation with on-blade time-resolved strain gauges. Pressure measurements on the blade are also highly desirable. This research is now directed towards analysing different blade designs made to stall at milder flow conditions in order to make tests easier and provide more data for validation.
Acknowledgments
The support of DOWTY propellers via the NESPA project is gratefully appreciated.


 Open access