


Introduction
Geothermal energy is relatively new to the Netherlands. The first successful deep geothermal doublet was drilled in 2006. After this well, 22 more doublets were drilled (Ministry of Economic Affairs and Climate Policy, 2018), most of which are currently in operation, or are being prepared for production. In 2017, 3.4 PJ of geothermal heat was produced (Ministry of Economic Affairs and Climate Policy, 2018), mostly on an individual basis and managed by greenhouse owners. The doublet systems have been primarily developed in clastic reservoirs in areas for which a good reservoir quality, capable of supporting high flow rates, had been prognosed pre-drilling, based on a wealth of existing oil and gas data (Pluymaekers et al., Reference Pluymaekers, Kramers, Van Wees, Kronimus, Nelskamp, Boxem and Bonté2012; van Wees et al., Reference Van Wees, Pluymaekers, Van Wees, Van Gessel, Veldkamp and Bertani2017; Figs 1 and 2). Thanks to these subsurface data, including thousands of 2- to 6-km deep exploration and production wells, 2D and 3D seismic lines and hundreds of thousands of core plug measurements, the success rate – or probability of success (POS) – of the drilling of the past doublet systems has been exceptionally good, in excess of 90%.
Hydrocarbon exploration data available in the Netherlands, including c. 3000 wells onshore (blue), 2D and 3D seismic lines, log data and core data from wells.

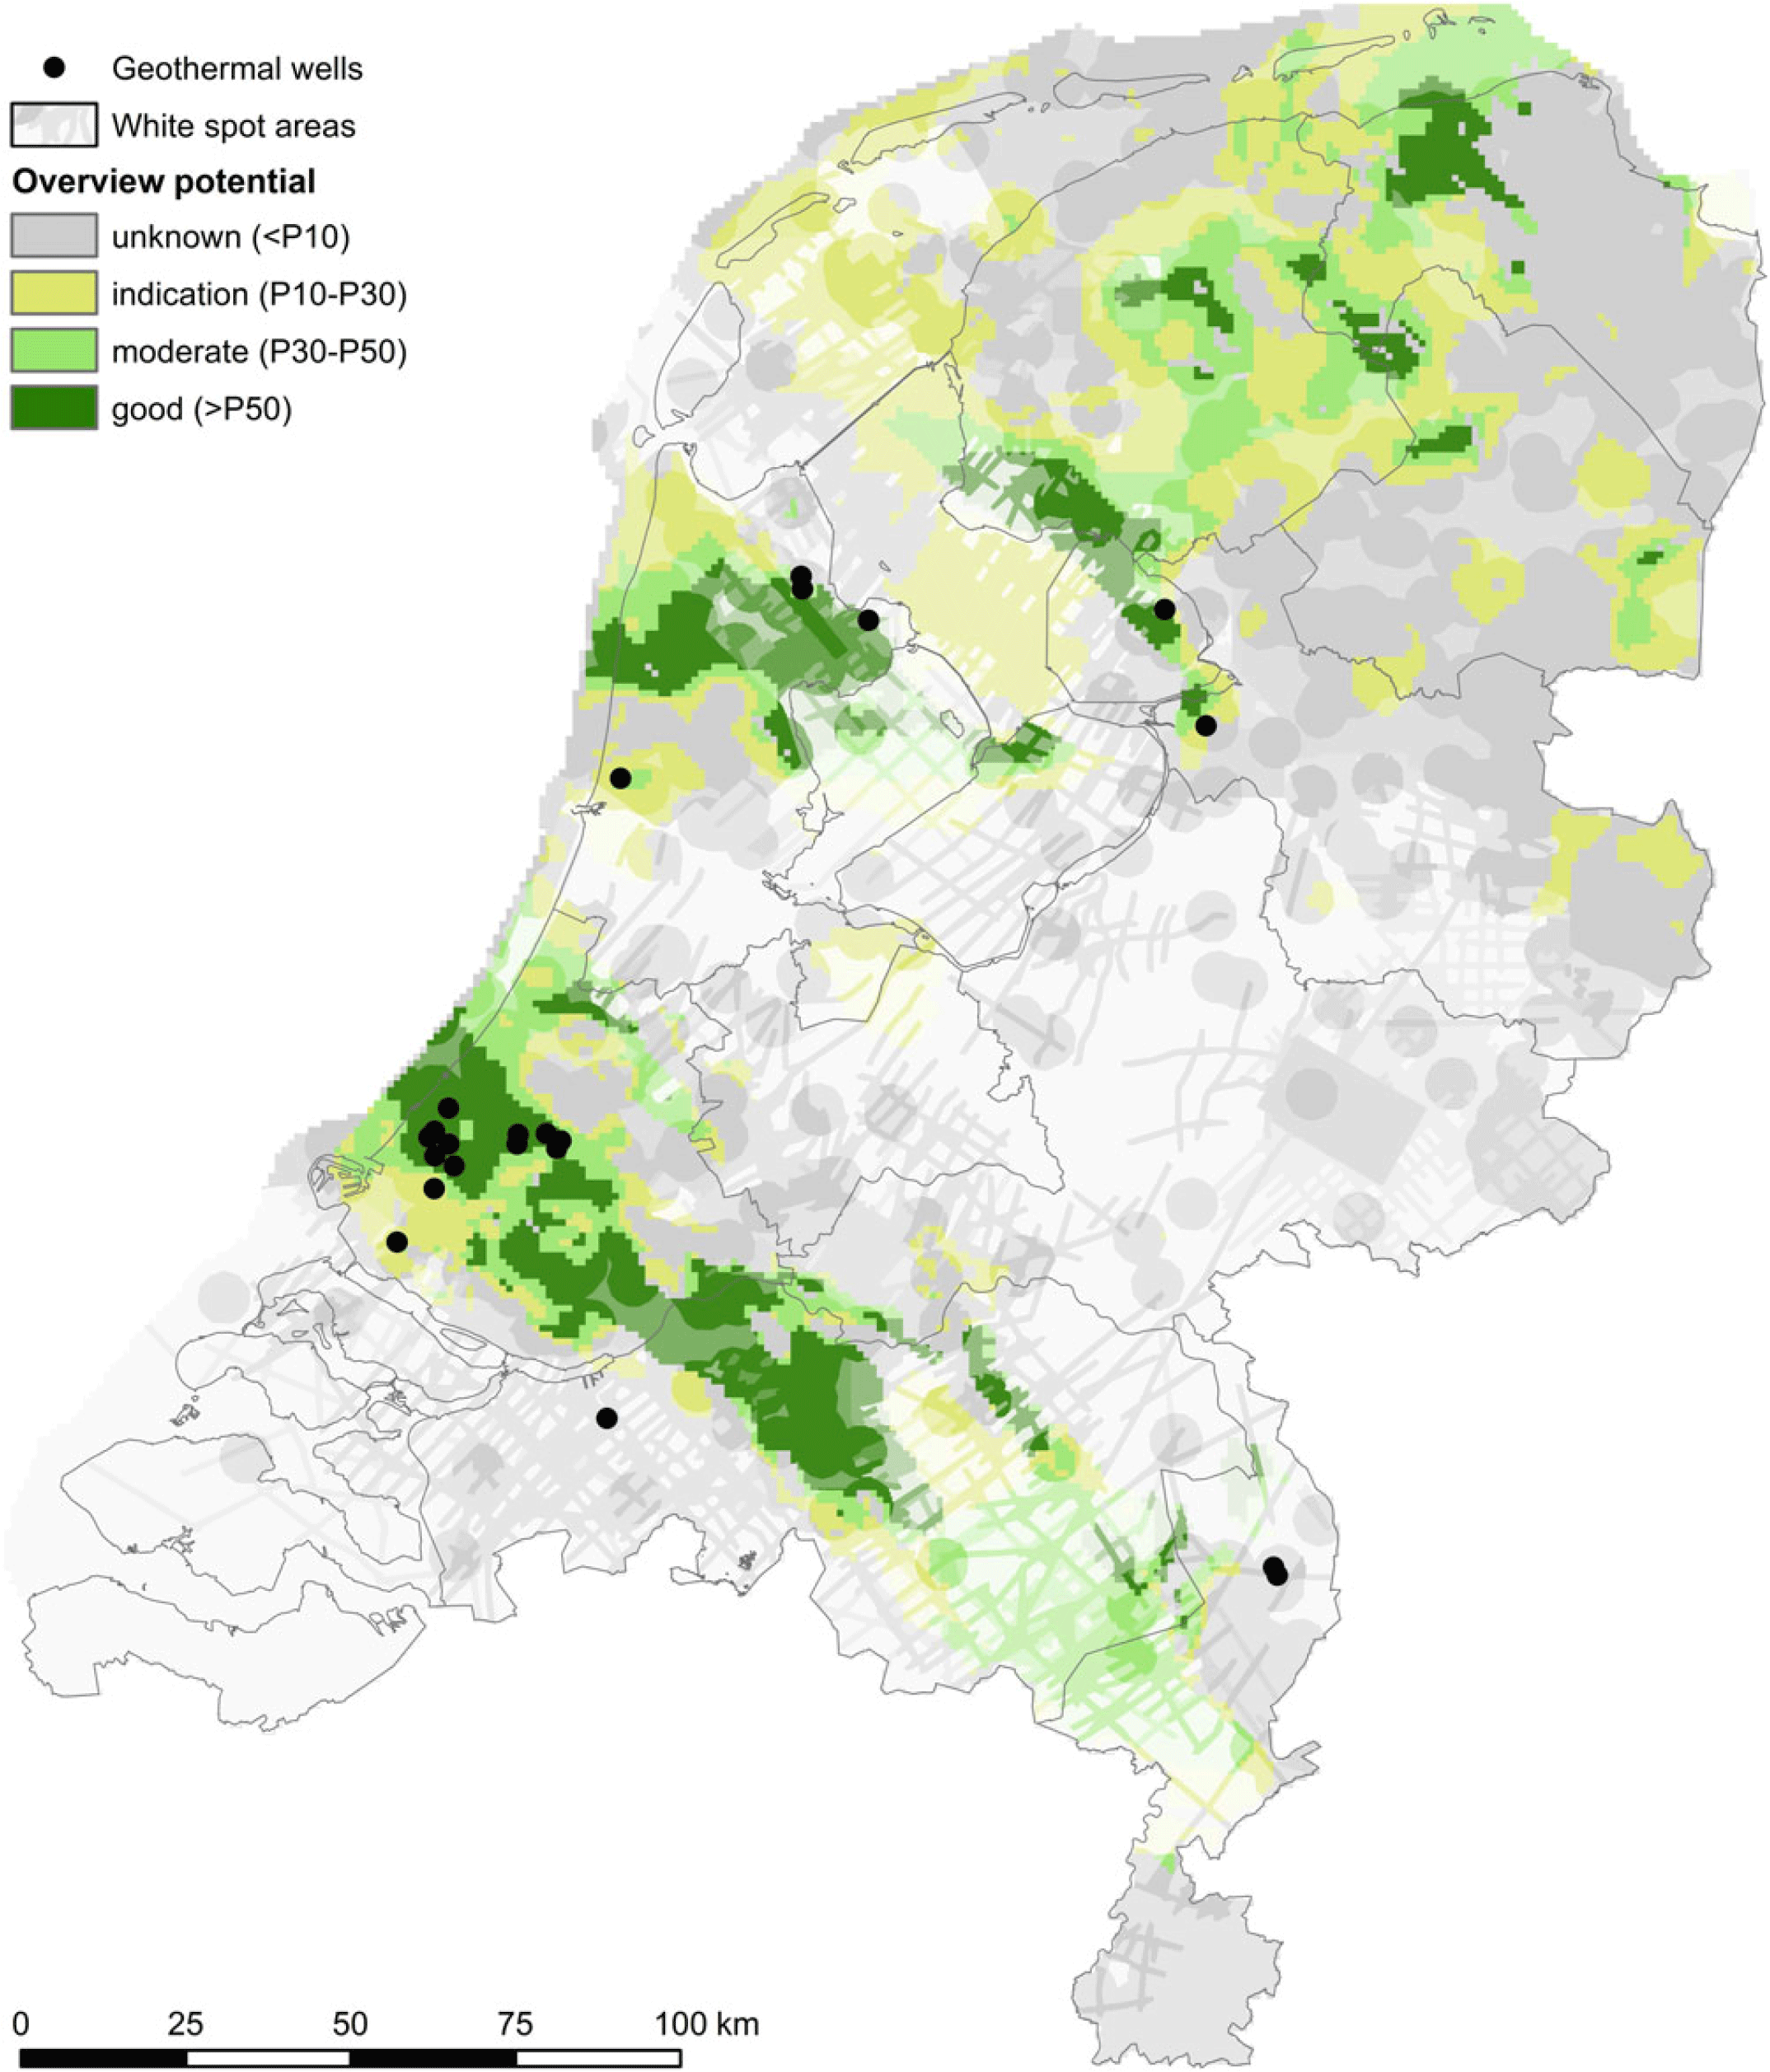
Existing doublet systems in the Netherlands, and initial probability of economically feasible doublet systems based on Monte Carlo modelling of doublet performance for variability in reservoir permeability and thickness (from thermogis.nl). Only well-studied ’conventional’ clastic reservoirs of c.1.5–4 km depth are included in this compilation. The overlain transparency is used to indicate the data density for construction of the maps. For details of construction of the maps see Van Wees et al. (Reference Van Wees, Pluymaekers, Van Wees, Van Gessel, Veldkamp and Bertani2017), Vrijlandt et al. (Reference Vrijlandt, Struijk, Brunner, Veldkamp, Witmans, Maljers and Van Wees2019) and the technical documentation on thermogis.nl.
The first successful doublets caused a boom of almost 100 geothermal exploration licences in 2010 (Kramers et al., Reference Kramers, Van Wees, Pluymaekers, Kronimus and Boxem2012), covering large areas of the Netherlands (www.nlog.nl/en/geothermal-licencing). If a successful doublet had been drilled in each of these licences, this would have resulted in 20 PJ yearly geothermal energy production (based on c.0.2 PJ for a typical doublet heat production of 10MWth with 5500 load hours), mostly to cater for greenhouse heat demand. In reality, though, very few doublets have been drilled to date because of the uncertainty of the resource quality, and the investments needed to reduce the uncertainty and to be able at the final stage of exploration to drill doublet wells with low financial risk compared to expected revenues. In the exploration process, re-evaluation of early optimistic prognoses of reservoir quality often results in a negative evaluation of the business case.
Quantitative maturation of individual prospects and optimal decision-making for portfolios of prospects have been extensively studied in the hydrocarbon industry (Begg et al., Reference Begg, Bratvold and Campbell2002) and have also been adopted for geothermal exploration (Frick et al., Reference Frick, Van Wees, Kaltschmitt, Schröder, Huenges and Ledru2010; Batini & Van Wees, Reference Batini and Van Wees2011; Trainor et al., Reference Trainor, Michael Hoversten, Ramirez, Roberts, Juliusson, Key and Mellors2014; Van Wees et al., Reference Van Wees, Kramers, Mijnlieff, De Jong and Scheffers2015). A particularly strong and simple concept to understand the maturation funnels is through decision trees including the quantification of risk and reward (Van Wees et al., Reference Van Wees, Bonté, Bertani and Genter2010). Fig. 3 shows a synthetic example of a decision tree for the staged exploration process of geothermal energy in the Netherlands with two decisions: at the first stage a decision to file for an exploration licence and to do an extensive feasibility study to analyse and prepare the financial investment decision to drill the wells for proof of a good reservoir and to use the wells as doublet system. The essence of the tree is to show that the criterion for progressing with exploration at the decision toll gates is given by the criterion to have the perspective of a positive reward. Reward is defined as the Expected Monetary Value (EMV) or Net Present Value (NPV) taking into account both success and failure outcomes:
 $${\rm{NPV = NP}}{{\rm{V}}_{{\rm{success}}}}{\rm{\;*\; POS - risk}}$$
where NPVsuccess is the expected present value of cash flow of a successful doublet and POS the probability of success (cf. Van Wees et al., Reference Van Wees, Kronimus, Van Putten, Pluymaekers, Mijnlieff, Van Hooff, Obdam and Kramers2012). Risk is defined as the expected losses (1 − POS) * AEC, where AEC is abortive exploration costs. If the POS is dependent only on subsurface conditions, the positive branches should equal the original POS. If the decision to file for an exploration licence is based on a lower POS (e.g. 50%) and the doublet drilling phase requires a POS of close to 100% (e.g. 90% for ensuring the well cost in case of a non-productive reservoir), this results inevitably in discarding the majority of prospects for realisation. This is shown in the simple tree in Fig. 3. We have put the NPVsuccess to €1M and assumed an initial POS of 50%. During the exploration funnel, AEC increase over time; in the tree in Fig. 3, these costs of the first-phase pre-drill feasibility study have been set to €200k. This phase serves to demonstrate a productive reservoir with the POS increasing from 50% to at least 90%. The latter is required at the drilling stage to qualify for a guarantee fund which refunds the wells if they fail to demonstrate a productive reservoir. Consequently, the AEC after the drilling decision have been set to a relatively low value of €400k. The tree shows that for an initial POS of 50% there is a positive reward outlook to file an exploration licence, but also that only a small fraction of around 20% of projects would be able to proceed to the drilling phase. Intrinsically as the filing of an exploration licence and feasibility study bears cost, most of the licences show a geographical correlation with areas where, based on existing data, reservoir potential has been identified.
Simplified decision tree for the exploration funnel of a geothermal doublet development in a stand-alone project, marked by an initial POS of 50%. In the tree, time flows from left to right and squares and circles denote decision and event nodes, respectively. The vertical lines mark decision toll gates, and corresponding options are represented by branches flowing from the decision nodes (the preferred branch is coloured red). Branches flowing from the event nodes mark distinctive possible outcomes beyond control. NPV is determined by weighting the outcomes of the end nodes (triangles) by the probability of the event branches and is rolled back from right to left.

The exploration funnel has large implications for the prognosis of future exploitation of geothermal energy and associated resource potential estimates. Past geothermal potential estimates of the Netherlands have been based on expected and optimistic P50 (initial POS = 50%) and P30 (initial POS = 30%) estimates for reservoir quality of the clastic reservoirs ignoring the exploration funnel (Van Wees et al., Reference Van Wees, Kronimus, Van Putten, Pluymaekers, Mijnlieff, Van Hooff, Obdam and Kramers2012), resulting in respectively 225 to 630 PJ which could be economically developed for built environment and greenhouse heating, for the next 100 years (Kramers et al., Reference Kramers, Van Wees, Pluymaekers, Kronimus and Boxem2012; van Wees et al., Reference Van Wees, Pluymaekers, Van Wees, Van Gessel, Veldkamp and Bertani2017). These numbers have been used in various policy documents in the past five years, arguing that geothermal energy can supply a significant portion of the low-temperature heat demand of about 700 PJ lower than 100°C (PBL, 2017). The recent ‘Masterplan Geothermal Energy’ (Stichting Platform Geothermie et al., 2018) aims at a production of 50 PJ in 2030 and 200 PJ in 2050. In 2030 and 2050, 40% and over 65% is anticipated to be connected to heat networks and the remainder mostly for greenhouse heating. Action plans that have been defined are currently being implemented and will create the circumstances required for the realisation of this ambition. The following key questions emerge in view of the ambitious plans for the development of geothermal energy:
The exploration funnel would result in a significantly lower potential than can be inferred from expected and optimistic reservoir quality estimates as presented in Fig. 2. As we assume that only doublets with POS = 90% will be drilled, how realistic is the claim of the Masterplan? Can its targets be reached at costs which are lower than or equal to present costs?
The past potential estimates did not consider the geographical match with heat demand (Fig. 4). Without heat demand, production will not materialise as heat cannot be efficiently transported over long distances.
Fig. 4.Low-temperature heat demand (T < 100°C) for greenhouse heating, district heating and industrial heat demand. Sources: existing heat networks (RVO WarmteAtlas). Low-temperature industrial heat demand (RVO WarmteAtlas), in TJ a−1; Greenhouses (Kadaster Top10Vector). One 10 MWth doublet, with 6000 load hours produces c.0.2 PJ a−1. This is assumed to be able to provide heat for 20 ha of greenhouse (0.5 MWth ha−1) or heat for 6000 houses (35 GJ a−1/house, comparable to the 36 GJ given by Eneco et al., 2017).


The Masterplan requires hundreds of doublet systems in the coming decades. This is a major challenge, in particular in light of the exploration funnel, requiring a multitude of explorative efforts (Fig. 3). How can this be organised effectively? Developments should be safe and reliable yet keep exploitation affordable. The Masterplanʼs ambitions are best served by a play-based portfolio approach for geothermal exploration in the Netherlands, similar to the one applied in the oil and gas industry. The basis is a subsurface play-based approach, which enables strong geological risk reduction by deploying the value of information (VoI) for the portfolio of the play, trading off with the risk of the first wells.
This paper presents the theory and demonstrates the benefits of the play-based portfolio approach for clastic reservoirs in the Netherlands. To this end, the paper is structured as follows:
First, we introduce the main geothermal (clastic) play systems of the Netherlands.
Subsequently, we introduce the portfolio-based exploration approach versus the ‘stand-alone’ approach (project by project). With decision trees, we demonstrate that the portfolio approach results in geological risk reduction and cost reduction.
Next, we analyse the effect of exploration on the portfolio approach for areas with a large focused heat demand and matching geothermal potential. We demonstrate that the objectives for geothermal development from the Masterplan can be met, at much lower cost than from a stand-alone approach. We also outline that the collective play-based portfolio approach has several other key advantages which address the aforementioned challenges. In particular, the approach promotes a general technological learning curve, capable of lowering development costs, adding to safety and reliability, and also facilitating innovation.
Finally, we highlight an example out of the Utrecht area where the play-based portfolio derisking and VoI are being estimated upfront for various stages of geothermal exploration.
Geothermal plays in the Netherlands
The Dutch subsurface is heterogeneous and displays a complex variability in its sedimentary composition (Wong et al., Reference Wong, Batjes and de Jager2007; Kombrink et al., Reference Kombrink, Leever, Van Wees, Van Bergen, David and Wong2008, Reference Kombrink, Doornenbal, Duin, Den Dulk, ten Veen and Witmans2012). Nationwide maps (depth, thickness) have been made for the main geothermal reservoirs, including associated properties such as temperature and permeability (Pluymaekers et al., Reference Pluymaekers, Kramers, Van Wees, Kronimus, Nelskamp, Boxem and Bonté2012; van Wees et al., Reference Van Wees, Pluymaekers, Van Wees, Van Gessel, Veldkamp and Bertani2017; Vrijlandt et al., Reference Vrijlandt, Struijk, Brunner, Veldkamp, Witmans, Maljers and Van Wees2019).
Following www.thermogis.nl (Kramers et al., Reference Kramers, Van Wees, Pluymaekers, Kronimus and Boxem2012; Vrijlandt et al., Reference Vrijlandt, Struijk, Brunner, Veldkamp, Witmans, Maljers and Van Wees2019), the relatively homogeneous, porous and permeable units that are currently considered as potential geothermal plays are the following (from young to old) (Fig. 5):
1. Tertiary (North Sea Supergroup)
2. Cretaceous (Rijnland Group / Vlieland Formation)
3. Jurassic (Schieland Group / Nieuwerkerk Formation)
4. Triassic (Main Buntsandstein Subgroup / Detfurth, Hardegsen, Volpriehausen Formations)
5. Permian (Upper Rotliegend Group / Slochteren Formation)
6. Carboniferous (Carboniferous Limestone Group / Zeeland Formation)
Cross-section through the Netherlands showing the main geological units. Source: Digital Geological Model v5, www.nlog.nl

Depth, facies and burial history largely determine the geothermal potential. In our approach, a geothermal play is therefore defined as geothermal potential based on the presence of water in a formation with comparable geological characteristics.
With the exception of the Dinantian Carbonates of the Zeeland Formation, all units comprise sandstones with primary porosity and permeability. Detailed descriptions can be found online in the Dutch Stratigraphic Nomenclator at www.dinoloket.nl. Fig. 5 schematically shows the variation in presence, depth and thickness of the main stratigraphic groups. Most units occur under large parts of the Netherlands, but their depth (and thus temperature), thickness and permeability greatly vary.
Depth is critical as it is strongly correlated to production temperature. Transmissivity (the product of thickness and permeability) is a key performance indicator for successful geothermal exploration, since it is linearly proportional to the achievable flow rate in the aquifer.
Selected plays and subplay regions
In this paper, we focus on the Cretaceous to Permian plays. These plays have been extensively targeted by hydrocarbon studies and drilling in the past 50 years. Most existing doublet systems are developed in these plays. Fig. 6 presents initial POS maps from ThermoGIS for explorative development for each of the plays, based on regional aquifer characterisation and a techno-economic evaluation of the expectation curve of power production (Vrijlandt et al., Reference Vrijlandt, Struijk, Brunner, Veldkamp, Witmans, Maljers and Van Wees2019), and taking into account stacking of geothermal aquifers if this is beneficial to POS.
Initial probability of economically feasible doublet system based on Monte Carlo modelling of doublet performance for variability in reservoir permeability and thickness (cf. thermogis.nl, Vrijlandt et al., Reference Vrijlandt, Struijk, Brunner, Veldkamp, Witmans, Maljers and Van Wees2019) for stacked reservoirs in the four plays studied in this paper and underlying Fig. 1: (A) Cretaceous (Rijnland Group / Vlieland Formation), (B) Jurassic (Schieland Group / Nieuwerkerk Formation), (C) Triassic (Main Buntsandstein Subgroup / Detfurth, Hardegsen, Volpriehausen formations), (D) Permian (Upper Rotliegend Group / Slochteren Formation).

When the distribution of prospective potential geothermal source with POS > 30% (Fig. 6) is overlain by a map of areas with sufficiently large and concentrated heat demand (Fig. 4), the total considered heat demand of 424 PJ is reduced to 151 PJ in 14 subplay regions (Fig. 7). In these 14 subplay areas, we expect the play-based portfolio approach to be beneficial due to shared subsurface geological conditions. The associated targeted plays for each region and quantitative assessment of low-temperature heat demand, which can be potentially fed with geothermal sources, are presented in Table 1. The Cretaceous and Jurassic Play systems have not been differentiated in the table as they are in the southwestern part of the Netherlands jointly considered in exploration.
The heat demand, overlain with red polygons outlining subplay regions which are considered in a play-based portfolio development perspective for quantitative assessment of resource potential matching heat demand and subsurface-supply-based P>30% in Fig. 6.

Heat demand in portfolio regions and allocated plays

In the selection of the subplay regions, some areas with subsurface potential have been excluded as significant heat demand is currently lacking. This applies, for example, to the island of Vlieland and the area at the border of the provinces Groningen and Drenthe for the Cretaceous plays, significant parts of the province of Noord Brabant for the Jurassic play and some parts of the Rotliegend play. On the other hand, there are a number of regions with significant heat demand and existing heat networks, including, for example, Utrecht or Nijmegen, which cannot be matched to prospective geothermal potential available in the selected plays based on POS > 30% in ThermoGIS. Please note that potential in the selected plays may be overlooked in the POS maps due to a low data density (Fig 2). This is, for example, the case in the Utrecht area where the ThermoGIS data is not sufficient to make a reliable estimate of POS. Futhermore, there may be potential for other plays not considered in this paper, such as the Dinantian Carbonates and shallow Palaeogene reservoirs.
Play approach and geological risk reduction
The information that is gained when an exploration well is drilled has a significant value for the development of subsequent projects in the same play. Before a first exploration well is drilled in an underexplored play, the uncertainty regarding the geothermal potential is large. It is uncertain what will be encountered: the lithologies, fluids and gas composition and content, under- and overlying rock, etc. When a second well is drilled nearby, the uncertainties are less, due to the knowledge gained from the first well. Subsequent wells in the same layer will decrease the uncertainty even further.
The degree of risk reduction, also referred to as ‘derisking’, depends on the extent and homogeneity of the play. As a play is derisked, the POS of projects, and therefore the NPV (Eqn. 1), will increase. Therefore, early derisking activities constitute a value, the so-called value of Information (VoI).
The pre-drill expectation of the power of a doublet is expressed as a power-expectation curve (Fig. 8). Such a curve is based on a probabilistic calculation of the product of exploited temperature drop and flow rate, the latter depending on reservoir parameters and their underlying uncertainties, such as depth, thickness, permeability, etc. An expectation curve is project-specific. The steepness of the curve depends on the amount of subsurface uncertainty. The difference between P90 and P10 (i.e. the 90th and 10th percentile levels, respectively) is large in areas where there is a large subsurface uncertainty. Therefore, the P90 is relatively low, often too low for a positive business case. If, by exploration of the subsurface, the characteristics of the reservoir, such as permeability, are better than expected, the chances are that at a nearby location the permeability is also more favourable. Due to the information that was collected at the first well, the uncertainty at the second decreased, and the expected value of the permeability increased. Because there is a positive correlation between permeability and flow rate, this means that, in terms of the expectation, the curve steepens and shifts to the right. The difference between P90 and P50, and between P50 and P10, decreases. This is illustrated by Fig. 8. The pre-drill expectation of the doublet is the blue curve. The expected power is 8 megawatts thermal (MWth, P50). The expected value for a negative exploration result is 7.4 MWth (P90). Exploration, such as through a seismic campaign or drilling an additional exploration well, aims to reduce the uncertainty, the distance between P90 and P10. Once the reservoir has been drilled, the expectation curve becomes steeper for subsequent doublets within correlation distance. If the outcome of a prior project is better than expected, the curve shifts to the right, in this example the P90 from 7.4 to 10.3 MWth, and the P50 from 10.0 to 11.9 MWth. It is also possible that the P50 remains the same after drilling a successful well, and only the P90 is shifted. When the result of the project is less than expected, the curve shifts to the left, in the example for the P90 to 6.5 MWth, and the P50 to 8.1 MWth. After a successful project, the chance of achieving a sufficient flow rate for a positive business case increases for all subsequent projects. After an unsuccessful project, this chance becomes smaller. During the exploration phase of the subsurface, the power expectation curve therefore changes after each new well.
Changing the power expectation curve as a result of increased subsurface data and knowledge. Blue curve: before exploration. Red curve: after exploration, negative result. Green curve: after exploration, positive result.

Learning or derisking effect of a project for a subsequent project.

Information coming from geological analogues, studies, outcrops, research, seismic data, core measurements, etc. of a project is relevant, not only for later projects in the same layer, but also in younger strata. If a project targets a deep aquifer, information can also be collected from shallower aquifers. Shallower targets can thus be derisked at little extra cost.
The fact that knowledge gained from one project is valuable for subsequent projects in the same play means that significant risk and cost reductions are possible if projects within a play are developed in conjunction rather than in isolation. This constitutes the core of the play approach. Because one project derisks subsequent projects, the total value of all developed projects in conjunction is larger than the sum of all projects developed as stand-alone, where value includes both produced power and monetary value.
Value estimation optimal play-development versus stand-alone
The value of optimal play development with respect to the development of stand-alone projects can be quantified in terms of costs and benefits. This is done by calculating the NPV of the development of a potential geothermal project in a play, while the risk reduction achieved by the learning effect of exploration is taken into account. The risk reduction of subsequent projects is accounted for by a reduced risk of failure after a successful project, and an increased risk of failure after an unsuccessful project. A successful project yields revenue, while a failed project has sunk costs. For a stand-alone development, the risk reduction is zero, because gained geological and technical knowledge and information is not shared.
The starting situation is a play in which little exploration has been done. The uncertainty regarding the subsurface is large. Suppose that a project has a P50 expectation value of 10 MWth, and that the cut-off value for an economically viable project is also 10 MWth. Then there is a 50% chance that the project will be successful, and a 50% chance of failure. If the project fails, we suppose that the costs of the first well, set at €5.5M, are lost. If the doublet has a power exceeding 10 MWth, the project is successful. The NPVsuccess is set conservatively at €1M, which is slightly higher than the NPV of 0 which equals the P50 case. The expected value of the NPV for a stand-alone development is then:
 $${\rm{NPV = 0}}{\rm{.5 \times 1 + 0}}{\rm{.5 \times - 5}}{\rm{.5 = {\euro} \!-\! 2}}{\rm{.25M}}$$
It is clear that due to the negative NPV this project is unlikely to be drilled. Suppose that the repeat potential in this play is 10 (i.e. 10 additional prospects). In this case the stand-alone risked NPV of the projects in this play, without the learning effect and risk reduction of the play approach, equals:
 $${\rm{NPV = 10 \times }}\left( {{\rm{0}}{\rm{.5 \times 1 + 0}}{\rm{.5 \times - 5}}{\rm{.5}}} \right){\rm{ = {\euro}\!-\!22}}{\rm{.5M}}$$
If the power of each doublet is 10 MWth on average, then the total realisable power of the portfolio is 100 MWth. This complete portfolio will also not be developed due to the strongly negative NPV, unless society is willing to subsidise each project with €2.25M.
The NPV of this portfolio will look different for 10 projects in a play approach, considering the extra gained geological and technical data, knowledge and learning effects. The NPV of the portfolio, developed using a play approach, is visualised in Fig. 9, where project 2 learns from the experiences in project 1. We presume the following:
When a project is successful, the POS is increased by 20%, and when a project fails, it is lowered by 10%.
The correlation of the learning effect is limited to a number of projects. If the POS (in this case for a 10 MWth project) is developed to 90% (of a successful business case), it is presumed that it will not further increase significantly.
If a maximum of two projects fails, further exploration is stopped. In most cases this causes a low POS, unfavourable for continuation.
Fig. 10 shows the entire tree of 10 projects. For the green branches, a situation arises where the repeat potential can be further developed. The expected NPV for the entire tree is still slightly negative at €−1.0M. This is, however, significantly better than the stand-alone development which has an NPV of €−22.5M. Society might decide to provide a limited subsidy of €1.0M to the play approach to enable the development of 10 projects.
Probability tree for an optimal play approach (S: success, F: failure).

Fig. 10 shows that, in this example, the initial chance of successful development is 52% (the sum of all green branches). The chance of failure is therefore 48%, considering all background information, knowledge and expertise leads to an improvement of the NPV from €−22.5M to €−1.0M; the play approach creates an additional value of €21.5M. If the repeat potential is larger, the value of the total portfolio is also increased. At a repeat potential of 15 projects, the NPV becomes €1.6M. This means that the development of plays with a large repeat potential is more beneficial than one with a small repeat potential. This does not come as a surprise, because generally the first exploration projects in a new play have the largest risks and costs. The less risky follow-up projects developed after the exploration phase are required to earn back the money spent in the exploration phase.
The optimal play development tree can also be calculated using different assumptions, such as a new play with higher uncertainty. For a play having an initial chance of success of 30% (P30) and a similar set of the remaining assumptions, the NPV of a stand-alone development is 0.3 × 10 × 1 + (1 − 0.3) × 10 × −5.5 = €−34.5M. For play development, the NPV becomes €−7.3M. The added value of the play approach is therefore higher than in the P50 case, namely €27.2M.
We analysed the sensitivity of the event tree outcomes for various alternative assumptions in the portfolio. These are presented in Table 2, for changes in the NPVsuccess, the AEC, initial POS, the number of allowed failures (in oil and gas, the dry-well tolerance) and POS changes after success and failure. In particular, the repeat potential and associated VoI is key in the added value of the portfolio approach compared to the stand-alone approach.
Sensitivity of the tree outcomes shown in Fig. 10

The advantage of a higher NPV results in a lower cost price of geothermal energy.
Application to main plays in the Netherlands
The method described above is applied to the main plays Jurassic Cretaceous, Triassic and Rotliegend in order to estimate the order of magnitude of the additional monetary value of the play approach. For the development of the sub-play in each subregion (Figs. 4 and 7) we first assess the repeat potential by dividing the heat demand of the region by the heat supply of a typical doublet system, which is set to 0.2 PJ per year. The latter number is based on a 10 MWth doublet running 5500 hours per year. For each of the plays, we checked that the cumulative number of doublets which may be developed through the repeat potential does not exceed the subsurface technical potential of the play in the region taking into account an ultimate recovery of 33% (cf. Van Wees et al., Reference Van Wees, Kronimus, Van Putten, Pluymaekers, Mijnlieff, Van Hooff, Obdam and Kramers2012).
The repeat potential numbers per region are subsequently used in the event tree evaluation using the following assumptions:
NPVsuccess €1.0M, NPVfailure €−5.5M.
The initial POS of the event tree is sampled from the playʼs ThermoGIS map (Fig. 6), interpreting the P30–P50 region conservatively as POS = 30% and >P50 as POS = 50%.
The maximum number of failures before exploration stops is two. The exploration phase lasts a maximum of six projects to reach P90.
Success: the POS increases by 20%; failure: the POS decreases by 10%
The calculated estimations for the portfolio realisation are shown in Table 3. This shows that almost half the heat demand of 151 PJ can be supplied with geothermal energy, amounting to c.70 PJ. The potential can be realised with an almost equal share for the different plays.
Estimated portfolio realisation for conventional clastic plays (Fig. 6)

There is a large difference in NPV between play-based geothermal exploration and an entirely stand-alone approach. This is largest for the Jurassic/Cretaceous play: for a repeat potential of 288 projects split into eight subplay regions the NPV for the play approach is about €0.8 billion (bn) larger than for a full stand-alone approach. For the Triassic play and 198 potential projects the NPV difference is about €0.5bn, and for the Rotliegend with 277 projects, about €0.7bn. The total NPV difference for all these plays is therefore about €2bn.
Given the base case assumptions, the realised geothermal potential in the plays is 353 doublets and 70 PJ. The calculated amounts of potential doublets or repeat potential (total 763) were corrected for the calculated chances of successful development given an initial chance of success of 30% or 50%. In a probability tree that has POS increase of either +20% or −10% per step, and a halt after two failures, the calculated chances of successful development for initial chance of success of 30% and 50% are 18% and 52%, respectively.
It is important to note that the value difference of €2bn will never be achieved, with an average loss of over €5M each for each failed well. First, the two extreme situations sketched (full cooperation versus splendid isolation) are not realistic. In practice, a stand-alone approach would mean the economic development is generally not feasible and most likely only a small fraction of the heat demand could be developed relative to potential heat supply of about 70 PJ from P30 and P50 areas. Consequently, it is important to put the large difference in NPV in perspective and focus more on the potential number of doublets that can be realised using portfolio theory – a portfolio approach offers a substantial added value over a stand-alone approach.
In particular, the VoI in the play-based portfolio approach allows the unlocking of white-spot areas, which otherwise would not be developed. Please note that the perspective for repeat potential and VoI can be limited for operators due to immature development of the business portfolio (e.g. related to a lack of commitment for heat demand). In such cases, financial incentives can be provided for derisking the first wells to unlock such areas.
Sensitivity analysis
To obtain an impression of the sensitivity of the assumptions, some were changed to evaluate the influence on the outcome of the calculations, relative to the base case results presented in Table 3.
Allowing three failures before exploration stops leads to a 20–50% higher success rate, resulting in an increase of the realisation of c.20 PJ higher than the base case. The exploration phase would then cost an additional €0.1bn.
Rather than adopting an initial 30% chance of success for the area 30–50%, 40% can be used, and 70% for the area >50%. This results in an addition of about 30 PJ to the realisation and an additional cost saving of €0.3bn over the original €2bn.
When the generic learning effect is lowered from 10% to 5%, the resulting success rate of the portfolio is 25–50% lower. This decreases the realised potential by about 25 PJ. This also decreases the cost saving by €0.1bn. More knowledge sharing results in a higher efficiency in terms of realised power.
In summary, we estimate the bandwidth of the realisation potential of the four major clastic plays from 40 to 100 PJ with a modal value of the base case of 70 PJ.
Outlook for the extended resource base and dynamic development of heat demand
The estimated potential listed above is limited to a number of selected clastic plays, and only for areas where, based on existing data, POS is larger than 30% based on regional mapping in ThermoGIS. Consequently, large areas and alternative plays were ruled out that are possibly relevant for geothermal development when a portfolio approach is followed.
Subplays in low-POS regions of the studied clastic plays
If we assume a heat demand of over 300 PJ in the POS < 30% zones, then in these areas, assuming an initial POS of 5–15%, c.15–45 PJ could be further developed.
Alternative plays
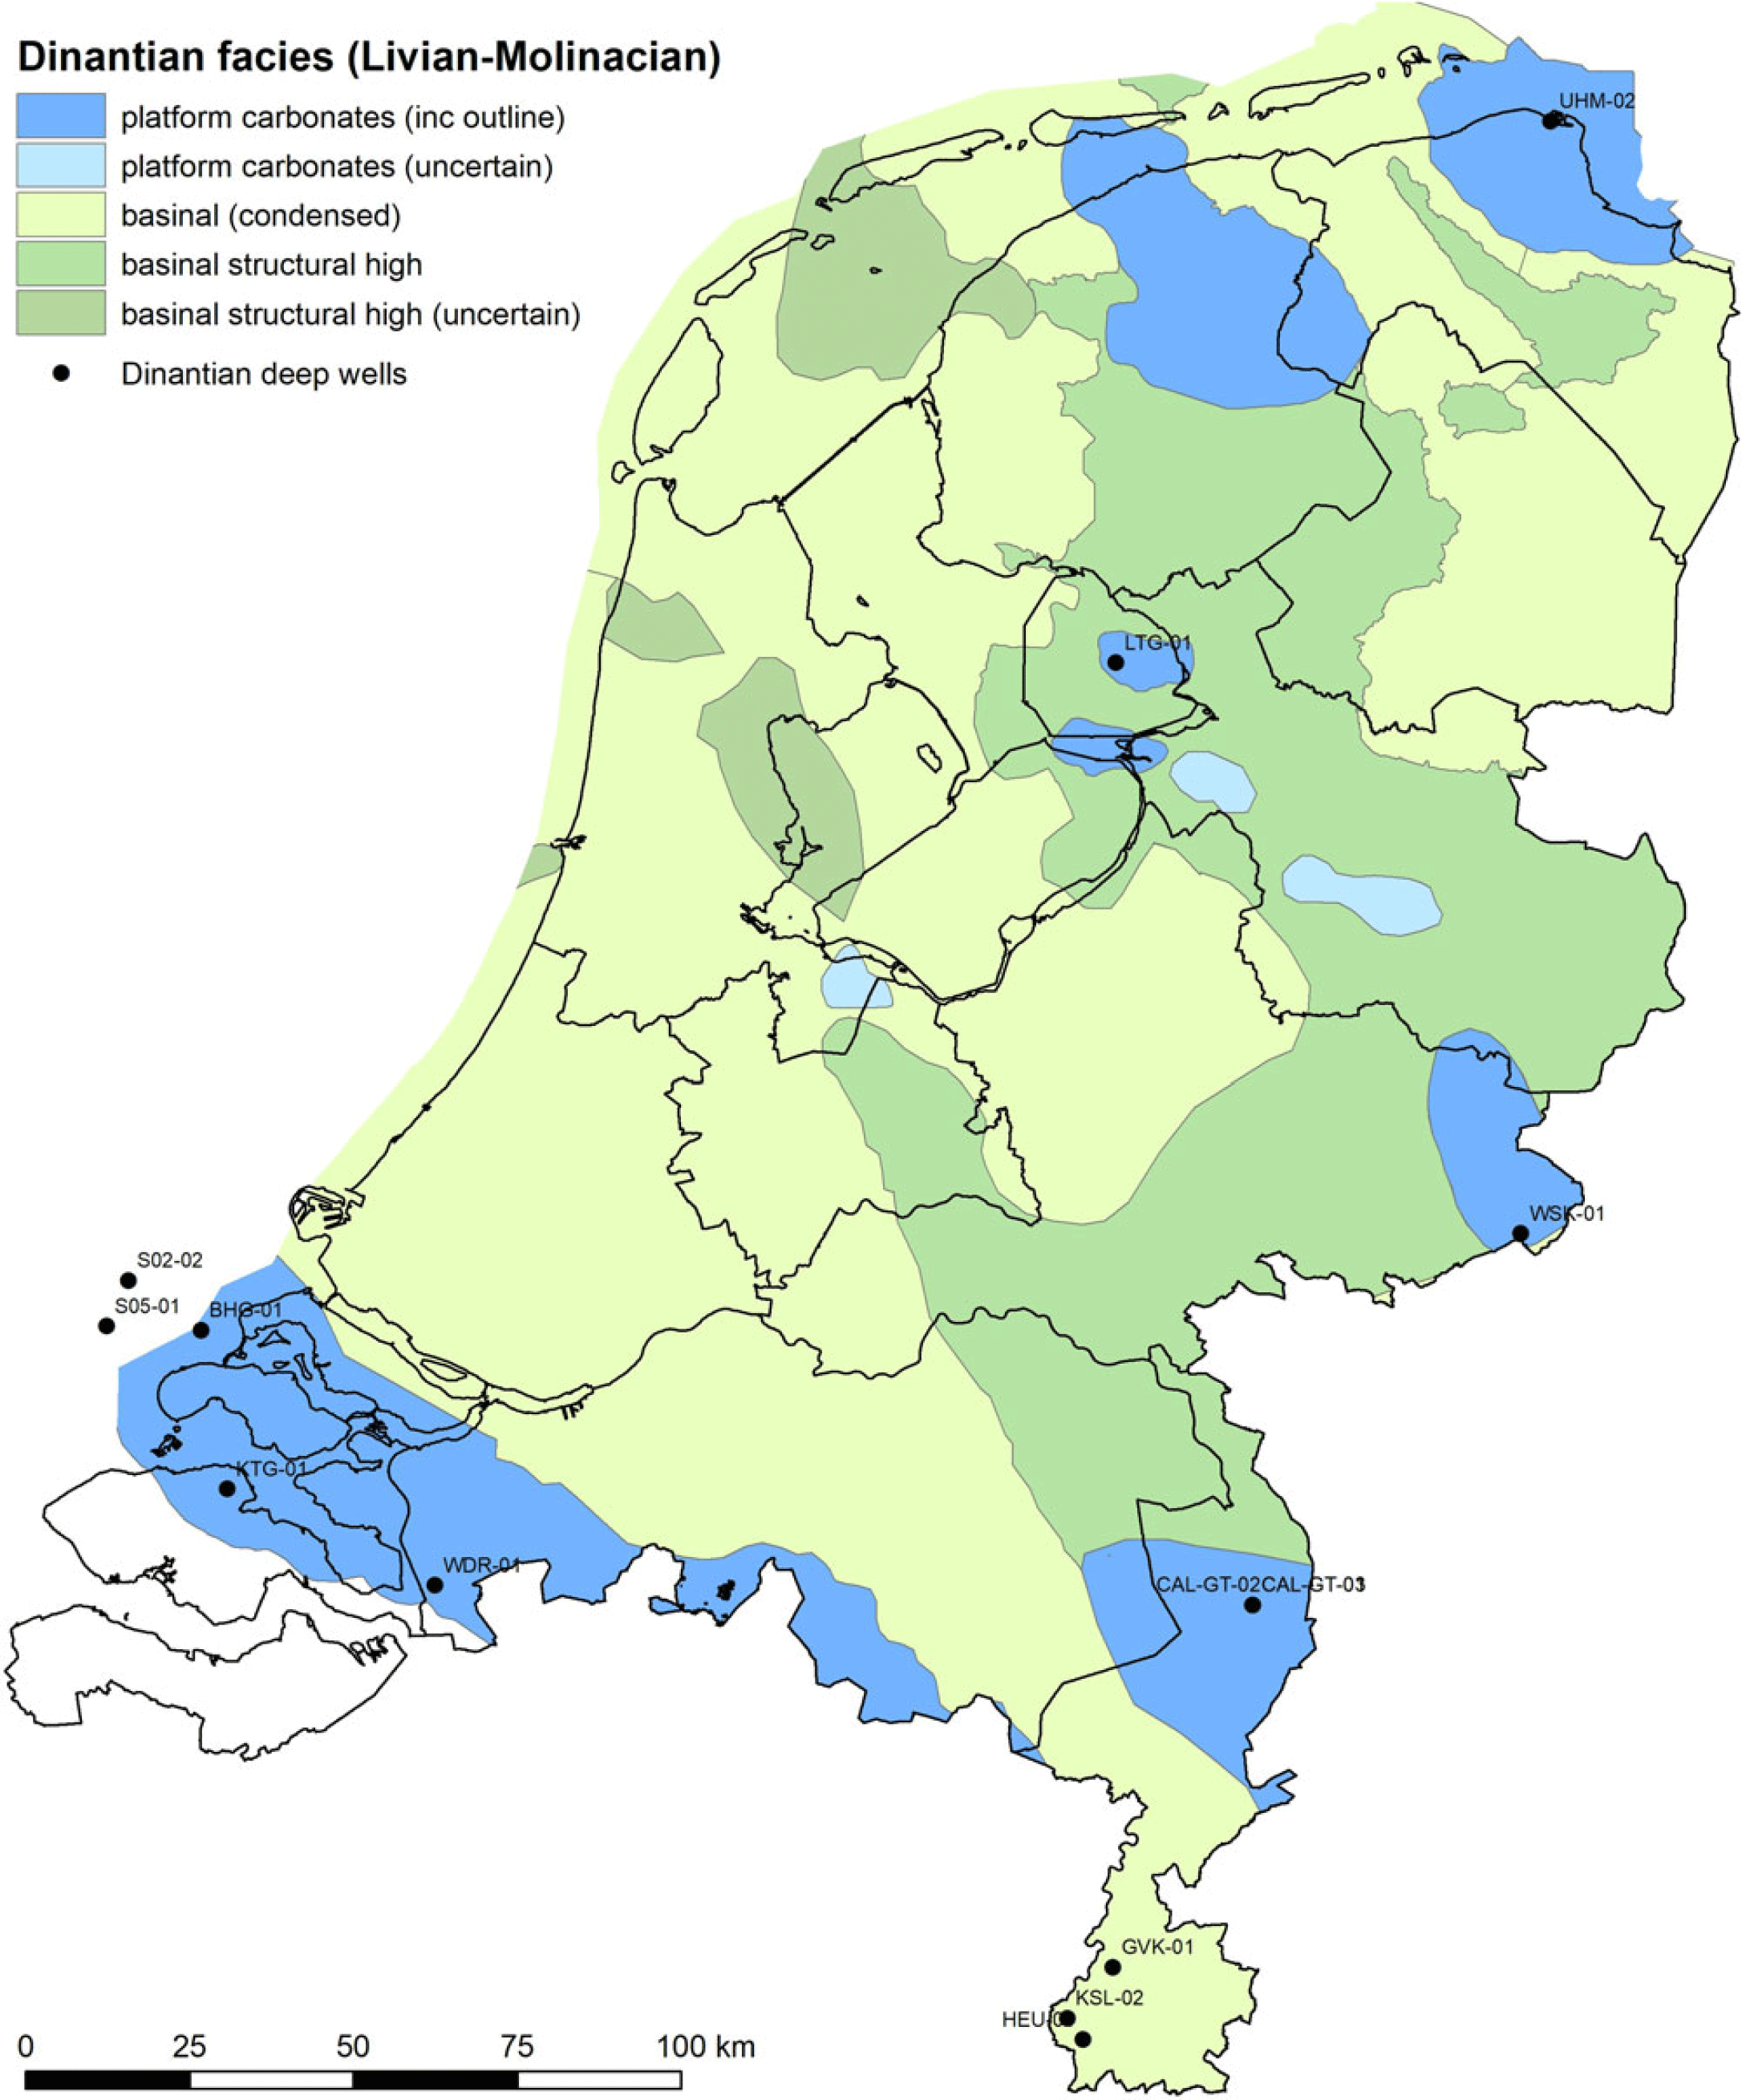
The Dinantian Limestone reservoir (Reijmer et al., Reference Reijmer, ten Veen, Jaarsma and Boots2017; Veldkamp et al., Reference Veldkamp, van Wees, Brunner, de Jong, Heijnen and van Langen2018; Fig. 11) offers potential that is currently developed in two doublet systems in the southeast of the Netherlands, but could significantly grow. It is estimated that the potential in this play system can be up to 50 PJ when exploited at depths in excess of 4 km (Boxem et al., Reference Boxem, Veldkamp and van Wees2016), but the uncertainty is considered very high. Currently a national explorative programme is executed for this play (Heijnen et al., Reference Heijnen, Jaarsma, Veldkamp and Schavemaker2019). Including the shallower potential, we estimate a potential of 15–50 PJ for the Dinantian Limestones. Shallow, lower-temperature reservoirs like the Palaeogene North Sea Group may also be considered. Exploration of this play is currently picking up, in combination with the use of heat pumps to increase the temperature of the produced water. We currently cannot make a quantitative estimate of its potential.
The subsurface extent of the Dinantian Limestone play (slightly changed after Mozafari et al., Reference Mozafari, Gutteridge, Riva, Geel, Garland and Dewit2019).
In addition, the explorative resource base may be enlarged by the double play concept, both in terms of taking advantage of targeting multiple geothermal plays in a single exploration well, as performed for example in the Trias Westland project in the Netherlands (https://www.triaswestland.nl/publicaties), as well as exploiting the synergy between hydrocarbons and geothermal energy (Van Wees et al., Reference Van Wees, Kramers, Mijnlieff, De Jong and Scheffers2015). The double play effect may be less than projected in 2015, since very few wells are expected to be drilled onshore in the Netherlands for oil and gas purposes.
Based on current data, the heat demand was considered to be static. In reality, it will change considerably over time, for instance when new district heating networks are developed. It is expected that the development of heat networks will grow by over 300% of the current installed capacity, with an additional 50 PJ or more in 2030 PBL, 2017). The proposed development of an extensive heat network in the province of Zuid-Holland, connecting 0.5 million households, already represents a growth of c.20 PJ and matches well with existing geothermal potential in that area (Fig. 2). We expect that 20–40% of the growth in heat demand from heat networks can be provided by geothermal energy, which amounts to 10–20 PJ. Doublet development and heat delivery can be boosted significantly by seasonal Aquifer Thermal Energy Storage (ATES) in aquifers up to 1000 m depth (Veldkamp et al., Reference Veldkamp, Pluymaekers, Vandeweijer and Van Wees2016; Wesselink et al., Reference Wesselink, Liu, Koornneef and van den Broek2018), resulting in up to 40% additional load hours in summertime. It is estimated that such ATES systems can result in an additional 10–20 PJ of produced geothermal energy. An important aspect of dynamic growth is the possible relocation of heat demand towards highly prospective areas for geothermal. The relocation for greenhouses may possibly result in an additional geothermal heat supply, which we tentatively estimate up to 40 PJ. Finally, it is expected that technologies will improve to transport heat over large distances, promoting the use of geothermal energy.
Table 4 gives a prognosis of the geothermal heat potential. It is important to stress that the final realisation will be critically dependent on future exploration, subsurface development, and development of matching heat demand and district heat networks. The prognosis will change as subsurface information is updated, technological innovations become available, potential technical challenges arise and lack of public support becomes an issue.
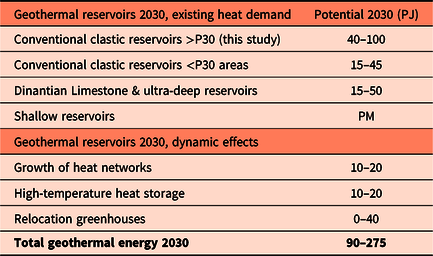
Estimated portfolio realisation, including an extended resource base and dynamic effects in heat demand. An estimate for shallow reservoirs is listed as pro memoria, as there is insufficient data for an estimate
Additional advantages of the play-based portfolio approach
There are five additional advantages to a play-based approach (please note that some of these, in particular integral project development, are taken into account by the general learning effect resulting in a general POS increase in the portfolio):
1) Integral project development means that the dependencies between all activities during the lifetime of a project are well-considered. They can be optimised, and, on the basis of experience from comparable projects, continuously improved. With respect to the stand-alone practice, two developments could contribute to better integral project development:
Strong geothermal operators that develop more than a single project.
Play-based development of projects, on the basis of comparability of multiple projects. The more comparable projects there are, the better the related activities can be optimised.
2) Cost reduction by synergy, efficiency and standardisation: Executing a project multiple times may create added value due to synergy between project developments. It allows higher efficiency and standardisation. For example, as subsurface uncertainties decrease, well design, rig selection, risk management, etc. will be less ambiguous. Synergies can arise from combined geological studies, seismic acquisition, rig contracting, the development of health, safety and environment (HSE) systems, etc. Efficiency refers to smart investment at the right time in the life cycle to prevent risks and costs, or to increase revenues. Examples are omission of a gas separator if gas is known to be absent or adding extra measuring or monitoring equipment to detect problems at an early stage. Standardisation is the identification and optimisation of repetitive activities during the life cycle, like contracting at scale, common database set-up, design and engineering activities, logistic and construction activities, etc.
3) Optimisation demand and infrastructure: currently, the geothermal source and the end user are geographically very close – the heat is used at, or near, the location where it is produced. The geothermal industry is expected to expand, apart from the greenhouse sector, to industry, utility buildings and residential areas. The following challenges will be addressed:
Where is the actual demand located, and where will it possibly be newly developed? What is the required temperature and volume, and user profile in time?
Where are the geothermal plays suitable for providing the anticipated demand?
How many doublets would be needed to supply sufficient heat?
How can the doublets be positioned in such a way that they are optimally connected to the heat infrastructure, in terms of safety, spatial planning and cost?
How do the costs of the development of the geothermal portfolio relate to the costs of alternative heat sources, in the short and long term?
4) Structural R&D and innovation: The interest in research and development (R&D) and innovation in the geothermal sector is growing. More focus is still on solving everyday problems than on future risk, cost reduction and economic competitiveness. We propose R&D to include subsurface exploration technology, rig and drilling innovation, well completion aimed at well integrity, improved well configuration and stimulation, measuring and monitoring techniques, project risk minimisation and stakeholder communication, and system integration.
5) Financing: The previously mentioned advantages result in risk and cost reduction, and increased revenues. This will make the sector more attractive to financing organisations. Main financing challenges are geological risk, quality and knowledge of contractors, exploitation risk, laws and regulations, risk of failing demand, operator creditworthiness risk, shortage of risk-bearing capital, and reputation risk. Advantages of a portfolio approach related to financing are:
Risk-spreading if more financial institutions are investing in the sector.
Increased trust in a larger sector and more experienced operators.
Increased possibilities for financing when more parties become involved in a growing sector.
Demonstrating the play-based portfolio approach in the Netherlands
Geothermal operators in the Netherlands who have been developing more than one doublet in their licence area have to some degree recognised the above benefits and put various aspects of play-based portfolio development into practice. In this paper we focus on one recent example in the Utrecht region which is currently being developed.
The development of geothermal energy in and around the municipality of Utrecht has thus far been limited. This is related to the fact that the Utrecht Province is considered a ‘white-spot area’ (Fig. 2), a term given to areas which have limited deep wells, and poor seismic coverage. Consequently, geothermal energy exploration is hampered by high financial risk due to the possibility of drilling an underperforming well, as anticipated flow rates can vary one or more orders of magnitude. This renders the potential contribution of geothermal uncertain.
Energy provider ENGIE has taken the initiative for a public–private consortium called LEAN (Peijster et al., Reference Peijster, Koekkoek, Van Ee, Van Og, Van Leeuwen, Den Otter, Klapwijk, Pikaar, Beekman and Van Wees2019). It includes partners ENGIE, Eneco, HUISMAN, EBN and TNO, to invest in a demonstration geothermal doublet to prove the suitability of the subsurface in the Utrecht region for geothermal energy production. Additional science partners and societal stakeholders include University Utrecht and the Municipality and Province of Utrecht. The planned geothermal doublets will feed their produced heat into a large district heating network owned by Eneco (Fig. 12), delivering heat to some 38,500 buildings. In 2018, Eneco published a road map for renewable development of the heat network energy sources; in case of success, possibly 30 MWth of renewable power will be produced by geothermal doublets.
Green dots are substations of the existing Eneco district heating network and thus preferred locations to supply the produced geothermal heat to the heat network of Eneco, and all the available (analogue and digital) seismic lines in the area surrounding Utrecht (source: Peijster et al., Reference Peijster, Koekkoek, Van Ee, Van Og, Van Leeuwen, Den Otter, Klapwijk, Pikaar, Beekman and Van Wees2019). The heat network is also visible in Fig. 4.

LEAN sets out to demonstrate the development of Rotliegend, aiming at an increased probability of success for geothermal energy projects. Based on re-evaluation of existing wells and seismic data at the start of the project, we adjusted the ThermoGIS low initial POS from unknown to a medium success rate (30–70%). The aim of LEAN is to reach through the exploration funnel a high success rate (>90%) after exploration drilling. LEAN adopts a decision tree approach to quantitatively assess the benefits of the portfolio approach (Fig. 13; Peijster et al., Reference Peijster, Koekkoek, Van Ee, Van Og, Van Leeuwen, Den Otter, Klapwijk, Pikaar, Beekman and Van Wees2019). To do this, the projected NPV of the first project takes the VoI for the follow-up projects into account. To maximise the VoI, the first well is marked by an extensive logging and coring programme and Distributed Temperature Sensing/Distributed Acoustic Sensing logging to retrieve information for subsequent projects. Eneco has committed to five follow-up projects. LEAN aims to demonstrate that the VoI of the five follow-up projects contributes significantly to the business case of the first doublet, enhancing its NPV with a few million euros (Fig. 13).
Generic event tree to evaluate the business case of LEAN (numbers have been modified from the real business case for confidentiality reasons). The business case is marked by positive NPV outcomes in case of demonstration of P50 or better performance. The performance is represented in a conservative approach with the P50 and P20 characteristics for revenues. The vertical lines represent three go/no-go moments: at the end of the first, second, and third phases of the LEAN project, corresponding to exit scenarios 1–3. Phases 2 and 3 correspond to the decisions to drill the first and second well respectively. The last go/no-go decision, corresponding to the evaluation of the performance of the second well if positive (>P50), will result in development of five follow-up projects with significant NPV (scenario 4), added as VOI to the business case (from Peijster et al., Reference Peijster, Koekkoek, Van Ee, Van Og, Van Leeuwen, Den Otter, Klapwijk, Pikaar, Beekman and Van Wees2019).

The VoI and event tree NPV is enhanced by lowering drilling and completion costs by 25% for the first well compared to a conventional well by a number of innovations described by Peijster et al. (Reference Peijster, Koekkoek, Van Ee, Van Og, Van Leeuwen, Den Otter, Klapwijk, Pikaar, Beekman and Van Wees2019). In addition, the reprocessing of vintage seismic significantly reduces the financial risk of the geothermal project, during the desk-study phase.
An extensive coring, logging and testing programme is planned to be executed on the first well. The performance of the reservoir and implications for the portfolio will be analysed by an extensive study of the well data. Based on the evaluation of the performance of the first slim hole and a VoI analysis of the remaining portfolio, a go/no-go decision will be taken on the drilling of the second well of the doublet. If the well test is successful, the doublet will be made production-ready and connected to the heat network. The reservoir, well and drilling data, obtained in the second slim hole, will be used to again update the VoI analysis for the entire opportunity portfolio, evaluate the actual drilling cost reduction and evaluate the expected performance of future doublets.
Conclusions and future outlook
In this paper we have demonstrated the added value of the portfolio approach for well-known geothermal plays in the Netherlands.
In the portfolio approach, the VoI of a project is used to decide to continue or abort future planned activities in the play. This approach contributes significantly to a reduction of financial risk when compared to a stand-alone approach for the development of geothermal plays. Furthermore, it allows the development of prospects which, from a stand-alone perspective, would be considered too risky financially.
A first application of the portfolio theory to the Netherlands using subsurface reservoir data from the 2018 version of ThermoGIS shows that around 350 doublets can be developed in the three main plays: Rotliegend, Triassic and Jurassic/Cretaceous. These are capable of producing about 70 PJ. The monetary value of the advantage of the play-based portfolio approach has been estimated at up to €2bn.
The outcomes are relatively conservative due to the bias towards low initial P-values adopted for the plays, and therefore marked by a considerable potential upside of 30 PJ. In addition, low-POS areas and a number of plays, including Tertiary clastic formations and Early Carboniferous and Devonian reservoirs, have not been included. These may increase the resource base by an additional 30–95 PJ. By 2030, we anticipate that seasonal heat storage can significantly add to the load factor and associated cumulative yearly heat production by 10–20 PJ. Concentrated heat demand, well suited to be connected by geothermal energy sources, is expected to grow through the development of heat networks by 10–20 PJ, and relocation of greenhouses can effectively contribute to the potential, which we tentatively estimate at 40 PJ. Consequently, the preliminary estimate of the total geothermal potential of the Netherlands, when adopting the portfolio approach, is estimated to be between 90 and 275 PJ (Table 4).
Five further advantages, which reinforce each other, are continuous improvement by integrated project development; cost reduction through synergy, efficiency and standardisation; optimisation of the surface heat demand and infrastructure; the possibility of structural R&D and innovation; and financing advantages. The learning effects of synergy, efficiency and standardisation are considered significant.
Acknowledgements
We thank Ramon Loosveld and an anonymous reviewer for valuable comments on an earlier version of the manuscript.


 Open access