


Facial expression processing bias is one of the most remarkable cognitive–social impairments in depression. Individuals with depression have biases towards the perception of negative facial expressions such as fear and sadness, and/or away from happiness or other positive expressions. Reference Bouhuys, Geerts and Gordijn1–Reference Gollan, Pane, McCloskey and Coccaro4 Functional imaging studies have outlined the neural basis of these behavioural biases. Specifically, depression is associated with elevated responses in the amygdala, insula and ventral striatum during the presentation of fearful or sad expressions. Reference Sheline, Barch, Donnelly, Ollinger, Snyder and Mintun5–Reference Keedwell, Andrew, Williams, Brammer and Phillips10 Aberrant neural responses have also been implicated in extrastriate areas such as the fusiform gyrus and cuneus, Reference Surgladze, Brammar, Keedwell, Giampietro, Young and Travis8,Reference Keedwell, Andrew, Williams, Brammer and Phillips10–Reference Fu, Williams, Brammer, Suckling, Kim and Cleare12 possibly mediated via rich interconnections with amygdala circuitry. Reference Haxby, Hoffman and Gobbini13,Reference Phillips, Drevets, Rauch and Lane14 These emotional processing biases in depression may be important in the underlying aetiology of this disorder, with individuals assigning more salience and attention to negative v. positive social cues, thereby fuelling negative thinking, poorer social function and increased access to negative memories. However, it remains unknown whether such biases develop prior to the initial onset of depression. Neuroticism (N) is one of the best predictors of vulnerability to depression Reference Kendler, Kessler, Neale, Heath and Eaves15,Reference Kendler, Gatz, Gardner and Pedersen16 and we therefore sought to explore the neural substrates of facial expression processing biases in volunteers at high and low risk for depression (high-N group and low-N group respectively) in the absence of depression history using functional magnetic resonance imaging (fMRI). Previous work has suggested that linear modelling of the neural response to different intensities of positive and negative emotions is a sensitive way of identifying biases in depression. Reference Fu, Williams, Cleare, Brammar, Walsh and Kim7,Reference Surgladze, Brammar, Keedwell, Giampietro, Young and Travis8,Reference Surgladze, Young, Senior, Brebion, Travis and Phillips17 Thus, we hypothesised that similar biases would be seen as a function of vulnerability per se. Specifically, we hypothesised that high-N scores would be associated with increased neural responses to increasing intensity levels of fear and/or reduced responses to increasing intensity of happiness within the amygdala and fusiform gyrus in line with previous studies on depression. Reference Sheline, Barch, Donnelly, Ollinger, Snyder and Mintun5,Reference Fu, Williams, Cleare, Brammar, Walsh and Kim7,Reference Surgladze, Brammar, Keedwell, Giampietro, Young and Travis8,Reference Surgladze, Young, Senior, Brebion, Travis and Phillips17,Reference Vuilleumier and Pourtois18
Method
Participants
Twenty-five right-handed healthy volunteers (17 women, aged 18–22 years) gave written informed consent to the study, which was approved by the Oxford Research Ethics Committee. The Structured Clinical Interview for DSM–IV Reference Spitzer, Williams, Gibbon and First19 was used to verify that all participants were free of current or past Axis I disorders, and all of them were free of medication apart from the contraceptive pill. Participants received payment for their participation. These participants were a subset of those previously taking part in the behavioural assessment of emotional processing, Reference Chan, Goodwin and Harmer20 but the testing sessions were on average 11 months apart.
Neuroticism scores were derived from the 12-item neuroticism scale of the shortened Eysenck Personality Questionnaire (EPQ). Reference Eysenck, Eysenck and Barrett21 Twelve participants (9 women) were in the high-N group (N range 8–12), and 13 participants (8 women) in the low-N group (N range 0–3). This range of N scores was consistent with our previous behavioural study. Reference Chan, Goodwin and Harmer20 The two groups were matched for age (mean=20.00, s.d.=0.60 v. mean=20.15, s.d.=0.99), gender, verbal IQ (mean=119.10, s.d.=3.03 v. mean=118.66, s.d.=4.26) and spatial IQ (mean=2584 ms, s.d.=941 v. mean=1974 ms, s.d.=610) assessed by National Adult Reading Test (NART) Reference Nelson22 and Wechsler Adult Intelligence Scale – Revised (WAIS–R) Reference Wechsler23 respectively. Two participants had a first-degree relative with depression (one from each group).
Mood variables
The Beck Depression Inventory (BDI) Reference Beck, Ward, Mendelson and Mock24 and State–Trait Anxiety Inventory (STAI) Reference Spielberger, Gorsuch and Lushene25 were used to assess self-rated mood.
Stimuli and task
Each volunteer participated in a single 16 min experiment employing rapid event-related fMRI. Eight faces (four male, four female) displaying prototypical expressions of fear and happiness were taken from a standardised series of facial expressions. Reference Ekman and Friesen26 In addition to the prototypic or high intensity (100%) facial expressions, medium (60%) and low (30%) intensity expressions generated using morphing software Reference Young, Rowland, Calder, Etcoff, Seth and Perrett27 were used. Each face was also presented in a neutral facial expression. Thus, there were eight facial stimuli representing each of the following categories: high fearful (fear-H), medium fearful (fear-M), low fearful (fear-L), high happy (happy-H), medium happy (happy-M), low happy (happy-L) and neutral. Each of these faces was presented three times and 24 presentations of a fixation cross were included as baseline, giving a total of 192 trials. Stimuli were presented in a random order for 500 ms each and the intertrial interval varied according to Poisson distribution with a mean intertrial interval of 5000 ms. Participants were asked to indicate the gender of each face by pressing one of two keys on an MRI-compatible keypad. No motor response was required for baseline trials of fixation cross. Stimuli were presented on a personal computer using E-Prime (version 1.0; Psychology Software Tools Inc, Pittsburgh, Pennsylvania) and projected onto an opaque screen at the foot of the scanner bore, which participants viewed using angled mirrors. Behavioural responses were recorded using a MRI-compatible keypad. Accuracy and reaction times were recorded by E-Prime.
Functional MRI data acquisition
Imaging data were collected by a 1.5 T Siemens Sonata scanner located at the Oxford Centre for Clinical Magnetic Resonance Research. Functional imaging consisted of 30 contiguous T 2 *-weighted echo-planar image (EPI) slices (repetition time (TR)=3000 ms, echo time (TE)=50 ms, matrix=64×64, field of view (FOV)=192×192, slice thickness=4 mm). A Turbo FLASH sequence (TR=12 ms, TE=5.65 ms, voxel size=1 mm3) was also acquired to facilitate later coregistration of the fMRI data into standard space. The first two EPI volumes in each run were discarded to ensure T 1 equilibration.
Data analyses
Functional MRI data analysis was carried out using FSL version 3.2β. Reference Smith, Jenkinson, Woolrich, Beckmanna, Behrensa and Johansen-Berga28 Preprocessing included slice acquisition time correction, within-participant image realignment, Reference Jenkinson, Bannister, Brady and Smith29 non-brain removal, Reference Smith30 spatial normalisation (to Montreal Neurological Institute (MNI) 152 stereotactic template), spatial smoothing, and high-pass temporal filtering (to a maximum of 0.025 Hz).
In the first level analysis, individual activation maps were computed using the general linear model with local autocorrelation correction. Reference Woolrich, Ripley, Brady and Smith31 Eight explanatory variables were modelled, including each intensity (low, medium, high) of fear and happy as well as neutral and fixation. The main contrasts of interest were fear v. happy expressions (and vice versa) for each intensity level, i.e. fear-H v. happy-H; fear-M v. happy-M, fear-L v. happy-L. In addition, each individual activation map was analysed by fitting linear trends at each voxel at the three intensity levels of fear and happy, separately, with orthogonal polynomial trend analysis. Positive linear trends modelled responses for increasing emotional intensity, whereas negative linear trends modelled responses for decreasing emotional intensity. All variables were modelled by convolving the onset of each stimulus with a haemodynamic response function, using a variant of a gamma function (i.e. a normalisation of the probability density function of the gamma function) with a standard deviation of 3 s and a mean lag of 6 s.
In the second level analysis, individual data were combined at the group level (high-N v. low-N scores) using a mixed effects analysis. Reference Woolrich, Behrens, Beckmann, Jenkinson and Smith32 This mixed effects approach accounts for intra-individual variability and allows population inferences to be drawn. We aimed to establish, first, the effect of neuroticism on the responses to fear v. happy facial expressions at each intensity level; and second, the effect of neuroticism on the linear trend across increasing or decreasing intensity of fear and happy expressions. Significant activations were identified using a cluster-based threshold of statistical images (height threshold of z=2.0 and a (corrected) spatial extent threshold of P<0.05). Reference Friston, Worsley, Frackowiak, Mazziotta and Evans33 Significant interactions were further explored by extracting per cent blood oxygen level dependent (BOLD) signal change within the areas of significant difference, which were then analysed using repeated measures ANOVA (between-participants variable=group; within-participants variable=intensity or valence) followed by appropriate post hoc t-tests (SPSS version 14.0 for Windows). Corresponding Brodmann areas (BA) were identified by transforming MNI coordinates into Talairach space. Reference Talairach and Tournoux34
As a result of the strong a priori evidence implicating the amygdala in the processing of facial expressions, Reference Sheline, Barch, Donnelly, Ollinger, Snyder and Mintun5–Reference Drevets9 we also performed a region of interest analysis. Amygdala masks (left and right) were segmented for each individual using a robust fully automated Integrated Registration and Segmentation Tool (‘FIRST’). Reference Patenaude, Smith, Kennedy and Jenkinson35 Per cent BOLD signal change for each emotional stimulus (fear and happy) was extracted from each individual amygdala. These data were entered into 2×2×3 repeated measures ANOVA (between-participants variable=group; within-participant variables=valence or intensity). Significant three-way interaction was clarified by two-way ANOVA and subsequent t-tests.
For the behavioural data, independent sample t-tests were used to examine group differences for subjective mood ratings, overall accuracy and reaction time of the gender discrimination responses. As a result of technical difficulties, reaction time and accuracy data (measured during fMRI) from four participants with low N were not recorded. These individuals were included in the analysis of fMRI data because the behavioural response of gender discrimination is incidental to the main outcome measure of neural response to emotional valence.
Results
Mood ratings and behavioural data
As expected, the high-N group had significantly higher scores on trait anxiety (mean 39.00, s.d.=8.15 v. mean 27.47, s.d.=4.91, P<0.01) and a non-significant trend of higher scores on state anxiety (mean 32.08, s.d.=7.09 v. mean 26.46, s.d.=7.02, P=0.06). There was no significant group difference in BDI scores (mean 2.50, s.d.=1.93 v. mean 1.23, s.d.=1.92, P=0.11). Behaviourally, both groups achieved higher than 90% correct for gender discrimination of all facial expressions, with no between-group difference in accuracy (mean 94.29, s.d.=5.62 v. mean 92.80, s.d.=9.51, P=0.66) or speed of correct responses (mean 674.38, s.d.=87.29 v. mean 725.97, s.d.=161.84, P=0.36).
Functional imaging results
Neural responses for fearful v. happy expressions: between-group differences
Our primary hypothesis was that fearful and happy faces would be differentially processed by the participant groups. Indeed, the high-N v. low-N groups exhibited greater activity for fear v. happy expressions with medium intensity (i.e. fear-M v. happy-M) in the following areas: cerebellum (MNI: 0, −64, −26; z=3.91), left middle frontal gyrus (BA10, MNI: −30, 58, 2; z=3.46), left superior parietal (BA7, MNI: −18, −66, 60; z=3.25) and right superior parietal cortex (BA7, MNI: 4, −48, 68; z=3.25). Analysis of per cent BOLD signal change for fear-M and happy-M stimuli revealed increased responses in the high-N group during presentation of fearful facial expressions, which in some areas was accompanied by relatively reduced responses during the presentation of happy facial expressions (Fig. 1 details simple main effect analyses). These effects remained significant after including BDI or STAI scores as covariates (all P<0.01).
The image and blood oxygen level dependent (BOLD) per cent signal change of the brain regions where the high-N group (blue) showed greater activation for fearful v. happy faces at medium intensity than the low-N group (white). Colour bar represents z-score between 2.0 and 3.9. Asterisks represent significant group comparisons of P<0.05. Fear-M, medium fearful; Fear-H,medium happy.

Linear trend for increasing intensity of fear or happiness: between-group differences
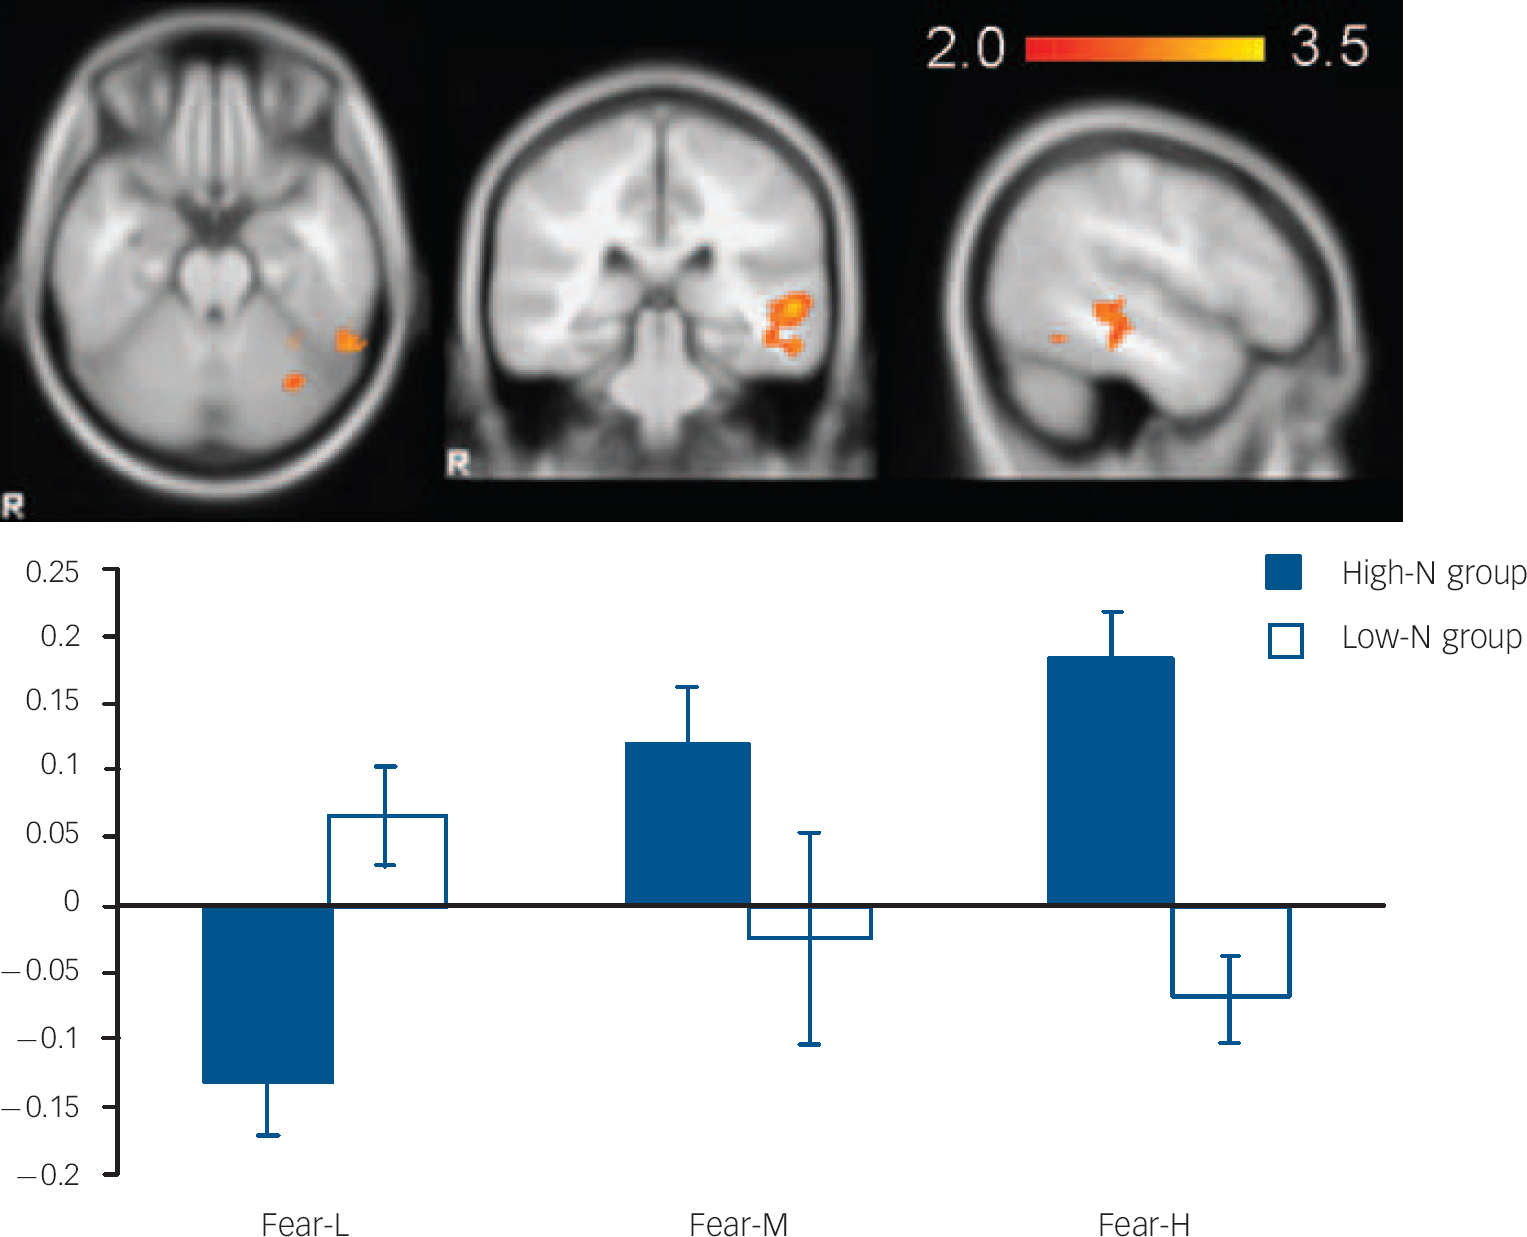
For fearful expressions, the high-N group demonstrated a significant positive linear trend in right fusiform gyrus (BA 19, MNI: 26, −66, −14; z=3.48) (Fig. 2) and left middle temporal gyrus (BA21, MNI: −56, −32, 0; z=3.51) (Fig. 3) relative to the low-N group. Further analyses of per cent BOLD signal change confirmed a significant group×intensity interaction in both fusiform gyrus (F(2,46)=14.155, P<0.001) and middle temporal gyrus (F(2,46)=8.736, P<0.001), which remained significant after including mood scores (BDI, STAI) as covariates (all Ps=0.001). In right fusiform gyrus, the high-N group showed greater activation for increasing fearful intensity, whereas the low-N group showed the opposite effect (Fig. 2). Post hoc t-tests revealed greater activation in the high-N group for the high intensity of fear (P=0.006) and a marginal reduction in activation for low intensity of fear (P=0.060). A similar pattern was found in middle temporal gyrus (Fig. 3), in which the high-N group had greater activation for high intensity (P<0.001) and reduced activation for low intensity (P=0.001) of fearful expressions. By contrast, there was no between-group difference in terms of linear trends for happy expressions.
The image and blood oxygen level dependent (BOLD) per cent signal change of right fusiform gyrus (MNI: 26, −66, −14), in which high-N group (blue) showed increased signals for increasing intensity of fearful expressions whereas the low-N group (white) showed the reverse pattern. Colour bar represents z-score between 2.0 and 3.5. Asterisks represent significant group comparison of P<0.05. Fear-L, low fearful; Fear-M, medium fearful; Fear-H, high fearful.
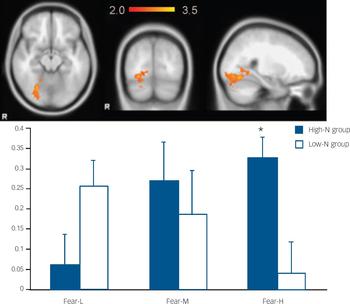
The image and blood oxygen level dependent (BOLD) per cent signal change of left middle temporal gyrus (MNI: −56, −32, 0), in which high-N group (black) showed increased signals for increasing intensity of fearful expressions whereas the low-N group (white) showed the reverse pattern. Colour bar represents z-score between 2.0 and 3.5. Asterisks represent significant group comparison of P<0.05. Fear-L, low fearful; Fear-M, medium fearful; Fear-H, high fearful.
Region of interest analysis of amygdala responses
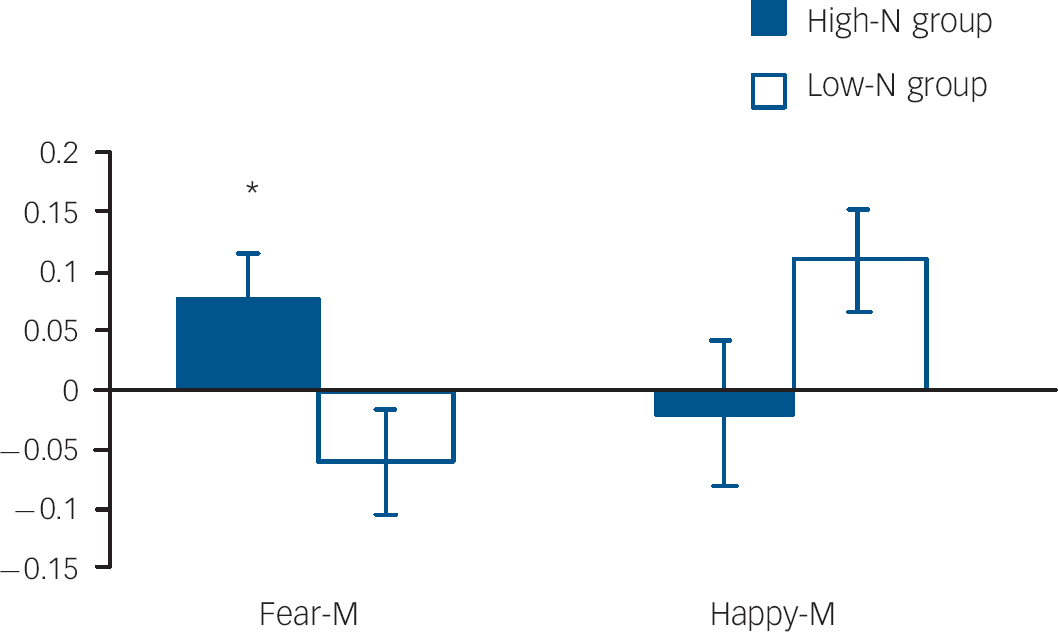
Amygdala volumes were not significantly affected by group (main effect of group: F(1,23)=0.563, P=0.461; group hemisphere: F(1,23)=0.261, P=0.614), allowing functional responses to be examined in the absence of potentially confounding structural differences. In the right amygdala there was a non-significant trend for an emotion×intensity×group interaction (P=0.092). Due to the strong a priori hypothesis regarding the effects on ambiguous facial expressions, two-way ANOVAs were run for each intensity level. These revealed a significant group valence interaction for medium intensity (i.e. fear-M v. happy-M; P=0.024). This interaction was driven by the high-N group having greater amygdala activation for medium fearful expressions relative to the low-N group (P=0.029) (Fig. 4). By contrast, there was no significant effect in the left amygdala.
Per cent blood oxygen level dependent (BOLD) signal change in right amygdala for fearful and happy expressions at medium intensity by group. Asterisks represent group comparison P<0.05. Fear-M, medium fearful; Happy-M, medium happy.
Discussion
To our knowledge this is the first study to demonstrate the neural basis for negative biases in emotional facial processing in individuals at high risk for depression by virtue of high neuroticism. Our high-N group exhibited a linear increase in neural signals in right fusiform gyrus and left middle temporal gyrus for increasing intensity of fearful expressions, whereas the low-N group showed the opposite effect. Furthermore, the high-N group showed a larger response in right amygdala, cerebellum, left middle frontal gyrus and bilateral superior parietal cortex during the presentation of ambiguous medium levels of fearful v. happy expressions. These areas have been implicated in facial expression processing and depression in previous studies. We believe we have demonstrated neural processes that may be involved in vulnerability to depression.
A key role for the amygdala and the fusiform gyrus in facial expression recognition and depression has been proposed previously from studies of individuals who are currently depressed Reference Sheline, Barch, Donnelly, Ollinger, Snyder and Mintun5,Reference Fu, Williams, Cleare, Brammar, Walsh and Kim7,Reference Surgladze, Brammar, Keedwell, Giampietro, Young and Travis8,Reference Surgladze, Young, Senior, Brebion, Travis and Phillips17,Reference Vuilleumier and Pourtois18 and a similar pattern of effect was seen here as a function of neuroticism. Thus, the increased responses shown by our high-N group for increasing intensity of fear in the right fusiform gyrus and heightened amygdala responses to ambiguous fearful facial expressions are similar to those observed in individuals with depression. Reference Sheline, Barch, Donnelly, Ollinger, Snyder and Mintun5,Reference Surgladze, Brammar, Keedwell, Giampietro, Young and Travis8 Vulnerability to depression has also been associated with aberrant amygdala responses to negative facial expressions in people with familial risk for depression (e.g. van der Veen et al, Monk et al). Reference van der Veen, Evers, Deutz and Schmitt36,Reference Monk, Klein, Telzer, Schroth, Mannuzza and Moulton37 These results are also consistent with recent evidence which suggests that amygdala responses to emotional information correlates with neuroticism scores in unselected populations. Reference Stein, Simmons, Feinstein and Paulus38,Reference Baas, Omura, Constable and Canli39 Together, these findings suggest that increased amygdala responses to negative affective stimuli may be involved in risk for depressive disorders.
It is notable that while the high-N group showed the expected increase in fusiform response as a function of increasing fear value, the low-N group showed the opposite pattern. This implies decreased visual processing with increasing fear in volunteers at low risk of developing depression. Perception of fearful faces is believed to convey social signals of threat or danger. Reference Haxby, Hoffman and Gobbini13,Reference Calder, Lawrence and Young40 Such a pattern of effect could be explained by differential evaluation of threat value in the high- v. low-N groups, according to the curvilinear response function of Mogg & Bradley's (1998) cognitive motivational account of anxiety. Reference Mogg and Bradley41 This theory suggests that low-threat stimuli may be avoided in order to reduce distraction, whereas high-threat stimuli are monitored for potential importance. The observed pattern of results would be expected, if the low-N group estimated the face stimuli as having a lower threat value, leading to the high-intensity fearful faces being perceived as low threat and thus ‘avoided’. In other words, the current observation of reducing neural responses towards fearful expressions with higher intensity suggest that low risk for depression may be manifest as a reduced estimation of threat value in the environment.
In addition to the effects on the fusiform gyrus and amygdala, our results implicate a network of brain areas that are involved in facial processing and vulnerability to depression. First, the middle temporal gyrus revealed differential responses for fearful expressions in the high- and low-N groups similar to that observed in the fusiform gyrus. The temporal gyrus is within the core system of face perception Reference Haxby, Hoffman and Gobbini13,Reference Bruce and Young42 and the increased responses seen here in the high-N group appear to be consistent with greater processing of threat-relevant facial stimuli in this group.
The medium intensity of fear v. happy expressions revealed group differences in the left middle frontal gyrus and bilateral parietal cortex. Indeed, such a frontoparietal network plays a central role in the concept of self, perception of social relationships and attention (e.g. Uddin et al, Feinberg et al). Reference Uddin, Kaplan, Molnar-Szakacs, Zaidel and Iacoboni43,Reference Feinberg44 Thus, the specific activations for fearful expressions in these regions by the high-N group could be explained by their greater tendency to view negative expressions as self-relevant or self-threatening and thereby requiring activation of attentional systems. In line with this, the reduced activation for happy expressions may reflect their inclination to disregard positive social information as self-referent and deserving of further attention. In other words, these individuals are more likely to interpret negative social signals to be personally relevant or threatening, but at the same time unable to translate positive social signals for positive self-regard. This interpretation is consistent with the self-referent and facial expression processing biases observed in a similar high-risk sample. Reference Chan, Goodwin and Harmer20
The same analysis also revealed increased cerebellum responses in the high-N group towards fearful v. happy facial expressions. The cerebellum is well known to play a key role in fear conditioning, anticipation of pain and coordination of motor action. Reference Ploghaus, Tracey, Gati, Clare, Menon and Matthews45–Reference Supple and Leaton48 Its role in processing fearful facial expressions is therefore not unexpected and the greater response in the high-risk group may represent an increase in threat anticipation and/or readiness to respond to these threat cues. Reference Brunia and van Boxtel49
The current study demonstrated differential responses to emotional cues in the high-N group in the absence of current or past Axis I psychiatric disorders from DSM–IV, thereby indicating that these biases exist prior to mood or anxiety disorder. Analyses including mood scores as covariates confirmed that the current effects were a function of neuroticism per se independent of mood state. The absence of family history of depression in the high-N group further suggested that the aberrant signals found in the high-risk group were a function of high neuroticism per se independent of familial risk for depression. As noted in the introduction, neuroticism has been identified as a robust predictor for depression. For example, Kendler et al Reference Kendler, Kessler, Neale, Heath and Eaves15 found that a 1 standard deviation difference in neuroticism translates into a 100% difference in the rate of first onsets of depression over 12 months. Similarly, in a recent report based on a large Swedish twin sample (>20 000 individuals) Reference Kendler, Gatz, Gardner and Pedersen16 neuroticism strongly predicted the risks for lifetime and first-onset depression assessed in 25-years follow-up. Thus, the differences in neural response to positive and negative affective stimuli seen here may be involved in predisposition to depression, consistent with cognitive theories of depression.
The differential responses for positive v. negative expressions shown here were seen largely with the medium intensity level of facial expression. This probably represents maximal ambiguity as behavioural data suggest that low-intensity levels are usually perceived as neutral and high-intensity levels usually elicit ceiling levels of performance, with the longest reaction time to identify facial expressions being seen around mid-intensity level. Reference Harmer, Bhagwagar, Perret, Vollm, Cowen and Goodwin50,Reference Harmer, Perret, Cowen and Goodwin51 Such ambiguous social signals may be particularly relevant for problematic social interaction and, experimentally, for differentiating group differences. The current findings were also obtained from direct contrast between positive and negative emotional stimuli, which avoided potential confounds linked to the interpretation of neutral stimuli.
Limitations
A number of limitations also need to be considered in the evaluation of these results. First, the generalisation of the current finding is limited by the relative small sample and these results need to be replicated. The current study also specifically investigated the emotional processing of fearful and happy expressions, which have been previously shown to be affected by depression and its treatment. Reference Sheline, Barch, Donnelly, Ollinger, Snyder and Mintun5,Reference Harmer, Mackay, Reid, Cowen and Goodwin52 However, future studies may also wish to examine responses to other negative facial expressions including sadness that have also been used in studies of individuals with depression. Reference Surguladze, Young, Senior, Brebion, Travis and Philips3,Reference Gollan, Pane, McCloskey and Coccaro4,Reference Fu, Williams, Cleare, Brammar, Walsh and Kim7 Finally, although high neuroticism is a robust risk factor for depression, the relatively low prevalence rates of depression imply that only a small proportion of the high-N group will go on to develop depression, thereby potentially diluting any effects that we may have seen. Longitudinal studies are required to assess the predictive power of negative biases for subsequent depression in a sample adequately powered for the detection of infrequent events.
In conclusion, our results illuminate the role for a distributed neural network, including the fusiform gyrus and amygdala, in facial expression processing biases in individuals at high risk for developing major depression. These areas overlap with those thought to be important in depression and those targeted by antidepressant drug administration. Reference Sheline, Barch, Donnelly, Ollinger, Snyder and Mintun5,Reference Fu, Williams, Cleare, Brammar, Walsh and Kim7,Reference Fu, Williams, Brammer, Suckling, Kim and Cleare12 Longitudinal studies are underway to estimate whether, and to what extent, this aberrant neural behaviour predicts onset of depression.
Acknowledgements
This work was supported by the Stanley Medical Research Institute and the Medical Research Council. S.W.Y.C was supported by the Esther Yewpick Lee Millennium Scholarship and the Hruska Scholarship. R.N. is supported by a grant from the Medical Research Council.




eLetters
No eLetters have been published for this article.