

Introduction
Glaciers adjust their length, area, thickness and volume in response to temperature and precipitation changes over periods of years to decades (Reference Dyurgerov and MeierDyurgerov and Meier, 2000; Reference BarryBarry, 2006; Reference PeltoPelto, 2006). These changes affect the important freshwater resources that these glaciers already provide. As ice is lost or gained during these adjustments, meltwater is stored and later released for use in aquatic and alpine ecosystems, irrigation, industry, hydropower and consumption, eventually contributing to sea-level rise (Reference Granshaw and FountainGranshaw and Fountain, 2006; Reference Stahl and MooreStahl and Moore, 2006; Reference MooreMoore and others, 2009). The Columbia Icefield, in the Canadian Rocky Mountains, plays a significant role as a water resource because it is situated on a triple water divide. Meltwater from the glaciers flows into the Athabasca, Saskatchewan and Columbia watersheds, which drain, respectively, to the Arctic, Atlantic and Pacific oceans. The Columbia Icefield also has economic importance as a major tourist attraction in Jasper and Banff national parks, with millions of people visiting the icefield each year (Parks Canada Agency, 2011).
The environmental and economic importance of the Columbia Icefield, in addition to its relative ease of access, has drawn people to document changes of its outlet glaciers for more than 100 years. Mountaineers and surveyors were the first to measure the retreat of Athabasca, Saskatchewan and Columbia glaciers (Reference MeekMeek, 1948; Reference HeusserHeusser, 1956; Reference Denton and FieldDenton, 1975). They recorded changes in glacier length, and in some cases thickness and width. However, only a few studies estimated area and elevation change, and these studies were primarily limited to the ablation areas of the glaciers (Reference KonecnyKonecny, 1964; Reference Kite and ReidKite and Reid, 1977; Reference Reynolds and YoungReynolds and Young, 1997). The Water Survey of Canada monitored Saskatchewan and Athabasca Glaciers from the 1940s to the 1980s by mapping the glaciers and calculating changes in terminus position, elevation and volume (Reference Reid and CharbonneauReid and Charbonneau, 1979; Reference LuckmanLuckman, 1986). With the advent of satellite imagery, such as Landsat in the 1970s, more glaciers of the Columbia Icefield are being monitored for area and volume change (Reference Schiefer, Menounos and WheateSchiefer and others, 2007; Reference Demuth and BonardiDemuth and others, 2008; Reference Bolch, Menounos and WheateBolch and others, 2010). However, long-term time series in glacier length, area and volume are needed to properly evaluate the response of these glaciers to changes in climate.
The primary objective of this study is to use Interprovincial Boundary Commission Survey (IBCS) maps from 1919 in conjunction with aerial photographs from 1948 to 1993 and satellite imagery from 1999 to 2009, to extend, spatially and temporally, measured glacier changes to other glaciers of the Columbia Icefield. We use sequential analysis of glacier extents and elevation data to calculate length, area, elevation and volume changes of glaciers of the Columbia Icefield, including accumulation areas. We compare these changes to temperature and precipitation anomalies from 1919 to 2009.
Study area
The Columbia Icefield straddles the Continental Divide along the Alberta–British Columbia (BC) border (Fig. 1). Elevations range from 1000 to 3700 m a.s.l., with a mean elevation of ∼2300 m a.s.l. At low elevation, the region is characterized by an Engelmann–Spruce–Subalpine Fir ecosystem, giving way to alpine tundra above ∼2250 m a.s.l. (Reference HeusserHeusser, 1956; Reference Meidinger and PojarMeidinger and Pojar, 1991). The climate is characterized by long winters and short summers, with low temperatures and large amounts of precipitation falling primarily as snow (Reference Meidinger and PojarMeidinger and Pojar, 1991). Mean annual temperature and total annual precipitation of the Columbia Icefield are −4.0°C and 1277 mm, respectively, between 1919 and 2009. The icefield is subject to both maritime polar air masses from the west, bringing cyclonic storms between September and June, and continental polar air masses from the east, particularly during winter (Reference HeusserHeusser, 1956; Reference HenochHenoch, 1971).
The Columbia Icefield, Canadian Rocky Mountains. Glaciers encompassed by the orange flowsheds are the focus of this study and are listed in Table 1 by the numeric labels. The image is a SPOT 5 scene from 30 August 2009.
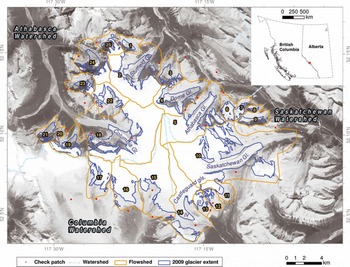
This study focuses on 25 glaciers of the Columbia Icefield based on glacial drainage basins, referred to in this paper as flowsheds (Fig. 1). Glaciers include individual ice bodies and outlet glaciers, some of which have significant icefalls and are fed by avalanching (Table 1). The main outlet glaciers draining the icefield are Columbia to the west, Saskatchewan and Athabasca to the east, Castleguard IV to the south, and Stutfield to the north. Total ice cover was 216 km2 in 2001 (Reference Bolch, Menounos and WheateBolch and others, 2010). The majority of glaciers face north to east.
Properties of glaciers of the Columbia Icefield by flowshed, where L is length, A is area, ![]() is mean elevation, ElMd is median elevation, Elmin is minimum elevation, and Elmax is maximum elevation. Values are calculated from 1999 and 2009 data
is mean elevation, ElMd is median elevation, Elmin is minimum elevation, and Elmax is maximum elevation. Values are calculated from 1999 and 2009 data

Methods
Data sources and preparation
We used digital copies of three IBCS maps (#21–23) produced between 1918 and 1920 (Table 2), obtained from Library and Archives Canada. Terrestrial photographs of the Columbia Icefield, taken during the survey of the Alberta– BC border, primarily in 1919, were used to create the maps through phototopographic methods (Alberta and British Columbia Boundary Commission, 1917). The maps have a scale of 1: 62500 and a contour interval of 100 ft. We rectified the maps in PCI Geomatica OrthoEngine v.10.2 using a fifth-order polynomial transformation and 34–36 ground control points (GCPs) on mountain ridges and small lakes from Landsat imagery, a shaded relief model (hillshading) generated from the BC Terrain Resource Information Management (TRIM) digital elevation model (DEM), and the BC TRIM lake extents. The BC TRIM data have a horizontal error of ±10 m and a vertical error of ±15 m (BC Ministry of Environment, 1992). The average root-mean-square errors (RMSEs) in the easting (x) and northing (y) of the three map sheets are, respectively, 17.5 and 13.5 m, yielding a total RMSE of 22.1 m.
Data used for glacier change analysis (AP = aerial photograph)

We included aerial photographs from 1948, 1955, 1966, 1970, 1974, 1979, 1986 and 1993 to supplement the geodetic data contained in the interprovincial maps (Table 2). Digital copies of diapositives or negatives of the photographs, photogrammetrically scanned at a resolution of 12–14 μm, were obtained from the Canadian National Air Photo Library and the BC Ministry of Forests, Lands and Natural Resource Operations. The photographic scales range from 1 : 24 000 to 1 : 80 000. Contrast in the snow-covered accumulation areas was poor for the 1948 and 1955 photographs, but satisfactory for other years.
Most of the photographs were taken near the end of the ablation season, from 6 August to 18 September, except for the aerial photographs acquired on 9 July 1979. Those photographs have late-lying snow which can obscure glacier extents. The photographic coverage is complete for most years, with only a few of the smaller glaciers of the Columbia Icefield missing in some years. The 1986 aerial photographs are BC TRIM aerial diapositives with triangulation points (PUG points) projected in North American Datum 1983 (NAD83) Universal Transverse Mercator (UTM) zone 11. We used 61 PUG points as GCPs to rectify these photos. We built stereo models using the VR Mapping photogrammetry software suite from Cardinal Systems. Pass points were collected between photographs to tie the images together. We ran a block adjustment to rectify the photographs and produced an exterior orientation file to create reference stereo models. On stable bedrock or stationary boulders, free of vegetation and snow, we collected 22–36 GCPs from the 1986 stereo models to rectify the other seven years of photography. The GCPs were distributed over a range of elevations and across the stereo imagery. Where possible, the same set of GCPs was used to enhance co-registration of the stereo models and minimize error on slopes where a small horizontal offset could result in a large elevation difference (Reference Schiefer and GilbertSchiefer and Gilbert, 2007; Reference Schiefer, Menounos and WheateSchiefer and others, 2007). We collected pass points, ran bundle adjustments, created exterior orientations, and built stereo models for the remaining years of photography. The average RMSE values for the rectified aerial photographs in the easting (x), northing (y) and elevation (z) were 0.51, 0.54 and 0.10 m, respectively. The average RMSE for the stereo models was 0.32 m.
For 21st-century glacier extents, we used a rectified Landsat 5 Thematic Mapper (TM) image with a resolution of 30 m, captured on 14 September 2001 (Table 2) and obtained from the BC Ministry of Forests. We also used the Shuttle Radar Topography Mission (SRTM) DEM from February 2000, obtained from the US Geological Survey website (http://dds.cr.usgs.gov/srtm/), for glacier elevations. As radar can penetrate winter snow cover over glaciers, the DEM is representative of the ablation surface at the end of the 1999 ablation season (Reference Schiefer, Menounos and WheateSchiefer and others, 2007). The DEM has a vertical accuracy of ∼10 m (Reference FarrFarr and others, 2007). We reprojected the DEM to NAD83 UTM zone 11 and resampled it to a resolution of 100 m. Error introduced by resampling is estimated at 0.5 m and radar penetration is estimated at up to 1.5 m in the accumulation area based on methods described by Reference Gardelle, Berthier and ArnaudGardelle and others (2012). Some areas of the icefield, primarily steep terrain, have no data due to radar layover and shadowing (Reference Granshaw and FountainGranshaw and Fountain, 2006). The terminal lake of Columbia Glacier also has no data. The most recent imagery covering the Columbia Icefield available for this study was two SPOT 5 (Satellite Pour l’Observation de la Terre) images with a resolution of 2.5 m, acquired on 20 August and 30 August 2009 (Table 2). These images form a stereo pair from which elevation data were extracted. The images have good contrast in the accumulation areas and no snow cover on the glaciers. Using PCI Geomatica OrthoEngine v.10.3, we rectified the SPOT 5 imagery using the same set of GCPs and methods used to rectify the aerial photographs. Tie points (same as pass points) were collected between the images, and a least-squares bundle adjustment was run. The RMSEs in the easting (x) and northing (y) were, respectively, 1.1 and 1.3 m.
A 20 m DEM was automatically extracted from the SPOT 5 stereo pair using a correlation-based image-matching algorithm. This identifies similar patterns of pixels between images and determines the elevation based on parallax (Reference Berthier, Arnaud, Kumar, Ahmad, Wagnon and ChevallierBerthier and others, 2007; Reference Schiefer and GilbertSchiefer and Gilbert, 2007). The model failed in areas of low contrast, primarily those with fresh snow cover and shadows (Reference Berthier, Arnaud, Kumar, Ahmad, Wagnon and ChevallierBerthier and others, 2007; Reference Schiefer, Menounos and WheateSchiefer and others, 2007). A correlation coefficient image was created along with the DEM, containing values ranging from 0 to 100 (perfect correlation). We used this image to remove pixels with a score less than 70, a threshold delimiting areas of poor contrast (Reference Tennant, Menounos, Ainslie, Shea and JacksonTennant and others, 2012). A 2.5 m resolution orthoimage was also created for 2009 using the rectified SPOT 5 images and the DEM.
Data collection
Using ArcGIS v.9.3, we digitized glacier extents from the rectified 1919 IBCS maps, the 2001 Landsat 5 TM image and the 30 August 2009 SPOT 5 orthoimage. All data were projected to NAD83 UTM zone 11. For the aerial photographs, we digitized glacier extents from the stereo models using the VR Mapping photogrammetry suite. The snowline and debris cover were also digitized where present.
There were two main problems with the 1919 extents: some glaciers along the east side of the icefield were cut off by the edge of the map and some of the outlines appeared inconsistent with subsequent extents and the topography. We used 1919 oblique terrestrial photographs in conjunction with the 1948 and 1955 aerial photographs to produce glacier polygons for these glaciers.
Late-lying snow in the 1979 photographs and supraglacial debris in all imagery hindered delineation of some glaciers. Observed thinning between the years of aerial photographs helped delimit areas of debris-covered ice.
The glaciers were divided into 25 flowsheds (FS; Fig. 1). The flowsheds are from glacier drainage basins in the western Canada glacier inventory, created through hydrological analysis of DEMs, detailed in Reference Bolch, Menounos and WheateBolch and others (2010). We modified the extents of the flowsheds to include the 1919 glacier extents and to separate a few glaciers into individual flowsheds. We also digitized glacier lengths for the main glaciers, but not tributary glaciers, in each flowshed. To determine glacier lengths, flowlines were digitized from the highest point of the glacier, down to the center of the glacier terminus, perpendicular to the contours (Reference PaulPaul and others, 2009).
We digitized contours from the IBCS maps, reprojected them and created a DEM with a resolution of 100 m. The IBCS DEM was interpolated from the contours using the ‘Topo to Raster’ tool in ArcGIS v.9.3 which produces a hydrologically correct surface. There were no contours for the lowest 3.5% of the termini of Hilda (FS9) and Saskatchewan (FS10) Glaciers, so elevations could not be calculated for these areas. Mean elevation change over periods with the 1919 data were calculated for these flowsheds using available 1919 elevation points. We compared these values with mean elevation change from 100 m elevation bands, as data were available for each band. The mean elevation changes were comparable (<1 m) and within error. We manually digitized elevation points from the stereo models using the VR Mapping photogrammetry suite. Elevation points were collected on a 100 m grid in the same location for all years. A 200 m grid was used in the accumulation area and on snow cover where there is low contrast and elevations are more difficult to determine. Over 150 000 points were collected in total. We extracted elevations from the IBCS, SRTM and SPOT 5 DEMs at the same points as on the aerial photographs. The elevation points were also divided into the flowsheds for analysis.
Glacier change analysis
We determined changes in length, area and elevation by differencing sequential data for each glacier flowshed over ten periods: 1919–48, 1948–55, 1955–66, 1966–70, 1970–74, 1974–79, 1979–86, 1986–93, 1993–2000 and 2000–09. Where data are missing due to lack of coverage, we differenced data from one year with the next year of available data, creating a new period (e.g. 1955–70). In order to create a comparable dataset for each flowshed, we calculated the rate of glacier change over the new period (e.g. 1955–70) and used it to estimate the change over the two encompassed periods (e.g. 1955–66 and 1966–70).
We calculated elevation change for each elevation point. The distributions of elevation change of the Columbia Icefield are approximated by a Gaussian curve. Changes greater than three standard deviations were considered outliers and removed from analysis (Reference Berthier, Arnaud, Baratoux, Vincent and RémyBerthier and others, 2004). The changes were converted to water equivalent values assuming a density of 550 kg m−3 for points in the accumulation area and 900 kg m−3 for points in the ablation area (Reference Schiefer, Menounos and WheateSchiefer and others, 2007). The elevation separating the accumulation and ablation areas was determined from the mean snowline elevations of the years constituting the period.
We calculated mean length and elevation change of the entire Columbia Icefield as the mean value of all the flowsheds for each period. We summed the area change in all of the flowsheds for each period to determine the total change in the icefield. We calculated the volume change for each flowshed by multiplying the mean elevation change by the largest area of the flowshed over the period to account for glacier advance. Total volume change for the Columbia Icefield was determined by summing volume change from all of the flowsheds for each period.
Error analysis
Error in length measurements was based on the combined mean horizontal RMSE and one-half of the resolution of each year of data (Table 3). We added an additional error term for offset between the IBCS maps (24 m) and snow cover in the 1979 photographs (5 m). Calculated error in glacier extents represents the area of buffers surrounding each glacier, with a distance equal to the length error. This method is similar to that proposed by Reference Granshaw and FountainGranshaw and Fountain (2006) and Reference Bolch, Menounos and WheateBolch and others (2010). Errors in length and area change (E Δ), respectively, were calculated by combining the length or area error terms from the early year (E 1) and the later year (E 2) of a period using
Error estimates used in the glacier analysis

We determined systematic and random elevation errors by analyzing elevation change between two years on stable, non-vegetated, non-glaciated areas where no elevation change was expected (Reference Schiefer and GilbertSchiefer and Gilbert, 2007). Depending on the image coverage, we collected 14–26 check patches of 25 points (5 × 5 points on a 10 m grid) (Fig. 1). Some patches had high elevation changes, but were located on steep slopes where small horizontal errors can result in large vertical errors (Reference Cox and MarchCox and March, 2004; Reference Schiefer and GilbertSchiefer and Gilbert, 2007). We looked for systematic errors (bias) in elevation, slope, aspect, latitude and longitude, arising from rectification inaccuracies that had to be corrected for valid results. We created linear models describing these biases and removed them from the elevation data where present (Fig. 2). The standard deviation (±1 σ) of the check patches represents the random error in the elevation data. We used Eqn (1) to combine the systematic (E 1) and random errors (E 2) for a total error term.
(a) Systematic bias with slope in the 1966 elevation data. We fit a linear model (dashed line) to the data to remove the bias (b).
Absolute error (Table 3), or elevation accuracy with the datum (NAD83), was determined by differencing elevation data with the 1986 reference data (Fig. 3a). The elevation data were not adjusted to account for different acquisition times of the imagery or emergence, because no mass-balance data were collected on the Columbia Icefield to compare with or to model adjustments, and the values are typically negligible for glacier-wide measurements (Reference Andreassen, Elvehøy and KjøllmoenAndreassen and others, 2002; Reference Cox and MarchCox and March, 2004). Ablation adjustments from Gulkana Glacier, Alaska, (Reference Cox and MarchCox and March, 2004) are no greater than −0.5 m, which falls within our calculated error for the elevation data. For relative error (elevation change error), we applied the same methods between two subsequent years (Fig. 3b). Using Eqn (1), we included a 0.5 m w.e. error term (E 3) to account for changes in the density profile (Reference Andreassen, Elvehøy and KjøllmoenAndreassen and others, 2002; Reference Cox and MarchCox and March, 2004) and a 5 m w.e. error term (E 4) for the accumulation-area elevation points to represent the uncertainty due to low contrast (Reference Tennant, Menounos, Ainslie, Shea and JacksonTennant and others, 2012). We calculated volume change error using standard error propagation methods:
(a) Absolute elevation differences from check patches between an individual year and the 1986 reference data. (b) Relative elevation differences from check patches between two sequentially differenced datasets. Boxes represent the first and third quartiles with the horizontal black line as the median. The whiskers represent the data extremes (5th and 95th percentile), and the circles are outliers (data outside the 5th and 95th percentiles).

Where E ΔV is the volume change error, ΔH is mean elevation change, E ΔH is the elevation change error, A is the area of the glacier extent used to calculate volume change and EA is the area error.
Temperature and precipitation data
We extracted monthly minimum, mean and maximum temperatures, as well as precipitation, from 1919 to 2009 from the ClimateWNA v.4.62 program, which can be downloaded at http://www.genetics.forestry.ubc.ca/cfcg/ClimateWNA/ClimateWNA.html. We also extracted data from years prior to 1919, back to 1901, in order to calculate lagged periods. The program extracts climate data at specific locations using bilinear interpolation and lapse-rate elevation adjustments to integrate and downscale historical anomaly surfaces and a baseline reference grid for the normal period 1961–90 (Reference Wang, Hamann, Spittlehouse and MurdockWang and others, 2012). More detailed information on the methodology behind the data-sets can be found in Reference Wang, Hamann, Spittlehouse and MurdockWang and others (2012). Climate consists of many different factors, such as radiation, humidity and wind, but we only focus on temperature and precipitation, as these data are available for the Columbia Icefield over the period 1919–2009.
We extracted data on a 1 km grid encompassing the Columbia Icefield. We averaged the data over the icefield and calculated the mean annual, ablation (May–September) and accumulation (October–April) season temperatures and total annual, ablation and accumulation season precipitation. We grouped the data into ten periods – 1919–48, 1948–55,1955–66,1966–70,1970–74,1974–79,1979–86, 1986–93, 1993–2000 and 2000–09 – and derived temperature and precipitation anomalies from the 1919–2009 mean. We calculated average anomalies for each period and correlated them with mean rates of length, area, elevation and volume change over the same periods. A response of a glacier to climate forcing can be immediate or delayed; a delayed response is expected, especially if the climate change affects mass accumulation (Reference Jóhannesson, Raymond and WaddingtonJóhannesson and others, 1989; Reference Beedle, Menounos, Luckman and WheateBeedle and others, 2009). To determine a possible delayed response between glacier change and temperature and precipitation anomalies, the temperature and precipitation periods were lagged up to 20 years. We lagged the start and end years of each period by 1–20 years and grouped the temperature and precipitation data into the new periods. The average anomalies for the lagged periods (n = 10) were correlated with the mean glacier change rates.
Results
Glacier change
Changes in glacier length, area, elevation, and volume for the period 1919–2009 indicate substantial recession and mass loss (Table 4). All glaciers retreated between 1919 and 2009 (Fig. 4). The glaciers retreated a mean distance of 115 ± 134 m at a rate of −12.8 ± 0.4 m a−1 (−0.28 ± 0.01% a−1) along their flowlines. Columbia Glacier (FS18) experienced the largest absolute retreat (3723 ± 34 m) but it terminates in a lake. Castleguard II (FS12) had the greatest relative length loss at 6911%. FS17 lost the least absolute (450 ± 34 m) and relative (12 ± 1%) length.
Glacier changes of the Columbia Icefield. Mean and total values represent icefield-wide changes

Area and elevation change of the Columbia Icefield, 1919–2009. The numbers refer to the flowsheds listed in Table 1.

In 1919, the area of the Columbia Icefield was 265.1 ± 12.3 km2. By 2009, the icefield had lost 59.6 ± 1.2 km2 at a rate of −0.66 ± 0.01 km2 a−1 (−0.25 ± 0.06% a−1). Mean glacier area change was −2.4 ± 0.2 km2, with a mean rate of −0.026 ± 0.003 km2 a−1 (−0.37 ± 0.07% a−1). Saskatchewan Glacier (FS10) experienced the greatest absolute area loss at 10.1 ± 0.6 km2, and Castleguard II (FS12) lost the greatest relative area at 74 ± 18%. The smallest absolute and relative area losses were at FS8 (0.3 ± 0.1 km2) and Stutfield Glacier (FS2; 10 ± 1%), respectively.
Glaciers of the Columbia Icefield thinned, on average, 49 ± 25 m w.e. from 1919 to 2009, at a rate of −0.6 ± 0.3 m w.e. a−1. FS24 experienced the most thinning (92 ± 24 m w.e.), and FS23 thinned the least (12 ± 24 m w.e.). Spatially, thinning was greatest at lower elevations, near the center flowline, and close to the 2009 terminus position (Fig. 4). Thickening near some of the icefalls is likely due to map rectification and contour interpolation which amplify elevation change (Reference Koch, Menounos and ClagueKoch and others, 2009).
Total volume change of the Columbia Icefield was −14.3 ± 2.0 km3 w.e. at a rate of −0.16 ± 0.02 km3 w.e. a−1. Mean volume change of individual glaciers was −0.6 ± 0.4 km3 w.e., and the mean rate of ice loss was −0.006 ± 0.005 km3 w.e. a−1. Saskatchewan Glacier (FS10) lost the greatest volume (2.8 ± 1.2 km3 w.e.), whereas FS8 lost the least volume (0.02 ± 0.02 km3 w.e.). We found that glacier volume change rates were correlated with elevation.
Glacier change over time
Some of the highest rates of glacier retreat and shrinkage, and the highest rates of elevation and volume loss, occurred in the earliest period, 1919–48 (Fig. 5). Ice loss decreased to minimum values during the periods 1970–74 and 1974–79. Rates of glacier change in these two periods are near zero, as ice loss decreased and some glaciers advanced, increased in area, thickened and gained volume. The Columbia River watershed glaciers show an increase in length from 1955 to 1979, as well as increases in area, elevation and volume during the 1970s, while glaciers in the other watersheds mainly experienced decreases in ice loss. From 1979 to 1993, rates of elevation and volume loss again increased, before decreasing from 1993 to 2009. The rates of retreat and area loss were more variable, increasing for the period 1979–86, decreasing from 1986 to 2000, and increasing to the highest rates during the period 2000–09.
Rates of change of (a) length, (b) area, (c) elevation and (d) volume over each period from 1919 to 2009.

Glacier change by type
We compared glacier changes over the period 1919–2009 between size classes (<1, 1–5, 5–15, 15–30 and 30– 50 km2), glacier types and type of debris cover (Table 1). Absolute retreat, shrinkage and volume loss are greatest for large glaciers (30–50 km2), whereas relative retreat and area loss have the opposite trend and are greatest for small glaciers (<1 km2). We also calculated changes in mean elevation and slope for each size class from 1919 to 2009. A trend of increasing mean elevation exists for all size classes, except for the smallest size class (<1 km2) which showed a decreasing trend. However, the smallest size class only has two glaciers and incomplete coverage for some years, so we are not confident in this trend. Area-averaged glacier slopes also steepened for all size classes. The trend was greatest in the <1 km2 class, but given the small sample size, the confidence of this trend is low. The second greatest trend was in the 30–50 km2 class, with an increase in slope of 5°. We observed no significant changes in glacier aspect.
We classified glacier types into five groups: outlet glaciers, outlet glaciers with icefalls, avalanche-fed outlet glaciers with icefalls, detached glaciers and avalanche-fed detached glaciers (Table 1). Outlet glaciers are directly connected to the icefield, while detached glaciers are not, but they may still receive nourishment from the icefield through avalanching. Outlet glaciers have greater absolute ice losses, but lower relative losses than detached glaciers. Among the outlet glaciers, those with icefalls thinned the most and lost the greatest volume.
In 2009, ∼70% of the Columbia Icefield glaciers have a portion of their surface covered in debris: 50% have debris-covered termini and the other 20% have debris-covered sides. Glaciers with debris-covered sides experienced the greatest absolute length, area, elevation and volume losses, but witnessed the lowest relative length and area losses. Low absolute length and area losses occurred for glaciers with debris-covered termini, but they experienced greater elevation loss than glaciers with no debris cover (bare ice).
We also explored area and elevation changes of debris-covered glaciers by determining percent debris cover and elevation change on debris-covered and bare ice for flowsheds with prominent debris cover. Due to variations in the snow cover between the imagery, we only determined changes for 1948, 1993 and 2009, when snow conditions and acquisition dates are similar. For Boundary (FS7), Columbia (FS18), Manitoba (FS19) and FS23, we used 1955 and 1966 data to calculate the changes, because of incomplete photographic coverage in 1948.
From 1948 to 1993, percent debris cover on the Columbia Icefield remained the same (12.2 ± 0.1%), but debris cover decreased (9.8 ± 0.1%) from 1993 to 2009. Debris on the majority of glaciers with debris-covered termini increased from 1948 to 1993, but decreased from 1993 to 2009, while debris on glaciers with debris-covered sides continuously decreased over the period 1948–2009.
Annual thinning rates below debris-covered ice are generally 30–60% lower than on bare ice, especially at low elevations (Fig. 6). At higher elevations (2500 m a.s.l.), there is an apparent transition to greater thinning rates under debris-covered ice than on bare ice. This pattern is evident on glaciers with debris-covered sides, such as Athabasca Glacier (FS5) and Castleguard IV (FS14; Fig. 6a and b). Some glaciers with debris-covered termini, such as Stutfield Glacier (FS2; Fig. 6c), show a similar pattern, whereas others such as FS24 have greater thinning rates under debris-covered ice (Fig. 6e). A few of the small glaciers with debris-covered termini (e.g. FS1 (Fig. 6f)) have few elevation bands where both debris-covered and bare ice exist, so debris-dependent elevation changes are difficult to establish. On individual glaciers, the difference between thinning rates of debris-covered ice and bare ice is greatest on glaciers with debris-covered sides (e.g. Saskatchewan Glacier).
Elevation change rates of debris-covered and bare ice for glaciers with (a, b) debris-covered sides and (c–f) debris-covered termini.

Temperature and precipitation
Ablation season temperature trends differed between maximum, mean and minimum temperatures (Fig. 7a–c). Maximum ablation season temperature decreased until 1979, while mean ablation season temperature increased until 1970, then decreased until 1979. Both maximum and mean ablation season temperatures increased following 1979. Minimum ablation season temperature generally increased between 1919 and 2009. Accumulation season temperatures are highly variable for most periods and follow similar trends for maximum, mean and minimum temperatures. These temperature anomalies increased after 1979 and remain ∼1°C above the 1919–2009 average after 1986, with minimum temperature decreasing slightly in the first decade of the 21st century. Annual temperature anomalies are similar to accumulation season temperature anomalies, but are less variable.
Annual, ablation (May–September) and accumulation season (October–April) temperature and precipitation anomalies at the Columbia Icefield for each period between 1919 and 2009. The climatic mean is based on the period 1919–2009.

Ablation season precipitation anomalies are less variable than accumulation season and annual precipitation anomalies. Ablation season precipitation increased between the periods 1919–48 and 1948–55, and from 1970 to 1993. There is a general decreasing trend in precipitation from 1948 to 1970 and after 1993 (Fig. 7d). Accumulation season precipitation increased until 1974, and then significantly decreased between 1974 and 1986. Precipitation increased again from 1986 to 2000, before decreasing during the period 2000–09. Annual precipitation anomalies are similar to accumulation season precipitation anomalies, with a more pronounced decrease in precipitation in the most recent period.
To examine the influence of these temperature and precipitation changes on observed glacier changes, we correlated mean rates of length, area, elevation and volume change for the Columbia Icefield with mean temperature and precipitation anomalies calculated over ten periods lagged 0–20 years. Mean annual and accumulation season temperature anomalies over periods lagged 1–5 years correlate most strongly with rates of length and area change (−0.65 > r > −0.91; p < 0.05). Annual and accumulation season precipitation anomalies over periods lagged 2–8 years with length change rates and 5–7 years with area change rates have the largest significant correlations (0.63 < r < 0.87 and 0.65 < r < 0.71, respectively; p < 0.05).
Rates of elevation and volume change correlate significantly with maximum ablation season temperature anomalies over periods lagged 12–18 years (0.64 < r < 0.78; p < 0.05). More significant correlations (p < 0.01) occur with precipitation anomalies. The largest correlations are with annual and accumulation season precipitation anomalies over periods lagged 1–9 years for elevation change rates (0.77 < r < 0.86) and 2–10 years for volume change rates (0.77 < r < 0.86). Rates of elevation and volume change are also correlated with ablation season precipitation over periods lagged 5–6 years (r = 0.80, p < 0.01).
Glacier change is strongly related to annual temperature and precipitation. For annual temperature, maximum temperature anomalies have the highest correlations with rates of length (r = −0.912, p < 0.01) and area (r = −0.762, p < 0.05) change over periods lagged 3 years. Annual precipitation anomalies are correlated with length (r = 0.847, p<0.01) and area (r = 0.684, p<0.01) change rates over periods lagged 7 years. Elevation change rates have the highest correlation with annual precipitation anomalies over periods lagged 4 years (r = 0.855, p < 0.01).Volume change rates also have the highest correlation with annual precipitation anomalies, but lagged over periods lagged 5 years (r = 0.860, p < 0.01).
Discussion
Glacier change
Glaciers of the Columbia Icefield retreated a mean distance of 1150 ± 34 m and decreased in area by 2.4 ± 0.2 km2 on average between 1919 and 2009. Over this period, total area loss was 59.6 ± 1.2 km2; combined with a mean elevation change of −49 ± 25 m w.e., the icefield lost 14.3 ± 2.0 km3 w.e. The greatest thinning occurred at mid-glacier 1919 positions, along the center flowline (Fig. 4). At the lowest elevations near the 1919 terminus, thinning was limited by the ice available for melting; this ice disappeared as the glaciers retreated (Reference Koch, Menounos and ClagueKoch and others, 2009; Reference Berthier, Schiefer, Clarke, Menounos and RémyBerthier and others, 2010; Reference Tennant, Menounos, Ainslie, Shea and JacksonTennant and others, 2012).
There has been apparent thickening in the accumulation areas and at the terminus of some glaciers. Certain parts of the accumulation area may be more favorable for snow accumulation than others, and, at the terminus, sediment and debris may be deposited within the former 1919 glacier extent as the glaciers retreated. Errors arising from poor contrast, low point density, and errors in the accumulation area contours (Reference Andreassen, Elvehøy and KjøllmoenAndreassen and others, 2002; Reference Berthier, Schiefer, Clarke, Menounos and RémyBerthier and others, 2010) make this thickening suspect. Most instances of thickening occur on icefalls. These steep areas are subject to large elevation errors if there is a small horizontal shift between the elevation data. The IBCS maps and imagery were rectified using a different set of GCPs, which may account for horizontal shifts between the data (Reference Andreassen, Elvehøy and KjøllmoenAndreassen and others, 2002).
Previous studies on glaciers of the Columbia Icefield primarily focused on the retreat of the main glaciers, Athabasca, Columbia and Saskatchewan, and some of the smaller glaciers, such as Dome, Manitoba, Stutfield and Boundary glaciers, from the mid-19th century to the 1970s. Our values of retreat are within 30–40m of the data published by Reference MeekMeek (1948), Reference HenochHenoch (1971), Reference Denton and FieldDenton (1975), Reference Kite and ReidKite and Reid (1977), the Water Survey of Canada in Reference LuckmanLuckman (1986), and Reference Reynolds and YoungReynolds and Young (1997). The rates of retreat measured on Athabasca Glacier from 1919 to 1948 (Reference Kite and ReidKite and Reid, 1977) and Saskatchewan Glacier from 1953 to 1963 (Reference Denton and FieldDenton, 1975) were 20 and 25 m a−1, respectively, which are comparable to our calculated rates of 2 ± 1 and 29 ± 1 m a−1 over similar periods.
Few published estimates of area loss exist for glaciers of the Columbia Icefield. Reference HenochHenoch (1971) concluded that total glacier area in the North Saskatchewan River watershed decreased 10% from 1948/51 to 1966, and Reference Demuth and BonardiDemuth and others (2008) calculated a total glacier area loss of 22% in the North Saskatchewan River watershed between 1975 and 1998. Our area changes for Columbia Icefield glaciers within this watershed over similar periods are only 4% and 10%, respectively. Contributions from other glaciers in the watershed with greater area change may account for the difference in area loss. Reference Bolch, Menounos and WheateBolch and others (2010) calculated a rate of area loss of 0.67 ± 0.19% a−1 for the entire southern Canadian Rocky Mountains from 1985 to 2005, comparable to our rate of 0.6% a−1 for the Columbia Icefield from 1986 to 2009.
Prior to our study, elevation and volume change estimates are only available for Saskatchewan, Athabasca and Columbia glaciers. Our thinning values tend to be lower, and our volume loss values higher, than published data (Reference KonecnyKonecny, 1964; Reference Kite and ReidKite and Reid, 1977; Reference Reid and CharbonneauReid and Charbonneau, 1979; Reference Reynolds and YoungReynolds and Young, 1997); reasons for these differences are unknown but may include differences in the glacier area being studied. For example, previous studies are based on measurements from the ablation area only, whereas we included the accumulation area, which reduces glacier-wide thinning values. Although our thinning values are less than those of previous researchers, they are applied over a larger area, resulting in greater volume loss, especially because the accumulation area is proportionally larger than the ablation area. Reference Reynolds and YoungReynolds and Young (1997) calculated a total volume loss of 0.23 km3 in the ablation area of Athabasca Glacier (excluding debris cover) between 1919 and 1979. Our total volume loss for the period 1919–79 is 0.97 ± 0.45 km3. By dividing both volume estimates by the areas they represent (i.e. ablation area for the Reference Reynolds and YoungReynolds and Young (1997) estimate and total glacier area for our estimate), the mean thinning values are similar within error at 57 and 45m, respectively. Reference Denton and FieldDenton (1975) reports thinning on Columbia Glacier of −90 to −105 m between 1919 and 1948, similar to thinning values we observed in the ablation area on Columbia Glacier over a similar period.
The only long-term mass-balance data from the Canadian Rocky Mountains are from Peyto Glacier (Demuth and others, 2009, http://pathways.geosemantica.net/GetObject. ashx?id=15f028db-a6f9-4ae8-9b14-802ad013844c). We grouped these data into periods matching our glacier change data and compared them to the geodetic balance of glaciers of the Columbia Icefield. Most of the glaciers show a similar pattern to Peyto Glacier, but only Saskatchewan Glacier has a similar cumulative net balance record (Fig. 8). The cumulative geodetic balances of the other Columbia Icefield glaciers are generally less negative.
Peyto Glacier cumulative net mass balance 1966–2007 (Demuth and others, 2009, http://pathways.geosemantica.net/GetObject.ashx? id=15f028db-a6f9-4ae8-9b14-802 ad013844c), compared with cumulative net geodetic balance of glaciers of the Columbia Icefield from 1966 to 2009.

Glacier change by type
The larger glaciers of the Columbia Icefield have higher absolute losses than smaller glaciers. These glaciers have more ice available for melt, have lower mean elevations and tend to be directly connected to the icefield. A combination of reduced ice flux from the icefield and strong negative mass balance at the surface can produce high thinning rates and high absolute ice losses. Small glaciers had greater relative length and area changes, probably because they do not have large unchanging accumulation areas and receive less nourishment than some of the larger glaciers (Reference Granshaw and FountainGranshaw and Fountain, 2006; Reference Bolch, Menounos and WheateBolch and others, 2010).
Outlet glaciers of the Columbia Icefield show greater ice losses than the detached glaciers. The detached glaciers are generally smaller, more heavily debris-covered and are nourished through avalanching or possibly wind-blown snow rather than directly from the icefield. Within the outlet glacier group, icefall outlet glaciers lost more ice than the non-icefall outlet glaciers. Heightened mass loss may be related to ice dynamics associated with steeply sloped ice or enhanced surface energy receipt in the vicinity of the icefall. Reference LuckmanLuckman (1986) noted a slower and smaller response on Dome Glacier than on neighboring Athabasca Glacier, which he attributed to differences in debris cover and accumulation areas.
Glaciers with debris-covered sides experienced the greatest ice loss, but they are also the largest outlet glaciers. Glaciers with debris-covered termini lost less length and area, but more elevation than clean ice glaciers. In their study on Stutfield Glacier, Reference Osborn, Robinson and LuckmanOsborn and others (2001) observed that, as the ice beneath the debris cover stagnates, terminus retreat slows. Meanwhile, supraglacial ponds and streams expose ice and enhance melt, increasing thinning.
Percent debris cover slightly increased for glaciers with debris-covered termini from 1948 to 1993, but debris cover decreased for all debris-covered glaciers between 1993 and 2009. We expected an increase in debris cover through a redistribution of debris from higher areas of thick debris (i.e. medial moraines) to lower areas of bare ice that rapidly melt (Reference Kirkbride and WarrenKirkbride and Warren, 1999). However, the up-glacier extent of the debris cover changed little while debris-covered termini retreated between 1993 and 2009, thus reducing the debris-covered area.
Individual glacier change depends on a variety of factors such as climate, topography, glacier size, type of glacier, source of nourishment, and debris cover (Reference MeekMeek, 1948; Reference PeltoPelto, 2006; Reference BolchBolch, 2007). Some of these factors complicate a glacier’s response to climate. Debris-covered or avalanche-fed glaciers, for example, can be disconnected from climatic inputs and will respond differently from clean or outlet glaciers (Reference Granshaw and FountainGranshaw and Fountain, 2006; Reference Hoffman, Fountain and AchuffHoffman and others, 2007).
Elevation change rates under debris cover
Thinning rates under debris cover differ according to the thickness of debris. Reference Mattson, Gardner and YoungMattson and others (1993) found that debris cover thinner than ∼0.01 m enhances ablation by absorbing more shortwave radiation, due to its lower albedo, and transferring it to the ice below. Once debris cover reaches a critical thickness, however, it acts as an insulator, reducing ablation. Debris cover can also increase surface air temperatures, contributing to enhanced ablation of thinly debris-covered ice, and possibly enhancing ablation on nearby bare ice (Reference Reid, Carenzo, Pellicciotti and BrockReid and others, 2012). On the Columbia Icefield, thinning rates were reduced 30–60% over the period 1949–2009. Shortwave radiation is absorbed by the debris, but the thickness of the debris prevents the transfer of heat to the ice below. The critical thickness ranges between 0.01 and 0.09 m and depends on the lithology, condition (wet or dry), continuity of the debris cover, and meteorological conditions (Reference Mattson, Gardner and YoungMattson and others, 1993; Reference Brock, Mihalcea, Kirkbride, Diolaiuti, Cutler and SmiragliaBrock and others, 2010).
We lack measurements of debris thickness, but the observed elevation change rates provide some insight into the relative thickness and distribution of debris (Fig. 6). Glaciers with debris-covered sides show the greatest difference in elevation change rates between debris-covered and bare ice. The debris cover appears continuous in aerial photographs, and the significantly reduced melt implies a thick layer of debris. However, at higher elevations the rates between debris-covered and bare ice are similar, and in some cases (e.g. Athabasca Glacier, FS5) thinning under debris cover has been greater than on bare ice. Reference Brock, Mihalcea, Kirkbride, Diolaiuti, Cutler and SmiragliaBrock and others (2010) noticed a similar enhancement of thinning under debris cover compared to bare ice near the upper limit of the debris sheet (2400 m a.s.l.) on Miage glacier, Italy, and attributed it to thin debris.
The difference in elevation change rates is not as large on glaciers with debris-covered termini. From the aerial photographs, we could see that the coverage of debris differed considerably, and supraglacial streams and ponds were present on some of the glaciers. The water can expose ice (Reference LuckmanLuckman, 1986), enhancing ablation especially on exposed ice cliffs. Mass wasting and horizontal retreat of these cliffs can cause large elevation changes over time. Also, variable debris cover leads to differential surface air temperatures and ablation, creating areas of reduced or enhanced melt and possibly exposing new ice surfaces (Reference LuckmanLuckman, 1986; Reference Reid, Carenzo, Pellicciotti and BrockReid and others, 2012). When these spatially variable ablation rates are averaged over the debris-covered glacier surface, it can lead to the smaller difference in elevation change rates between debris-covered and bare ice that we observed on glaciers with debris-covered termini.
Climatic factors and observed glacier change
Some of the highest rates of length, area, elevation and volume loss for glaciers of the Columbia Icefield occurred during the earliest period, 1919–48 (Fig. 7). Others documented substantial retreat of Saskatchewan, Columbia, Athabasca, Dome and some of their tributary glaciers from 1920 to 1950 (Reference HeusserHeusser, 1956; Reference Osborn and LuckmanOsborn and Luckman, 1988). Glaciers also rapidly retreated in the Premier Range in the Columbia River watershed during this time (Reference Luckman, Harding and HamiltonLuckman and others, 1987). These changes occurred during a period of warm, dry conditions following a period when glaciers reached their Holocene maximum extents between the mid-18th and 19th centuries (Reference Osborn, Robinson and LuckmanOsborn and others, 2001). Conditions favoring recession continued into the 1930s and 1940s (Reference Luckman and KavanaghLuckman and Kavanagh, 2000), with high maximum temperatures and low accumulation season precipitation.
From 1948 to the 1970s, rates of ice loss decreased and some glaciers advanced and thickened. Slowed retreat, standstills and some minor advances of the termini of glaciers of the Columbia Icefield and throughout the Canadian Rocky Mountains have been noted by other researchers (Reference HenochHenoch, 1971; Reference LuckmanLuckman, 1986; Reference Luckman, Harding and HamiltonLuckman and others, 1987; Reference Osborn and LuckmanOsborn and Luckman, 1988; Reference Luckman and KavanaghLuckman and Kavanagh, 2000; Reference Demuth and BonardiDemuth and others, 2008; Reference MooreMoore and others, 2009). Reference Luckman, Harding and HamiltonLuckman and others (1987) observed an advance of most glaciers in the Premier Range, which mirrors behavior of glaciers in the Columbia Icefield in the same watershed. These glaciers not only advanced, but increased in area, thickened and gained volume during the 1970s. Increased precipitation in the accumulation season, peaking in the period 1970–74, and a drop in maximum and mean temperatures drove these changes (Reference HenochHenoch, 1971; Reference Luckman, Harding and HamiltonLuckman and others, 1987; Reference Luckman and KavanaghLuckman and Kavanagh, 2000).
Glacier change rates are variable between 1979 and 2000, but the overall trend is one of ice loss. Elevation and volume loss increased until 1993 before starting to decrease, whereas length and area losses increased up to 1986 before decreasing. Reference Luckman and KavanaghLuckman and Kavanagh (2000) and Reference Demuth and BonardiDemuth and others (2008) also noted renewed recession, increased melt rates, reduced flow of mass from accumulation areas, and increased ice loss of glaciers in the Canadian Rocky Mountains after the late 1970s. These observations correspond with our observed decrease in precipitation anomalies during the period 1974–79, followed by an increase in 1986–93. Temperature anomalies peaked during the period 1986–93, which included some of the warmest years on record (Reference Luckman and KavanaghLuckman and Kavanagh, 2000), after which accumulation season temperatures decreased.
The highest average retreat and shrinkage rates occurred during the period 2000–09, and for some glaciers the rates were greater than during the period 1919–48. Reference Bolch, Menounos and WheateBolch and others (2010) reported an increase in the rate of area loss from 2000 to 2005. Precipitation anomalies decreased in both accumulation and ablation seasons after 2000, and temperature anomalies decreased, especially in the accumulation season. The rates of elevation and volume loss decreased between 2000 and 2009. These rates are significantly lower than the rates between 1919 and 1948, even though precipitation anomalies are similar between the two periods. Elevation and volume changes may be responding to the positive precipitation anomalies of the previous periods because the rates are highly correlated with precipitation periods lagged 1–10 years.
Ablation season temperatures are known to have a strong influence on glacier change in a continental climate (Reference Bitz and BattistiBitz and Battisti, 1999; Reference BolchBolch, 2007; Reference Hoffman, Fountain and AchuffHoffman and others, 2007; Reference Koch, Menounos and ClagueKoch and others, 2009; Reference MooreMoore and others, 2009). We correlated lagged temperature and precipitation anomaly periods with glacier changes in the Columbia Icefield. We found that annual and accumulation season precipitation anomalies had significant correlations with rates of elevation and volume change, and annual temperature anomalies had significant correlations with rates of length and area change. The high correlations occurred at lag times similar to those reported by Reference Salinger, Heine and BurrowsSalinger and others (1983) and Reference Beedle, Menounos, Luckman and WheateBeedle and others (2009). They determined that terminus changes are correlated with temperatures lagged a few years and precipitation lagged 5–10 years.
Surface air temperature affects the intensity of surface melt for glaciers, but it represents only one term in the energy budget affecting the surface of a glacier. Recent research has demonstrated how mesoscale atmospheric models can be used to obtain high-resolution meteorological fields that are required to calculate the surface energy balance of a glacier (Reference Mölg and KaserMölg and Kaser, 2011). Unfortunately, data required to drive such mesoscale models do not exist for the study area prior to 1948, and we lack distributed monthly meteorological data that could be used to understand how individual energy terms (e.g. long- and shortwave radiation) may have changed over the study period. In addition to debris cover, other morphometric changes of the glaciers would influence surface mass balance of the glaciers of this study. The observed steepening of the glaciers, for example, would have changed the average shortwave energy received by the glaciers over the period 1919–2009. Driving an ice dynamics model with dynamically downscaled meteorological fields obtained from general circulation models provides one avenue to better understand how glaciers that form the Columbia Icefields will likely change in the future.
Regional and global comparison
The general pattern of glacier change in the 20th century observed at the Columbia Icefield is one of rapid ice loss from the 1920s to the 1950s, followed by reduced ice loss in the 1960s and 1970s, and ending in renewed large losses during the 1980s and 1990s. This pattern mirrors the behavior of many glaciers throughout British Columbia and elsewhere in western North America (Reference McCabe and FountainMcCabe and Fountain, 1995; Reference Menounos, Clague, Gilbert and SlaymakerMenounos and others, 2005; Reference PeltoPelto, 2006; Reference Hoffman, Fountain and AchuffHoffman and others, 2007; Reference Schiefer, Menounos and WheateSchiefer and others, 2007; Reference Koch, Menounos and ClagueKoch and others, 2009).
The similar glacier response throughout western North America suggests common large-scale forcing mechanisms. These mechanisms could include ocean–atmosphere circulation patterns, specifically the Pacific Decadal Oscillation (PDO) and the Pacific North American (PNA) pattern. These patterns influence the temperatures and paths of winter storm systems that bring the majority of precipitation to western North America and have been linked to changes in glacier mass balance (Reference Bitz and BattistiBitz and Battisti, 1999; Reference Dyurgerov and MeierDyurgerov and Meier, 2000; Reference Demuth and BonardiDemuth and others, 2008). Shifts in the PDO to negative values in 1945/46 and to positive values in 1976/77 have been linked to reduced rates of ice loss and renewed recession, respectively (Reference Luckman, Harding and HamiltonLuckman and others, 1987; Reference McCabe and FountainMcCabe and Fountain, 1995; Reference Dyurgerov and MeierDyurgerov and Meier, 2000; Reference PeltoPelto, 2006; Reference Demuth and BonardiDemuth and others, 2008). Our rates of glacier change show moderate correlations (r = −0.24 to r = −0.47) with the PDO (data from N.J. Mantua, http://jisao.washington.edu/pdo/), but none were significant. The lack of significant correlation may be from the choice of periods which are based on the available data for glacier changes rather than when observed shifts in the phase of the PDO occurred (e.g. 1925, 1947 and 1977). Rates of area and volume change are significantly correlated (respectively, r = −0.81, p < 0.01 and r = −0.70, p < 0.05) with the PNA (data from T.P. Mitchell, http://jisao.washington.edu/ data/pna/), and while not significant, rates of length and elevation are also moderately correlated (respectively, r = −0.58 and r = −0.66).
Similar trends in glacier change throughout the 20th century have been documented for glaciers in Europe, Asia and South America. Reference Paul, Kääb, Maisch, Kellenberger and HaeberliPaul and others (2004) determine rates of area retreat for the glaciers in the Swiss Alps at 0.22% a−1 for 1850–1973, 0.64% a−1 for 1973–1998/99, and 1.40% a−1 for 1985–98. In the Italian Alps, Valle d’Aosta glaciers experienced rapid retreat from 1930 to 1950 followed by a reduction in retreat from 1960 to 1980 (Reference VanuzzoVanuzzo, 2001). Reference BolchBolch (2007) reports stronger area retreat of Tuyuksu glacier, northern Tien Shan, after the late 1970s. Thinning rates doubled from 1.03 m a−1 (1975–2000) to 2.60 m a−1 (1995–2002) in the Southern Patagonia Icefield (Reference Rignot, Rivera and CasassaRignot and others, 2003). Reference Dyurgerov and MeierDyurgerov and Meier (2000) document a shift in the global volume change trend in the late 1970s to decreasing glacier volume. Since the end of the 1970s, rates of retreat, thinning and volume loss of glaciers around the world have increased, suggesting large-scale forcing influencing long-term glacier response on a global scale (Reference Dyurgerov and MeierDyurgerov and Meier, 2000; Reference BarryBarry, 2006).
Conclusions
The IBCS maps and older aerial photography were integral in extending records of glacier mass change back to the early 20th century. This study identified moderate errors in the data derived from maps and imagery, but these errors are small compared to the large glacier changes observed over the length of the record. Over nine decades, the Columbia Icefield shrank by 59.6 ± 1.2 km2, thinned by 49 ± 25 m w.e. and lost 14.3 ± 2.0 km3 w.e. Length, area, elevation and volume changes differed between individual glaciers due mainly to glacier size, type and debris cover. Size is the main factor, but significant differences stem from other variables, which must be taken into account when modeling glacier response to climate change.
Rates of ice loss are related to changes in annual precipitation that occurred 4–7 years earlier and annual temperature that occurred 3 years earlier. Lower correlations with temperatures may be a product of the periods, which were chosen based on available data for calculating glacier change rather than variations in temperature and precipitation. Glaciers of the Columbia Icefield have a delayed response to climate forcing, indicating the need for long glacier records to determine relations with climate.
Acknowledgements
Research funding was provided by the Natural Sciences and Engineering Research Council of Canada (Canadian Graduate Scholarship to C. Tennant and Discovery Grant to B. Menounos), the University of Northern British Columbia (Graduate Entrance Scholarship to C. Tennant) and the Western Canadian Cryospheric Network (funded by the Canadian Foundation for Climate and Atmospheric Sciences). Peyto Glacier mass-balance data were provided by Mike Demuth of Natural Resources Canada. We thank John Clague, Brian Luckman and Roger Wheate for providing critical and informative comments that strengthened the research. Cardinal Systems provided licensing and support for their VR Mapping photogrammetry software. Aerial photographs were scanned by Tyler Sylvestre and Callin Smith. We thank two anonymous reviewers for constructive comments, and David Rippin and Jo Jacka for careful editing that improved the quality of the paper.


