


Introduction
Since the Alma-Ata declaration 40 years ago, primary care has been described repeatedly as essential care that is (1) universally accessible to individuals and families in communities, (2) available at an affordable cost to communities and countries and (3) the first level of contact for patients (or the first element of a continuing health care process) (WHO, 2008). With these notable features, there is compelling evidence that stronger primary care systems are associated in general with better population health outcomes including lower mortality rates, rates of premature death and hospitalizations for ambulatory care sensitive conditions, and higher infant birth weight, life expectancy, and satisfaction with the health care system (Starfield, Reference Starfield1991; Starfield and Shi, Reference Starfield and Shi2002; Macinko et al., Reference Macinko, Starfield and Shi2003; Niti and Ng, Reference Niti and Ng2003). Primary care is a factor in improving public health and health outcomes and the prevention of illness and death, with lower use of hospital-based medical care, associated with lower costs (Starfield et al., Reference Starfield, Shi and Macinko2005b; Friedberg et al., Reference Friedberg, Hussey and Schneider2010), and more equitable distribution of health within a population (Starfield et al., Reference Starfield, Shi, Grover and Macinko2005a; Reference Starfield, Shi and Macinko2005b; Shi et al., Reference Shi, Macinko, Starfield, Politzer, Wulu and Xu2005a; Reference Shi, Macinko, Starfield, Politzer and Xu2005b). A critical review on the contribution of primary care to health and health systems in low- and middle-income countries (LMIC) showed that primary-care-focused health initiatives have improved access to health care, including among the poor, at reasonably low cost (Kruk et al., Reference Kruk, Porignon, Rockers and Van Lerberghe2010). There is also evidence that primary care programmes have reduced child mortality and, in some cases, wealth-based disparities in mortality (Kruk et al., Reference Kruk, Porignon, Rockers and Van Lerberghe2010).
Similar to many LMIC, Vietnam faces the challenges of the double burden of communicable and non-communicable disease and the trend to sustainable development from its own funding. Since 2013, the government has issued many important policy changes to reinforce the grassroot networks as well as the health care system in general (Vietnam Ministry of Health, 2013; Vietnam Prime Minister, 2013; Prime Minister, 2016; Vietnam Government, 2016; Ministry of Health, 2016a; 2016b; 2017).
In 2015, the Primary Health Care Performance Initiative (PHCPI) was launched in 135 LMIC with the aim of catalyzing improvements in primary health care systems (PHCPI). The PHCPI conceptual framework conceived of a high-quality primary health care subdomain, which includes the classic primary health care functions such as first contact accessibility, comprehensiveness, and coordination as first laid out by Starfield and others in the world plus added a new function in person-centred care to distinguish between the continuity and person-centred components in Starfield’s original domain of person-focused care over time. This high-quality primary care is one of the key subdomains for measurement of primary health care service delivery in health systems (Veillard et al., Reference Veillard, Cowling, Bitton, Ratcliffe, Kimball, Barkley, Mercereau, Wong, Taylor and Hirschhorn2017).
Worldwide, commitment for improvements in primary care is increasing. An example is the new UN Sustainable Goal for Health (Enhance health and promote well-being for all at all ages) (World Health Oganization, 2016). Recently, the new Astana Declaration: ‘From Alma-Ata towards universal health coverage and the Sustainable Development Goals’ released by WHO and UNICEF in October 2018 reaffirmed the commitment of States and Governments to ‘build a sustainable primary health care as well as to enhance capacity and infrastructure for primary care – the first contact with health services’ (WHO and UNICEF, 2018). Consequently, there is also a growing need to measure various characteristics of primary care as we mentioned above and explore their impact on the quality of primary care. It would provide the best evidence for policy makers if these evaluations come from both the demand and supply sides of the health care sector. Comparatively more researchers have studied assessments of primary care quality from the consumer perspective than from the workforce perspective. A recent South African study pointed out that there is a significant gap between the two, that is, between the clients’ experience with primary care and what managers and providers think they are delivering (Bresick et al., Reference Bresick, Sayed, Le Grange, Bhagwan, Manga and Hellenberg2016).
There are various tools that have been used for measuring characteristics of primary care, for example, the CPCI (Components of Primary Care Instrument) (Flocke, Reference Flocke1997), the PCAS (Primary Care Assessment Survey) (Safran et al., Reference Safran, Kosinski, Tarlov, Rogers, Taira, Lieberman and Ware1998), the EUROPEP questionnaire (European Task Force on Patient Evaluations of General Practice Care) (Grol et al., Reference Grol, Wensing, Mainz, Ferreira, Hearnshaw, Hjortdahl, Olesen, Ribacke, Spenser and Szecsenyi1999), the CAHPS (Consumer Assessment of Healthcare Providers and Systems) (Weidmer et al., Reference Weidmer, Cleary, Keller, Evensen, Hurtado, Kosiak, Gallagher, Levine and Hays2014), the P3 C (Parents’ Perception of Primary Care) (Seid et al., Reference Seid, Varni, Bermudez, Zivkovic, Far, Nelson and Kurtin2001), and the PCAT (Primary Care Assessment Tool) (Shi et al., Reference Shi, Starfield and Xu2001). The PCAT developed by Barbara Starfield at the Johns Hopkins Primary Care Policy Centre is one of the most widely studied and applied tools for measuring the quality of primary care across the globe. The PCAT family includes four versions: the consumer–client, facility, provider and health system versions. Through the PCAT, primary care quality is evaluated according to its core principles (first contact care, continuous longitudinal care, coordination, and comprehensiveness) and three other derivative domains (family-centered care, community-orientated care, and culturally competent care) (Malouin et al., Reference Malouin, Starfield and Sepulveda2009). In contrast with the consumer version, which has been translated and validated in many languages and countries across the world (Rocha et al., Reference Rocha, Rodriguez-Sanz, Pasarin, Berra, Gotsens and Borrell2012; Yang et al., Reference Yang, Shi, Lebrun, Zhou, Liu and Wang2013; Wang and Shi, Reference Wang and Shi2014; Aoki et al., Reference Aoki, Inoue and Nakayama2016), little work has been done for the provider version questionnaires.
As the PCAT consumer version was validated and successfully used in Vietnam (Hoa et al., Reference Hoa, Tam, Peersman, Derese and Markuns2018), we found that the PCAT provider version could render an adequate reflection on organizational resources and health care processes from a primary care provider perspective. As a first step, this study was conducted to adapt the PCAT provider tool for Vietnam and determine its internal consistency and validity.
Method
Translation and adaptation of the PCAT provider version for Vietnam
The PCAT provider version (PCAT PE) was translated and culturally adapted strictly according to the guidelines from the Johns Hopkins Primary Care Policy Center for use in international settings (Starfield and Shi, Reference Starfield and Shi2009) (illustrated by Figure 1). The first round was done in 2007 including all recommended steps as follows:
Step 1: Forward translation performed by a bilingual physician and PhD student whose native tongue was Vietnamese with experience in translating documents between English and Vietnamese. This translator was familiar with use of the PCAT. To the best of the translator’s ability, the translation preserved the intent rather than the literal meaning of the items.
Step 2: Qualitative review of the translated survey was done by several doctors and other workers from Hanoi Medical School. This was performed in focus group discussion, where every translated item was reviewed to ensure its clarity, use of common language, and conceptual adequacy.
Step 3: Backward translation was done by a Vietnamese woman whose native language is American English and who has lived long enough in the USA to know the language and routines of daily life. This translator was not familiar with the specific wording of the original PCAT terms. The instructions given to the back translator were identical to those given to the forward translator. The aim of this step was to identify items that required further study.
Step 4: Health systems research experts and the forward/backward translators jointly reviewed the forward and backward translations in order to detect items that were not effectively translated, which were confusing or generated concerns. A few modifications were made until a consensus version was reached.
Step 5: Thereafter a lay panel of Vietnamese physicians reviewed the translation, identified troublesome items, and proposed alternatives.
Step 6: Pilot testing of the translated version: the questionnaire was administered to 108 physicians, that is, 41 physicians working at Commune health centers (CHCs) and 67 physicians working as academic trainers and administrators at the medical universities. Basic descriptive analyses were conducted to ensure adequate distribution of responses. The respondents were debriefed to identify any wording or comprehension problems.
Process of translation and cultural adaptation for VN PCAT-PE
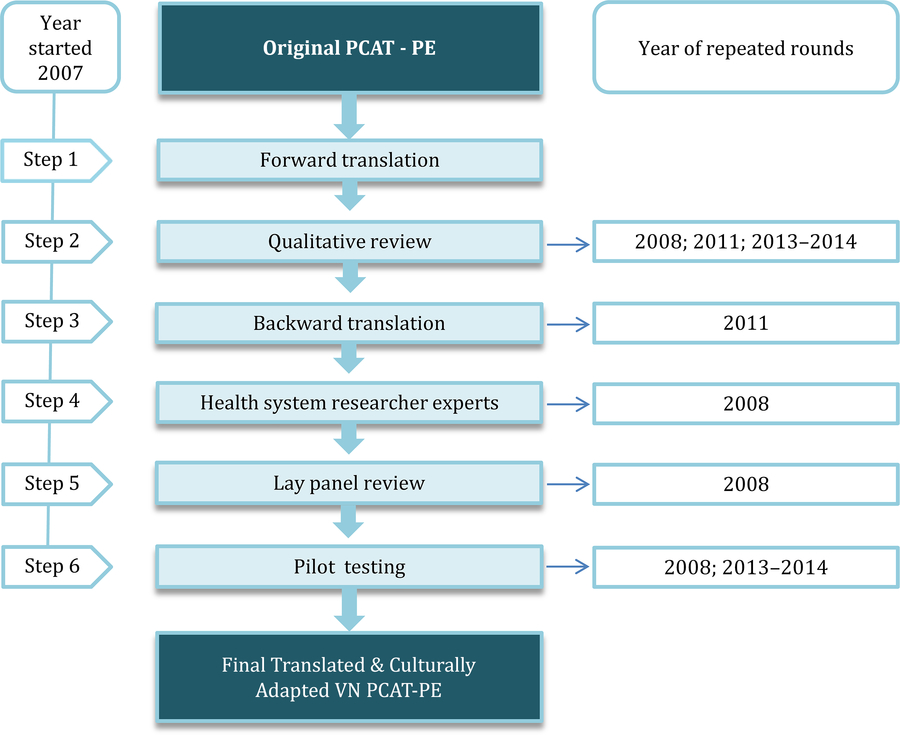
To ensure the high quality of the questionnaires, certain steps were repeated in 2008 (steps 6, 2, 4, 5), 2011 (steps 2 and 3), 2013, and 2014 (steps 2 and 6) before it was declared fit to be used in a general population (Table 1). Below we describe those steps with the year wherein they were performed:
Different steps in the translation and adaptation process and in which rounds they were repeated

In 2008, Pilot testing was performed again for 28 physicians in the Specialist Level 1 in family medicine (CK1) training programme in Khanh Hoa. A dissemination workshop was then held in Vietnam with primary care physicians from several medical schools to review the pilot data and make additional revision suggestions based on responses from the previous pilot testing round (Qualitative review).
Following this review, a panel of primary care physicians from six medical schools in Vietnam and a team of researchers and physicians from Boston University participated in two rounds of revisions of PCAT questions, including appropriate contextual translation of concepts (Lay panel review).
Dr. Barbara Starfield reviewed the revised version pre-translation and gave comments that were incorporated into a final version (Health system researcher experts review).
In 2011, a Qualitative review was repeated by the research team (Hue UMP and BU). Discussion on the cultural relevance of each item in the Vietnamese version and comparison between the current version and the original PCAT were made. This round also checked the matching between each equivalent item of the consumer and provider surveys. The research team produced a list of problematic items and proposed solutions. Backward translation was repeated after the qualitative review. The back translation was undertaken by a woman whose native language is American English and has lived in the USA long enough to know the language and routines of daily life. A new translated version of the questionnaires was produced.
In April 2013, an additional pilot study was conducted for 60 physicians working at CHCs in Thua Thien Hue Province. These physicians were divided into two groups: one group read the questionnaires and gave their opinions in terms of content and accuracy of evaluation for practice of physicians working in primary care in Vietnam. The other group was asked to fill in the entire questionnaire and give their feedback on challenges they faced.
From October 2013 to January 2014, a final revision was done by the research team from Hue UMP and BU (qualitative review). The team went through all the items and asked for advice from international experts with experience in PCAT validation. After this round, a final translated version of the questionnaire was produced with 9 scales and 123 items as compared to 9 scales and 124 items of the original PCAT provider. This is a self-completion questionnaire and takes approximately 30–45 min to fulfil. We maintained a four-point Likert scale response format (1 = definitely not; 2 = probably not; 3 = probably; and 4 = definitely) providing an additional ‘don’t know/don’t remember’ option in case participants could not choose one of those four options. Table 1 in Supplementary Material shows items changed in the final translated questionnaires from the original version.
Data collection
To evaluate the feasibility, internal consistency, and validity of the VN PCAT PE, a cross-sectional study was implemented. The study was conducted in Thua Thien Hue province with all general doctors working at CHCs. There are 152 CHCs in the 9 districts of this province. Normally, one CHC is equipped with a general doctor as the head of the CHC. There are some exceptions: some CHCs have two general doctors, others only a traditional medicine doctor or an assistant traditional medicine doctor or an assistant doctor.
The questionnaires were delivered at the end of the monthly meeting of each district health center. In cases where one or more doctors were absent in that meeting, we tried to contact them and make an appointment at their CHC to have an interview at a later stage, where a trained interviewer assisted the doctor to complete the questionnaire. After three unsuccessful engagement efforts during the study period, we excluded these doctors from our research. Before the interview, participants received a full explanation of the study’s content and purpose and signed a consent form if they agreed to participate. Participants received 5 USD as an appreciation gift for their time and contribution. Data collection was conducted from December 2017 to February 2018.
This study obtained ethical approval from the Scientific Committee of Hue University of Medicine and Pharmacy on 18 March 2014 and IRB review from Boston University (H-31432).
Data analysis
All collected questionnaires were cleaned and entered into EpiData. Data analysis was performed using SPSS software version 23.0.
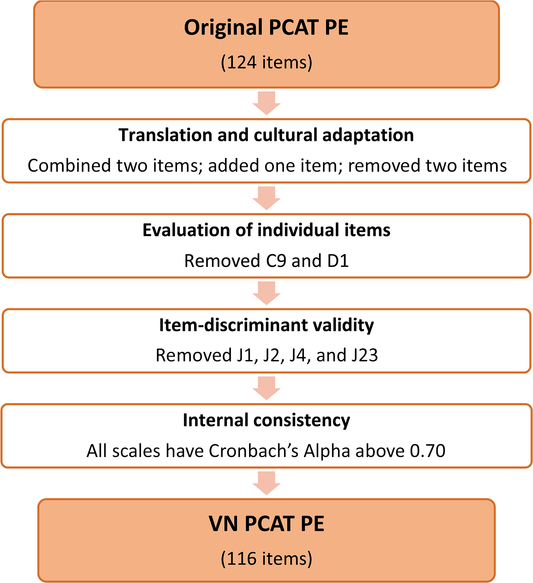
Subsequent full validation involved several steps (Figure 2). First, individual items were evaluated on several criteria. Items with a high percentage (≥20%) of item non-response or ‘don’t know/don’t remember’ responses, or items with a large floor or ceiling effect (>80% of respondents chose the lowest or highest rating) were removed. Next, the item-total correlation for the remaining items in each scale was calculated (item-total correlation before review). Items were removed if the item-total correlation was below 0.30 or if Cronbach’s coefficient alpha for that scale improved substantially when the item was removed. Finally, item-discriminant validity was tested: for each item, the item-total correlation (item-total correlation after review) with the hypothesized scale should be substantially higher than the correlation with the other scales. In the second phase, Cronbach’s coefficient alpha was used to examine how well all items measured the same construct (internal consistency). A value of 0.70 is commonly seen as a minimum.
Validation process of VN PCAT-PE and its results
The recoding progress and calculation for the sum mean score of domains and subdomains of primary care strictly complied with the guideline PCAT manual issued by Johns Hopkins University in 1998. For calculating the sum mean scores of domains and subdomains, a mean value was assigned to ‘not sure/don’t remember’ answers as well as to missing values.
Results
Characteristics of study population
Among the 157 doctors working at the 152 CHCs in Thua Thien Hue province, 150 participated in our study, one refused and six were absent because of maternal or sick leave or study leave. Tables 2 and 3 show the characteristics of the participants and their work place. There were about twice as many male doctors as female ones. More than half of these doctors have been practicing for 20 years or more. Although CHCs receive patients of all ages, the majority of them are adults and only a small percentage of them must pay out-of-pocket for their health visits.
Characteristics of study population-providers (n = 150)

Characteristics of study population-health facilities (n = 150)

Evaluation of the individual items
Table 4 shows the evaluation of the individual items. All items have a low non-response or ‘don’t know/ don’t remember’ response rate (<20%) and there were no floor or ceiling effects (≤80%). One item from First contact access (C9) and one item from Ongoing care (D1) were removed because of an item-total correlation below 0.30. The Cronbach’s alphas of the different scales were not improved substantially by removing any items. Four items of the Community orientation care scale were removed because their item-total correlation with that scale was lower than their correlations with the other scales. (see Table 2 - Supplementary Material).
Item mean (SD), percentage ‘don’t know, don’t remember/missing,’ floor/ceiling effect, item-total correlation before review, item-total correlation after review, and range of item correlations with other domains

Internal consistency of the different scales
Based on these parameters, 116 items of the VN PCAT-PE were determined to be appropriate for use with Vietnamese health care providers, to represent four core domains with six scales and three derivative domains with three scales (Table 5). All scales had a Cronbach’s alpha above 0.80, except for the scale of Coordination, which still was above the minimum level of 0.70.
Descriptive statistics of the domains scales

Discussion
Main findings
The outcome of this study is a translated and adapted PCAT provider version for Vietnam. The results showed that this questionnaire is a valid tool to evaluate primary care quality in Vietnam from the provider viewpoint with high overall reliability and validity.
Interpretation of the results in relation to existing literature
This study rendered a PCAT ready for evaluation studies of the primary care system from the providers perspective in Vietnam. Previous PCAT validation studies focused mostly on the patients’ (consumers’) version. Now that the providers’ version is available, a deeper and more comprehensive assessment of primary care quality becomes possible, adding a second key view on the demand–supply relationship of the primary care system of Vietnam.
The VN PCAT provider version preserves the integrity characteristics of the original PCAT provider version with 116 items belonging to nine scales. There were only slight changes in the number of items in most scales except for the Community Orientation scale, from which four items were removed because their item-total correlation with the hypothesized scale was lower than the correlations with another scale.
In a South African study, a new scale (about the primary health care team) was added at the end of the questionnaire (Bresick et al., Reference Bresick, Sayed, Le Grange, Bhagwan, Manga and Hellenberg2016). A Chinese study removed the scale of First contact access from their tool (Zou et al., Reference Zou, Zhang, Hao, Shi and Hu2015). We succeeded in retaining most major characteristics of the original tool, however, preserving the possibility of future comparison with other primary care quality assessment studies using the original PCAT tool.
In the validation study of the consumer tool VN PCAT AE, the domains of First contact access and Comprehensive (service available) more items were removed (six and five items, respectively) (Hoa et al., Reference Hoa, Tam, Peersman, Derese and Markuns2018). A probable reason why this was not the case in the provider study is that the providers had more knowledge about the items’ content and knew better the services they were providing than the consumers. This may have reduced the ground effect and the number of ‘don’t know/ don’t remembers’ as well as the number of missing answers.
Due to the fact that Vietnam has a specific culture (mid-level country, Southeast-Asian) and a developing primary care context, the 2007 process alone was not sufficient. As the reader may have observed, it was indeed a lengthy process for the translation and cultural adaptation (from 2007 to 2014). In order to improve its quality, various important steps were repeated several times, including four times for the qualitative review and three times for pilot testing. These added steps were necessary to develop a well-constructed and fully adapted tool for measuring the specific health care setting of Vietnam.
There are several potential biases of this study due to its limitation in design: the study population was restricted to general doctors working at CHCs. Although they are the major resource for providing primary care in Vietnam currently, there are other primary care doctors such as private doctors and doctors working in primary care outpatient clinics of some hospitals who should also be surveyed to assure the expected diversity and comprehensiveness of the tool.
Conclusions
We developed the VN PCAT PE as a valid and reliable tool to measure the quality of primary care from a provider perspective in Vietnam. Used together with the VN PCAT AE, primary care performance can be examined comprehensively. The gap in views between primary care users (demand side) and providers (supply side) in Vietnam can now be identified.
Author ORCIDs
Nguyen Thi Hoa, 0000-0002-2866-1519; Anselme Derese, 0000-0001-9137-4371; Jeffrey F. Markuns, 0000-0002-8044-2575; Nguyen Minh Tam, 0000-0002-8505-677X; Wim Peersman, 0000-0002-4276-7408
Supplementary material
To view supplementary material for this article, please visit https://doi.org/10.1017/S1463423619000458
Acknowledgements
We would like to thank the many family medicine leaders across Vietnam whose comments made an enormous contribution to our work. We would also like to thank the many primary care practitioners who volunteered their time to contribute to increasing knowledge of primary care in Vietnam.
Financial Support
This work was supported by the Atlantic Philanthropies (grant nos. 14613, 21627)
And the VLIR InterUniversity Cooperation Programme VLIR-IUC with Hue University (grant no. ZIUC2017AP026). The funders had no role in study design, data collection and analysis, decision to publish, or preparation of the manuscript.
Conflicts of Interest
None.
Ethical Standards
The authors assert that all procedures contributing to this work comply with the ethical standards of the relevant national and institutional guidelines (Hue University of Medicine and Pharmacy, Vietnam) and with the Helsinki Declaration of 1975, as revised in 2008.


 Open access