


Introduction
The South Shetland Islands (SSI), due to their northernmost position along the Antarctic Peninsula, present the mildest climate on the continent. Since the mid-twentieth century, the SSI have experienced some of the most significant regional climate warming on Earth (Vaughan et al. Reference Vaughan, Marshall, Connolley, Parkinson, Mulvaney and Hodgson2003, Thomas et al. Reference Thomas, Dennis, Bracegirdle and Franzke2009), superimposed with short warm and cold spells caused by decadal internal variability (Turner et al. Reference Turner, Lu, White, King, Phillips and Hosking2016, Gonzalez & Fortuny Reference Gonzalez and Fortuny2018). The position of the SSI at the northernmost edge of Antarctica exposes it to cyclones, sea-ice variability, atmospheric rivers and blocking events, which dominate its short-term atmospheric variability (Jones & Simmonds Reference Jones and Simmonds1993, Clem et al. Reference Clem, Renwick, McGregor and Fogt2016, Porter et al. Reference Porter, Parkinson and Mosley-Thompson2016, Marín et al. Reference Marín, Bozkurt and Barrett2022, Wille et al. Reference Wille, Favier, Jourdain, Kittel, Turton and Agosta2022, Gorodetskaya et al. Reference Gorodetskaya, Durán-Alarcón, González-Herrero, Clem, Zou and Rowe2023). However, the long-term warming trend has caused these islands, located in the transition zone of the annual advance and retreat of the zero-degree isotherm, to gradually become more subject to temperatures above the freezing point (González-Herrero et al. Reference González-Herrero, Navarro, Pertierra, Oliva, Dadic, Peck and Lehning2024). This shift may drive major changes in the geophysical and ecological systems in the archipelago.
The SSI archipelago consists of 11 major islands (with King George and Livingston islands being the bigger ones) and several minor ones, with the major islands having a widely glaciated surface (Fig. 1a). However, the steep terrain and the presence of many deglaciated areas modify the weather patterns around the islands, creating different microclimates (Rakusa-Suszczewski Reference Rakusa-Suszczewski, Beyer and Bölter2002, Savenets et al. Reference Savenets, Pysarenko and Pishniak2020). Although it is one of the most monitored places in Antarctica due to the great number of scientific stations present there, this complexity leads to significant uncertainty regarding the climate conditions of the different areas around the islands. The ice-free areas, together with these microclimates, help to sustain one of the richest ecosystems in Antarctica (Putzke et al. Reference Putzke, Pereira, Putzke, Pereira, Kanao, Godone and Dematteis2020).
a. Map of the western and central South Shetland Islands, including the synoptic weather stations operated by AEMET (red), other automatic weather stations (AWSs) operated by AEMET (orange), research weather stations supported by AEMET and other synoptic stations in the region (black). The AWS onboard the polar scientific vessel Hespérides is not included on the map as it is not in a fixed position. b. Zoom-in image of Livingston and Deception islands, including contoured topography every 100 m. Source: Antarctic Digital Database. GdC = Gabriel de Castilla; JCI = Juan Carlos I.

There are significant differences in the extent of climate monitoring in the different regions of the archipelago related to the number of research stations present in each region (Fig. 1a; COMNAP 2017). The eastern archipelago (Elephant and Clarence islands) lacks any scientific station and is the least monitored area. We are not aware of any meteorological stations present there. In contrast, the central archipelago (King George and Nelson islands) is the most monitored area of the Antarctic Peninsula due to its logistical ease of access (there is an airport on King George Island). King George Island hosts 12 scientific stations of different nations in several ice-free areas, each with its own manual or automatic weather station (AWS) and several other research AWSs monitoring parts of the glacier. In total, the World Meteorological Organization Global Observing System (WMO-GOS; WMO 2024) lists eight operational stations there, and there have been many meteorological studies of the island (e.g. Styszynska Reference Styszynska1990, Landman et al. Reference Landman, Mason, Tyson and Tennant2001, Angiel et al. Reference Angiel, Potocki and Biszczuk-Jakubowska2010, Kejna et al. Reference Kejna, Araźny and Sobota2013, Soares et al. Reference Soares, Alves, Ribeiro and Codato2019, Bello et al. Reference Bello, Suarez and Lavado-Casimiro2022, Torres et al. Reference Torres, Bozkurt and Arigony-Neto2023). Finally, the western archipelago (Robert, Greenwich, Livingston, Snow, Smith, Deception and Low islands) has 10 research stations, some of which are temporary camps. Despite there being several AWSs and manual measurements having been obtained at these stations, only three operational stations are listed in the WMO-GOS: these stations are located on Nelson, Livingston and Deception islands (WMO 2024).
The Spanish Meteorological Agency (AEMET) is responsible, under agreement with the Ministry of Science and the Spanish Polar Committee, for the meteorological monitoring of the Spanish Antarctic Program, and it operates and maintains four AWSs. Two of these weather stations are the operational stations located on Livingston and Deception islands near the research stations of Juan Carlos I (JCI; SYNOP indictor: 89064) and Gabriel de Castilla (GdC; SYNOP indicator: 89070), respectively. The other two are the station onboard the polar research vessel Hespérides (Ship Observations Team indicator: GMHQL8E) and the new operational station on Mount Reina Sofía (275 m above sea level (a.s.l.)), established to provide better wind measurements around the Hurd Glacier to weather forecasters, as JCI is sheltered from the wind (Andres-Martin et al. Reference Andres-Martin, Azorin-Molina, Serrano, González-Herrero, Guijarro and Bedoya-Valestt2024). In addition, AEMET also helps to maintain other research-supporting stations in the area, such as those at Hurd Glacier and Byers Peninsula (Bañón et al. Reference Bañón, Justel, Velázquez and Quesada2013).
In this article, we present a complete climatological analysis of the two main operational stations of JCI and GdC (Fig. 2a,b). The first measurements of these stations were published in Spanish in the book AEMET en la Antártida (Bañon & Vasallo Reference Bañon and Vasallo2015). Although some basic quality control was performed, a fully standardized procedure was not applied at that time. Here, we revisit and update the climatology of these stations after a full quality control review of the data recorded over 35 years, and we discuss the climatology of both stations, comparing and placing the results in the context of the changes experienced in this region.
Photos of a. Juan Carlos I station on Livingston Island, b. Gabriel de Castilla station on Deception island and c. the weighing gauge at Juan Carlos I station. Photos taken by: a. & b. José Vicente Albero and c. José Luis Collado.

History of AEMET in Antarctica
JCI station was established in early January 1988 on Livingston Island. At that time, a team from the INM (former name of the AEMET) was working aboard the Argentine icebreaker Almirante Irizar. Part of the team joined the new station in February, establishing an observatory with SYNOP indictor 89064, and they started to collect meteorological data. Conditions were precarious, and manual observations of temperature, pressure and wind lasted a little over a month, with reports transmitted via radio during main operational hours.
A complete manual station and an AWS were installed in the following campaign (1988–1989). The major problem was that the AWS could only be operated in summer when the station had personnel, as its power and data storage system were insufficient. This remained the state of the observatory until 1997, when the station’s energy capacity was improved, allowing the AWS to function and store data during the station’s operational period as well as during its closure in March until October. Only in the summer of 1991–1992 did the INM fail to attend its Antarctic campaign, and so some data were collected from a small station installed by the Spanish National Research Council (CSIC). During the summer of 1997, observations were expanded to include global, direct, diffuse and ultraviolet solar radiation during periods when personnel were present at the station. Only for that year, an AWS was also installed at GdC station on Deception Island, which yielded very poor data quality. In 2005–2006, the AWS at JCI was replaced by a new one capable of collecting data throughout the winter, and a new AWS was installed at GdC with SYNOP indictor 89070. In addition to these two AWSs, and in collaboration with the Limnopolar project and the CSIC - Marine Technology Unit, stations were installed at Byers Peninsula in 2001 (Bañón et al. Reference Bañón, Justel, Velázquez and Quesada2013) and at Johnsons Glacier in 2006 (Jonsell et al. Reference Jonsell, Navarro, Bañón, Lapazaran and Otero2012).
Technological development and improvements in communications were implemented in the meteorological installations over the years. In 2014–2015, a new technology was introduced replacing the outdated system at GdC, and subsequently at JCI in 2016–2017. The JCI AWS in 2014–2015 transitioned from transmitting reports via Meteosat every 6 h to hourly internet transmissions throughout the year from the 2021–2022 campaign onward. Additionally, real-time hourly data were published on the website https://antartida.aemet.es together with climatological data, now available at https://opendata.aemet.es.
The last advances occurred in 2020–2021, when the latest AWS was set up on Mount Rein Sofía, and in 2019–2020, when a weighing gauge (WG) with a single Alter shield was installed at JCI. The objective of the latter is to serve as a future regional reference standard for solid precipitation, which has been poorly measured in Antarctica (Tang et al. Reference Tang, Chenoli, Colwell, Grant, Simms, Law and Abu Samah2018).
In parallel with developments in observation, there have also been advancements in prediction. Since the 2003–2004 campaign, a meteorological forecaster has accompanied the meteorological technician and observer during the campaign. They follow forecasting progress, and today they are using some of the most advanced forecasting techniques, such as an Antarctic version of the kilometric-resolution ensemble prediction system AEMET-γSREPS (Gonzalez et al. Reference Gonzalez, Callado, Martínez and Elvira2020), which has also been used during the summer Special Observing Period and the winter Targeted Observing Period of the Year of Polar Prediction in the Southern Hemisphere (YOPP-SH; Bromwich et al. Reference Bromwich, Werner, Casati, Powers, Gorodetskaya and Massonnet2020, Reference Bromwich, Gorodetskaya, Carpentier, Alexander, Bazile and Heinrich2024).
Data and methods
Data retrieval
The data presented in this study were obtained from the two synoptic stations operated by AEMET in the western SSI: JCI on Livingston Island and GdC on Deception Island (Figs 1 & 2). Data collection was conducted using different sensors and dataloggers over the years following WMO recommendations. Actions on meteorological equipment follow the procedures and guidelines of AEMET calibration laboratories, which also provide calibrated and adjusted temperature-humidity, pressure and radiation sensors, as well as reference equipment for in situ verifications.
In addition to standard climatological variables, data from JCI include other non-conventional measurements, such as disdrometric measurements, biological radiation and greenhouse gases. A special mention should be made of the radiometric station that has been installed every summer since 1997, which conducts a complete set of radiometric measurements similarly to any other station of the Spanish national network. This station captures both shortwave and longwave incoming and outgoing radiation with a solar tracker and incoming ultraviolet radiation. We do not include these data in this study as doing so would require a dedicated analysis.
The data consist of 10 min averages (or accumulations in the case of precipitation), except for extreme temperature and wind gusts, which are recorded as the extreme values within 10 and 3 s periods, respectively, over a 10 min interval. Data availability is detailed in Annex S1.
Data presentation
The data have been processed into daily values by averaging (or accumulating in the case of precipitation) the daily measurements, provided that more than 80% of the day’s data are available, similarly to other studies (e.g. Kirchner et al. Reference Kirchner, Faus-Kessler, Jakobi, Leuchner, Ries, Scheel and Suppan2013). A different criterion is applied to precipitation, which requires 100% of data availability to consider the day valid. This ensures that days with only a portion of the precipitation recorded are not included (WMO 2023). For snow depth, a threshold of 5% is applied, as snow depth is a more stable parameter that experiences regular interruptions during winter. Maximum and minimum temperatures are derived from the highest and lowest 10 min maximum and minimum readings within the day.
Annual climatologies (temperature, snow depth, radiation, relative humidity and sea-level pressure) are displayed as 10 day rolling means centred on calendar day. A minimum of 5 valid days are required for a value to be considered. The 25th and 75th percentiles are calculated over the rolling-averaged values. Wind roses, by contrast, use all available 10 min interval data, which are aggregated by speed and direction.
Precipitation is shown as monthly accumulations, provided that at least 80% of the days in a month are available.
Results and discussion
Climatology
Near-surface air temperature
The average temperature at both JCI and GdC remains above the freezing point from late November to mid-April, indicating that the zero-degree isotherm reaches both islands at approximately the same time (Fig. 3). The long season with above-freezing temperatures impacts glaciers, frozen marine areas, biological activity and human access to infrastructure.
Climatology of the daily temperature at a. Juan Carlos I (JCI) and b. Gabriel de Castilla (GdC) stations. Each value corresponds to the mean average of 10 days. Black lines indicate the daily mean temperatures for each calendar day. Red and blue lines indicate the maximum and minimum daily mean temperatures, respectively, with the shaded areas representing the values between the 25th and 75th percentiles.

At both stations, temperatures reach their annual maximum during summer, peaking at the end of January and remaining high through mid-February. Afterwards, temperatures gradually decrease, reaching their lowest point in winter, typically in late July, and remaining low throughout August. In spring, temperatures rise again, completing the annual cycle. This pattern is slightly shifted compared to other Antarctic stations and is largely driven by the ocean’s high heat capacity, which buffers temperature fluctuations and provides thermal inertia.
Although temperatures show low interannual variability moderated by the ocean’s influence, daily variability changes across the year. During the summer, temperature fluctuations are minimal, but variability increases gradually through autumn and peaks in winter. This effect is particularly evident regarding minimum temperatures. This seasonal variation is influenced by several factors. First, sea ice acts as a thermal insulator between the ocean and the atmosphere, and its variations in extent affect the ocean’s ability to transfer heat to the atmosphere. In the summer, reduced sea ice allows for greater interaction between the ocean and atmosphere, moderating the impacts of cold and warm air masses (Marshall et al. Reference Marshall, Lagun and Lachlan-Cope2002). During winter, increased sea-ice extent reduces this interaction, with less moderation of cold air masses arriving from the south. Solar radiation also plays a significant role in temperature stability. High solar radiation during cloudless summer days helps to stabilize temperatures, particularly when cold air masses arrive from the south. These cold air masses tend to be drier due to their shorter maritime journey and the katabatic descents from the Antarctic Peninsula, reducing cloud cover and allowing direct solar radiation to warm the surface. In contrast, warm air masses from the north carry more humidity, cloud cover and precipitation, limiting the solar radiation that reaches the surface. As a result, both air masses experience negative feedback that reduces temperature extremes. In winter, the absence of direct solar radiation intensifies the effects of both cold and warm air masses on the region, leading to more pronounced temperature fluctuations.
A notable difference in extreme maximum temperatures between GdC and JCI stations can be attributed to local effects on Livingston Island arising from its complex orography (Fig. 1b). JCI experiences significantly higher extreme maximum temperatures than GdC due to the adiabatic compression of Föhn winds as they descend towards JCI, raising local temperatures. This effect is most pronounced with winds from the east-north-east to east-south-east. Although less frequent, strong winds from the east-south-east to south can cause even greater warming under conditions of low atmospheric stability. In contrast, Deception Island’s lower elevation limits wind blockage, reducing the warming effect of adiabatic compression.
Relative humidity
The coastal location of the stations contributes to consistently high and stable relative humidity throughout the year (Fig. 4). Average relative humidity at both stations ranges between 80% and 90%, with an interquartile range spanning between 75% and 95%. However, relative humidity is slightly higher at GdC compared with JCI, being constantly 5% higher throughout the year. A possible cause of this difference could be the additional evaporation from the warmer water of the Deception Island volcanic caldera (Berrocoso et al. Reference Berrocoso, Prates, Fernández-Ros, Peci, de Gil and Rosado2018). However, the similar annual cycle with respect to JCI and the absence of a winter decrease with an iced caldera suggest that this evaporation is not the primarily driver of the higher relative humidity. Instead, the warmer soil of the island throughout the year is a possible cause of this difference.
Climatology of the relative humidities at a. Juan Carlos I (JCI) and b. Gabriel de Castilla (GdC) stations. Each value corresponds to the mean over 10 days. The green lines indicate the daily mean relative humidities for each calendar day and the shaded areas represent the values between the 25th and 75th percentiles.

At both stations, mean relative humidity increases by ~5% from January to October, followed by a sharp decrease in November and December. This pattern may reflect not only atmospheric changes but also the proximity of the sensor to the snowpack. The surface layer over snow is usually under near-saturated conditions, and surface sublimation contributes to creating a vertical moisture gradient (Andreas Reference Andreas2002). This gradient probably overlaps with moisture variability due to circulation changes over the year, but the increase in relative humidity with snow depth suggests that the snowpack is the primarily driver of these changes.
Precipitation
Solid precipitation is particularly difficult to measure accurately, primarily due to undercatchment of precipitation measurements due to wind, which affects all types of precipitation gauges (Goodison et al. Reference Goodison, Louie and Yang1998, Rasmussen et al. Reference Rasmussen, Baker, Kochendorfer, Meyers, Landolt and Fischer2012, Nitu & Coauthors Reference Nitu and Coauthors2018, Kochendorfer et al. Reference Kochendorfer, Earle, Rasmussen, Smith, Yang and Morin2021). In the Antarctic Peninsula, a significant portion of precipitation falls as solid precipitation in the form of snow, making obtaining accurate precipitation measurement challenging. It has been reported previously in the Antarctic Peninsula that different instruments report varying precipitation quantities (Tang et al. Reference Tang, Chenoli, Colwell, Grant, Simms, Law and Abu Samah2018).
Manual or tipping bucket gauges (TBGs) are widely used in national observation networks to measure precipitation. TBGs need to be heated to melt the solid precipitation within the funnel before obtaining measurements. However, power limitations can lead to delayed melting or the absence of melting, introducing further measurement errors, rendering it difficult to perform corrections on the data obtained (Buisán et al. Reference Buisán, Earle, Collado, Kochendorfer, Alastrué and Wolff2017, Kochendorfer et al. Reference Kochendorfer, Earle, Rasmussen, Smith, Yang and Morin2021). Historically, since 1988, TBGs have been used by AEMET to measure precipitation in Antarctica, but in March 2022 AEMET installed a WG with a single Alter shield (Fig. 2c), alongside the historical TBG. The main advantage of WGs is that they do not require power for melting solid precipitation before measurement. This factor is critical during winter months due to power limitations and there being no in situ staff. This setup was designed to study precipitation undercatchment in Antarctica, and it has served as the primary precipitation dataset since its installation.
Figure 5a presents the historical data series of precipitation measured using TBGs, assuming great uncertainty in the measurements, particularly during winter months. This uncertainty makes it difficult to compare precipitation between different months. Figure 5b,c illustrates the monthly precipitation difference using the 2 year intercomparison period. As expected, this difference is more pronounced in winter, coinciding with a higher snow fraction, and it peaks in August. From November to April this difference is more stable, at between 20% and 40%. However, there is still high uncertainty regarding what percentage of precipitation has not been measured by the TBG due to capping effects and freezing of mechanical components, as well as regarding how the melting delays can lead to erroneous assignment of precipitation to following days and therefore, in some cases, to following month.
a. Monthly mean precipitation climatology with the tipping bucket gauge (TBG) from 1988 to 2023. b. Monthly mean difference in precipitation measurements between the weighing gauge (WG) and the TBG during the intercomparison experiment from March 2022 to February 2024. c. Monthly precipitation according to the TBG (dark blue) and WG (light blue) during the intercomparison experiment. d. Accumulated precipitation according to the TBG (blue) and WG (red) during the intercomparison experiment.

We consider the WG as the reference in this work, although it should be noted that this gauge also underestimates the solid precipitation and requires further correction (Kochendorfer et al. Reference Kochendorfer, Earle, Rasmussen, Smith, Yang and Morin2021). Figure 5d shows the total accumulated precipitation over 2 years measured by the TBG and WG. Whereas the TBG measured 920.7 mm, the WG measured more than 40% more (1580.53 mm), which suggests a preliminary undermeasurement of precipitation not accounted for of 660 mm over 2 years.
Additional sources of error affect both gauges. For example, wind-driven snow transport and subsequent deposition in the gauges may lead to false readings of precipitation. This factor is difficult to estimate but can be locally significant depending on the position and the height of the precipitation gauge. The TBG orifice is located at 1.5 m above the ground, whereas the WG orifice is located at 2.5 m above the ground, reducing the risk of this issue impacting results too significantly. As stated earlier, these values correspond to a lower end of the real precipitation, as the WG can also suffer from undercatchment, and so these data should be interpreted carefully, as they might further change after a longer period of comparison. In any case, they represent an initial effort to correct the measured precipitation climatology in Antarctica.
Snow depth, which has been measured since 2016, provides an additional metric related to precipitation (Fig. 6). Snow depth is highly variable in space (Trujillo & Lehning Reference Trujillo and Lehning2015, Mott et al. Reference Mott, Vionnet and Grünewald2018) and is recorded at the station’s location on a flat area near the beach at an elevation of 15 m a.s.l. A small portion of precipitation during the summer falls as snow, and it melts quickly after accumulating just a few centimetres. The permanent snowpack typically forms between April and May, growing rapidly between June and August, when it reaches a maximum of ~80 cm. This snowpack remains stable until late November, after which it decreases sharply, with bare ground appearing by the end of December.
Climatology of the snow depth at Juan Carlos I (JCI) station. Each value corresponds to the mean over 10 days. The blue line indicates the daily mean snow depth for each calendar day, and the shaded area represents the values between the 25th and 75th percentiles.

Our precipitation measurements with the WG over 2 years suggest that ~400–500 mm of winter precipitation is accumulated in the snowpack every year. However, these values might still be biased due to the pluviometry uncertainty. Accumulating this quantity in just 80 cm of snow implies two main factors: 1) the snow in the region is heavy, probably due to the high-moisture and near-melting conditions of this region that is close to the sea, supported by snow density measurements on King George Island of above 450 kg m−3 in November (Falk et al. Reference Falk, López and Silva-Busso2018), and 2) snow loss from the island occurs through transport into the sea. The accurate quantification of each factor is challenging and requires further study.
Wind
Although the SSI are located within the westerly wind belt region of the general atmospheric circulation, characterized by a strong cyclonic component, the wind roses of JCI and GdC (Fig. 7) highlight the critical role of mesoscale phenomena on both Deception Island and particularly Livingston Island. This influence is apparent at varying scales, including meso-α (200–2000 km), meso-β (20–200 km) and meso-γ (2–20 km) scales. At the meso-α scale, nearby islands - Low, Snow and Smith - block and deflect the westerly winds downstream affecting Livingston and Deception islands, and their rugged topographies further complicate local wind patterns at meso-β and meso-γ scales (Styszynska Reference Styszynska1990). Mountain ranges, bays and coastlines significantly affect both the direction and intensity of winds recorded at JCI and GdC stations. In general, GdC reflects more unperturbed flow than JCI, with higher wind speeds and a symmetrical wind rose with an increased frequency of the westerly winds over the easterly component. In contrast, JCI is largely influenced by the very complex orography of the island, which leads to wind-blocking and downstream accelerations.
Frequency of a. & b. mean wind speed and c. & d. wind gust speed aggregated by wind direction at a. & c. Juan Carlos I and b. & d. Gabriel de Castilla stations. Direction is aggregated every 22.5°, and colours indicate the different categories of wind speed.

At both sites, the south-westerly wind direction is the most frequent. However, at JCI, the Hurd Peninsula blocks this flow, resulting in slight directional deviations and reducing wind intensity by ~50% compared to the Mount Reina Sofía AWS. At GdC, the south-westerly and west-south-westerly wind directions are not only the most frequent, but also the most intense due to the strong and persistent gradient linked to the low configuration over the Weddell Sea (Gonzalez et al. Reference Gonzalez, Vasallo, Recio-Blitz, Guijarro and Riesco2018). North-easterly winds are also common, caused by low-pressure systems moving through the Drake Passage. At JCI, the pass between the 300 m-high dome north of South Bay and the mountains to the north-east of the station (400–600 m) modifies the wind flowing between the north-east and north-east directions into north-easterly winds. The blocking and channelling of the winds on Livingston Island further affects Deception Island, located immediately to the south. In contrast, GdC experiences fewer winds from the northern component, which are sometimes channelled from the east. Easterly winds, although less frequent, can occur due to low-pressure systems positioned just north of the islands. When easterly winds do occur at JCI, they are often exacerbated by the Friesland Mountains. Once the wind velocity overcomes the orography and the stable boundary layer, the result is very strong wind gusts, such as those of 38 m s−1 recorded on 17 February 2016. Seasonal wind variations (not shown) indicate stronger south-westerly and easterly winds in winter, which correspond with more frequent cyclonic activity near the islands, particularly over the Weddell Sea. In contrast, northerly to north-easterly winds are more common in summer, driven by warm and moist advections, especially affecting JCI due to its location on the windward side of Deception Island.
Pressure
The atmospheric sea-level pressure observed at JCI and GdC stations does not present large annual variations (Fig. 8). The average sea-level pressure varies at both stations between 983 and 995 hPa. The pressure oscillation is primarily dominated by the first harmonic, with lower pressures occurring from mid-October to mid-May (ranging from 983 to 990 hPa) and higher pressures occurring during the rest of the year (mostly above 990 hPa, although with greater variability). A secondary maximum is observed in summer, and early autumn pressures are higher than those in late spring, reflecting the influence of the second harmonic, associated with the semi-annual oscillation (van Loon Reference van Loon1967). Although the semi-annual oscillation has a lower amplitude and explains less variance in the SSI compared to the rest of Antarctica (van den Broeke Reference van den Broeke1998), its presence is still noticeable in the data.
Climatology of the mean sea-level pressure at a. Juan Carlos I (JCI) and b. Gabriel de Castilla (GdC) stations. Each value corresponds to the mean over 10 days. The black lines indicate the daily mean sea-level pressures for each calendar day, and the shaded areas represent the values between the 25th and 75th percentiles.

Radiation
As is shown in Fig. 9, no significant differences are observed between JCI and GdC stations in terms of global incoming shortwave radiation. This value includes not only solar and diffuse radiation in the atmosphere but is also modulated by cloudiness (Soares et al. Reference Soares, Alves, Ribeiro and Codato2019) and the reflection of the radiation, especially in the surrounding snow-covered surfaces, which might be locally important (Cordero et al. Reference Cordero, Feron, Sepúlveda, Damiani, Jorquera and Rowe2023). In both locations, global incoming shortwave radiation reaches its annual maximum during the summer, peaking at the beginning of December and remaining high until mid-February. The similar values indicate that climatological cloudiness in both places is similar and that the effect of reflection due to the surrounding snow-covered surfaces does not differ significantly. These results indicate that local orography does not affect radiation significantly, as it does with the wind. At the end of the summer, radiation gradually decreases, reaching minimum values between May and July, coinciding with the absence of direct solar radiation (in these months the sun elevation remains below 10° above the horizon). Radiation increases again in spring, completing the annual cycle that is determined by the length of the daylight and the height of the sun throughout the year in the region. Interannual variability is significant, particularly in summer, when radiation is affected by cloud cover, which is associated mostly with the arrival of warm and moist air masses from the north.
Climatology of the total shortwave radiation at a. Juan Carlos I (JCI) and b. Gabriel de Castilla (GdC) stations. Each value corresponds to the mean over 10 days. The yellow bold lines indicate the daily mean total shortwave radiation for each calendar day, and the shaded areas represent the values between the 25th and 75th percentiles. The upper dotted lines indicate the daily maxima.

Extreme weather events
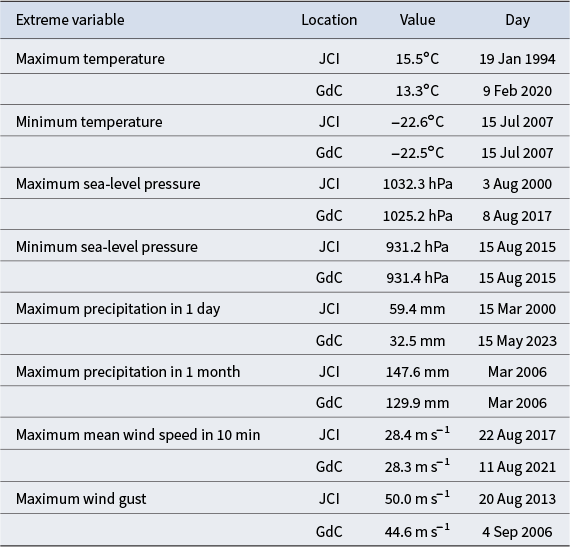
Monitoring the most extreme events allows us to understand the physical limits of the atmosphere and detect potential regime shifts (Cerveny et al. Reference Cerveny, Lawrimore, Edwards and Landsea2007). However, the extreme values for individual stations are limited by the length of the time series. Table I presents the extreme values of temperature, pressure, precipitation and wind recorded at JCI since 1988 and at GdC since 2005 until 2023.
Extreme weather values for different variables at Juan Carlos I (JCI) and Gabriel de Castilla (GdC) stations.

The warmest temperature at JCI was recorded on 19 January 1994 at 15.5°C, caused by a low-pressure system advecting warm winds from lower latitudes. The lack of a station at GdC at that time does not allow us to evaluate whether Deception Island reached similar temperatures to those recorded on Livingston Island. At GdC, the maximum temperature was recorded during the February 2020 heatwave linked to an atmospheric river affecting the region (Gorodetskaya et al. Reference Gorodetskaya, Durán-Alarcón, González-Herrero, Clem, Zou and Rowe2023). The coldest temperature measured at both JCI and GdC stations was measured on 15 July 2007, caused by a high-pressure system over Antarctica.
The highest daily precipitation extremes at JCI were 59.4 mm, accumulated on 15 March 2000, and 32.5 mm at GdC, accumulated on 15 May 2023. Both cases were produced by atmospheric rivers, which are known to transport moisture from the tropics and to provide the conditions for extreme precipitation in the western Antarctic Peninsula (Gonzalez-Herrero et al. Reference González-Herrero, Vasallo, Bech, Gorodetskaya, Elvira and Justel2023). In the case of JCI, the precipitation was further enhanced by a low-pressure system with an associated cold front over the Drake Passage. As discussed earlier, precipitation gauges, particularly TBGs, tend to underestimate precipitation during the cold season. The addition of the WG, despite its own limitations, allows for better characterization of mid-winter extreme precipitation, a phenomenon that has received relatively little attention in the region (Bozkurt et al. Reference Bozkurt, Carrasco, Cordero, Fernandoy, Gómez-Contreras, Carrillo and Guan2024b). At longer temporal scales, the highest monthly precipitation (with non-corrected data) occurred in March 2006 at both stations, with JCI receiving 147.6 mm and GdC recording 129.9 mm. The higher precipitation at JCI highlights the orographic enhancement of precipitation on Livingston island.
Unlike the other variables, the maximum mean wind speeds and gusts do not occur simultaneously at both stations. At JCI, the highest wind speed, 28.4 m s−1, was recorded on 22 August 2017, and the maximum gust, 50.0 m s−1, occurred on 20 August 2013. At GdC, the highest mean wind and gust records are 28.3 m s−1 on 11 August 2021 and 44.6 m s−1 on 4 September 2006, respectively. The discrepancies in the dates illustrate that wind, unlike the other variables analysed, are not synchronized between the two sites and are primarily driven by mesoscale processes.
Trends, variability and teleconnections
We compared the monthly temperatures of JCI and GdC, which are representative of the western SSI, with those from several stations on King George Island, which represent the central SSI and are often used as references of the full archipelago. Despite being farther south, JCI is between 0.34°C and 1.12°C warmer than the stations on King George Island and 0.55°C warmer than GdC. This suggests that JCI is at one of the warmer locations in Antarctica.
The comparison between JCI and GdC (Fig. 10a,b) shows that, while the warm season temperatures are similar, winter temperatures, particularly during May and June, are ~1°C warmer at JCI. This difference is probably due to stronger cold air pooling and thermal inversion inside the Deception Island caldera, where the crater’s enclosed topography limits mixing with the surrounding air mass. Additionally, the calmer waters in the caldera reduce ocean-atmosphere heat exchange compared to the more open South Bay at Livingston Island, where JCI is located. While seasonal sea-ice formation in the caldera (typically from July to October) may further amplify the temperature difference later in winter, it does not explain the peak difference observed in May and June. Instead, this early winter contrast is probably driven by a combination of reduced turbulent mixing, limited oceanic heat flux within the caldera and enhanced radiative cooling under stable conditions at GdC.
Monthly mean temperature differences between a. & b. Juan Carlos I (JCI) and Gabriel de Castilla (GdC) stations and between c. & d. JCI and Bellingshausen stations. a. & c. present comparisons of the monthly mean temperatures, with the black lines indicating the identity function and the coloured lines showing the linear regression. b. & d. show the mean differences by month (solid lines) and one standard deviation (shaded areas).

When comparing the monthly temperatures between JCI and Bellingshausen Station on King George Island (Fig. 10c,d), we observe a mean difference of 0.86°C, which remains stable across seasons. This suggests that, unlike the seasonal differences between JCI and GdC, the temperature difference between the western and central SSI is driven by non-seasonal factors. With the available data, it is unclear what causes this difference, but we hypothesize that the shallower bathymetry in the western SSI might play a role.
Figure 11 presents the annual and seasonal temperatures at JCI for years and seasons where more than 80% of the data are available. Despite the relatively short observational period meeting this constraint, we have included linear trends to illustrate how sensitive these trends are to the specific start and end years, as highlighted in Gonzalez & Fortuny (Reference Gonzalez and Fortuny2018). Two main trends, already identified in the literature, can be observed: a cooling period from the beginning of the consistent observations at JCI (late 1990s and early 2000s) until 2016, which is particularly noticeable in the annual and spring mean temperatures, followed by a subsequent temperature increase. However, the high interannual variability at JCI, similar to other stations on the Antarctic Peninsula, makes interpreting these trends over such short periods challenging. This variability is particularly pronounced in winter.
a. Mean annual (ANN) and seasonal (b. summer, c. autumn, d. winter and e. spring) temperatures at Juan Carlos I (JCI) station. Annual data include only years with more than 10 months with at least 80% of the data available. Seasonal data include seasons with at least 80% of the data available. The red lines show the linear trends.

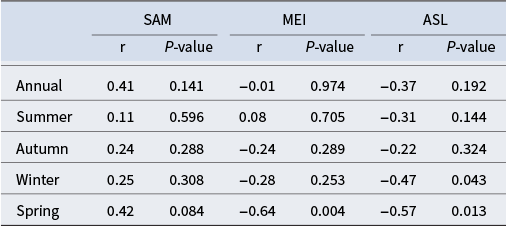
The western SSI temperature variability is partially driven by large modes of variability, such as the Southern Annular Mode (SAM), El Niño Southern Oscillation (ENSO) or the position and depth of the Amundsen Sea Low (ASL). Table II presents the correlation between the temperatures and an index representative of these climate modes: the SAM index (Marshall Reference Marshall2003), the Multivariate ENSO Index (MEI; Wolter & Timlin Reference Wolter and Timlin1993) and the ASL relative central pressure (Hosking et al. Reference Hosking, Orr, Marshall, Turner and Phillips2013). At the annual level, none of these indices correlate significantly with temperatures at JCI. The limited explanatory power of these indices highlights the complexity of the teleconnections affecting the western SSI (Clem et al. Reference Clem, Renwick, McGregor and Fogt2016). Several atmospheric synoptic processes beyond the traditional indices may modulate the region’s temperature, including persistent atmospheric blocking patterns (Wille et al. Reference Wille, Favier, Jourdain, Kittel, Turton and Agosta2022, Bozkurt et al. Reference Bozkurt, Marín, Verdugo and Barrett2024a) or central tropical pacific convection, which remotely trigger extreme warming and melt episodes via Rossby wave trains (Clem et al. Reference Clem, Bozkurt, Kennett, King and Turner2022).
Annual and seasonal correlation of Juan Carlos I station temperatures and three modes of variability: the Southern Annular Mode (SAM), the El Niño Southern Oscillation (ENSO) the Amundsen Sea Low (ASL).

However, at the seasonal level, all indices seem to contribute to the spring temperatures, making spring the season most influenced by regional teleconnections, as has been observed in previous studies (Schneider et al. Reference Schneider, Deser and Okumura2012, Clem & Fogt Reference Clem and Fogt2013). In particular, the correlation of spring temperatures with the ASL and MEI is strong, whereas the SAM shows weaker correlations with JCI temperatures. This is particularly surprising as the SAM is widely recognized as the leading mode of variability in the region. We can find a possible explanation for this in local factors, such as the island’s blocking effect on winds from the west and north-west, which is significantly enhanced by the SAM. This blocking effect extends upstream a few kilometres from Livingston Island’s highest mountains, limiting the temperature increases associated with this warm advection. This highlights once more the importance of local orography at JCI. Interestingly, despite the remote location of the ASL during winter, there is still a notable correlation between winter temperatures and ASL depth.
Conclusions
This paper discusses the climatology of the western SSI stations, particularly JCI and GdC, operated by AEMET for 35 years, which has received less attention compared to the more station-populated central archipelago. Despite the fact that the large-scale climate of the whole SSI is similar, we reveal that the western archipelago, and particularly JCI on Livingston Island, is warmer than the stations located on King George Island.
The comparison between JCI and GdC provides insights regarding which variables are governed by local conditions vs the regional-scale climate. For instance, pressure and radiation behave similarly at both stations, and temperature appears comparable at first glance. However, although summer temperatures are nearly identical, winter temperatures at GdC are ~1°C lower, probably due to cold air stagnation in the crater basin of Deception Island. The ~5% difference in relative humidity may also reflect the impact of Deception Island’s warmer volcanic soil. The most significant difference between the islands, however, is in wind direction. The large difference in wind direction between the stations reflects the role of mesoscale processes and how the prevailing wind interacts with the islands’ diverse orography. This highlights the importance of orography in the SSI, especially in comparison to warmer regions, as the stable cold air is more prone to local influences.
A novel aspect of this study is the emphasis on snow undercatchment in precipitation measurements. Here, we provide the first results of an intercomparison experiment between a TBG and a WG at JCI station, showing an undercatchment of ~40% annually, which is greater in winter, when undercatchment can exceed 80%. The lack of reliable precipitation data across Antarctic stations, along with substantial differences observed between atmospheric models (González-Herrero et al. Reference González-Herrero, Vasallo, Bech, Gorodetskaya, Elvira and Justel2023), makes precipitation one of the most uncertain variables in the region, especially during winter extreme events (Bozkurt et al. Reference Bozkurt, Carrasco, Cordero, Fernandoy, Gómez-Contreras, Carrillo and Guan2024b). Future research at JCI will focus on correcting precipitation measurements and developing local transference functions between the TBG and WG, as was recently performed during the recent WMO Solid Precipitation Intercomparison Experiment (SPICE) project (Nitu & Coauthors Reference Nitu and Coauthors2018). This will help to decrease winter precipitation uncertainty and provide proper physical parametrizations for meteorological models.
This study, along with Bañón et al. (Reference Bañón, Justel, Velázquez and Quesada2013) on Byers Peninsula, provides a comprehensive climatological framework for the region, serving as a reference for both climate studies and other areas of research conducted in the western SSI. Long-term monitoring at different locations allows us to better understand how variability in climate variables impacts the region.
Supplementary material
To view supplementary material for this article, please visit http://doi.org/10.1017/S0954102025100400.
Acknowledgements
We gratefully acknowledge the Ministerio de Ciencia, which funds the presence of AEMET’s Antarctic activities, for its continued support. We also thank the Unidad de Tecnología Marina (UTM) for providing essential logistical and technical assistance, which has been crucial for the deployment and maintenance of our observational and forecasting systems in Antarctica. We are further grateful to the two anonymous reviewers for their insightful comments, which significantly improved the quality of this manuscript. Finally, we sincerely thank Dr Andrés Barbosa for his unwavering support of AEMET’s forecasting and observation efforts in Antarctica.
Competing interests
The authors declare none.
Author contributions
SG-H conceptualized the study, organized the discussion groups and supervised the writing of all of the sections. IG-E made most of the plots together with CMJ-C and wrote the ‘Data and methods’ section. The ‘Introduction’ section was written mainly by SG-H. The ‘History of AEMET in Antarctica’ section was written mainly by JVA-M and MB. The ‘Data and methods’ section was written mainly by SG-H and IG-E. The ‘Near-surface air temperature’ section was written mainly by JBA-P and JM-M. The ‘Relative humidity’ section was written mainly by SG-H and AA-R. The ‘Precipitation’ section was written mainly by SG-H and SB. The ‘Wind’ section was written mainly by CMJ-C and BE-M. The ‘Pressure’ section was written mainly by SG-H and AA-R. The ‘Radiation’ section was written mainly by IG-E and AMD-R. The ‘Extreme weather events’ section was written mainly by NC-C and JF-G-M. The ‘Trends, variability and teleconnections’ section was written mainly by SG-H and BE-M. All authors contributed to data collection and analysis and reviewed the final version of the article.


 Open access