




1. Introduction
Judicial claims challenging healthcare-rationing decisions have been filed in several countries and against health systems of different types, including those mainly funded by general taxation, payroll deductions, or the mandatory purchase of private insurance.Footnote 1 These claims are usually filed by individual patients when their health systems deny them funding for medical treatment due to limited resources or disagreement regarding the scientific evidence backing its use.
Common to these lawsuits discussed in the literature is the fact that they are filed against health systems that aim to provide universal health coverage (UHC). They often seek access to treatments (especially, but not only, high-cost drugs) beyond the benefits packages each system regularly provides to their users. These claims are grounded, implicitly or explicitly, on a legal right to healthcare that is arguably breached when funding for a potentially beneficial treatment is denied.
Latin American countries stand out among the jurisdictions where this sort of litigation can be found. The number of such legal claims can be very high in this region, as well as claimant´s rate of success. For instance, in some courts in Brazil and in Colombia, patients prevail in over 90% of cases, making it much more likely than not that courts will order health systems to fund the requested treatment, even if it is not part of the standard package of benefits these systems provide (Wang, Reference Wang2022). Litigation, therefore, can have major impact on health systems’ budget and organisation (Flood and Gross, Reference Flood and Gross2014; Yamin and Gloppen, Reference Yamin and Gloppen2011).
The health rights litigation phenomenon has generated heated debates about the distributive impact of court orders that benefit individual claimants and about courts’ institutional capacity and legitimacy to review regulatory or administrative decisions that involve complex scientific evidence and tragic choices. These lawsuits highlight the tension between two elements seen as necessary to promote UHC: the recognition of legal rights to healthcare and fair priority-setting (Rumbold et al., Reference Rumbold, Baker, Ferraz, Hawkes, Krubiner, Littlejohns, Norheim, Pegram, Rid, Venkatapuram, Voorhoeve, Wang, Weale, Wilson, Yamin and Hunt2017; Dittrich et al., Reference Dittrich, Cubillos, Gostin, Chalkidou and Li2016; Wang, Reference Wang2022).
However, legal claims for access to treatment in the context of private health insurance have received less scholarly attention. In Canada, legal disputes about the right to buy health insurance have been the topic of important debates (Flood, Reference Flood2006; Flood and Thomas, Reference Flood and Thomas2010). There are also studies on the claims for the funding of medical treatment against insurance companies in Switzerland (Kesselring, Reference Kesselring2011) and in the Netherlands (Moes et al., Reference Moes, Houwaart, Delnoij and Horstman2017), where private insurance is mandatory and the primary scheme for accessing healthcare in the country.
The present paper, which analyses litigation against private health insurance companies in Brazil, offers one of the first empirical studies in English on litigation for the funding of treatment in the context of voluntary health insurance (VHI) schemes.Footnote 2
The focus on the case of Brazil is justified by the importance of the VHI sector there. As will be discussed further, it covers more than 50 million people and represents about one-third of the total health expenditure in the country (ANS, 2024b; Figueiredo et al., Reference Figueiredo, Prado, Medina and Paim2018; Brasil, 2022; Lara and Cechin, Reference Lara and Cechin2021; Rocha et al., Reference Rocha, Furtado and Spinola2021). Moreover, unlike the United States - where rights of action against insurance companies are limited and courts are deferential to plan administrators (Hoffman, Reference Hoffman2014) -, Brazil experiences a substantial volume of litigation and courts are willing to expand access to treatments beyond contractual terms and regulatory norms.
The volume of legal cases means that litigation carries broad implications for the Brazilian VHI sector in terms of costs, access, and resource allocation. Additionally, given the size of the sector and that insurance offers duplicate coverage in Brazil (it covers treatments already covered by the national health system), the effects of these decisions reverberate beyond the VHI sector and pose additional challenges to health care equality and priority-setting in the country.
Despite the volume and importance of the phenomenon, the existing literature in Brazil tends to be limited in scope, as will be discussed later in this article. It has also been largely overlooked by the international literature on health rights litigation in Brazil, which has focused on lawsuits brought against the Brazilian national public health system (Biehl, Reference Biehl2013; Ferraz, Reference Ferraz2020; Prado, Reference Prado2013; Wang, Reference Wang2015).
For comparison, statistics from the Brazilian Judiciary (CNJ, n.d.) show that, in 2022, 312 thousand claims were filed against the public sector, which serves Brazil´s entire population of 203 million people (15 claims per 10,000 people) (AGÊNCIA IBGE, 2024). In the same year, 168 thousand claims were filed against the VHI sector in 2022, which had around 50.1 million enrollees (33 claims per 10,000 people). As a result, the Brazilian VHI sector has the highest proportion of health rights lawsuits relative to the population covered in the world, narrowly surpassing Colombia, which the specialist literature considered the highest in the world (32 per 10.000 people) (Andia and Lamprea, Reference Andia and Lamprea2019; Ottar, Ferraz and Rakner, Reference Ottar, Ferraz, Rakner, Yamin and Gloppen2011).
This paper analyses a representative sample of 1,547 court of appeal decisions in three Brazilian states – São Paulo, Rio de Janeiro, and Minas Gerais – in legal cases that challenged insurance companies´ refusal to fund treatment. The analysis aims to map (a) the reasons why funding was denied by the insurance company, (b) the kinds of treatment and services for which claimants sought funding via courts, and (c) how the courts decided these claims.
Based on these findings, we discuss how the current patterns of Brazilian court decisions against the private insurance sector might present additional challenges to setting priorities through health technology assessment and explicit benefits packages in the VHI sector. Given the size of this sector, litigation against insurance companies is likely to have significant implications for healthcare equality and access in Brazil.
2. The voluntary private health insurance sector
Private health insurances are typically funded by non-income related resources (premiums) paid to the insurer entity, usually a private carrier. This type of insurance contrasts with public health insurance systems normally funded by taxation, payroll taxes or social insurance contributions (OECD, 2004, pp. 26–27). Private health insurance can be voluntary arrangements, although some countries make participation mandatory, such as the mandatory basic health insurance in Switzerland (Kesselring, Reference Kesselring2011; OECD, 2004, p. 26).
As voluntary arrangements, voluntary health insurance (VHI) schemes normally rely on the prepayment of premiums that are agreed upon between the beneficiary and the insurer. The OECD (OECD, 2004, p. 30–31) classifies VHI schemes as the primary system where it is the sole form of access to healthcare coverage, either because it is the main or the only available avenue for insuring health costs, or when VHI enrolment replaces coverage that would otherwise be available through public/mandatory schemes. The American model is a good example of a system that mostly relies on voluntary health insurance enrolment for most of its population, especially after the Affordable Care Act’s individual mandate was effectively repealed in 2017 (Fiedler, Reference Fiedler2020).
If there are alternatives to VHI schemes, and individuals enrolled in private insurance are also eligible for part or the totality of services provided by the public/mandatory scheme, then coverage might be of three types: duplicated, supplementary, and complementary.
In countries such as the United Kingdom and Brazil, coverage is duplicated because VHI schemes cover what the public health system already offers, potentially improving levels of service, reducing waiting times and expanding the choice of providers. VHI users, however, are not exempt from contributing to the public system and are not excluded from public coverage (OECD, 2004).
VHI is complementary when it ensures residual costs derived from payments to the main coverage scheme. Pettigrew and Mathauer (Reference Pettigrew and Mathauer2016) mention France and community-based health insurance schemes in Sub-Saharan Africa as examples of this model where VHI schemes reimburse fees and co-payments charged by the public health insurance. In the United States, individuals under Medicare can hire supplemental policies to cover co-payments (OECD, 2004, p. 40).
Lastly, VHI can have a supplementary role, covering health services not offered by the public/mandatory scheme, such as drugs, dental care or rehabilitation services. This is the case in Canada, where supplementary care is offered separately from other types of coverage and supplements the public healthcare for around 60 to 65% of the population (Flood, Reference Flood2014; Law et al., Reference Law, Kratzer and Dhalla2014; OECD, 2004, p. 39–40).
The WHO Global Health Expenditure Database shows that, from 2014 to 2020, VHI schemes represented around 6.8% of the total health expenses globally. This percentage greatly varies by region – from 4% and 6% for Western Pacific and European countries to 26% and 28% among countries in Africa and the Americas.Footnote 3 In almost all countries for which socioeconomic enrolees’ data was available, VHI was taken up by people in higher socioeconomic strata living in urban areas and in the most developed regions of each country (Sagan and Thomson, Reference Sagan and Thomson2016).
In Latin America, VHI play a prominent role. Sekhri and Savedoff (Reference Sekhri and Savedoff2005) show that, among developing nations, Latin America and the Caribbean held the highest percentage of countries where the proportion of total health expenditure with private health insurance exceeded 5%. Drechsler and Jütting (Reference Drechsler and Jütting2007) also note that the Latin American VHI industry experienced incredible growth and is particularly strong in Uruguay, Colombia, Chile, Brazil, Argentina, and Jamaica. Most countries in the region adopted U.S.-type prepaid healthcare programmes, heavily reliant on health maintenance organisations (HMOs) to which members pay monthly premiums. As in other regions, VHI in Latin America and the Caribbean is mostly contracted by upper-income populations.
3. Rights and access to treatment in the Brazilian VHI sector
Brazil has a national universal health system (Sistema Único de Saúde – from hereafter, SUS) funded by general taxation and free at the point of use. It also has a large VHI sector covering around 25% of the population (over 50 million people), accounting for nearly a third of the country´s total healthcare expenditure, and whose per capita expenditure is more than three times that of the public health system (ANS, 2024b; Figueiredo et al., Reference Figueiredo, Prado, Medina and Paim2018; Brasil, 2022; Lara and Cechin, Reference Lara and Cechin2021; Rocha et al., Reference Rocha, Furtado and Spinola2021).
Although called ‘supplementary health’ in Brazil (saúde suplementar), the VHI sector plays a duplicated role in the Brazilian healthcare system. Most of the services covered by VHI are already available within SUS. However, consumers buy insurance to gain access to a broader range of providers and expecting higher levels of care and shorter waiting times. Those whose private insurance covers hospital care (the most common type of insurance) will have access to private primary, secondary, and tertiary healthcare through their insurance. There is no option to opt out of SUS, and SUS cannot refuse treatment to those who are privately insured. However, if an insured patient receives from SUS a treatment that is covered by her insurance plan, then the insurance company must reimburse SUS for the expenses.
The VHI sector is composed of 675 insurance companies (ANS, 2024a), but five companies accounted for almost 30% of the total number of enrolees in 2020 (Cruz et al., Reference Cruz, Da Cunha, De Moraes, Marques, Tuon, Gomide and De Paula Linhares2022). Over 80% of enrolees obtain VHI through their employees or professional associations. Unlike private health plans bought directly by individuals or families, the premiums for these group contracts are not subject to price regulation (Wang et al., Reference Wang, Oliveira, Souza, Arantes and Miziara2024). VHI coverage is also predominantly concentrated in urban areas in the South and Southeast regions, where the richest states in the country are located (Souza Júnior et al., Reference Souza Júnior, Szwarcwald, Damacena, Stopa, Vieira, Almeida, Oliveira, Sardinha and Macário2021). As with general trends worldwide, enrolees are predominantly of higher socioeconomic strata and formally employed.
Unsurprisingly, the VHI sector is a main contributor to inequality in access to healthcare in Brazil as being insured is associated with better fulfilment of healthcare needs (Coube et al., Reference Coube, Nikoloski, Mrejen and Mossialos2023; Menezes-Filho and Politi, Reference Menezes-Filho and Politi2020). Apart from the inequality between those with and without VHI coverage, there are also inequalities between VHI enrolees. Souza Junior et al. (Reference Souza Júnior, Szwarcwald, Damacena, Stopa, Vieira, Almeida, Oliveira, Sardinha and Macário2021, p. 2538) examine VHI data from 2013 to 2019 and found that among enrolees, formal workers tend to pay less and have better coverage than informal workers. Moreover, among women with VHI, 20% did not have pregnancy and childbirth coverage, a percentage that also varies depending on socioeconomic strata (Souza Júnior et al., Reference Souza Júnior, Szwarcwald, Damacena, Stopa, Vieira, Almeida, Oliveira, Sardinha and Macário2021, p. 2539).
Federal Law n. 9656/98 is the main piece of legislation governing the VHI sector in Brazil. Oversight and regulation of this sector are carried out by the National Supplementary Health Agency (Agência Nacional de Saúde Suplementar, hereafter ANS). Federal Law n. 9656/98 establishes that every health insurance must cover treatments listed in the benefits package set by ANS (also known as ‘rol da ANS’). Health insurance contracts may cover more treatments than those listed in the obligatory package, but not less. The treatments within this package are determined by ANS and submissions for the listing of treatments are appraised by a multistakeholder group within the agency responsible for health technology assessment (HTA). Federal Law n. 9656/98 mandates ANS to consider evidence of efficacy, safety, effectiveness, cost-effectiveness and financial impact when assessing a technology.
Law 9656/98 also establishes a negative list with categories of treatments that are excluded from coverage, such as experimental and unregistered treatments, artificial insemination, and interventions for cosmetic purposes only. It also excludes coverage for drugs administered outside a hospital setting, except for cancer drugs, which must be covered if listed in the benefits package.
In response to the shortcomings in the ANS´s HTA (Guimarães, Reference Guimarães2014; Lisbôa and Caetano, Reference Lisbôa and Caetano2020), several reforms have aimed at promoting more transparency, plurality, and agility in the decision-making process. The current system allows submissions for the inclusion of a treatment in the benefits package at any moment. A decision must be rendered within 120 days, with the possibility of a 60-day extension. In 2022, Law 14307/22 determined that the treatments assessed and approved for inclusion in the public health system´s lists and protocols shall also be included in the ANS benefits package within 60 days (except treatments within the negative list mentioned above). This further reinforces the duplicated nature of VHI in Brazil.
Health insurance contracts can establish waiting periods during which coverage is limited for new enrolees or for pre-existing health conditions. The extension of these waiting periods is capped by legislation, and, in the case of accident and emergency care, it cannot exceed 24 hours. The law permits contracts to limit reimbursement only for treatments provided by in-network providers. However, in the case of emergency care, users can access other providers if necessary.
The regulation also sets deadlines for insurance companies to authorise service providers to administer treatments after a patient´s request, with a maximum of 21 days for more complex interventions. As a general rule, insurance companies are not obligated to fund treatments provided without prior authorisation. Additionally, there are restrictions to the reconfiguration of a plan´s network of providers. If a provider is removed, it must be replaced by an ‘equivalent’ alternative, and any reduction in the network requires prior approval from ANS.
VHI users who have their request for the funding of a specific treatment denied by their insurance company can resort to courts. Data from the Brazilian Judiciary indicate that there are over 168,000 lawsuits against these companies in Brazil per year (CNJ, n.d.). The existing evidence shows that the largest proportion of cases involve claims for health technologies not included in the ANS benefits package (Trettel, Kozan and Scheffer, Reference Trettel, Kozan and Scheffer2018; Wang et al., Reference Wang, Fajreldines, Vasconcelos, Malik, Oliveira, Souza, Souza, Arantes and Miziara2023). The legal disputes in these cases revolve around the question of whether insurance companies can be compelled to fund unlisted treatments prescribed to a patient. Grounded on the Consumer Protection Act (Federal Law 8.078/1990), enrolees argue that the ANS’s package is ‘non-exhaustive’, meaning that insurance companies can be compelled to fund non-listed treatments in an individual case if the medical need is proven. Insurance companies, notwithstanding, argue that the ANS’s mandatory package is ‘exhaustive’. Accordingly, unless additional coverage was agreed upon contract, the companies’ obligations are limited to what has been included in the package, which was the basis for calculating insurance premiums.
Despite the relevance of this debate and the volume of litigation, the existing studies examining these court cases are often limited in scope. They tend to concentrate solely on cases decided by a singular court (Cruz and Lima, Reference Cruz and Lima2022; Trettel, Kozan and Teixeira, Reference Trettel, Kozan and Scheffer2018; Scheffer, Reference Scheffer2013; Wang et al., Reference Wang, Fajreldines, Vasconcelos, Malik, Oliveira, Souza, Souza, Arantes and Miziara2023), filed against a specific insurance provider (Oliveira and Fortes, Reference Oliveira and Fortes2013; Teixeira et al, Reference Teixeira, Andrade, Cherchiglia, Marini and Souza2022), decided within a short period of time (Cruz and Lima, Reference Cruz and Lima2022), or that claim a particular treatment (Ramalho, Reference Ramalho2016).
This paper aims to provide a more comprehensive understanding of the phenomenon by analysing a larger dataset comprised of a representative sample of cases decided by the court of appeal in the three states with the highest number of VHI enrolees. It also analyses each case in considerable detail, extracting and analysing information about the technology sought by claimants, the legal issues in dispute, and the outcome of each case.
4. Methods
This study analyses a representative sample of decisions from courts of appeals in three Brazilian states – São Paulo, Rio de Janeiro, and Minas Gerais. Together, these states account for almost 60% of VHI enrolees in Brazil.Footnote 4 The decisions under analysis span from 2018 to 2021, covering cases decided before and during the COVID-19 pandemic.
A web crawler that interacts with the search engines from each state court´s website was developed to collect all decisions that mention the key-term ‘plano de saúde’ (health plan).Footnote 5 This is the term normally used in Brazil to refer to VHI. We experimented with other expressions related to the topic, such as ‘seguro de saúde’ (health insurance) and ‘saúde suplementar’ (supplementary health). However, they resulted in true positives that have mostly appeared in the search using ‘plano de saúde’ and many false positives. The web crawler developed simulates the human use of the search engines but offers gains of scale while reducing the risk of human error.
The data analysis involved the development of an unsupervised machine-learning computational routine to create clusters of decisions according to text similarity using a k-means algorithm. We then extracted a sample of 12 decisions for each cluster, which were analysed by the research team. At first, our goal was to identify clusters that contained false positives (i.e., cases that mentioned the key term but were outside the scope of this paper). Clusters that were very heterogeneous in terms of topics were dissolved and reclustered. We repeated this cycle of interaction between researchers and the algorithm several times to increase the automated classification´s precision in creating homogeneous clusters.
These clusters were then grouped according to four main topics: coverage denial (cases involving an insurance company’s refusal to cover a treatment), increase in insurance premium prices, continuation of contract (disputes about a contract’s modification or cancellation), and others (which includes various types of claims, such as medical malpractice).
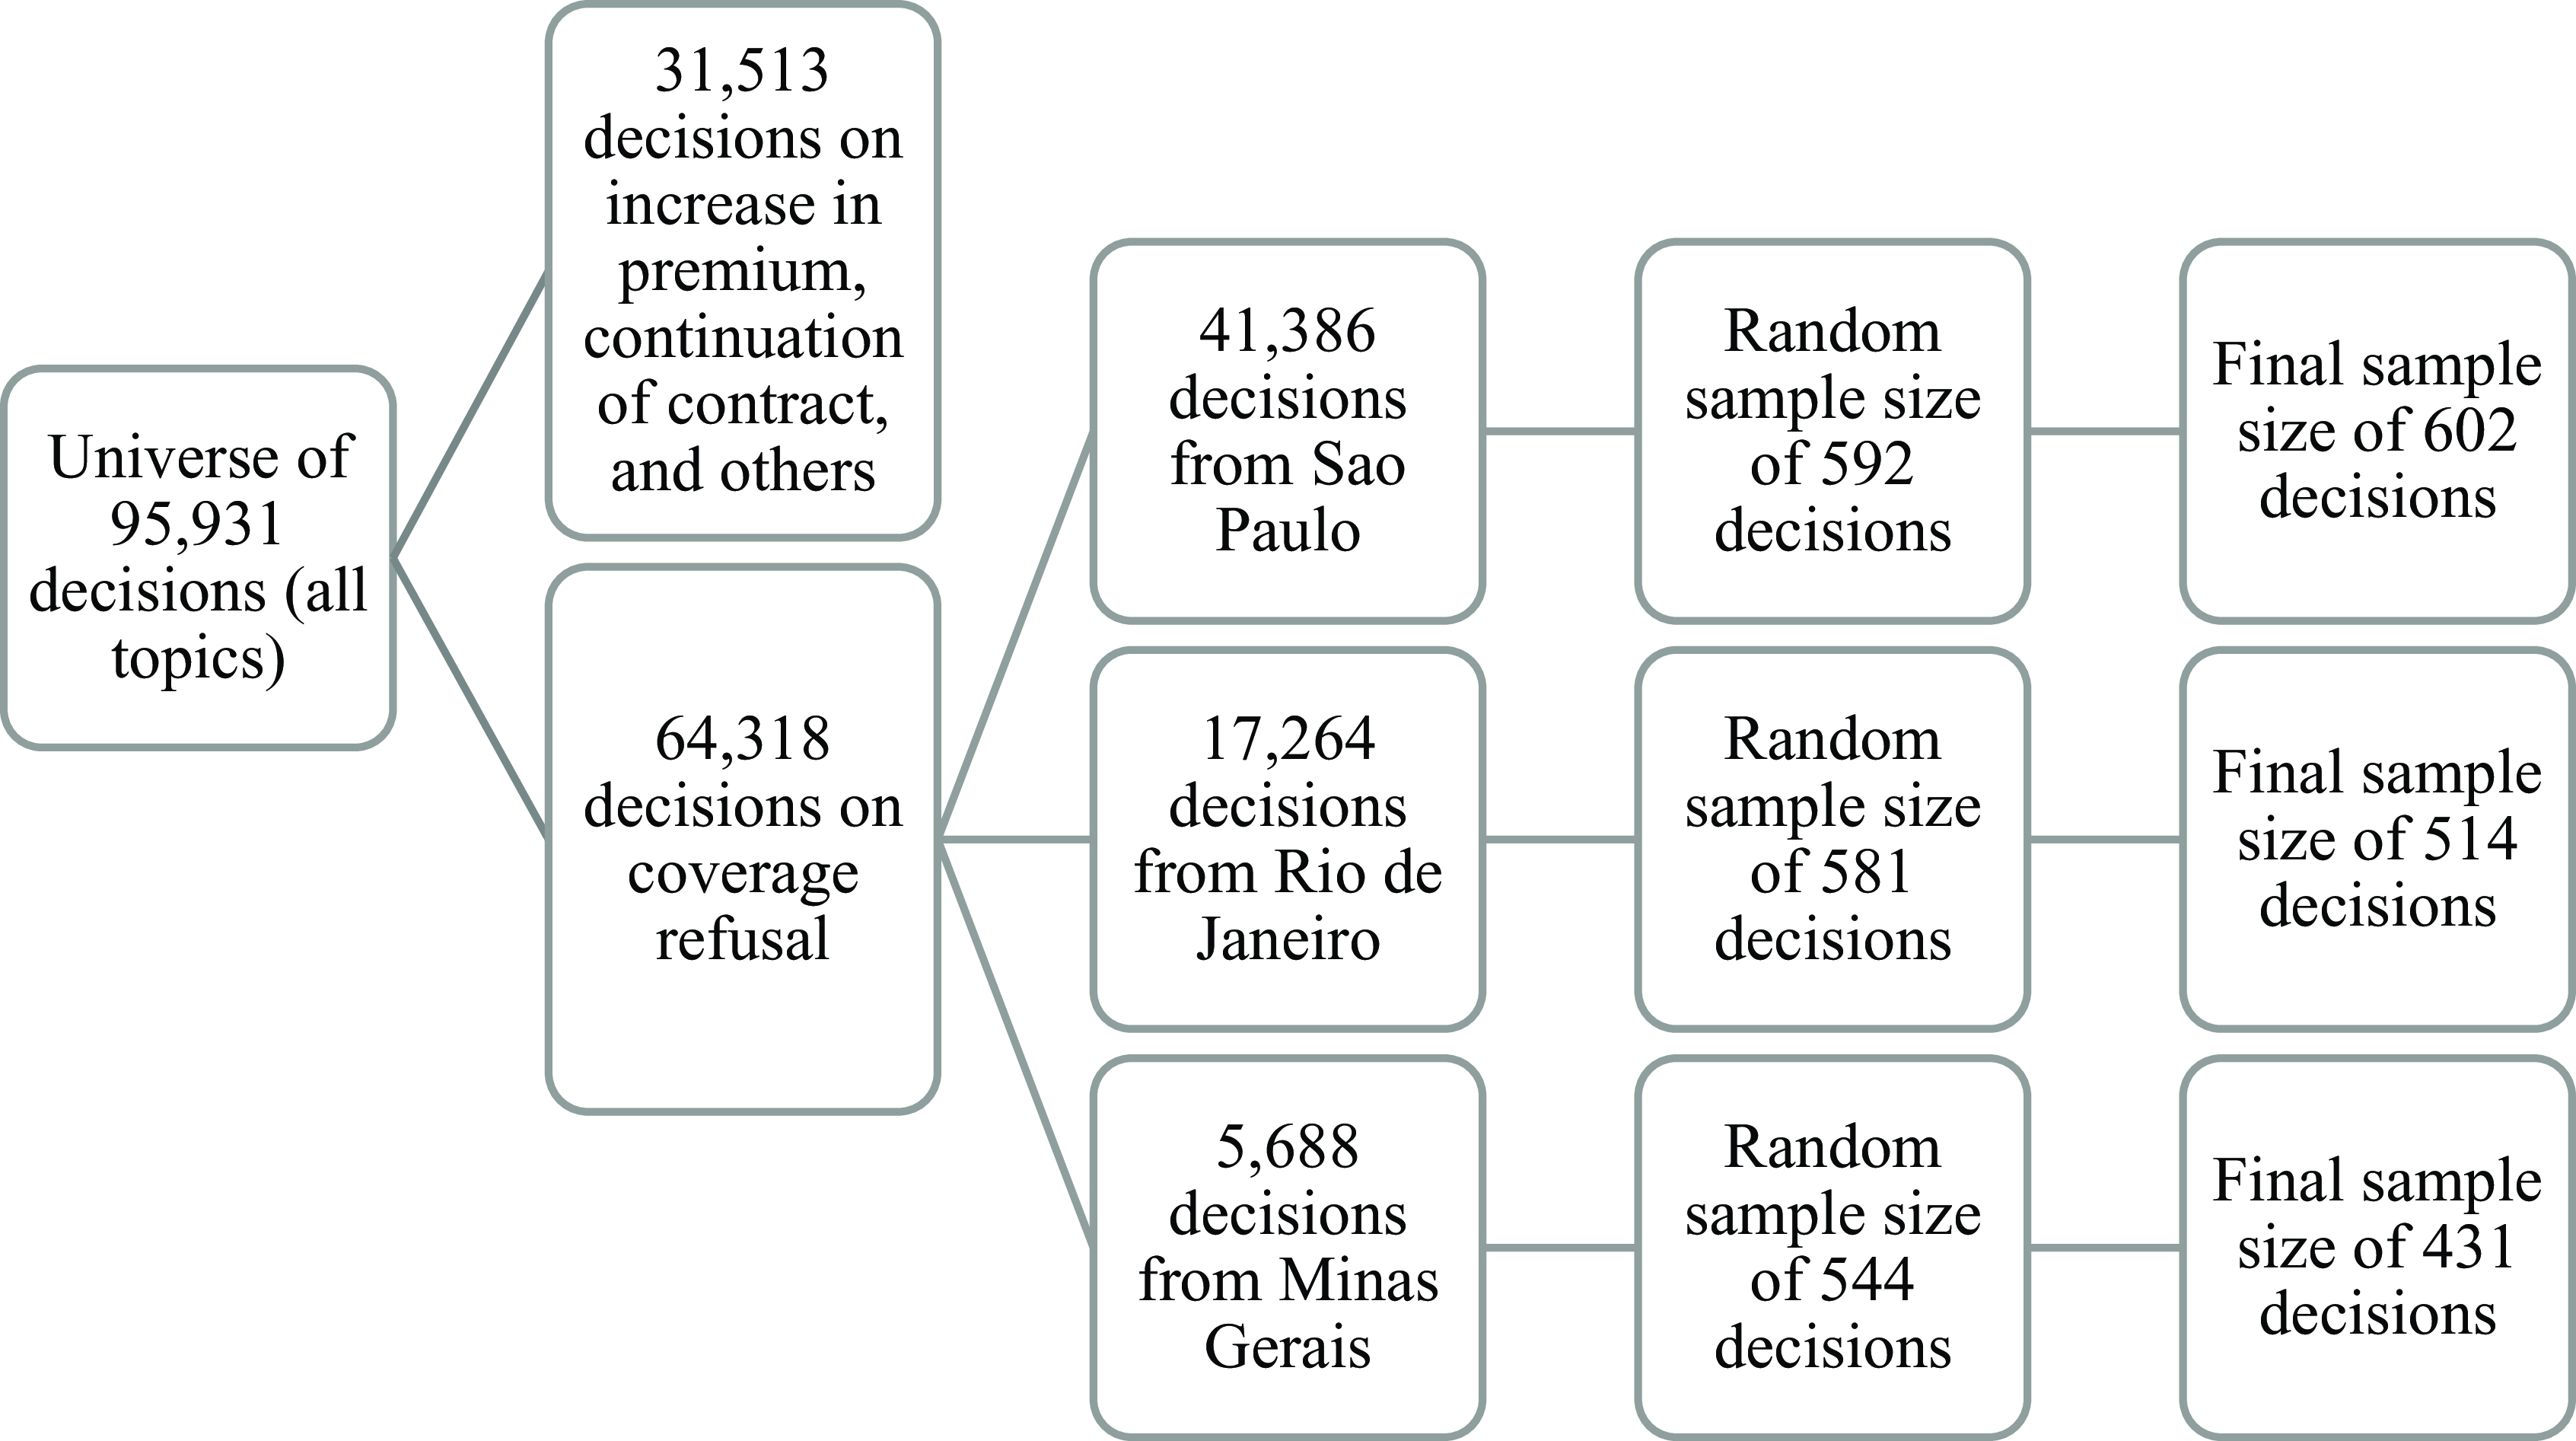
After all the decisions in our universe were classified, we selected only the cases on the topic of coverage denial, the predominant discussion before the three courts, accounting for more than 67% of the cases. We then drew a simple random sample for each state court aiming to achieve a margin of error of ±4% at the 95% confidence level. Our total sample size was 1,547 cases, with 431 cases from Minas Gerais state, 514 from Rio de Janeiro state, and 602 from São Paulo state (see Figure 1).
Flowchart of court cases from universe to sample by state.Footnote 6

The research team coded each sample by completing a Google Forms questionnaire and tested it several times to ensure intercoder reliability. Subsequently, we established a double-blind review protocol, where each researcher received a random quota of cases that another researcher also coded. Each pair of researchers coded this quota without discussing their answers with one another or with the team. We calculated the Cohen’s kappa (κ) for each variable for each pair of researchers, reaching an average κ of 0.8, which indicates a strong level of agreement between coders and a high level of reliability for our data (McHugh, Reference McHugh2012). From each decision, the questionnaire registered the treatment(s) sought by the claimant, the reason why funding was denied by the VHI company, and the court decisions and its main legal arguments.
Artificial intelligence (AI) was not employed at the coding stage as the research team was not confident that the technology could extract information from the texts with the same precision as humans. Large language models were not used to generate content but were occasionally employed to improve the readability and clarity of phrases and paragraphs. AI was used cautiously and conservatively in this paper, but it is possible to envisage wider applications in future research of this type (Choi, Reference Choi2023).
5. Results
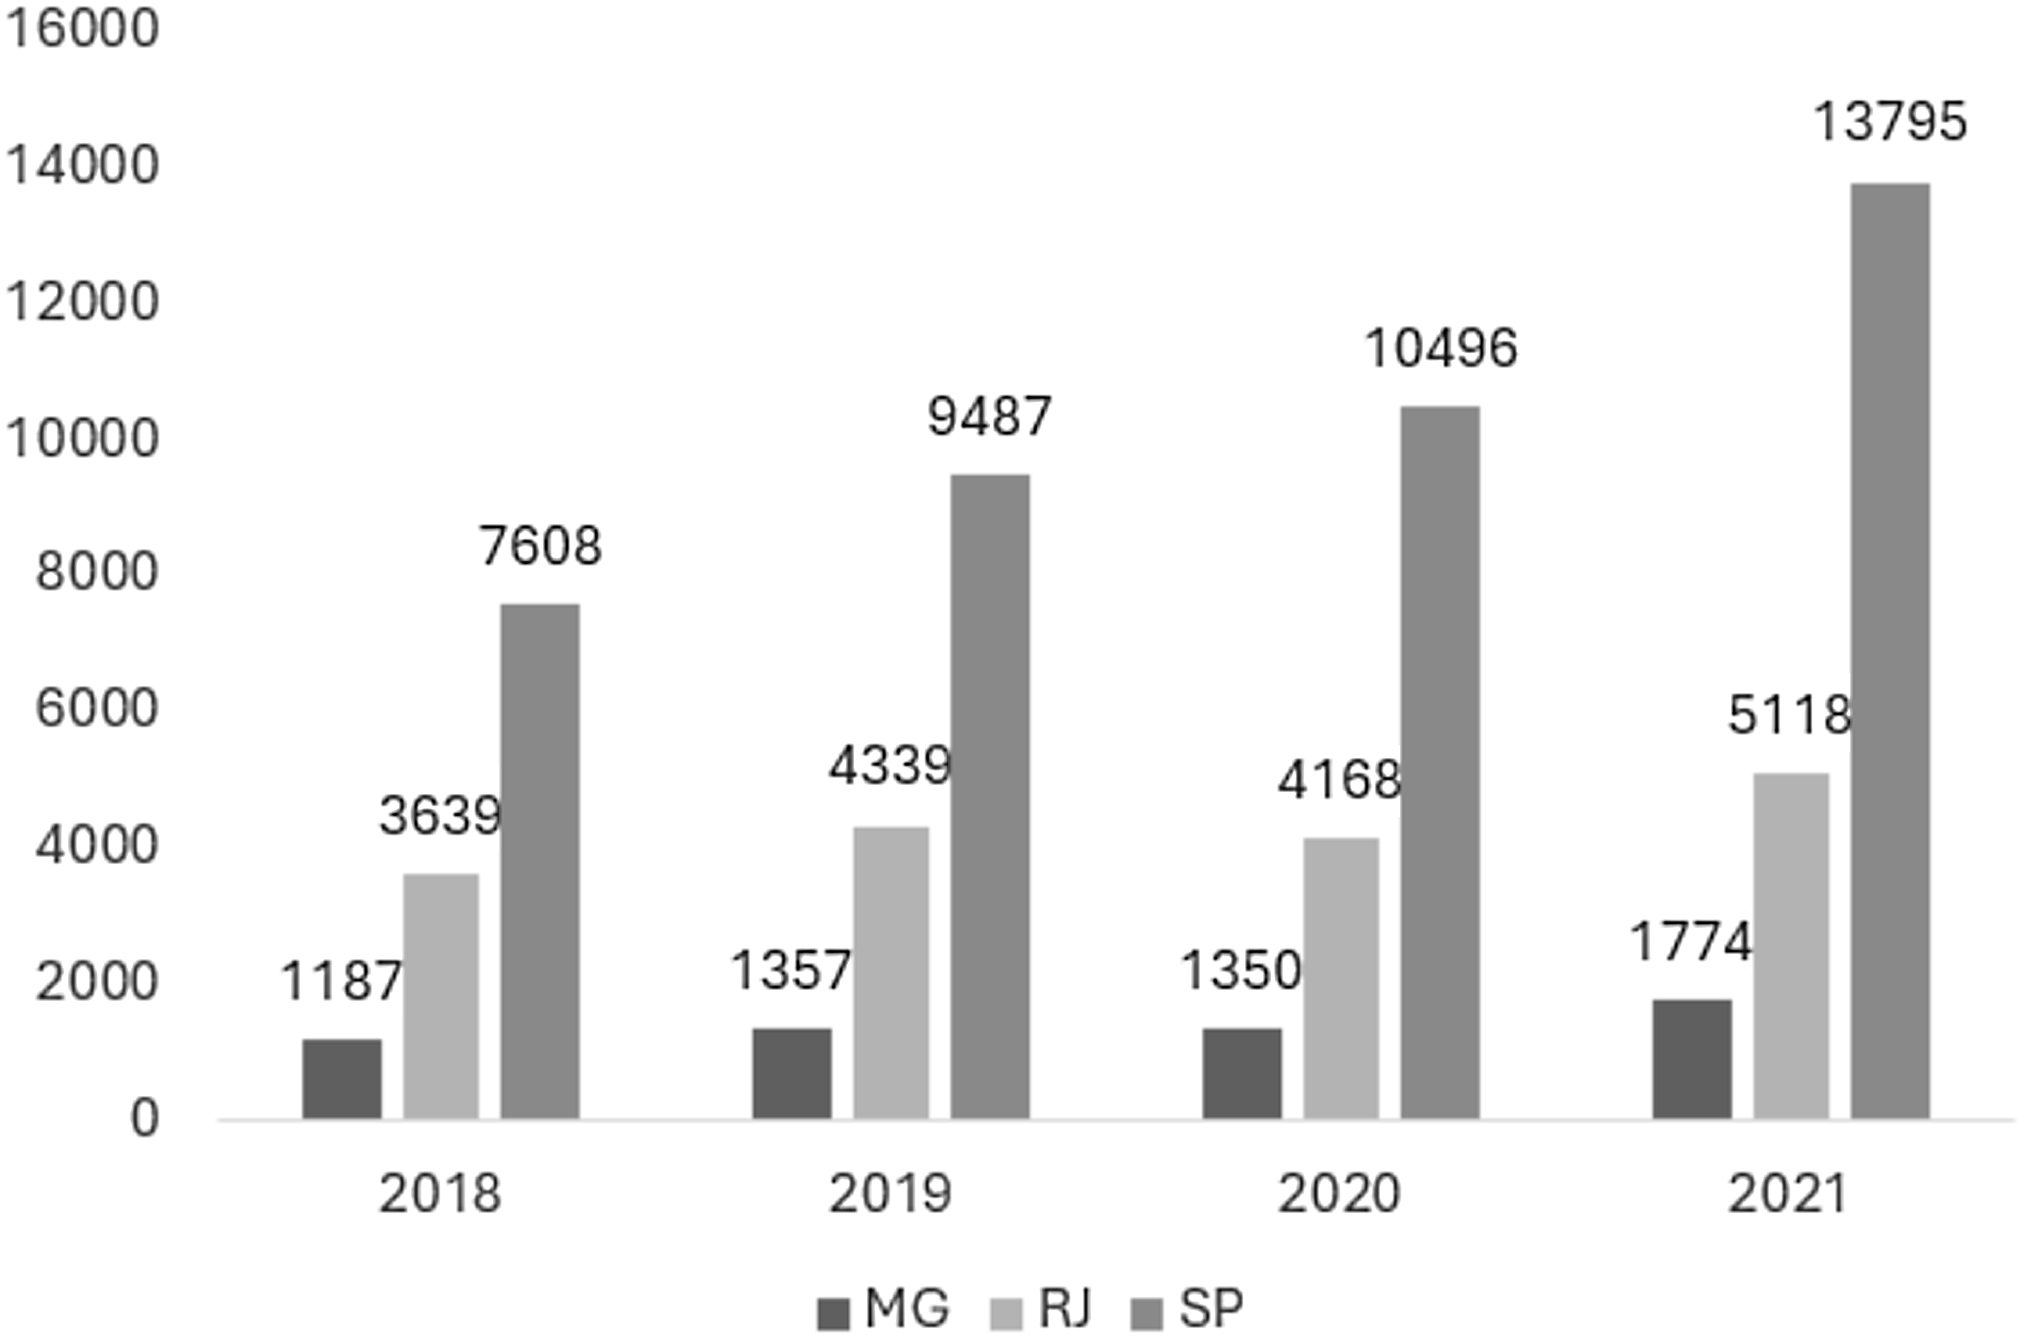
Between 2018 and 2021, the total number of decisions grew 40%. This is a remarkable growth considering that the pandemic year marks a reduction in the number of decisions in Minas Gerais and Rio de Janeiro and a slower increase in São Paulo. This can be explained by the fact that there was a sharp reduction in access to elective care during the pandemic (ANS, 2021). Yet, by 2021, all three courts showed signs of working through the backlog, as the increase from 2020 to 2021 was the highest during the period analysed (30%) (Graph 1).
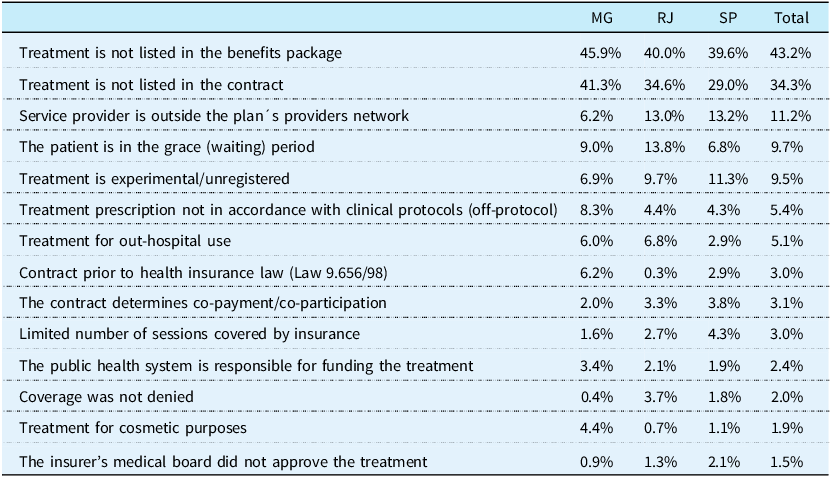
VHI companies, the defendants in all cases, presented a variety of legal reasons for denying funding for the claimed treatments (see Table 1). They most commonly justified denying coverage on the grounds that the treatment requested was not part of ANS’s benefits package (43.2%), was not included in the contractual agreement with claimants (34.3%), was experimental or lacking marketing authorisation (9.5%), or by arguing that the patient did not meet the clinical conditions set in treatment protocols (5.7%). These justifications are not mutually exclusive: experimental or unauthorised treatments cannot be included in the ANS´s benefits package and will likely be excluded from any contractual agreement. Moreover, if a treatment is part of the ANS’s benefit package, it cannot be excluded from a contractual agreement.
Most common reasons given by insurance companies to deny coverage a

a We identified a total of 53 different reasons, 39 of them reported by courts in less than 1.5% of cases. In 5.24% of cases, the court did not report why the insurance company denied coverage.
In these cases, patients are seeking access to treatments beyond what regulation mandates and/or their contracts provide. The legal disputes revolve around matters of law, particularly the question of whether insurance companies can be compelled to fund treatments that are not listed in the ANS benefits package and/or the contract.
A second, and smaller, set of cases comprises claims for treatment that are part of benefits’ packages (either ANS’s mandatory package and/or the insurance contractual agreement), but funding is denied on the basis that the patient had still to complete their contractual waiting period (9.7%) or had requested access to an out-of-network provider (11.2%). In these cases, instead of disputes around legal interpretation, courts are asked to rule on matters of fact. More specifically, they must decide whether the claimant was experiencing a medical emergency, which is a legal exception that allows claimants to seek out-of-network treatments and coverage during the waiting period.
It is important to note that there is some variation across the states. For instance, questions concerning whether a treatment is part of the benefits package or the contract agreement appeared more often in Minas Gerais than in Sao Paulo or Rio de Janeiro. The arguments that a treatment was prescribed for a condition that did not match ANS´s clinical protocols (i.e., off-protocol use) or that it was prescribed for cosmetic purposes also appeared more often in Minas Gerais. In Sao Paulo and Rio de Janeiro, disputes about out-of-network claims or experimental/unregistered drugs were comparatively more common.
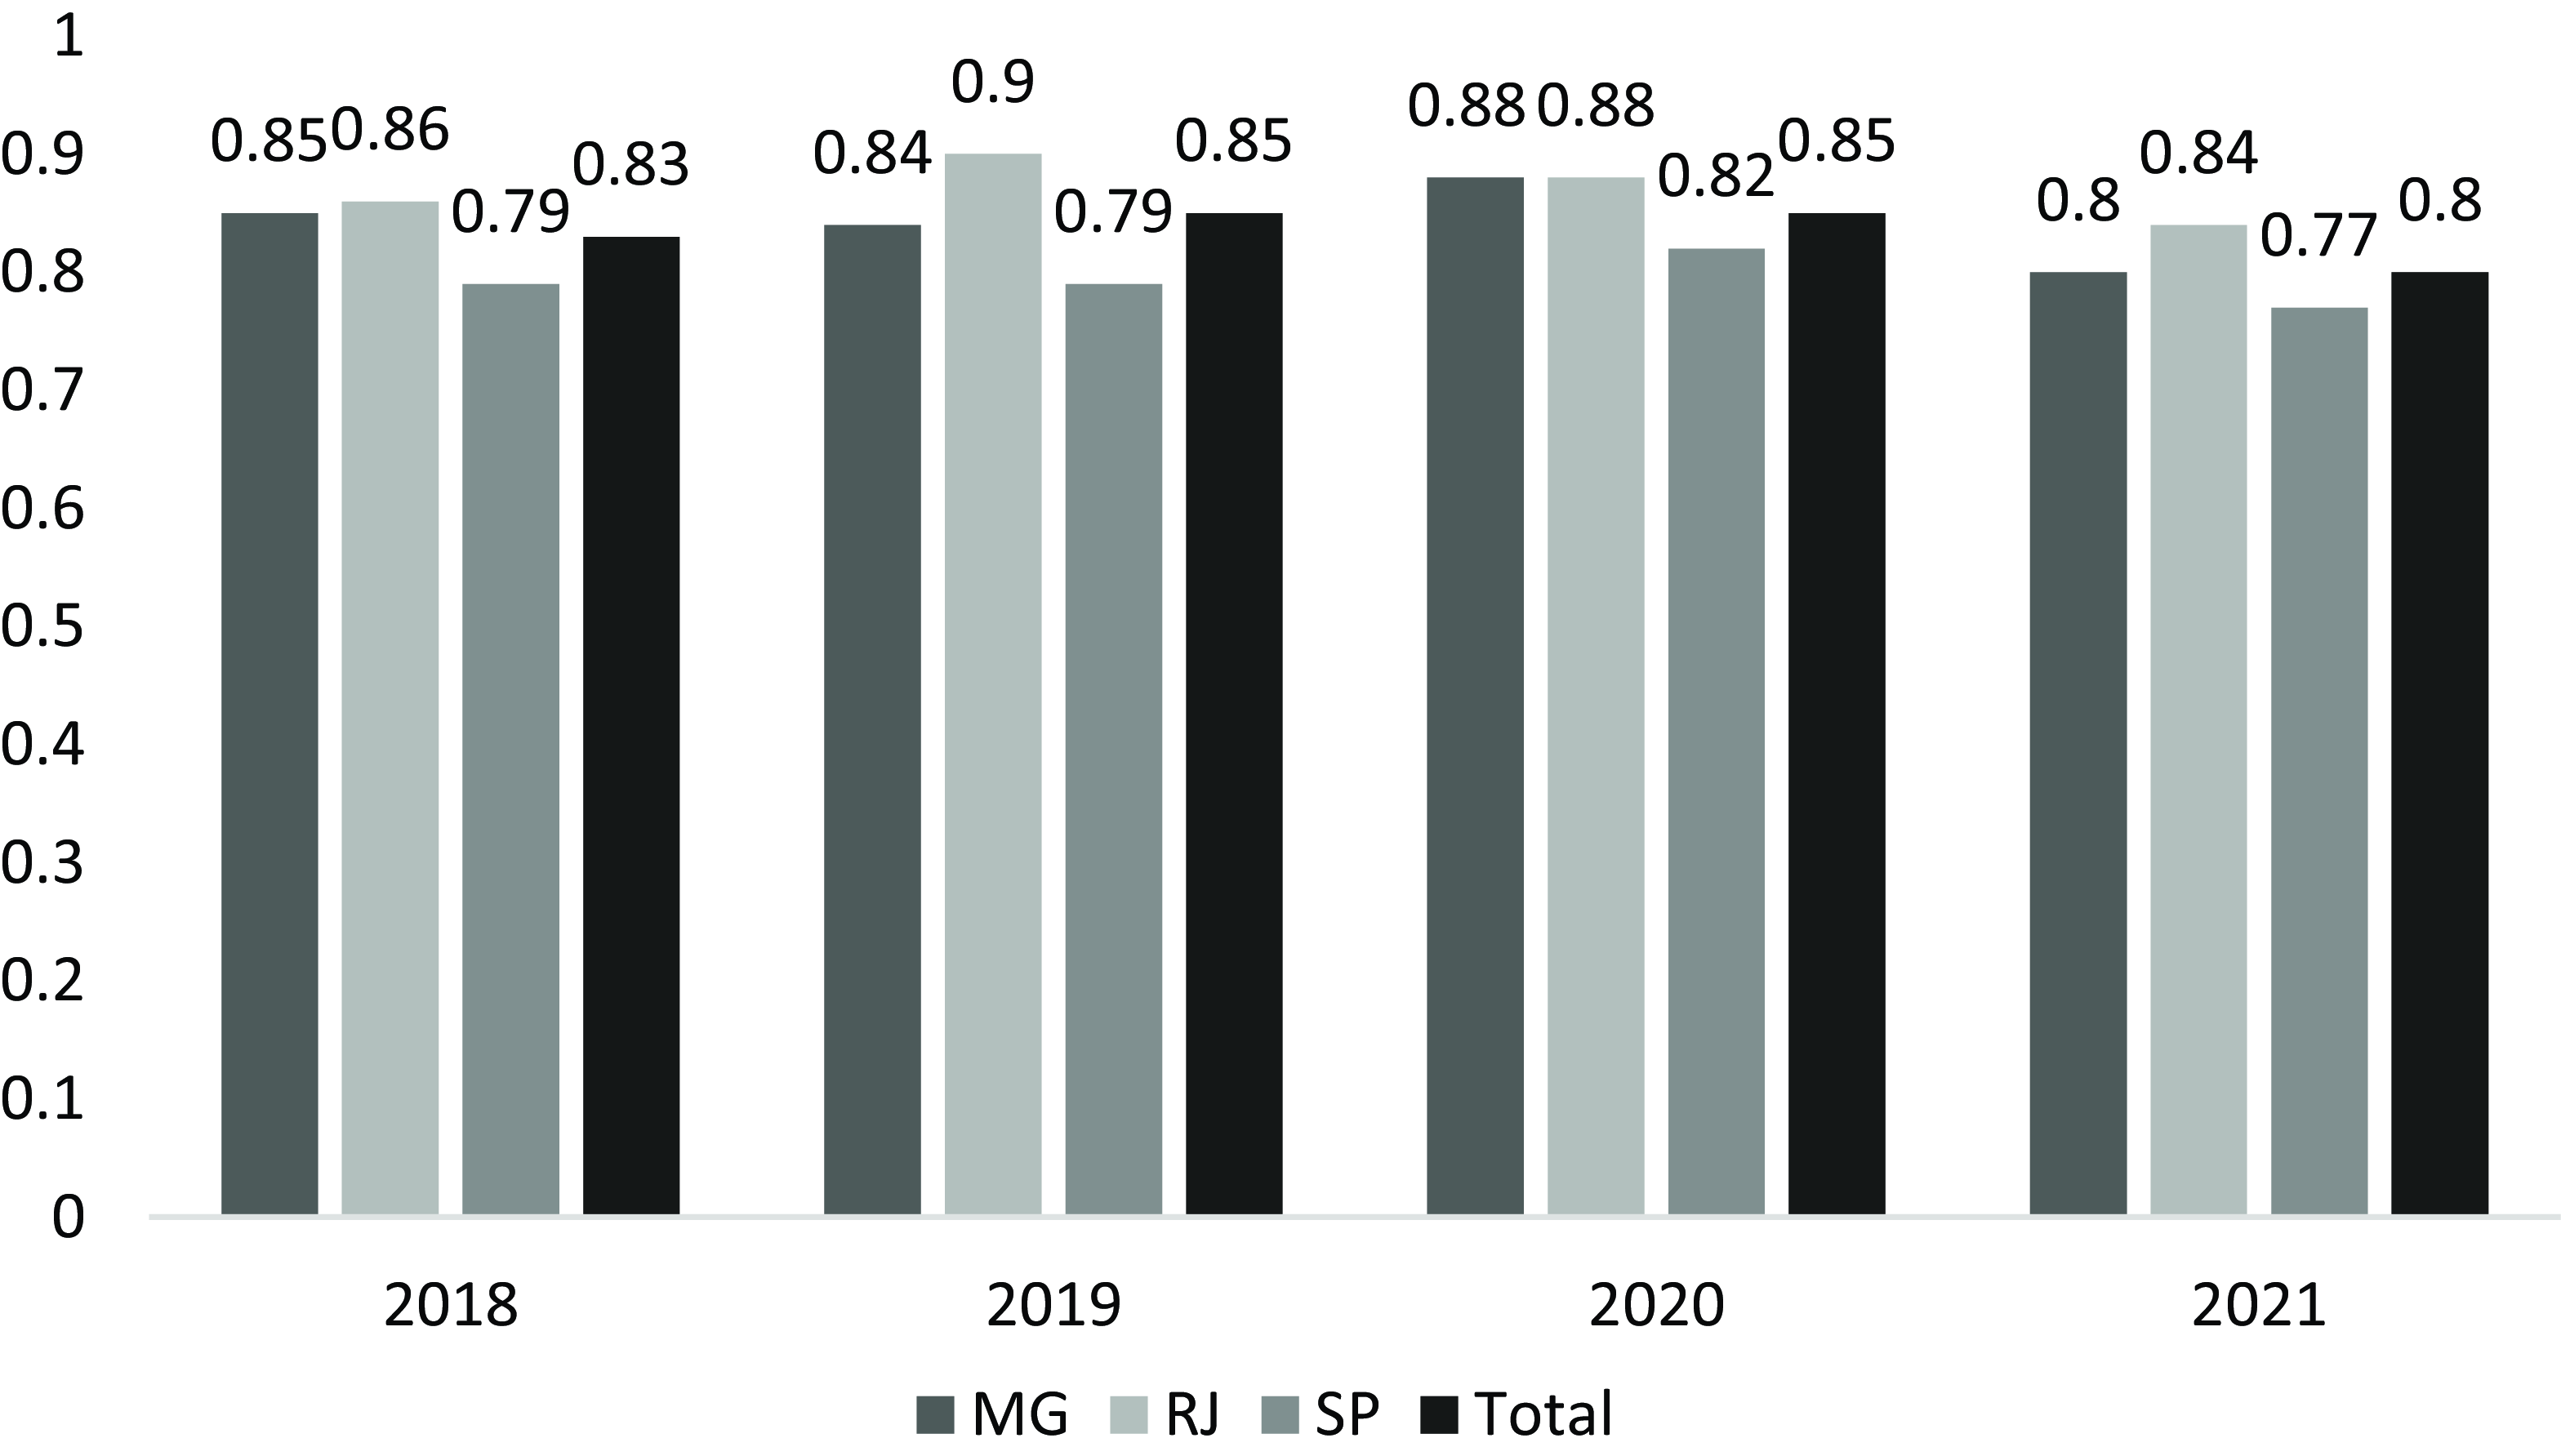
Claimants’ rate of success is very high: on average, the three courts decided 83.6% of cases in favour of patients between 2018 and 2021, ordering VHI companies to fully fund the requested treatment. This rate varies slightly between states and over time, but it was never below 77%, registered in São Paulo in 2021, and reached 90% in Rio de Janeiro in 2019 (Graph 2). Courts of appeal also rarely reverse trial courts’ decisions, endorsing the original decision in 82% of cases, most of them (73%) in favour of claimants.
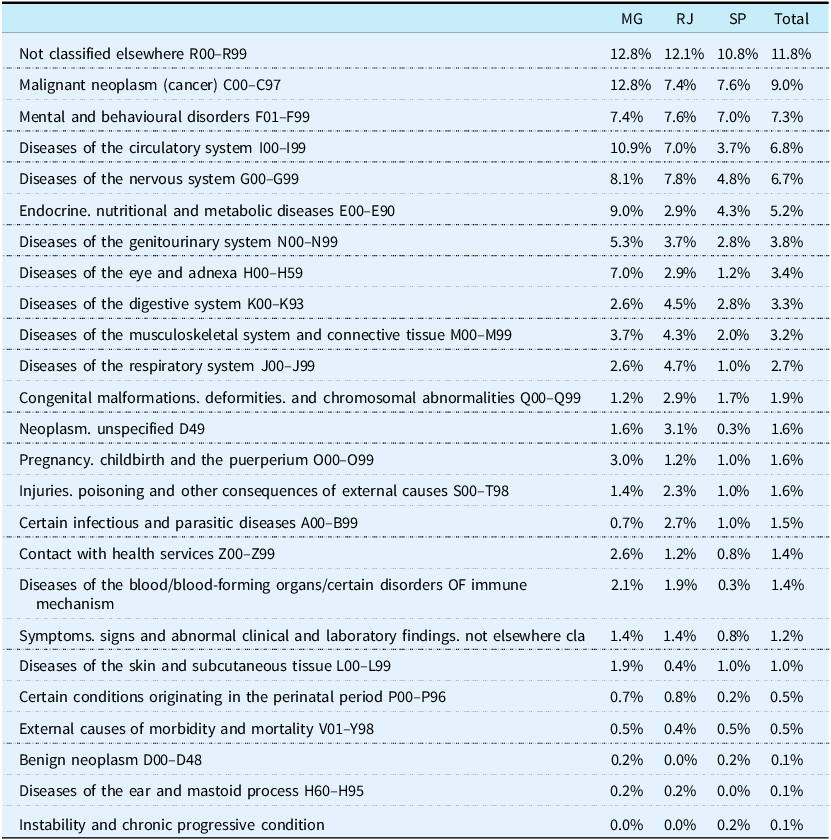
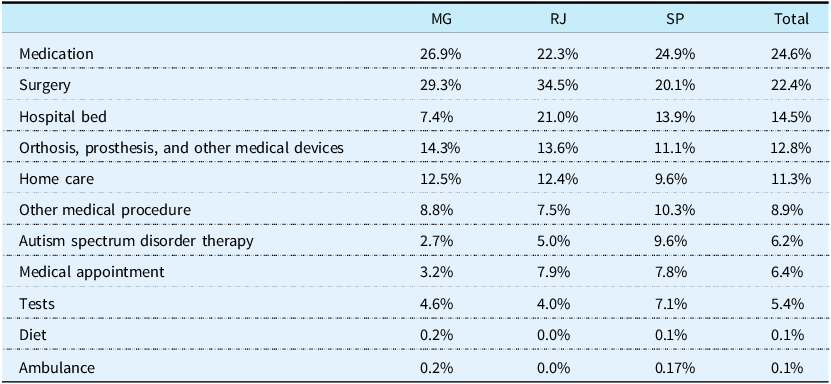
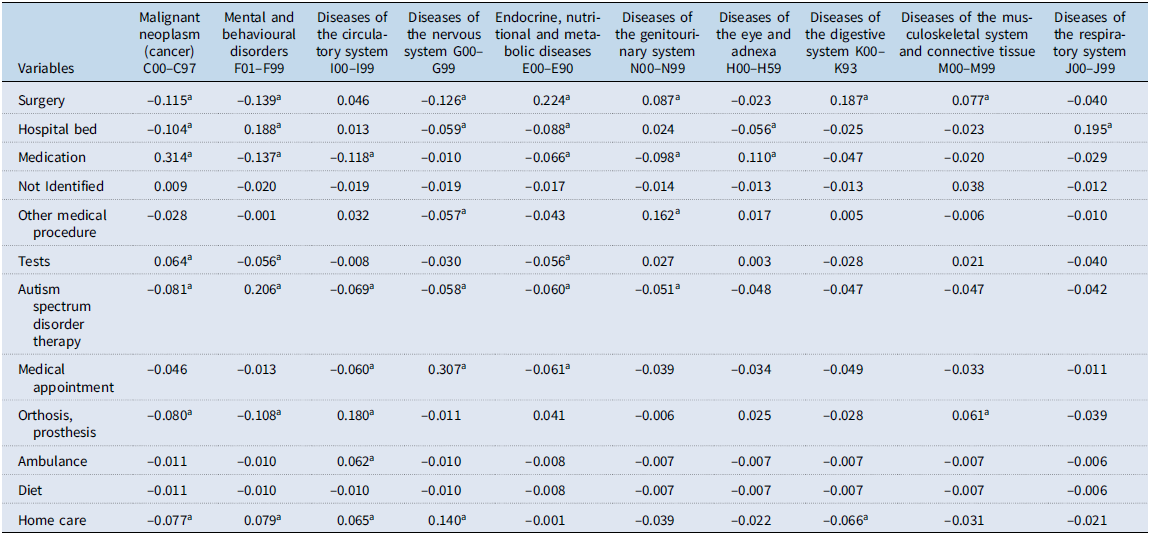
The most common health conditions that justified claimants’ requests were malignant neoplasm (9%), mental and behavioural disorders (7.3%), diseases of the circulatory system (6.8%), and diseases of the nervous system (6.7%) (see Appendix Table 2). Overall, claimants predominantly request access to medication (24.6%), surgery (22.4%), and hospital beds (14.4%). Together, these three types of items account for about 60% of all cases (see Appendix Table 3). The same lawsuit can involve multiple treatments but in our sample claimants requested funding for only one or two items in the vast majority of cases (83%).
Distribution of cases by year and state.

Claimant´s rate of success by year and state court*. *Rate of success calculated based on the number of decisions where the court fully granted the claimant’s request.

The correlation between the 10 most common health conditions and the types of treatment requested (see Appendix Table 4) shows that claims in which the patient reports a malignant neoplasm diagnosis are positively correlated with claims for medication (r = 0.314, p < 0.05) and medical tests (r = 0.064, p < 0.05). This can be potentially explained by the fact that, aside from cancer drugs, insurance companies are not obliged by law to cover outpatient drugs. Mental and behavioural disorders are positively correlated with claims for autism spectrum disorder therapy (r = 0.206, p < 0.05), hospital beds (r = 0.188, p < 0.05), and home care (r = 0.079, p < 0.05). Autism disorder spectrum treatment includes a wide range of interventions, including speech therapy, occupational therapy, physical therapy, Applied Behaviour Analysis, equine therapy, psycho-pedagogic interventions, and music therapy.
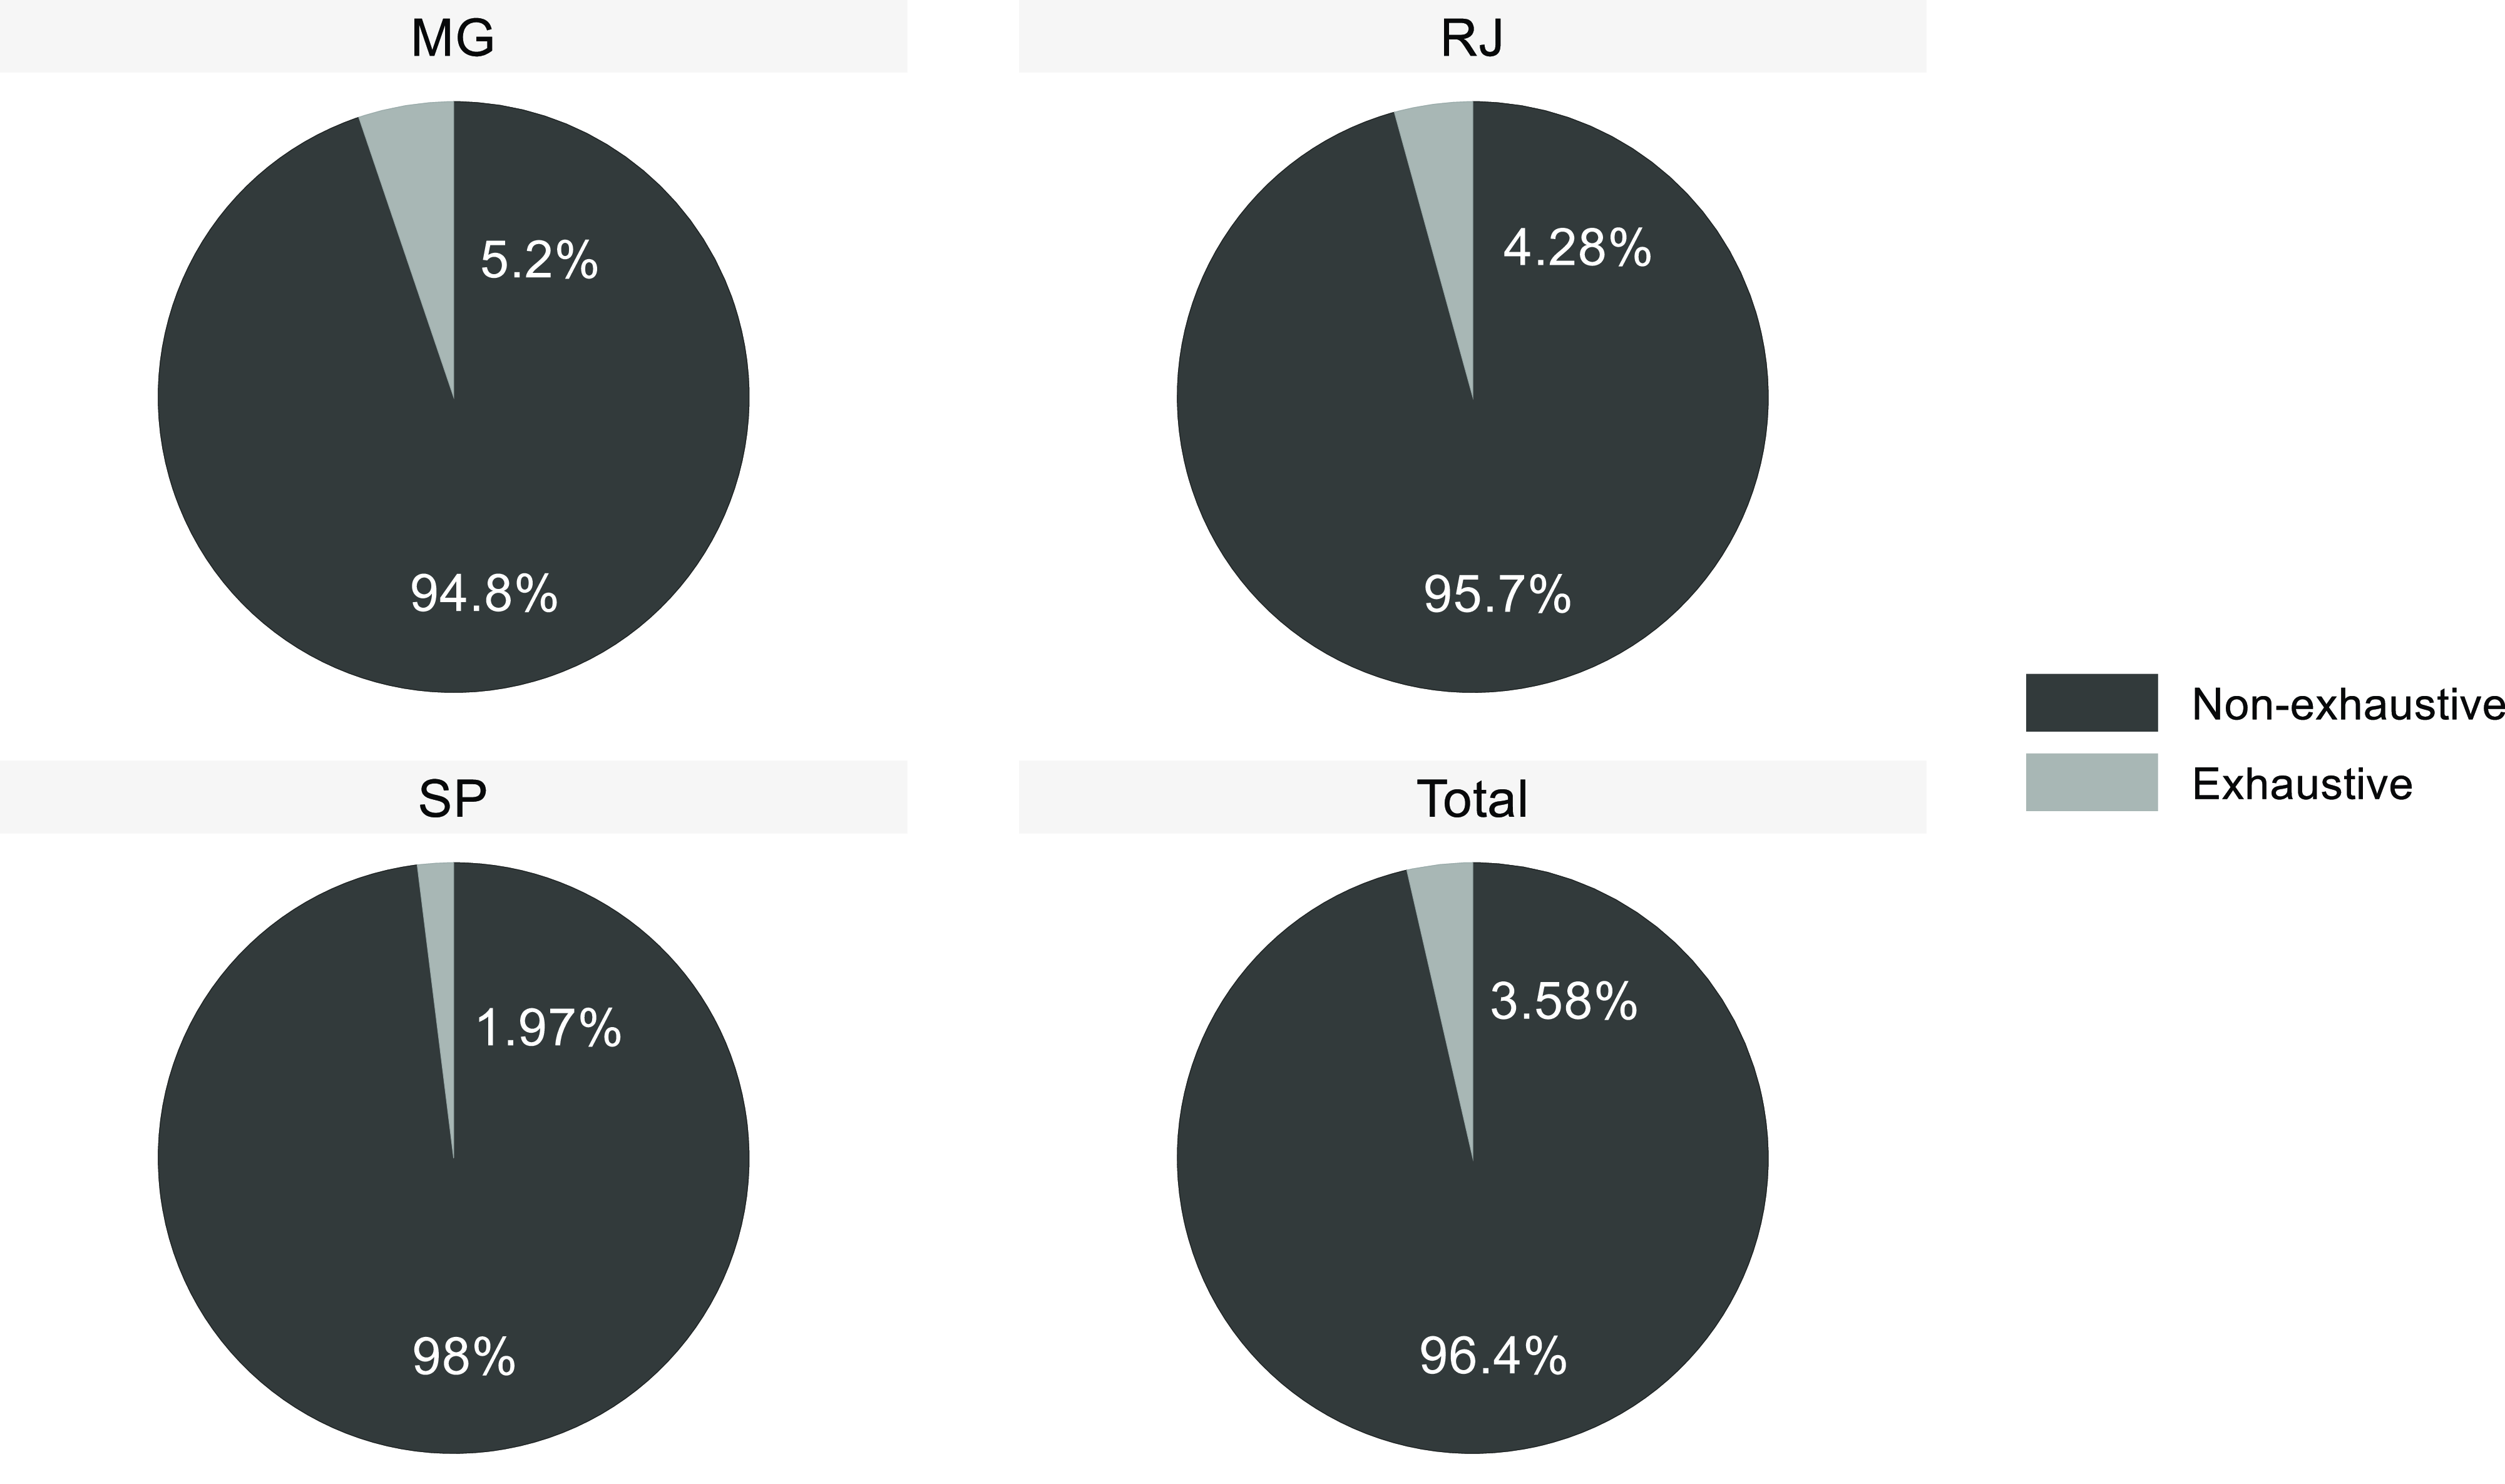
The court ruled in favour of the claimant patient in 96% of the 669 cases in which the insurance company denied funding on the basis that the claimed treatment was not listed in the ANS´s mandatory benefits package (Graph 3). In 84.4% of these cases, the court explicitly grounded its decision on the argument that the ANS benefits package is non-exhaustive. This means that the mere absence of a treatment from the list is not deemed sufficient justification to deny coverage. Moreover, out of 148 cases in which VHI companies claimed the treatment requested was experimental or lacked marketing authorisation, 105 cases (70.9%) were decided in favour of claimants because the list was considered non-exhaustive.
While decisions against the Brazilian public health system are commonly known to invoke the constitutional right to health as their main legal reasoning, the constitutional language is hardly mentioned in cases against the VHI sector. The Brazilian constitution is cited in only 9.6% of decisions. The most common sources of reasoning were precedents from the Superior Court of Justice (48%), from state courts’ own precedents (56%), and the Consumer Protection Act (47.7%). In addition, all three courts rarely refer to court technical experts in their decisions (less than 8% of cases). Interestingly, court precedents and the more general dispositions of the Consumer Protection Act are more frequently cited than Federal Law n. 9656 (28%), which specifically regulates VHI contracts.
In sum, the results suggest that in the vast majority of cases across all three states, courts rule in favour of patients to compel VHI companies to fund the claimed treatment. Courts also give partial to little weight to statutes and administrative norms designed to regulate VHI coverage.
Court position on ANS list for cases in which the defendant argues treatment was not part of the mandatory benefits package. *Percentages calculated based on the total number of cases where the VHI company claimed the treatment requested was not part of ANS’s list (669 cases). These include 198 cases in MG, 206 in RJ, and 265 in SP.

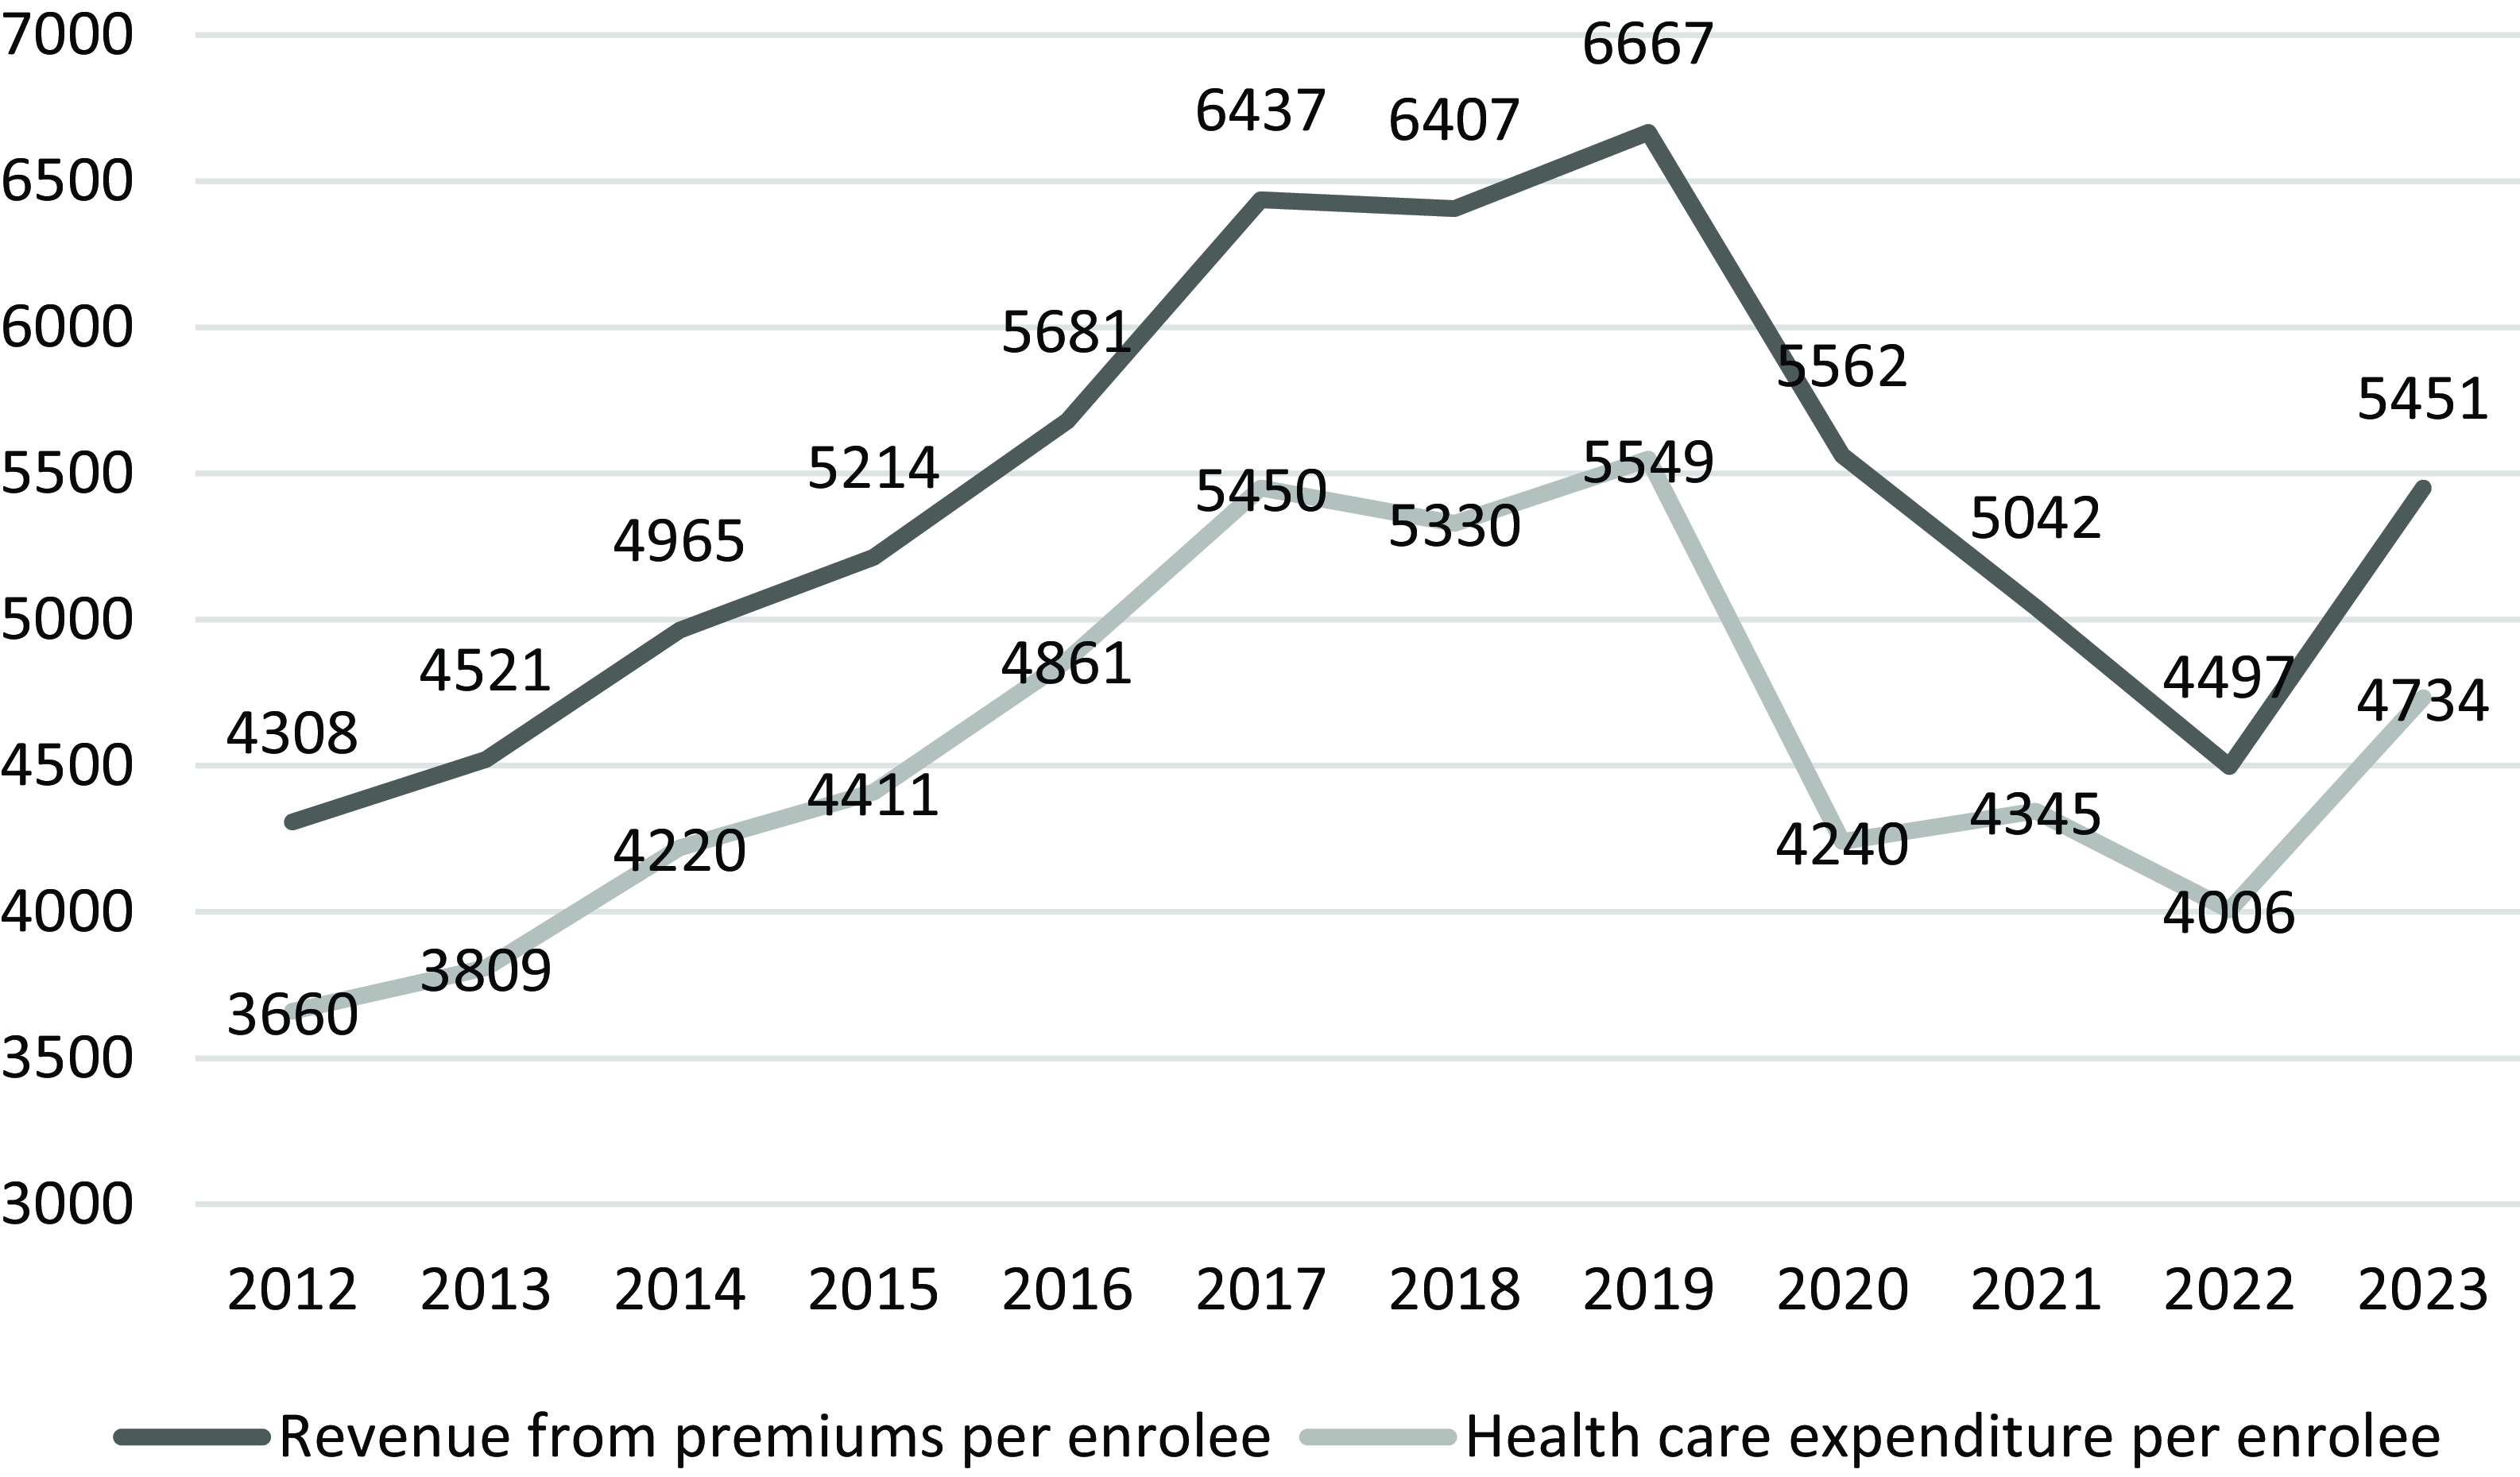
VHI sector´s health care expenditure and revenues from premium per year in BR$ (2012–2023). *The data on health care expenditure, revenue from premiums, and the number of users of private health plans were extracted from the Brazilian National Supplementary Health Agency (ANS) website (https://www.gov.br/ans/pt-br/acesso-a-informacao/perfil-do-setor/dados-gerais). Plans that cover dental care only were excluded. Values adjusted by inflation for current values as of December 2023 using the IPCA inflation index and calculated through the Central Bank of Brazil’s calculator available at: https://www3.bcb.gov.br/CALCIDADAO/publico/exibirFormCorrecaoValores.do?method=exibirFormCorrecaoValores&aba=1.

6. Discussion
The literature on legal claims against public health systems argues that there is a prevalent model of health litigation in Latin America. This model is characterised by high levels of litigation, the prevalence of individual claims demanding expensive curative treatments, claimants’ high rates of success, and courts’ disregard for existing policies and the distributive and financial impact of their decisions (Andia and Lamprea, Reference Andia and Lamprea2019; Ferraz, Reference Ferraz2010, Reference Ferraz2020; King, Reference King2012).
The present paper found that litigation against VHI companies in Brazil aligns with this described model. Litigation is predominantly aimed at expanding coverage individually by claiming treatments (particularly drugs) that are not listed in the benefits package. Moreover, courts decide predominantly in favour of claimants, overriding established regulatory frameworks for priority-setting and circumventing the HTA system. The success rate in claims for non-listed treatments against insurance companies is very similar to that against the public health system at the appeal level, both around 95% (Wang, Reference Wang2022; Wang et al., Reference Wang, Vasconcelos, Poirier, Chieffi, Mônaco, Sritharan, Van Katwyk and Hoffman2020).
Litigation serves as a pathway for individuals to secure access to specific treatments prescribed by their physicians, which can potentially improve their health. Yet, these individual benefits must be weighed against their impact on efficiency, affordability, and fairness in the VHI sector, which differs from that in the public system. In a national health system with fixed budgets (such as the Brazilian SUS), judicial rulings force the reallocation of resources within the health budget, and the opportunity costs are borne by other users. In contrast to the public health system, insurance companies in Brazil face more limited constraints for implicit rationing due to regulatory norms. However, they have more flexibility to pass on the costs of funding non-listed treatments to other enrolees by raising insurance premiums.
There is no reliable estimate of the financial impact of litigation on the VHI sector. Yet, the sizeable number of cases and the parallels that can be drawn with litigation against the public health system, which is known to have a substantial budgetary impact (Wang et al., Reference Wang, Vasconcelos, Poirier, Chieffi, Mônaco, Sritharan, Van Katwyk and Hoffman2020), suggest that litigation might be part of the explanation for the growth in VHI expenditure and premiums over the last years despite the drop during the Covid-19 pandemic (Graph 4).Footnote 7
In principle, litigation within the VHI sector is less regressive than litigation against the public system. The literature has raised concerns that litigation against public health systems fosters inequities as middle-class litigants claw a disproportionate amount of public healthcare resources at the expense of the less privileged sectors of the population (Andia and Lamprea, Reference Andia and Lamprea2019; Brinks and Gauri, Reference Brinks and Gauri2014; Ferraz, Reference Ferraz2010, Reference Ferraz2020). In the case of VHI, the courts´ immediate impact tends to be limited to a smaller and relatively homogeneous pool of insured people who will pay higher premiums. Moreover, for those whose insurance is provided through their employment contract, the price rises will primarily be felt by their employers.
Nevertheless, the impact of higher costs on VHI users and the health sector as a whole should not be overlooked. Higher premiums mean VHI might become less affordable. Although the demand for VHI in Brazil is more strongly explained by variations in income and formal employment (IESS, 2018), the price-elasticity for VHI in Brazil has been estimated in –0.44% (Menezes et al., Reference Menezes, Campolina, Silveira, Servo, Piolar, Silveira, Servo, Menezes and Piola2006). i.e., a 10% increase in price reduces consumer demand by 4.4%. Premium increases also change the way companies and employees share costs: employees might be required to contribute more to their premiums, while companies will increasingly opt for plans with user co-payment (Pipo Saúde, 2024). Moreover, despite regulation limiting service delays and modifications to provider networks, there has been a noticeable reduction in the range of providers available within VHI health plans (Leandro et al., Reference Leandro, Tanaka, Martins, Aranovich and Ferreira2022) and a sharp increase in complaints lodged with the ANS from dissatisfied users (Cruz et al., Reference Cruz, Gomide, Tuon, Weymer and Manuel2024). Lastly, as companies spend more with health services compared to what they can take in from premiums, they will see their profit margins shrink and respond by increasing VHI market concentration (Araújo and Silva, Reference Araújo and Silva2018).
In the VHI sector, as in all health systems, there is a trade-off between extending coverage to the non-covered, offering a wider range of treatments to those covered, and reducing cost-sharing and fees for users. To better navigate these trade-offs amid growing pressure to fund increasingly expensive new health technologies, there has been a global push to institutionalise HTA to inform funding decisions (UN, 2013, 2014). The VHI regulation in Brazil has followed this trend.
However, through individual remedies, courts steer the Brazilian VHI sector towards expanding benefits while undermining the established HTA system. There is also evidence that continuous litigation can affect the ANS´s HTA outcomes. ANS had mentioned litigation as a reason for mandating insurance companies to fund unlimited access to all treatments prescribed to global development delay patients, which includes autism spectrum disorder (ANS, 2021; Coube et al., Reference Coube, Nikoloski, Mrejen and Mossialos2023).
Litigation against insurance companies also has spill-over effects on the public health system. In Brazil, insured patients can litigate against either their insurance company or the national health system for the provision of unlisted treatments. In the absence of successful litigation against insurance companies, patients would likely try to access a prescribed treatment through SUS, including via courts, if necessary. In this sense, litigation within the VHI sector reduces the pressure on the underfinanced public health system and limits the capture of scarce public resources by the middle-classes (who are more likely to be insured) through litigation (Ferraz, Reference Ferraz2010; Silva and Terrazas, Reference Silva and Terrazas2011).
However, litigation in the VHI sector exacerbates the Brazilian healthcare system’s fragmentation and inequality. VHI in Brazil adds an extra layer of coverage to those able to pay and litigation creates an additional pathway to access care. At the lowest level are individuals with few resources to access justice and who can solely rely on SUS. Above them are individuals with access to justice but covered only by the public system. At the top are those with VHI coverage, who are entitled to access public and private services. Among them, there are those who sue SUS or insurance companies to expand access beyond what is regularly offered by the public and VHI schemes. In sum, access to care in Brazil largely depends on an individual´s capacity to buy VHI and to litigate.
7. Conclusion
This paper offers an empirical analysis of litigation in the VHI sector in Brazil. The findings presented here, seemingly specific to the private insurance sector, showcase trends commonly observed in the well-studied litigation against the public sector in Brazil and other Latin American countries. Similar to what happens to claims against SUS, courts allow individuals to circumvent HTA and access non-listed treatments. As a result, courts are likely to cause costs and prices of VHI to increase without considering the cost-effectiveness and affordability impact of their decisions. Moreover, access to justice becomes a key factor in the allocation of healthcare resources in Brazil within both the public and VHI sectors.
Recent events might complicate the scenario described in this paper. In 2022, the Superior Court of Justice (the court responsible for standardising the interpretation of federal legislation) established that only in exceptional circumstances can courts order insurance companies to fund unlisted treatments. However, a few months later, Federal Law 14454/22 was passed with the explicit aim of allowing litigation of unlisted treatments. The Judicial system has also created permanent bodies of health professionals dedicated to providing courts with scientific and medical information. Initially proposed for claims against the public system (Wang, Reference Wang2015), these initiatives are being expanded to cover litigation against insurance companies as well. Future research can explore whether the Superior Court of Justice’s ruling, Federal Law 14454/22, and the technical assistance provided to courts will modify the scenario presented in this paper.
The present study is a first step toward a more comprehensive understanding of the role of courts in VHI coverage and of the public-private divide in the Brazilian health sector and beyond. We hope it will encourage studies examining the role of courts in other jurisdictions where VHI coverage is relevant. Comparative analysis that considers different types of VHI models (primary, duplicated, supplementary, and complementary), the particularities of each legal and health system, the types of claims and sociodemographic characteristics of litigants, and the impact of courts on the provision and funding of healthcare can improve our understanding of the legal determinants of health (Gostin et al., Reference Gostin, Monahan, Kaldor, DeBartolo, Friedman, Gottschalk, Kim, Alwan, Binagwaho, Burci, Cabal, DeLand, Evans, Goosby, Hossain, Koh, Ooms, Roses Periago, Uprimny and Yamin2019).
8. Study limitations
This paper includes data from the Covid-19 pandemic period in the context of a health emergency. These events might have influenced VHI litigation. Research covering periods further removed from the pandemic can potentially lead to different results. Moreover, this paper’s analysis focuses on Court-of-Appeal decisions in three states with the largest number of VHI-insured people. These are also the three wealthiest states in the country, all located in the southeastern region of Brazil. Litigation may have a different set up in other states.
It is also important to highlight that the automated classification algorithm used in this research may have misclassified some decisions. Additionally, automated search algorithms using keywords can result in false negatives. Yet, given the multiple steps taken by this paper to minimise error, including the hand-coding of this paper’s sample, we have no reason to believe that these limitations can significantly affect the reliability of this paper’s analysis and conclusions.
Supplementary material
The supplementary material for this article can be found at https://doi.org/10.1017/S1744133125000106
Financial support
We received funding from both Fundação Getulio Vargas (FGV) and Federação Nacional de Saúde Suplementar (FenaSaúde).
Ezequiel Fajreldines dos Santos and Bruno da Cunha de Oliveira received support from FGV through the Mario Henrique Simonsen Teaching and Research Scholarship for this work.
The financial sponsors had no involvement in the design, execution, analysis, interpretation of data, or writing of the study.
Competing interests
Daniel has received a consultancy fee from the FenaSaúde and from the Conselho Nacional de Secretarias Municipais de Saúde (Conasems). The consultancy fees are unrelated to the present research.




 Open access

