


Introduction
The psychological impact of trauma often persists beyond the initial event, frequently manifesting as involuntary intrusive memories that are vivid and emotionally intense. These features overlap with core symptoms of post-traumatic stress disorder (PTSD) (Brewin, Reference Brewin2011; Brewin, Gregory, Lipton, & Burgess, Reference Brewin, Gregory, Lipton and Burgess2010; Ehlers & Clark, Reference Ehlers and Clark2000; Hackmann, Ehlers, Speckens, & Clark, Reference Hackmann, Ehlers, Speckens and Clark2004) and have been shown to predict subsequent PTSD symptom severity (Michael, Ehlers, Halligan, & Clark, Reference Michael, Ehlers, Halligan and Clark2005; Porcheret et al., Reference Porcheret, Iyadurai, Bonsall, Goodwin, Beer, Darwent and Holmes2020), highlighting intrusive memories as an important early marker of post-trauma vulnerability. Neurobiologically, dominant models of PTSD emphasize heightened emotional reactivity stemming from hyper-responsivity in limbic regions (e.g. the amygdala), coupled with diminished cognitive control associated with reduced engagement of prefrontal cortical (PFC) regions (Patel, Spreng, Shin, & Girard, Reference Patel, Spreng, Shin and Girard2012; Shin, Rauch, & Pitman, Reference Shin, Rauch and Pitman2006). In parallel, memory-control and emotion-regulation research has also focused on this core threat neurocircuitry (Anderson & Hulbert, Reference Anderson and Hulbert2021; Etkin, Büchel, & Gross, Reference Etkin, Büchel and Gross2015), with influential accounts proposing that strengthening cognitive control (PFC upregulation) can suppress limbic hyperactivity (Depue, Curran, & Banich, Reference Depue, Curran and Banich2007; Gagnepain, Hulbert, & Anderson, Reference Gagnepain, Hulbert and Anderson2017). However, regulation-related neural effects are not uniformly expressed as limbic downregulation: some approaches can reduce negative affect while engaging distinct regulatory routes from the limbic threat circuitry (Bo et al., Reference Bo, Kraynak, Kwon, Sun, Gianaros and Wager2024; Dörfel et al., Reference Dörfel, Lamke, Hummel, Wagner, Erk and Walter2014; Morawetz, Bode, Derntl, & Heekeren, Reference Morawetz, Bode, Derntl and Heekeren2017), pointing to alternative neural targets that may contribute to intrusive experiences.
Beyond heightened emotional reactivity, exaggerated sensory sensitivity is a critical, yet often overlooked, feature of trauma intrusions. Individuals with PTSD frequently report reexperiencing symptoms in which intrusive memories are so vivid and detailed that, in severe cases, they become nearly indistinguishable from reality (Ehlers & Clark, Reference Ehlers and Clark2000; Ehlers, Hackmann, & Michael, Reference Ehlers, Hackmann and Michael2004; Holmes, Brewin, & Hennessy, Reference Holmes, Brewin and Hennessy2004). PTSD theories posit that failures to integrate highly sensory-based memories into the episodic memory system contribute to intrusion symptoms (Brewin, Reference Brewin2014; Brewin et al., Reference Brewin, Gregory, Lipton and Burgess2010). Consistent with this hypothesis, recent work has demonstrated excessive activity and generalized neural traces in sensory regions for intrusive trauma-analogue memories (Kobelt et al., Reference Kobelt, Waldhauser, Rupietta, Heinen, Rau, Kessler and Axmacher2024). More broadly, converging evidence increasingly implicates abnormal engagement of visual sensory systems in PTSD-related memory disturbances (Harnett et al., Reference Harnett, Fleming, Clancy, Ressler and Rosso2025; Harnett, Goodman, & Knight, Reference Harnett, Goodman and Knight2020). For instance, sensory sensitivity indices, including greater perceptual priming sensitivity (Ehring & Ehlers, Reference Ehring and Ehlers2011; Michael, Ehlers, & Halligan, Reference Michael, Ehlers and Halligan2005; Sündermann, Hauschildt, & Ehlers, Reference Sündermann, Hauschildt and Ehlers2013), elevated functional activity within visual sensory regions (Bourne, Mackay, & Holmes, Reference Bourne, Mackay and Holmes2013; Fani et al., Reference Fani, Carter, Harnett, Ressler and Bradley2021; Shin et al., Reference Shin, Orr, Carson, Rauch, Macklin, Lasko, Peters, Metzger, Dougherty, Cannistraro, Alpert, Fischman and Pitman2004; Stark et al., Reference Stark, Parsons, Van Hartevelt, Charquero-Ballester, McManners, Ehlers, Stein and Kringelbach2015), and altered structural features (e.g. cortical thickness, gray matter volume, white matter fractional anisotropy) (Crombie et al., Reference Crombie, Ross, Letkiewicz, Sartin-Tarm and Cisler2021; Harnett et al., Reference Harnett, Finegold, Lebois, Van Rooij, Ely, Murty, Jovanovic, Bruce, House, Beaudoin, An, Zeng, Neylan, Clifford, Linnstaedt, Germine, Bollen, Rauch, Haran and Stevens2022; Harnett et al., Reference Harnett, Stevens, Fani, Van Rooij, Ely, Michopoulos, Hudak, Rothbaum, Hinrichs, Winters, Jovanovic, Rothbaum, Nickerson and Ressler2022; Tomoda, Polcari, Anderson, & Teicher, Reference Tomoda, Polcari, Anderson and Teicher2012; Wrocklage et al., Reference Wrocklage, Averill, Cobb Scott, Averill, Schweinsburg, Trejo, Roy, Weisser, Kelly, Martini, Harpaz-Rotem, Southwick, Krystal and Abdallah2017), track PTSD symptom severity. However, such evidence remains largely correlational. It does not determine whether visual sensory regions directly contribute to trauma memory formation and intrusion, or merely reflect downstream consequences of recurrent interactions with limbic threat circuits (Pessoa & Adolphs, Reference Pessoa and Adolphs2010). It is still possible that changes observed in sensory regions are driven by alterations in upstream threat-processing circuits rather than by direct sensory dysfunction.
To begin addressing this causal gap, Herz et al. (Reference Herz, Bar-Haim, Tavor, Tik, Sharon, Holmes and Censor2022) applied inhibitory neuromodulation over early visual cortex following trauma-memory reactivation and reported reduced emotional intensity of later intrusions, providing initial causal evidence that early visual processing can shape intrusion phenomenology. Building on this work, the current study provides a systematic test of the role of visual sensory regions in trauma-memory intrusions by integrating neuromodulation with neuroimaging. We used a trauma-film paradigm to induce analogue trauma in healthy participants (Bourne et al., Reference Bourne, Mackay and Holmes2013; Kobelt et al., Reference Kobelt, Waldhauser, Rupietta, Heinen, Rau, Kessler and Axmacher2024; Lau-Zhu, Holmes, & Porcheret, Reference Lau-Zhu, Holmes and Porcheret2018), and acquired fMRI data during both trauma-film viewing (encoding) and a subsequent resting-state session in which spontaneous intrusions were recorded. Over the following week, participants documented intrusion occurrence, allowing us to retrospectively distinguish film episodes that later became intrusive versus nonintrusive. We used univariate and multivariate analyses to characterize neural signatures that predicted subsequent intrusions, and functional and effective connectivity analyses to unravel the relationships between the visual sensory system and limbic circuits. To establish causality, we applied repetitive transcranial magnetic stimulation (rTMS) targeting early visual cortex (V1/V2) to transiently inhibit visual cortical function and assessed whether disrupting these sensory regions reduced intrusive-memory frequency and associated emotional distress (Figure 1). By integrating correlational and causal methods, this study provides converging evidence that visual sensory regions play a direct role in trauma-memory intrusions, highlighting them as a promising and underexplored target for therapeutic neuromodulation.
Experimental procedure and behavioral results. Note: (a) Day 1: trauma induction and TMS intervention. Participants viewed four trauma-film clips twice inside an fMRI scanner to induce analogue trauma, and then reported the occurrence of spontaneous intrusions during a 6-minute resting scan. After a 35- to 40-minute interval, film memories were reactivated with verbal and pictorial cues, followed by 1-Hz repetitive TMS (rTMS) to V1/V2 (experimental group) or Vertex (control group), according to random assignment. (b) Day 1–Day 8: memory assessments. Thirty minutes post-rTMS on Day 1, participants completed an image recognition task using degraded (image identification) and clear (image recognition) stimuli comprising old, similar, and novel images. Participants recorded film-related memory intrusions daily in a structured diary from Day 1 to Day 7. On Day 8, participants returned to the laboratory for free recall of the film content. (c) Left: total number of memory intrusions across Days 1–7 post-rTMS for the V1/V2 and Vertex groups. Right: Distribution of individual intrusion counts, with bars indicating histogram frequencies (left y-axis) and the overlaid curve showing the kernel density estimate (right y-axis). (d) Mean ratings of vividness, distress, and pleasantness for intrusive memories recorded during the 7-day diary period for the V1/V2 and Vertex groups. Error bars represent the standard error of the mean (SEM). + p < 0.09; * p < 0.05.

Enhanced engagement of control, emotional, and sensory networks during trauma memory encoding predicts intrusive memory formation. Note: (a) Classification of Potential and Control episodes in the film. Nineteen trauma-related scenes previously identified as frequently intrusive were designated as Potential episodes. For each participant, any of these scenes reported as intrusive during the 7-day diary period were classified as Intrusion episodes. Control episodes consisted of 13 nontraumatic scenes that were never reported as intrusive in either the current or prior datasets. Scene frequency, timing, and duration are displayed along the film timeline. (b–d) Whole-brain GLM results for the Potential > Control (b), Intrusion > Control (c), and Potential > Intrusion (d) contrasts. Maps for (c) and (d) are displayed at an uncorrected threshold of p < 0.005 for visualization purposes. (e) Correlation between ROI-averaged activation during Potential episode encoding in MFG, OVC, and AMG and the total number of diary-recorded intrusions over the 7-day period. (f) Analysis schema for calculating Potential–Potential (PP) similarity and Control–Control (CC) neural similarity across repeated viewings of the trauma film. (g) Whole-brain searchlight RSA showing brain regions with greater representational similarity for PP compared to CC episodes. (h) Correlation of PP similarity within MFG, OVC, and AMG with the total diary-recorded intrusions. * p < 0.05; ** p < 0.01. Abbreviations: MOG, middle occipital gyrus; IOG, inferior occipital gyrus; AMG, amygdala; MFG, middle frontal gyrus; IFG, inferior frontal gyrus; MTG, middle temporal gyrus; OVC, occipital visual cortex (including IOG, MOG, and SOG).

Methods
Participants
Forty-eight adults (32 female; mean age = 20.4 years, range = 18–26) with no known neurological or psychiatric disorders were recruited and randomly assigned to either the V1/V2 stimulation group (n = 24; 16 female) or the Vertex control group (n = 24; 16 female). Sample size was based on prior studies employing the traumatic film paradigm, which typically include 20–30 participants per group (Bourne et al., Reference Bourne, Mackay and Holmes2013; Holmes, James, Coode-Bate, & Deeprose, Reference Holmes, James, Coode-Bate and Deeprose2009; James et al., Reference James, Bonsall, Hoppitt, Tunbridge, Geddes, Milton and Holmes2015; Xu, Hu, & Wang, Reference Xu, Hu and Wang2023). One participant from the Vertex group missed the Day 8 remote memory test, and one V1/V2 participant’s fMRI data were excluded due to technical issues. Thus, the final sample for fMRI recording, the immediate memory test (Day 1), and intrusive-memory recording (Days 1–7) comprised 47 participants (V1/V2: n = 23; Vertex: n = 24), and the final sample for the remote memory test (Day 8) comprised 47 participants (V1/V2: n = 24; Vertex: n = 23). All participants provided written informed consent, were free to withdraw at any time, and received monetary compensation. The study was approved by the Human Subjects Review Committee at Zhejiang University (IRB No. 2024–005).
Materials and measures
Behavioral task materials and detailed parameters and procedures for neuroimaging and neuromodulation are provided in the Supplementary Methods.
Experimental procedure
The full procedure spanned 8 days (Figure 1a, b), comprising two in-laboratory sessions (Day 1 and Day 8) and daily diary recording (Days 1–7). Detailed procedures are provided in Supplementary Methods.
Laboratory session 1 (Day 1)
Upon arrival, participants were instructed about the procedures and completed baseline questionnaires (STAI-T, BDI, THQ, and pre-film emotion ratings). Inside the MRI scanner, they first underwent a 6-minute anatomical scan, followed by ~20 minutes of trauma film viewing. They then completed a 6-minute resting-state fMRI scan during which spontaneous intrusions were recorded in real time. To avoid biasing memory encoding, intrusion-reporting instructions were delivered only after the film ended. Participants then completed post-film mood and attention ratings.
Next, in the TMS lab, participants completed a memory reactivation task, followed by 15 minutes of 1-Hz rTMS targeting either V1/V2 or Vertex. The interval between film viewing and memory reactivation was ~35–40 minutes. After a 30-minute post-TMS break to avoid immediate aftereffects, participants completed the image identification-recognition test. Before leaving, they received detailed instructions for daily diary recording.
Diary recording session (Days 1–7)
Participants began recording their intrusive memories after leaving the laboratory on Day 1, continuing daily until 24:00 on Day 7. They were required to promptly document each intrusive memory occurrence and rate its corresponding subjective vividness, distress, and pleasantness.
Laboratory session 2 (Day 8)
Participants returned to submit their diaries, report compliance, and complete the IES-R. A free recall test was administered to assess delayed memory for the trauma film.
Data analysis
Behavioral data analysis
Intrusion diary. For each participant, we computed total intrusion frequency across Days 1–7 and mean ratings of vividness, distress, and pleasantness (Holmes et al., Reference Holmes, James, Coode-Bate and Deeprose2009; Lau-Zhu, Henson, & Holmes, Reference Lau-Zhu, Henson and Holmes2019; Xu et al., Reference Xu, Hu and Wang2023). Between-group comparisons were conducted using independent-samples t-tests.
fMRI data analysis
MRI data preprocessing. Image preprocessing and statistical analyses were conducted in SPM12 (Wellcome Trust Center for Neuroimaging, London, UK: https://www.fil.ion.ucl.ac.uk/spm) using MATLAB R2021b (MathWorks Inc., Natick, MA). Full details are provided in Supplementary Methods.
Definition of Intrusion, Potential, and Control episodes. To examine neural responses linked to intrusive memories, we preselected 19 film scenes (duration: 2–30 s; M = 10.4 s) with high intrusion potential. These scenes were determined based on existing data from our previous experiments (Xu et al., Reference Xu, Hu and Wang2023; Xu, Yu, & Wang, Reference Xu, Yu and Wang2024) and were validated by the diary intrusion data in the present study. Specifically, based on intrusion recording data from 224 independent participants, the 19 scenes with the highest intrusion frequencies were retained. In the present study, each participant’s 7-day diary was then used to classify these scenes: (1) Intrusion episodes: scenes from the 19-scene set that were actually reported as intrusive (range: 0–13 per participant), and (2) Potential episodes: scenes from the same set that were not reported as intrusive by that participant.
As a control, 13 scenes (duration: 2–40 s; M = 13.2 s) that had never been reported as intrusive in any dataset were selected and labeled as Control episodes. Potential and Control scenes were evenly spaced across the film and integrated without disrupting narrative flow (see Figure 2a). To avoid carry-over effects, all Potential and Control scenes were separated by at least 8 seconds (4 TRs).
Univariate analysis (GLM). GLM analyses were conducted separately for the Encoding phase (trauma-film viewing) and the Intrusion phase (resting-state intrusion reporting).
For the Encoding phase, to model neural activity during the encoding of intrusive episodes, task regressors were created by convolving the canonical HRF with stimulus onsets for Intrusion, Potential, and Control episodes. Six motion parameters were included as nuisance regressors. First-level contrasts were computed for Potential versus Control, Intrusion versus Control, and Potential versus Intrusion. Second-level (random-effects) analyses were conducted on these contrasts. Significance thresholds were: Potential versus Control, cluster-wise FDR correction at p < 0.001; Intrusion versus Control, cluster-wise FDR correction at p < 0.05; Potential versus Intrusion, uncorrected p < 0.001 (given the weaker effect observed for this contrast).
For the Intrusion phase, to isolate neural responses preceding spontaneous intrusions, regressors were created for Intrusion and Baseline conditions. Intrusion events were modeled as 2 seconds before the keypress onset (duration: 2 seconds) to avoid motor contamination. Baseline epochs were randomly sampled from 16 to 8 seconds before each intrusion (also 2 seconds in duration; see Figure 4a). First-level contrasts for Intrusion > Baseline were submitted to second-level random-effects analysis (uncorrected p < 0.001).
Anatomical localization was based on the AAL3 atlas (Rolls et al., Reference Rolls, Huang, Lin, Feng and Joliot2020), and statistical maps were visualized with Nilearn.
Multivariate representational similarity analysis (RSA). A whole-brain searchlight RSA examined neural representations differentiating Potential from Control episodes. For each participant, multivoxel activation patterns for the same film scenes were extracted from the two film viewing runs (see Figure 2f). RSA was implemented using the NeuroRA toolbox (https://github.com/neurora/NeuroRA) in Python. Within a 3 × 3 × 3 voxel searchlight cube centered on each voxel, Pearson correlations were computed between matching scenes across runs. Correlation values were then Fisher Z-transformed to produce neural pattern similarity maps for each scene. These maps were then averaged by condition to generate two condition-level similarity maps: Potential–Potential (PP) similarity and Control–Control (CC) similarity. Each participant’s condition-level maps were generated in MNI space and entered into second-level group analyses. Whole-brain voxelwise contrasts (PP vs. CC) identified regions with differential representational similarity; statistical significance was determined with cluster-wise FDR correction at p < 0.05.
Region of interest (ROI) definition. Three ROI clusters (prefrontal control, limbic, and visual sensory systems) were defined a priori based on theoretical relevance. Whole-brain GLM results were then used to identify key nodes within these clusters: (1) the middle frontal gyrus (MFG), representing prefrontal control; (2) the bilateral amygdala (AMG), involved in emotion processing; and (3) the occipital visual cortex (OVC), supporting visual sensory representations. Detailed ROI definitions are provided in Supplementary Methods.
Functional connectivity analysis (gPPI). Functional connectivity was assessed using generalized psychophysiological interaction (gPPI) analyses implemented in the CONN Toolbox, based on preprocessed and denoised BOLD time series. Data were high-pass filtered at 0.008 Hz to remove low-frequency drifts, while no low-pass filter was applied, preserving higher-frequency task-related fluctuations. To examine task-modulated connectivity between prefrontal control regions (seeds) and emotion- and sensory-related regions (targets), gPPI analyses contrasted the Potential and Control conditions. ROI-to-ROI connectivity was computed as the Fisher Z-transformed Pearson correlation between regionally averaged BOLD signals. Group-level statistics were performed using GLMs, with a significance threshold of FDR-corrected p < 0.05.
Dynamic causal modeling analysis (DCM). DCM explains changes in regional activity in terms of experimentally defined modulations (“modulatory input”) of the connectivity between brain regions. Here, we used DCM combined with Bayesian Model Selection (BMS) to address two key questions: (1) Does the right middle frontal gyrus (MFG) modulate occipital visual cortex (OVC) responses to aversive visual scenes, and is this influence direct, indirect via the amygdala (AMG), or both? (2) Does the connectivity pattern reflect top-down, bottom-up, or bidirectional modulation?
DCM involves defining a network comprising a small number of ROIs and specifying the forward and backward connections between them. Based on prior GLM and functional connectivity results, DCM models focused on right MFG, right AMG, and right OVC. The first eigenvariate was extracted for each ROI, adjusting for six motion parameters. Endogenous connectivity was assumed between AMG and OVC (Pessoa & Adolphs, Reference Pessoa and Adolphs2010). Given the sparse Intrusion events in some participants, Potential and Intrusion episodes were combined (P + I) to improve the stability of DCM parameter estimation. To model trauma-related processing, both P + I and Control conditions served as driving input (to MFG) and modulatory inputs (affecting connections). Twelve models were specified and grouped into two families: The first model family, Regulation Family, was divided into three subfamilies, aiming to determine the specific target regions regulated by the right MFG: (1) The Emotion Regulation Subfamily assumed that MFG directly modulates AMG, which in turn affects OVC activity (indirect modulation); (2) The Perceptual Regulation Subfamily assumed that MFG directly modulates the OVC (direct modulation); (3) The Parallel Regulation Subfamily included models in which MFG modulates both AMG and OVC (direct and indirect modulation). The second model family, Modulatory Family, was divided into four subgroups, aiming to determine the direction of modulation: (1) Top-down modulation from MFG to AMG/OVC; (2) Bottom-up modulation from AMG/OVC to MFG; (3) Bidirectional modulation between MFG and AMG/OVC; (4) Null models with no modulatory effects.
Each model was fitted for all participants and compared at the group level using BMS in SPM12. Model performance was assessed via exceedance probability (EP) – the probability that a given model is more likely than any other model, and expected posterior probability (EPP) – the expected probability that a given model generated the observed data. To assess condition-specific modulation, we extracted modulatory parameters (DCM.B) and conducted paired-sample t-tests comparing P + I versus Control conditions.
Results
Repetitive TMS to V1/V2 reduces memory intrusions
Participants recorded trauma-film intrusions daily for 7 days following rTMS intervention (Figure 1b). Matching baseline emotional measures between the V1/V2 and Vertex groups (Supplementary Table S1), the V1/V2 group (M = 3.12, SD = 2.91) reported significantly fewer intrusions than the control group (M = 5.78, SD = 3.94) across the week following rTMS intervention (t(45) = −2.638, p = 0.011, Cohen’s d = −0.770; Figure 1c). Critically, this intrusion decrease emerged only after the rTMS intervention, as pre-intervention intrusion counts during the 6-minute rest phase did not differ between groups (t(46) = −0.569, p = 0.572, Cohen’s d = −0.164). Moreover, the V1/V2 group also reported decreased levels of subjective vividness (t(45) = −2.305, p = 0.026, Cohen’s d = −0.673), emotional distress (t(45) = −1.759, p = 0.085, Cohen’s d = −0.513), and pleasantness (t(45) = −2.582, p = 0.013, Cohen’s d = −0.753) associated with the intruding memories (Figure 1d). Trauma impact scores on Day 8 (IES-R) did not differ (t(45) = −0.394, p = 0.695, Cohen’s d = −0.115). Notably, explicit memory tests taken immediately on Day 1 and remotely on Day 8 both showed impaired recall of detailed, perceptual memories, while the interruption on V1/V2 left the episodic gist unimpaired (see Supplementary Results and Figure S2).
Encoding of potentially intrusive memories recruits visual sensory cortices
Neural activity was recorded during trauma film viewing. Using a subsequent memory design (Bourne et al., Reference Bourne, Mackay and Holmes2013; Clark, Holmes, Woolrich, & Mackay, Reference Clark, Holmes, Woolrich and Mackay2016), we retrospectively identified Intrusion episodes, film scenes later reported as intrusive in participants’ 7-day diaries. Due to the limited number of actual intrusions (M = 4.43, SD = 3.67), we also included 19 Potential episodes, scenes frequently reported as intrusive across datasets, to enhance statistical power. Thirteen scenes never reported as intrusive were designated as Control episodes (Figure 2a).
Contrasting Potential versus Control episodes, whole-brain analysis revealed widespread increased activation during Potential episode encoding (Figure 2b), spanning three major networks: prefrontal control regions including the inferior and middle frontal gyri (IFG and MFG), the emotion-processing regions of bilateral amygdala (AMG), and a wide range of visual sensory regions including the inferior and middle occipital gyri (IOG and MOG), fusiform gyrus (FG), lingual gyrus (LG), calcarine cortex (CALC), and superior/middle temporal gyri (STG and MTG). The reverse contrast (Potential < Control) showed greater activation in the angular gyrus, precentral gyrus, and inferior parietal lobule (Supplementary Table S2). A similar pattern was observed for Intrusion versus Control episodes (Figure 2c), with increased activity in MFG/IFG, left AMG, and visual regions (IOG, MOG, FG, MTG, and STG). No areas showed greater activation for Control > Intrusion (Supplementary Table S3).
To examine what distinguishes potentially intrusive memories that do intrude from those that do not, we directly compared Intrusion and Potential episodes. Greater activation for Potential > Intrusion emerged in MFG and IFG (Figure 2d), suggesting that stronger prefrontal engagement during encoding may suppress later intrusions. In contrast, Intrusion > Potential revealed greater MTG activation, possibly reflecting richer sensory encoding for memories that subsequently intrude (Supplementary Table S4).
Next, we examined ROI-averaged activity across conditions, focusing on cognitive control (MFG), visual perception (OVC: IOG, MOG, and SOG), and emotion processing (AMG). All three ROIs showed significantly greater activation during Potential versus Control episodes (all ps < 0.001) and during Intrusion versus Control episodes (all ps < 0.033). To further validate their relevance to intrusion emergence, we tested whether encoding-related activation predicted intrusion frequency over the following week. Across participants in the Vertex group, who did not receive sensory disruption, all three ROIs showed strong positive correlations with intrusion frequency (MFG: r = 0.585, p = 0.003; OVC: r = 0.546, p = 0.007; AMG: r = 0.568, p = 0.005; Figure 2e). In the V1/V2 group, OVC activation remained a significant predictor (r = 0.437, p = 0.037). These findings highlight consistent engagement of MFG, AMG, and OVC during trauma memory formation.
Neural representations differentiate intrusive from nonintrusive memories
To assess whether intrusive memories are reflected in neural representation patterns, we conducted a representational similarity analysis (RSA) across repeated trauma-film viewings (Figure 2f). A whole-brain searchlight RSA compared similarity within Potential episodes (PP) and Control episodes (CC). The PP > CC contrast revealed higher representational similarity in regions overlapping with univariate results – namely, visual sensory cortices (IOG, MOG, STG, and MTG), prefrontal areas (SFG, MFG, IFG, and anterior cingulate cortex), and bilateral AMG (Figure 2g). Importantly, across participants in the Vertex group (Figure 2h), greater PP similarity in both MFG (r = 0.476, p = 0.029) and OVC (r = 0.440, p = 0.046) significantly predicted more intrusions, while AMG did not (r = 0.286, p = 0.209). Therefore, future intrusions are encoded in multivoxel patterns within visual and prefrontal regions.
Intervention-resistant intrusions are characterized by visual hyperactivation and prefrontal hypoactivation
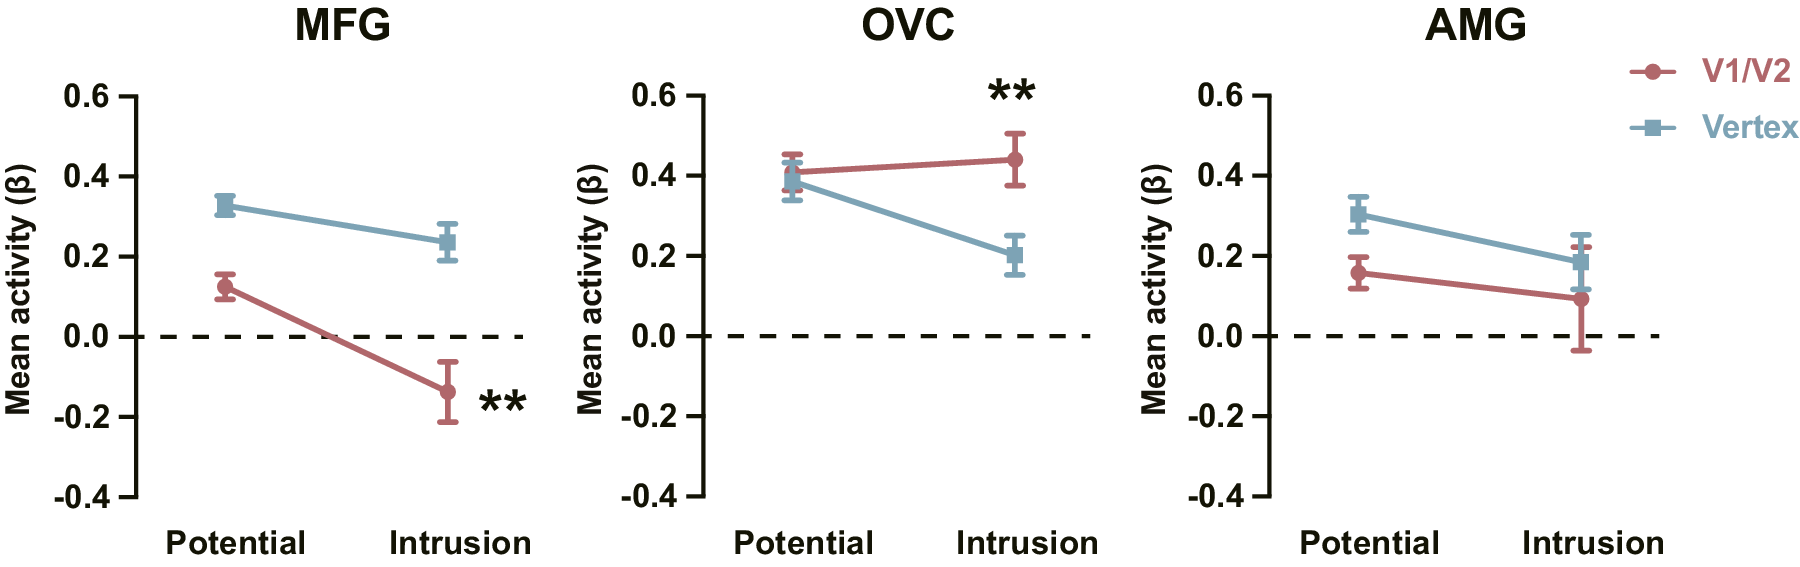
rTMS over V1/V2 reduced a subset of intrusions, leaving behind those resistant to disruption. Comparing these residual intrusions with intrusions from the Vertex group allowed us to isolate neural signatures distinguishing intervention-resistant from modifiable memories. We analyzed activation (relative to Control episodes) for Potential and Intrusion episodes in three ROIs: MFG, OVC, and AMG. For the MFG, a 2 (Group: V1/V2 vs. Vertex) × 2 (Episode Type: Potential vs. Intrusion) mixed ANOVA revealed a marginal interaction (F(1, 32) = 3.869, p = 0.058, ηp2 = 0.108; Figure 3). Simple-effect analyses showed significantly reduced MFG activation for Intrusion (intervention-resistant) versus Potential episodes in the V1/V2 group (t(13) = 3.533, p = 0.004, Cohen’s d = 0.944), while this difference was absent in the Vertex group (t(19) = 1.840, p = 0.081, Cohen’s d = 0.411). This pattern indicates that prefrontal hypoactivation is associated with intrusions that resist sensory disruption. For the OVC, the same ANOVA showed a significant interaction (F(1, 32) = 7.229, p = 0.011, ηp2 = 0.184; Figure 3). Specifically, while OVC activation during Potential episodes did not differ across groups (t(32) = 0.345, p = 0.732, Cohen’s d = 0.120), Intrusion episodes evoked higher OVC activation in the V1/V2 group (intervention-resistant intrusions) than in the Vertex group (t(32) = 3.009, p = 0.005, Cohen’s d = 1.049), indicating visual hyperactivation as a marker of intervention-resistant intrusions. For the AMG, no significant main or interaction effects emerged (ps > 0.151), indicating that rTMS to V1/V2 did not impact amygdala responses. Therefore, intervention-resistant intrusions are characterized by reduced prefrontal and elevated visual activity, reflecting diminished top-down regulation and persistent bottom-up sensory reactivation.
Reduced prefrontal engagement and enhanced visual response for intervention-resistant intrusions. Note: Activation for Potential and Intrusion episodes in the V1/V2 and Vertex groups in MFG, OVC, and AMG. Error bars represent SEM. ** p < 0.01.

Visual cortex involvement during real-time memory intrusions predicts subsequent intrusion frequency. Note: (a) Top: Intrusion analysis schema: the Intrusion epoch is defined as the TR (2 s) preceding the button press; Baseline points were randomly sampled from segments never marked as intrusions and ≥ 3 TRs from any intrusion. Bottom: ROI-averaged BOLD time courses (aligned to the intrusion keypress). Curves shown for MFG, OVC, and AMG; all peak ~1 TR before the press. (b) Whole-brain GLM map contrasting Intrusion versus Baseline periods during the real-time intrusion report phase. (c) Associations between mean Intrusion-epoch activation (MFG, OVC, and AMG) and the total number of diary-recorded intrusions over 7 days. + p < 0.08; ** p < 0.01. Abbreviations: vmPFC, ventromedial prefrontal cortex.

Task-dependent connectivity between prefrontal control regions and perceptual and emotion-processing regions. Note: (a) Connectivity matrix from gPPI showing changes (Potential > Control) between prefrontal control regions (seeds) and perceptual/emotion-processing regions (targets). Symbols denote significance: ★ p < .05 (unc.); ▲ p < .01 (unc.); ● p FDR < .05. (b) Chord diagram illustrating enhanced connections within this network. Edge color is determined by the prefrontal seed ROI (same color key as in a). Edge width reflects the Bayes factor for the Potential–Control connectivity difference (larger = stronger evidence). (c) Correlations between right MFG-Visual Lateral connectivity during Potential encoding and total diary-recorded intrusions over 7 days. (d) Correlations between right MFG-AMG connectivity during Potential encoding and total diary-recorded intrusions over 7 days. + p < 0.07; * p < 0.05; ** p < 0.01. Abbreviations: MFG, middle frontal gyrus; SFG, superior frontal gyrus; IFG tri, inferior frontal gyrus pars triangularis; IFG oper, inferior frontal gyrus pars opercularis; ACC, anterior cingulate cortex; aMTG, anterior middle temporal gyrus; pMTG, posterior middle temporal gyrus; toMTG, temporo-occipital middle temporal gyrus; AMG, amygdala; l, left; r, right.

DCM analysis reveals bidirectional and parallel regulation by the right MFG. Note: (a) DCM model space. Model space defined by two families: the Modulatory Family (bottom-up, top-down, and bidirectional, null) and the Regulation Family (emotion, perceptual, and parallel regulation). Both combined Potential and Intrusion (P + I) episodes and Control episodes were specified as driving and modulatory inputs to the right MFG. The solid arrows between OVC and AMG represent endogenous connectivity. Dashed arrows indicate hypothesized connections. Short lines with red circles denote connections modulated by the modulatory inputs. (b) Bayesian Model Selection (BMS) across the Modulatory Family favored the bidirectional model. TD, top-down; BU, bottom-up; BD, bidirectional; ER, emotion regulation; PeR, perceptual regulation; PaR, parallel regulation. (c) BMS across the Regulation Family supported the parallel regulation model. (d) Modulatory effects of the two bottom-up and two top-down pathways. (e) Driving input effects. (f) Depiction of the model and the results of paired t-tests over modulatory and driving input parameters. The values indicate the difference in modulatory and driving input parameters for P + I episodes relative to Control episodes. Red solid arrows indicate connections where the modulatory parameters for the P + I condition were significantly greater than those for the Control condition; blue solid arrows indicate connections where the modulatory parameters for the Control condition were significantly greater than those for the P + I condition; black dashed arrows indicate that the difference in modulatory parameters between the P + I and Control conditions was not significant. Black solid arrows represent endogenous connectivity. Error bars represent the SEM. * p < 0.05; ** p < 0.01; *** p < 0.001.

Visual cortex underlies the real-time occurrence of memory intrusions
While the prior encoding analyses implicated visual and prefrontal regions in intrusive memory formation, they do not directly link these areas to the moment of intrusion occurrence. To address this, we collected a 6-minute resting-state scan immediately after film viewing – when spontaneous intrusions are frequent – and recorded real-time intrusion reports (see Figure 1a). Participants pressed a key at the onset of each intrusion; the preceding TR (2 s) was marked as the intrusion onset, with randomly sampled nonintrusion periods serving as baseline (Figure 4a). BOLD time courses in MFG, OVC, and AMG confirmed temporal precision (Figure 4a).
Whole-brain GLM analysis (Intrusion > Baseline) revealed increased activity in sensory cortices (IOG, MOG, SOG, MTG, and ITG) and the prefrontal control region of MFG (Figure 4b; Supplementary Table S5). Notably, we additionally observed increased activity in the ventromedial prefrontal cortex (vmPFC), a pattern that was less apparent during initial intrusion encoding. ROI analyses confirmed higher activation for Intrusion versus Baseline in the three ROIs (ps < 0.008). Across participants in the Vertex group, mean pre-intrusion activation predicted the total number of intrusions recorded over the subsequent week for MFG (r = 0.614, p = 0.004; Figure 4c) and showed a trend for OVC (r = 0.407, p = 0.075). No prediction effect was observed in the AMG (r = 0.244, p = 301).
Prefrontal regulation of visual cortex predicts memory intrusions
To explore the mechanism underlying OVC’s critical role in memory intrusion, we asked whether control of intrusive memories in OVC is implemented via prefrontal regulation. We applied generalized psychophysiological interaction (gPPI) analyses to estimate task-dependent functional connectivity between prefrontal control regions (seeds) and perceptual/emotion-processing regions (targets). Guided by the GLM and RSA results, we focused on three key regions: the MFG, OVC, and AMG. For exploration purposes, we also included additional prefrontal control regions (i.e. SFG, IFG, and ACC) and perceptual regions (i.e. Visual Medial, Visual Lateral, and MTG).
During encoding of Potential versus Control episodes, we observed enhanced connectivity between prefrontal control areas and both perceptual and emotional regions (Figure 5a,b). The right MFG emerged as a functional hub, showing increased connectivity with visual cortices and the AMG. Paired t-tests confirmed stronger MFG connectivity with bilateral Visual Lateral cortex (left: t(46) = 2.149, p = 0.037, Cohen’s d = 0.313; right: t(46) = 3.530, p < 0.001, Cohen’s d = 0.515) and bilateral AMG (left: t(46) = 2.898, p = 0.006, Cohen’s d = 0.423; right: t(46) = 4.893, p < 0.001, Cohen’s d = 0.714). Crucially, in the Vertex group, MFG-Visual Lateral connectivity significantly predicted intrusion frequency over the following week (left: r = 0.561, p = 0.005; right: r = 0.437, p = 0.037; Figure 5c). In contrast, MFG-AMG connectivity did not predict intrusion frequency in either group (ps > 0.290; Figure 5d). These findings suggest that prefrontal regulation of visual cortices, rather than of limbic circuits, plays a central role in controlling the formation of intrusive trauma memories.
Direct and bidirectional functional connection between MFG and OVC
Given known MFG-AMG and AMG-visual pathways, visual activation could reflect downstream effects of emotional modulation. Alternatively, if perceptual cortices contribute directly to intrusion formation, the MFG may engage them directly, particularly when potential intrusions require active suppression. To clarify whether the MFG modulation over visual cortex is direct or mediated via AMG, we applied Dynamic Causal Modeling (DCM) and Bayesian Model Selection (BMS) to evaluate effective connectivity during encoding of intrusion-prone (Potential and Intrusion) events. We specified 12 models with four modulation schemes (Figure 6a): (1) Top-down (i.e. MFG → AMG/OVC), (2) bottom-up (AMG/OVC → MFG), (3) bidirectional (MFG⇄AMG/OVC), and (4) null (no modulation). BMS strongly favored the bidirectional model (exceedance probability [EP] = 1.0; expected posterior probability [EPP] = 0.833), outperforming all others substantially (EPs = 0; EPPs <0.11; Figure 6b). To further assess whether MFG influences were specific to emotional, perceptual, or both domains, we grouped the models into three functional subfamilies (Figure 6a): emotion-only (modulating AMG), perception-only (modulating OVC), and parallel regulation (modulating both). BMS strongly favored the parallel model (EP = 1, EPP = 0.901), over the emotion-only (EP = 0, EPP = 0.059) and perception-only (EP = 0, EPP = 0.020) models (Figure 6c). This indicates that MFG exerts concurrent top-down control over both AMG and OVC during encoding.
We then examined condition-specific modulation of effective connectivity by comparing modulatory parameters between the combined Potential and Intrusion (P + I) condition with the Control condition across the four identified pathways (Figure 6d). For bottom-up connections, only OVC → MFG showed increased modulation during P + I episodes (t(45) = 3.636, p < 0.001, Cohen’s d = 0.536), suggesting stronger perceptual input to prefrontal regions during encoding of intrusion-prone content. For top-down connections, MFG → OVC modulation was reduced during P + I encoding (t(45) = −3.252, p = 0.002, Cohen’s d = −0.480), consistent with weakened top-down influence on visual cortex. In contrast, MFG → AMG modulation was enhanced during P + I episodes (t(45) = 2.073, p = 0.044, Cohen’s d = 0.306), potentially reflecting rapid engagement of prefrontal-limbic regulation to dampen excessive affective responses during film viewing. Finally, the driving input to MFG was significantly stronger for P + I than for Control episodes (t(45) = 5.389, p < 0.001, Cohen’s d = 0.795; Figure 6e), underscoring its central role in trauma encoding. A summary model is presented in Figure 6f. The same pattern across the four connections and the driving input was also observed when Intrusion and Potential episodes were examined separately relative to Control (see Supplementary Results; Figure S3). Overall, these findings suggest that heightened sensory input from OVC may trigger prefrontal engagement, with the MFG then exerting parallel top-down control over both visual and emotional systems.
Discussion
Visual cortices are increasingly implicated in trauma-related intrusions and psychopathology, yet causal evidence has been lacking. This study addresses that gap by using rTMS to transiently disrupt early visual cortex (V1/V2) activity during trauma memory reactivation in healthy participants. Behaviorally, V1/V2 disruption, relative to Vertex stimulation, significantly reduced the frequency, vividness, and emotional intensity of intrusive memories over the following week. Consistent with this, fMRI analyses revealed that intrusive trauma episodes were marked by distinct neural activation and representational patterns across the visual sensory stream. Connectivity analyses further suggested that the underlying mechanisms involve direct, bidirectional interactions between visual cortices and prefrontal control regions, coexisting with the traditional amygdala-centered pathways. Critically, this prefrontal-visual pathway was directly modulated by the emergence of intrusive content and tracked intrusion dynamics more closely than the canonical threat pathway. Together, these findings provide causal evidence positioning the visual cortical stream as an active and independent driver of trauma memory intrusions, opening new avenues for intervention strategies that directly target sensory cortical representations.
Applying rTMS offers a direct approach for probing the causal role of specific brain regions in trauma memory intrusions. Supporting the sensory-origin hypothesis, rTMS targeting V1/V2 reduced the frequency and vividness of spontaneous intrusions and also attenuated the emotional intensity (i.e. distress and pleasantness) of the remaining intrusions, suggesting that intrusion-related affect partly arises from early visual representations. Consistent with V1/V2’s role in sensory coding, explicit memory tests further showed selective impairment of detailed sensory representations of trauma memories while preserving memory for gist-level information (e.g. discrimination of old vs. novel scenes) and broader episodic content. This selectivity is clinically relevant because memory disturbance in PTSD involves not only heightened involuntary intrusions but also impaired episodic recollection, characterized by effortful, fragmented, and disorganized trauma memory retrieval (Brewin, Reference Brewin2014; Ehlers et al., Reference Ehlers, Hackmann and Michael2004). Therefore, an ideal intervention should reduce intrusive memories while preserving episodic recollection. This dual requirement was met by V1/V2 rTMS intervention in the present study.
Across both stimulation groups, our fMRI data identified neural substrates distinguishing intrusive from nonintrusive trauma memories. Using a subsequent memory paradigm (Bourne et al., Reference Bourne, Mackay and Holmes2013; Clark et al., Reference Clark, Holmes, Woolrich and Mackay2016), we traced brain regions that discriminated Potential and Intrusive episodes from Control episodes during encoding. Both GLM and RSA analyses converged on three key systems: the prefrontal control network, the emotion-processing network, and the visual sensory cortices. The first two networks have been the traditional focus in trauma-memory research, with affect-laden memories typically eliciting recruitment of prefrontal control alongside increased emotional reactivity (Clark et al., Reference Clark, Holmes, Woolrich and Mackay2016; Kobelt et al., Reference Kobelt, Waldhauser, Rupietta, Heinen, Rau, Kessler and Axmacher2024). Here, the degree of prefrontal recruitment, indexed by both GLM- and RSA-derived measures, positively predicted subsequent intrusion frequency across participants, consistent with greater recruitment during highly affective events. Intriguingly, within participants, comparing actually intruded trauma episodes with potentially intrusive episodes that did not intrude (i.e. Intrusion vs. Potential) revealed hypoactivation in prefrontal regions, suggesting that sufficient involvement of the prefrontal control system further plays a key role in preventing intrusions. This result aligns with findings that failed control of traumatic memories is typically associated with reduced prefrontal control (Fenster, Lebois, Ressler, & Suh, Reference Fenster, Lebois, Ressler and Suh2018; Harnett et al., Reference Harnett, Goodman and Knight2020; Shin et al., Reference Shin, Rauch and Pitman2006). Therefore, prefrontal control is broadly recruited during intrusive memory processing, while relatively weaker engagement at the episode level is associated with a higher probability of later intrusion. Additionally, we further show that visual sensory cortices (e.g. OVC) play a pivotal role in predicting intrusions. Intrusive episodes were marked by stronger activation and more stable neural representations in OVC during encoding. Beyond encoding, our real-time resting-state fMRI recordings following trauma-film viewing revealed that OVC is actively engaged during the spontaneous onset of memory intrusions. The Intrusion versus Potential comparison further suggested that OVC hyperactivation during encoding is another factor contributing to intrusion occurrence. Taken together, these fMRI findings provide correlational evidence that prefrontal and visual sensory activities are critical neural signatures of trauma-related intrusions.
The mechanism for intrusion control through sensory cortex modulation is elucidated by two lines of analysis. First, between-group comparisons showed that rTMS to V1/V2 modulated not only visual sensory regions but also prefrontal regions. Following rTMS, the V1/V2 group experienced fewer intrusions, leaving only intrusions resistant to V1/V2 disruption. Compared with Vertex, these resistant intrusions showed heightened activation in OVC and reduced engagement of MFG, suggesting that intrusive reexperiencing is driven by excessive sensory involvement coupled with insufficient prefrontal control. Notably, while downstream effects in the visual cortex are expected after V1/V2-targeted rTMS, the accompanying changes in MFG suggest broader network-level modulation, indicating that V1/V2 stimulation influences prefrontal function. Second, consistent with the between-group comparison findings, connectivity analyses revealed direct, bidirectional coupling between MFG and OVC, with connection strength predicting memory intrusion frequency. Critically, this MFG-OVC pathway coexisted in parallel with the canonical MFG-amygdala pathway, and the information flow from OVC to MFG was strengthened by encountering traumatic memories, whereas the AMG → MFG flow was insensitive to trauma episodes. These results indicate that OVC is actively and independently engaged in regulating memory intrusions, rather than being merely a downstream recipient of limbic processing.
To identify effective intervention targets for emotion regulation, recent work has examined brain regions that are modifiable versus nonmodifiable by emotion regulation strategies. Bo et al. (Reference Bo, Kraynak, Kwon, Sun, Gianaros and Wager2024) showed that the well-established strategy of cognitive reappraisal does not modify the amygdala or other affect-related limbic regions, despite these regions’ high sensitivity to negative emotion. In contrast, the regions most strongly downregulated by reappraisal were in the visual and somatosensory cortices, which is consistent with our findings. These results question the long-standing emphasis on the amygdala as a core target for emotion regulation (Harnett et al., Reference Harnett, Fleming, Clancy, Ressler and Rosso2025). Although our dual-pathway model includes amygdala involvement, it underscores the visual cortex as a more direct and modifiable target in regulating trauma-related intrusions. The present study targeted V1/V2, an upstream node of OVC, to ensure downstream influence. Nevertheless, higher-level visual regions that more directly represent the content of intrusive memories may yield more robust or more selective intrusion disruption. Importantly, however, before applying such sensory-cortex neuromodulation, it is critical to investigate broader network-level neural changes following intervention and to characterize any unforeseen downstream effects.
While the present study provides causal evidence for the role of OVC in trauma-memory intrusions, important gaps remain between this experimental demonstration and the clinical application of rTMS for trauma treatment. First, analogue trauma induced by films is mild-to-moderate in strength and transient in influence (Brewin, Reference Brewin2014; James et al., Reference James, Lau-Zhu, Clark, Visser, Hagenaars and Holmes2016), limiting our ability to model the longer-term and more complex changes characteristic of clinical memory disorders. Nonetheless, real-life trauma is often associated with greater sensory vividness and emotional intensity, which may be particularly amenable to interventions targeting sensory regions. Notably, stronger and more persistent symptoms in clinical contexts would likely require multiple rTMS sessions. Second, our rTMS intervention targeted newly formed memories, whereas treatment in real life often occurs long after the trauma, when memories are consolidated and more resistant to modulation. In fact, Herz et al. (Reference Herz, Bar-Haim, Tavor, Tik, Sharon, Holmes and Censor2022) have applied rTMS to V1/V2 after a 24-hour delay but did not reduce the intrusion frequency. We argue that this does not preclude the effectiveness of sensory-region modulation; rather, it underscores the importance of effectively reactivating visual sensory representations before stimulation. Because real-life trauma memories readily reactivate in vivid, sensory-rich form, presenting cues tightly linked with trauma scenes or explicitly engaging participants in vivid recall may more reliably recruit the visual cortex and thereby increase the likelihood of successful modulation. Finally, because our study was conducted in healthy participants and did not assess PTSD symptom measures, it remains unknown whether rTMS over the early visual cortex will generalize to clinical populations with trauma-related disorders. Importantly, such patients often show impaired cognitive control, which may limit the efficacy of approaches that rely primarily on strengthening prefrontal regulation (Anderson & Hulbert, Reference Anderson and Hulbert2021; Buhle et al., Reference Buhle, Silvers, Wager, Lopez, Onyemekwu, Kober, Weber and Ochsner2014; Fonzo et al., Reference Fonzo, Goodkind, Oathes, Zaiko, Harvey, Peng, Weiss, Thompson, Zack, Lindley, Arnow, Jo, Gross, Rothbaum and Etkin2017). In these cases, directly reducing excessive sensory representations before attempting to enhance cognitive control may be particularly advantageous. Together, these considerations suggest that combining optimized reactivation procedures with targeted sensory-cortex modulation may be a promising next step toward clinical translation.
Supplementary material
The supplementary material for this article can be found at http://doi.org/10.1017/S0033291726104309.
Data availability statement
Data and code are available at https://osf.io/e9zmw/.
Acknowledgments
This work was supported by research grants from the National Natural Science Foundation of China (32471092), the Fundamental Research Funds for the Central Universities (Grant 226-2024-00118), the National Science and Technology Innovation 2030 – Major Project 2021ZD0200409, and Zhejiang Provincial Natural Science Foundation (LY24C090002).
Author contribution
Y. W., Z. X., and J. D. designed research. Z. X., J. D., J. G., and K. Y. performed research. J. D. and Z. X. analyzed data. J. D., Y. W., and Z. X. contributed to the writing and editing of the manuscript. All authors approved the final version for submission.
Competing interests
The authors declare none.
Declaration of AI usage
AI-assisted language tools were used only for English editing. All scientific content, including study design, analyses, and interpretation, was produced by the authors, who remain fully responsible for the manuscript.


 Open access