


Impact statements
Floods remain among the most misunderstood and costly natural hazards worldwide, in part because conventional communication methods, such as “100-year floods” or probabilistic return periods, are complex for the general public to interpret. This study introduces the Nines of Safety (NoS) framework as an intuitive, scientifically grounded way to express flood hazard in terms of safety probability rather than event frequency. By translating complex hydrologic data into a logarithmic “nines” scale (e.g., 99% = 2 NoS, 99.9% = 3 NoS), the approach allows policymakers, engineers and citizens to communicate risk using a shared and easily understandable language.
Beyond technical innovation, the NoS framework enhances public understanding by linking hazard modeling with social context. By validating against the Centers for Disease Control and Prevention’s Social Vulnerability Index, this study demonstrates that communities with higher social vulnerability often exhibit lower NoS values, indicating a measurable overlap between physical exposure and social inequity. This connection provides a new lens for equitable disaster communication and resource prioritization.
In a broader view, the NoS framework offers a scalable foundation for integrating diverse datasets, from flood maps to social indicators, into visually intuitive communication tools. Its logarithmic structure can be adapted for other hazards, such as droughts, heatwaves or earthquakes, making it a universal framework for hazard translation. The ultimate impact of this work lies in bridging the gap between data scientists, emergency managers and everyday citizens, promoting not only awareness but also actionable preparedness.
By reframing “risk” as “safety,” the NoS approach empowers communities to understand their protection level in plain terms, supporting transparent decision-making, resilient planning and equitable communication in an era of increasing climate extremes.
Introduction
Floods remain one of the most devastating natural hazards globally, resulting in severe human, environmental and economic consequences. From inundating urban infrastructure and agricultural land to displacing communities and overwhelming emergency services, floods have profound implications for both developed and developing regions (Mauch and Pfister, Reference Mauch and Pfister2009; Alabbad et al., Reference Alabbad, Yildirim and Demir2023; Tate et al., Reference Tate, Rufat, Rahman and Hoover2025). With increasing climate variability and intensifying precipitation patterns, the frequency and severity of extreme flood events are expected to rise in many parts of the world (Nourani et al., Reference Nourani, Khodkar, Baghanam, Kantoush and Demir2023). For public safety and preparedness, flood risk communication is not merely an auxiliary task but a central pillar of disaster management (Cole and Murphy, Reference Cole and Murphy2014; Lieske et al., Reference Lieske, Wade and Roness2014).
Despite decades of advances in hydrological modeling and hazard mapping, public understanding of flood risk remains limited. Commonly used communication tools, such as return periods (e.g., “100-year flood”) or exceedance probabilities (e.g., “1% annual chance”), often fail to convey the immediacy and relevance of flood hazards to nontechnical audiences. Misinterpretations are common, with many individuals assuming that a 100-year flood occurs only once in a century, or that a 10% chance is negligible, when in fact it implies a high risk over time. Moreover, traditional outreach materials (e.g., brochures, text-based warnings and hazard maps) often struggle to engage marginalized or low-literacy communities (Thorup-Binger and Charania, Reference Thorup-Binger and Charania2019), further exacerbating inequities in preparedness and response.
To address these challenges, this study introduces the Nines of Safety (NoS): a logarithmic-scale metric for expressing the probability of avoiding adverse flood outcomes in a format that is more cognitively intuitive and scalable. Rather than expressing safety in terms of percentages or return periods, the NoS quantifies the number of consecutive 9 s in the probability of avoiding harm, for example, a 90% chance of success equates to 1 NoS, while a 99% chance corresponds to 2 NoS. This approach, inspired by systems used in reliability engineering, information security and telecommunications, has been adapted here as a communication aid for the flood hazard context.
Crucially, the study does not propose a new risk model. Risk, as defined by frameworks such as the Intergovernmental Panel on Climate Change (IPCC) and International Organization for Standardization (ISO) 31000, is the combination of hazard, exposure and vulnerability. The NoS metric represents only the hazard probability, isolating the physical likelihood of flood occurrence from the social and economic dimensions of risk (Tanir et al., Reference Tanir, Yildirim, Ferreira and Demir2024). This separation ensures conceptual clarity and prevents conflating hazard with full risk. NoS translates complex probabilities into an intuitive safety scale for both experts and the public. To enhance relevance, geophysical and sociodemographic indicators, such as elevation, land use and population density, can be layered with NoS values to contextualize flood safety within broader vulnerability patterns.
This study presents a conceptual and practical framework for flood hazard communication using the NoS. Specifically, the framework (i) formalizes the NoS metric through a logarithmic probability transformation, (ii) integrates key geophysical indicators across spatial and temporal scales and (iii) demonstrates its application for communicating local flood hazard variations. By visualizing safety as a probability-based continuum, the framework promotes more accessible and equitable communication that complements traditional hazard mapping.
Background and related work
Effective flood risk communication depends on understanding how individuals perceive and respond to hazard information. Risk communication and perception shape how communities interpret flood warnings, preparedness messages and probabilities. Flood risk management and assessment are underpinned by two fundamental elements: risk communication and risk perception (Birkholz et al., Reference Birkholz, Muro, Jeffrey and Smith2014). These components play a pivotal role in guiding strategies to mitigate the devastating consequences of flooding.
In quantitative terms, risk is typically defined as a function of hazard, exposure and vulnerability. Among these, hazard – the probability and intensity of a flood event – forms the core component that the NoS framework aims to represent in a simplified, communicable form. Disaster risk is widely conceptualized as a function of three core components: hazard, exposure and vulnerability. According to frameworks developed by the IPCC (2022) and ISO (2009), a hazard is a potentially damaging physical event (e.g., a flood), exposure refers to the presence of people and assets in areas affected by the hazard, and vulnerability describes the degree to which those exposed elements are susceptible to harm (Alexander, Reference Alexander2018) These components interact to define overall risk, often modeled as:
 $$ Risk=f\left( Hazard, Exposure, Vulnerability\right) $$
Risk communication
Risk communication takes center stage in flood risk management as a crucial link between technical expertise and vulnerable communities (Kellens et al., Reference Kellens, Terpstra and De Maeyer2013). It transcends mere data conveyance; it encompasses the art of fostering a deep understanding of flood risks and empowering informed decision-making. By effectively communicating flood risk, individuals, communities and policymakers can take proactive measures to reduce the potential impacts of flooding (Filatova et al., Reference Filatova, Mulder and van der Veen2011; Shao et al., Reference Shao, Xian, Lin, Kunreuther, Jackson and Goidel2017; Sermet and Demir, Reference Sermet and Demir2022; Li & Demir, Reference Li and Demir2023).
The objectives of risk communication in flood management are multifaceted. They include enhancing preparedness by educating communities about flood risks and preparedness measures, building resilience through advocacy for flood-resilient infrastructure and land-use planning, elevating awareness of the potential consequences of flooding and facilitating decision-making with clear, accurate information (O’Sullivan et al., Reference O’Sullivan, Bradford, Bonaiuto, De Dominicis, Rotko, Aaltonen, Waylen and Langan2012). However, the path to effective communication is fraught with challenges. The complexity of flood risk information – comprising intricate hydrological data, probabilistic forecasts and topographic analysis – creates a barrier for many audiences (Grimaldi et al., Reference Grimaldi, Schumann, Shokri, Walker and Pauwels2019; Rumson and Hallett, Reference Rumson and Hallett2019). Additionally, the need to communicate uncertainty without inciting panic or indifference presents an ongoing tension (Thompson et al., Reference Thompson, Marker, Poole, Pereira, Lim, Razak and Hunt2020).
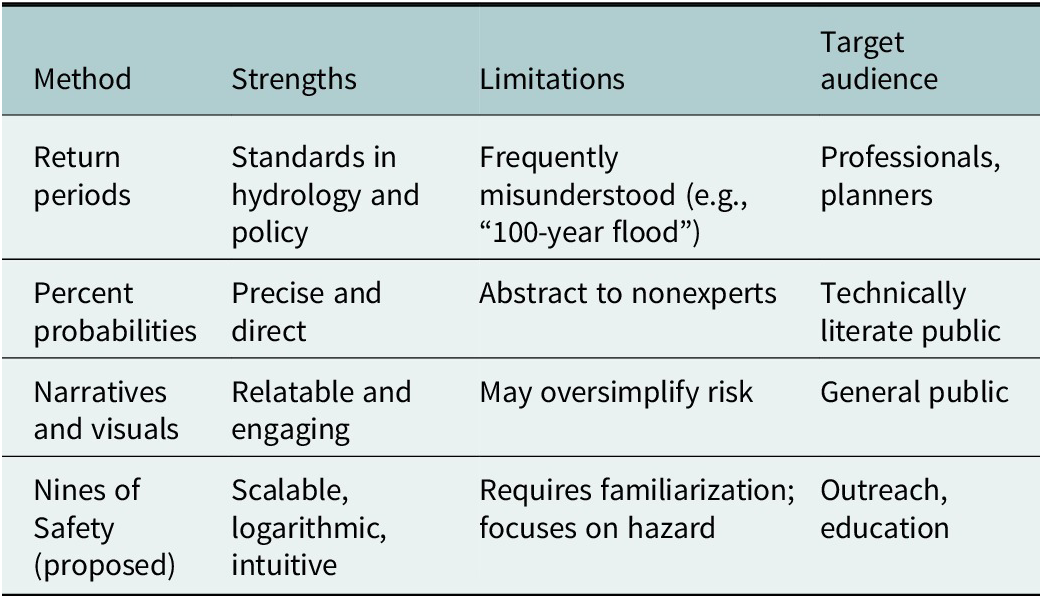
Communication formats also vary in effectiveness depending on the audience. Table 1 compares different flood hazard communication methods, each with specific strengths and limitations. While return periods and probabilistic terms are common in technical literature, they are often misinterpreted by the public. Visuals and narratives tend to be more intuitive but may oversimplify scientific data. The NoS framework offers potential to bridge technical assessment and community-level communication by providing an intuitive representation of safety probabilities.
Comparison of flood hazard communication strategies

Risk perception
Understanding how individuals perceive flood risks is critical to flood risk management. Risk perception is influenced by numerous factors, including personal experiences with past floods, information from the media and authoritative sources, social networks (Li et al., Reference Li, Huang and Emrich2020; Sayers et al., Reference Sayers, Yuanyuan, Galloway, Penning-Rowsell, Fuxin, Kang, Yiwei and Le Quesne2013) and psychological biases (Walkling and Haworth, Reference Walkling and Haworth2020). These influences can shape how individuals interpret risk information and how likely they are to act upon it.
To address misalignments between scientific risk and public perception, communicators can adopt various strategies. These include tailored messaging designed to resonate with specific communities, involving residents in participatory risk assessments and maintaining transparency about uncertainties in risk forecasts (Figueiredo et al., Reference Figueiredo, Valente, Coelho and Pinho2009; Henriksen et al., Reference Henriksen, Roberts, van der Keur, Harjanne, Egilson and Alfonso2018). Continuous education campaigns also help reinforce understanding and preparedness.
The interplay between risk communication and perception is dynamic – effective communication can shift perception and foster improved preparedness behavior (Wood et al., Reference Wood, Kovacs, Bostrom, Bridges and Linkov2012; Tanner and Árvai, Reference Tanner and Árvai2018; Demiray et al., Reference Demiray, Sermet, Yildirim and Demir2023). This strategy underpins the rationale for the NoS: a tool not just for representing hazard levels but for helping people intuitively grasp the likelihood of safety rather than the probability of disaster. This reframing aligns with psychological research showing that people respond more strongly to simplified, positive messaging formats that focus on what is avoidable (Slovic et al., Reference Slovic, Finucane, Peters and MacGregor2004; Voinson et al., Reference Voinson, Billiard and Alvergne2015).
In summary, while this section preserves the foundational concepts of flood risk communication and perception, it expands them by embedding them within widely accepted risk models and emphasizing the cognitive framing of risk. The NoS, described in the next section, is proposed as a communication method that enhances clarity and relatability in flood hazard interpretation, particularly for nonexpert stakeholders.
Federal agencies and standards for risk communication
The United States, like Europe, has established common standards for flood risk communication. The Federal Emergency Management Agency (FEMA) is a central authority responsible for flood hazard mapping and risk communication. FEMA’s Flood Insurance Rate Maps (FIRMs) are a cornerstone, delineating flood zones and risk areas (Li et al., Reference Li, Duque, Grout, Bates and Demir2023). These flood maps serve as a fundamental resource for floodplain management and insurance (Li and Demir, Reference Li and Demir2022). Additionally, the National Oceanic and Atmospheric Administration operates the National Weather Service, providing timely flood forecasts, watches and warnings (Beattie et al., Reference Beattie, Beard and Crane2002).
Community-based initiatives
At the local level, government agencies, emergency management organizations and nonprofit groups play vital roles in flood risk communication (Mitchell et al., Reference Mitchell, Haynes, Hall, Choong and Oven2008). These entities employ community-based initiatives, such as public outreach campaigns, town hall meetings and educational programs (Mulyasari and Shaw, Reference Mulyasari and Shaw2013). The objective is to engage communities in understanding their flood risks, evacuation routes and emergency response protocols. These efforts are particularly crucial in flood-prone areas along rivers in vulnerable low-lying regions (Adikari et al., Reference Adikari, Osti and Noro2010; De Sherbinin et al., Reference De Sherbinin, Schiller and Pulsipher2007; Yildirim et al., Reference Yildirim, Just and Demir2022).
While multiple strategies exist for disseminating flood-risk information, most rely on probabilistic terms that are challenging for nonexperts to interpret. To address this gap, the following section introduces the NoS framework, a standardized logarithmic metric designed to communicate flood-safety probabilities transparently and comparably.
Flood risk communications approaches
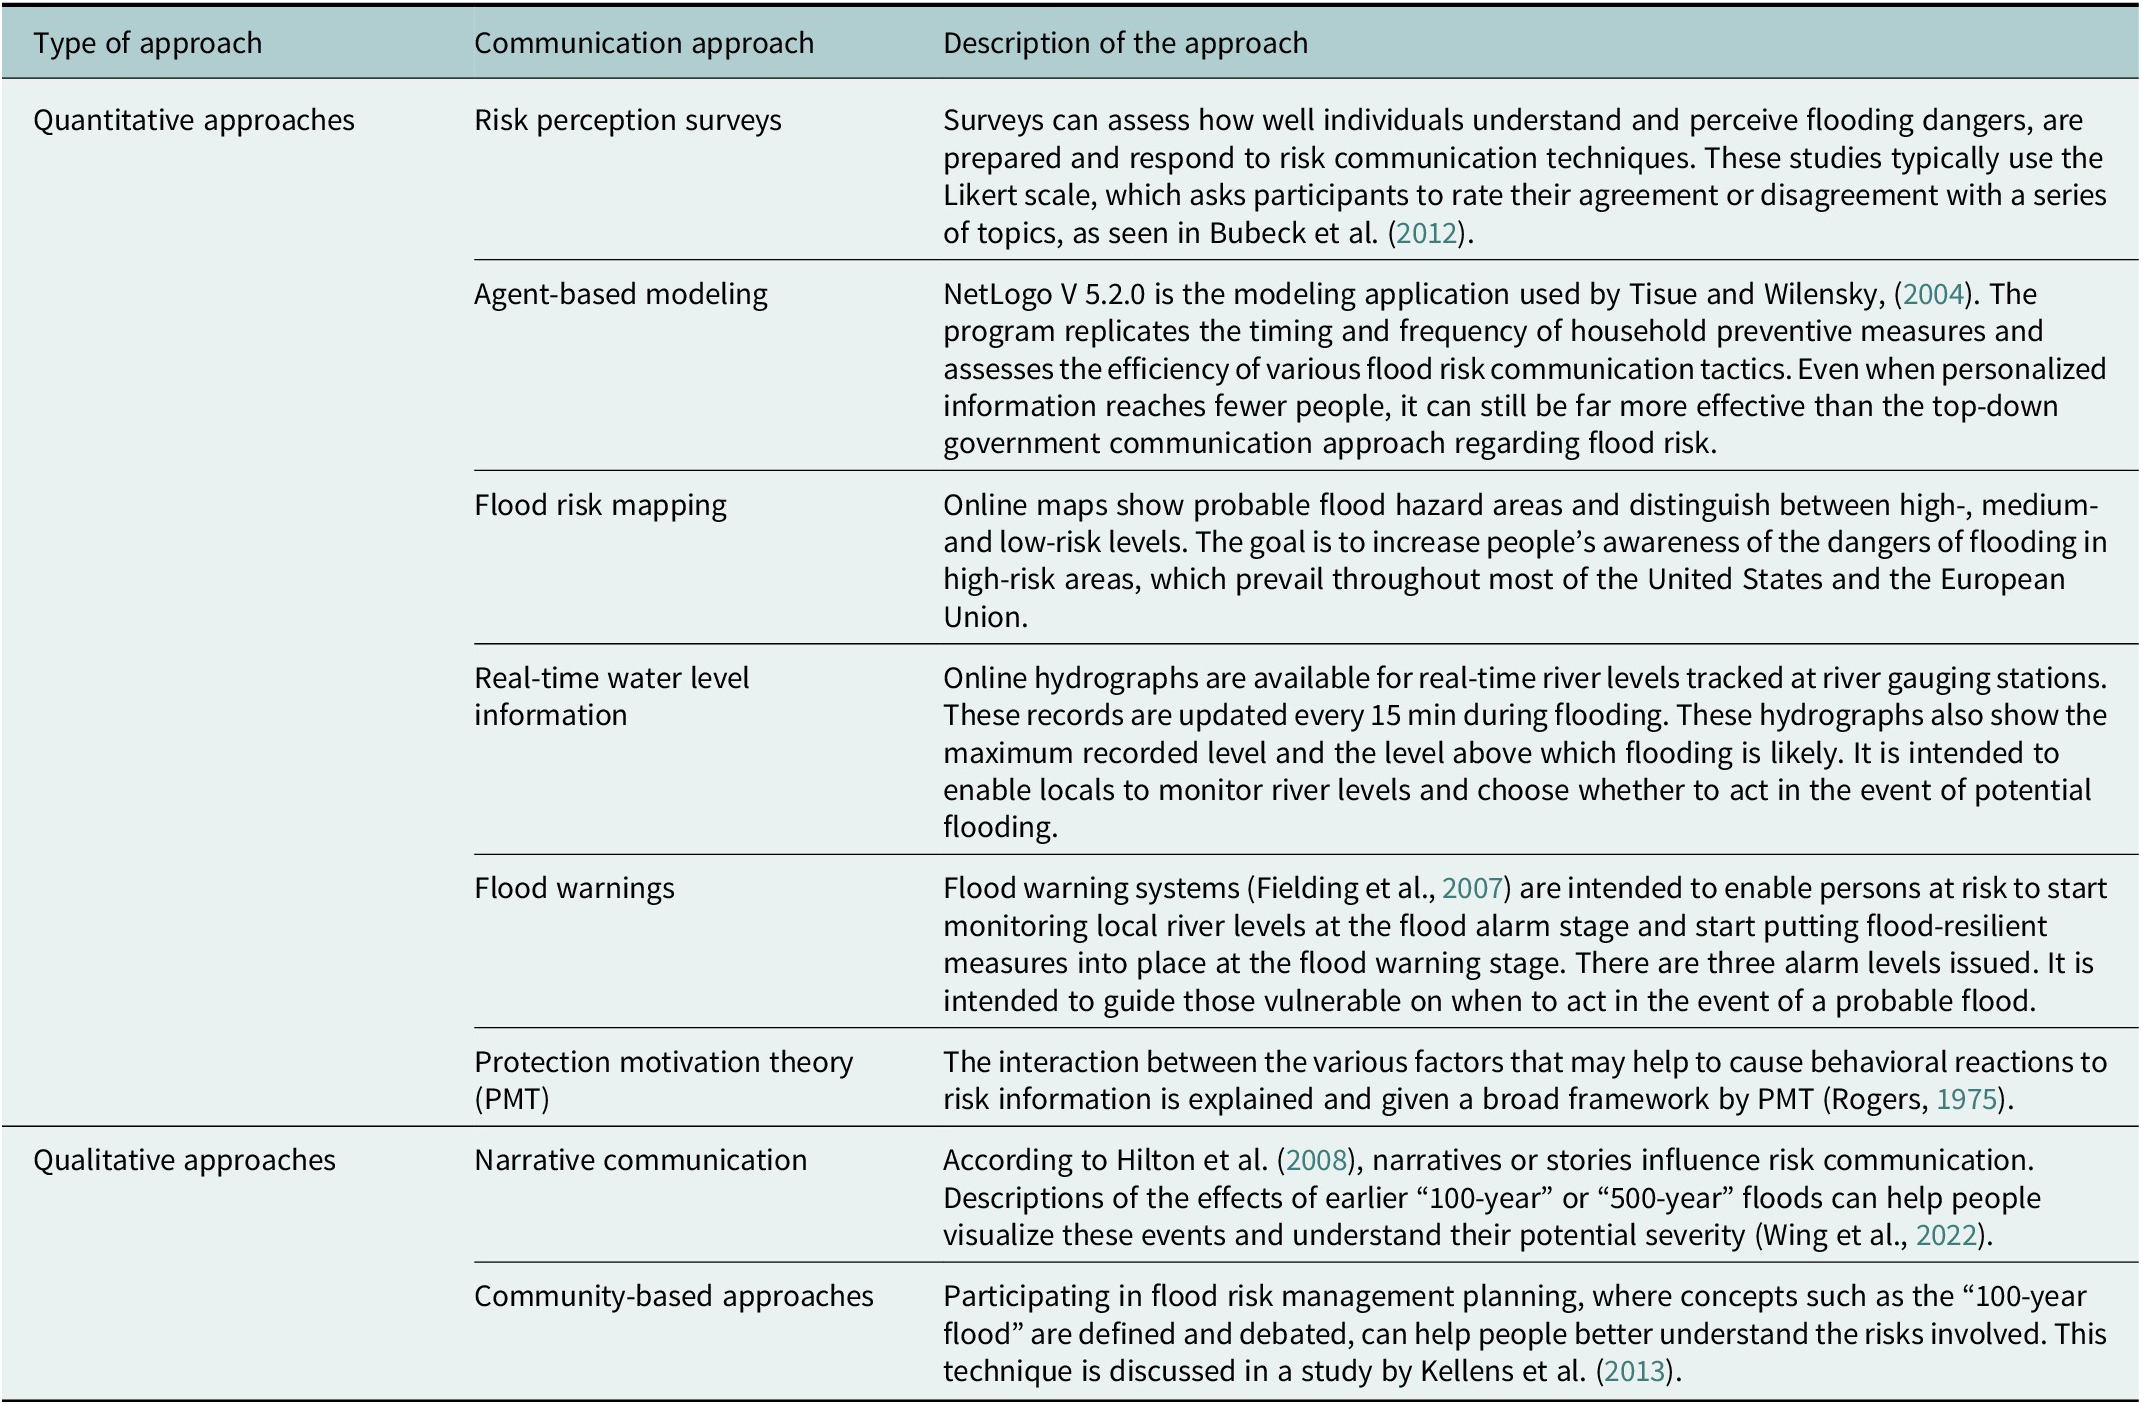
Flood risk communication requires various strategies, which can be classified into two main categories: quantitative and qualitative methods (Table 2). To evaluate comprehension and efficacy, quantitative methodologies encompass risk perception surveys and agent-based modeling. Flood risk mapping, providing real-time water level data and disseminating flood warnings collectively provide up-to-date and timely information (Mount et al., Reference Mount, Alabbad and Demir2019). The Protection Motivation Theory offers a theoretical framework for understanding and analyzing behavioral responses.
Flood risk communication approaches

Qualitative methodologies encompass the utilization of narrative communication, which emphasizes the use of tales to convey causal links. Community-based approaches involve community members’ active engagement in risk management planning, thereby fostering a deeper understanding of the subject matter. These tactics jointly improve the effectiveness of flood risk communication by addressing the diverse preferences and demands of a broad audience.
Effective communication of flood risk is essential for empowering communities to make informed decisions in the face of potential disasters. Risk communication methods have evolved significantly over time, encompassing a range of approaches from traditional public service announcements to more interactive and inclusive strategies (Kellens et al., Reference Kellens, Terpstra and De Maeyer2013; Alabbad and Demir, Reference Alabbad and Demir2022). Traditional methods typically involve disseminating information through flyers, public meetings and mass media to increase awareness. However, these approaches often fail to engage communities in meaningful dialogue, particularly marginalized populations with lower levels of trust or access to information (Thorup-Binger and Charania, Reference Thorup-Binger and Charania2019; Sit et al., Reference Sit, Seo and Demir2023).
Modern flood risk communication practices embrace participatory approaches, utilizing tools such as web-based dashboards, collaborative mapping platforms and mobile alerts tailored to local vulnerabilities (Sit et al., Reference Sit, Demiray and Demir2021; Sermet and Demir, Reference Sermet and Demir2022). These strategies aim not only to inform but to empower, making flood risk communication an interactive and iterative process (Cole and Murphy, Reference Cole and Murphy2014; Perera et al., Reference Perera, Agnihotri, Seidou and Djalante2020; Xiang and Demir, Reference Xiang and Demir2022).
Despite these advancements, a critical challenge remains communicating probabilistic flood hazard in a format that is both intuitive and actionable for nonexpert audiences. Terms such as “1-in-100-year flood” or “0.1% annual probability” are frequently misunderstood, leading to either undue complacency or excessive panic (Botzen et al., Reference Botzen, Aerts and van den Bergh2009; Thompson et al., Reference Thompson, Marker, Poole, Pereira, Lim, Razak and Hunt2020). The public often lacks a clear framework for interpreting risk and responding appropriately to hazard information.
Theoretical foundation: The NoS
In the United States, flood risk communication is a critical component of flood risk management, aimed at raising awareness, enhancing preparedness and fostering community resilience to help cities prepare for future environmental challenges (Beck et al., Reference Beck, Jiang, Shi, Walker, Osidele, Lin, Demir and Hall2010). Several key strategies and challenges characterize the country’s current landscape of flood risk communication.
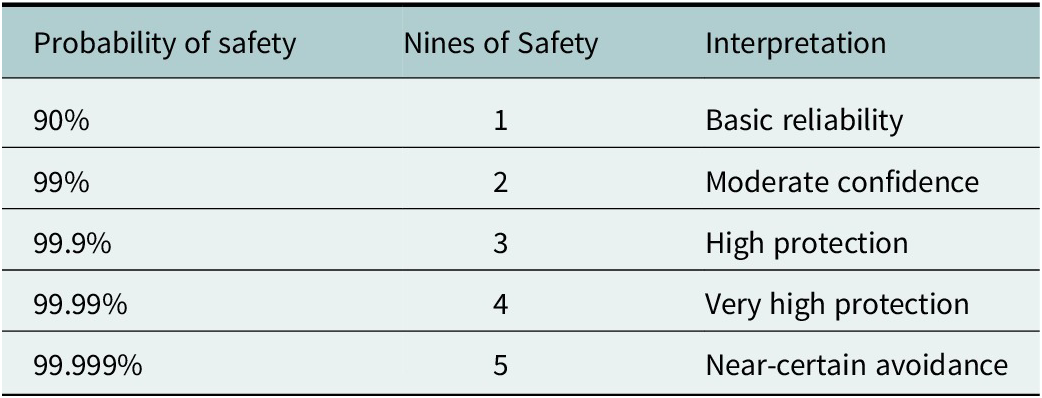
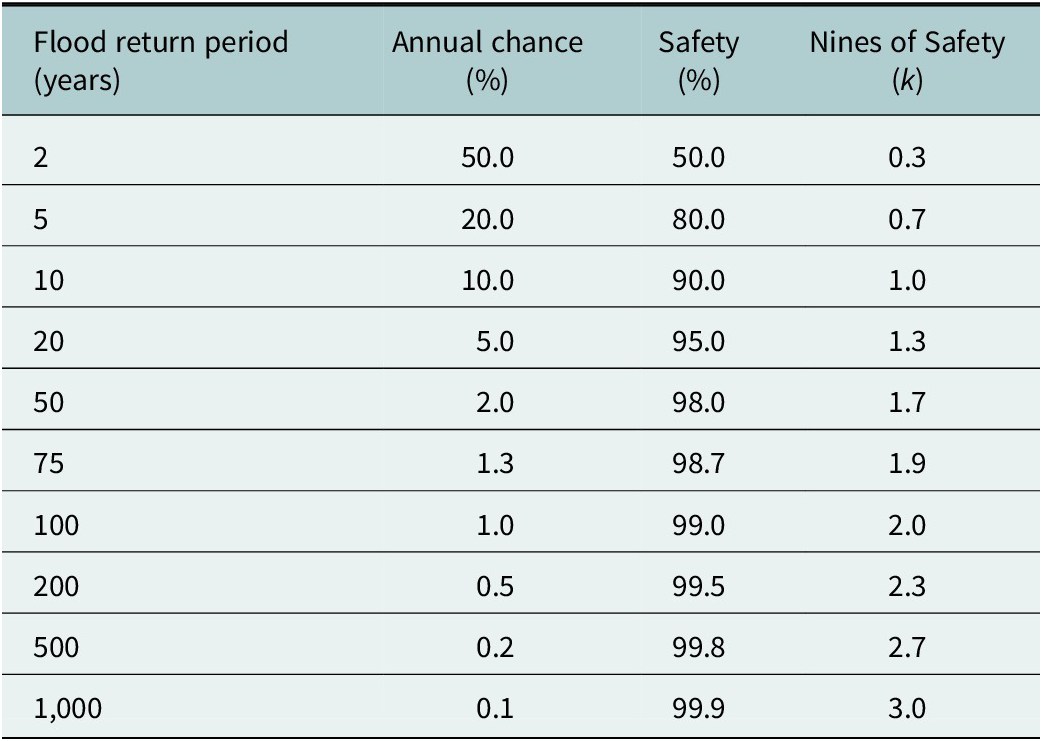
To address this gap, this study introduces the NoS framework as a novel and intuitive approach to flood risk communication. Borrowed from systems engineering and reliability theory, the NoS framework, which translates probabilities of successful avoidance of adverse outcomes into “nines,” is a logarithmic representation that emphasizes increasing levels of protection. For example, a 90% probability of avoiding a flood corresponds to 1 NoS, a 99% probability equates to 2 nines, a 99.9% probability corresponds to 3 nines and so forth. This framing highlights the exponentially decreasing likelihood of failure, which is often more meaningful in high-stakes decision contexts (Smith, Reference Smith1989) (Table 3).
Relationship of safety probability with the NoS scale

This approach simplifies the communication of rare-event probabilities by removing ambiguous percentages and enabling consistent comparisons across different flood scenarios. Furthermore, unlike the traditional return period concept, which can be misleading (e.g., assuming a 1-in-100-year event occurs only once per century), the NoS framework emphasizes that the probability of safety is a psychologically positive and consistent metric for evaluating flood protection.
Critically, the NoS framework does not claim to represent full risk, as defined by the IPCC, which includes hazard, exposure and vulnerability. However, by translating hazard probability into a standardized, scalable format, the NoS serves as a communicative bridge between technical flood risk assessments and community understanding.
Terminology notes
In this study, hazard refers to the probability of flood occurrence, vulnerability represents the degree to which exposed elements can be damaged, and risk combines hazard, exposure and vulnerability. The NoS is used exclusively as a logarithmic scale to express the probability that a hazard event will not occur. It does not quantify the severity of consequences or the levels of vulnerability.
The NoS quantifies the probability of non-occurrence of a flood event as a base-10 logarithmic transformation of safety probability. It is computed as
 $$ \mathrm{NoS}=-{\log}_{10}\left({P}_f\right) $$
where $ {P}_f $
represents the failure probability (i.e., the probability of flood occurrence) and
$ {P}_f $
represents the failure probability (i.e., the probability of flood occurrence) and $ 1-{P}_f $
represents the probability of safe or nonflooded conditions. For example, an NoS = 3 corresponds to a nonoccurrence probability of 99.9%, while an NoS = 1 corresponds to 90%.
$ 1-{P}_f $
represents the probability of safe or nonflooded conditions. For example, an NoS = 3 corresponds to a nonoccurrence probability of 99.9%, while an NoS = 1 corresponds to 90%.
Methods
NoS approach
Integrating the “NoS” concept into flood risk communication offers a promising pathway to simplify and standardize how we convey the complexities of flood vulnerability. By quantifying safety as a function of risk avoidance, this framework makes technical information more accessible to a wide range of stakeholders, from community members to policymakers. Mapping flood vulnerability levels onto the NoS scale offers an intuitive, visual representation of flood risk, fostering a common understanding across disciplines. Moreover, the NoS framework facilitates standardized assessments or the evaluation of the effectiveness of mitigation interventions.
The conceptual foundation for NoS originates from a 2021 blog post by mathematician Terence Tao, who addressed a recurring challenge in public discourse: the difficulty in interpreting percentages when discussing probabilities and risk. Percentages are a staple in risk communication but are often context-dependent and susceptible to misinterpretation. For instance, a 60% vote share in a political election is viewed as a decisive victory, while a 60% success rate in a medical procedure is considered dangerously low. These inconsistencies highlight how the perceived severity or acceptability of risk varies dramatically across domains.
On the other hand, within the healthcare domain, medical interventions with success rates of 51%, 55% or 60% would be considered unduly hazardous, particularly given the severe consequences of an unsuccessful outcome. However, it is intriguing that even a procedure with a likelihood of nonfatality as high as 90% or 95%, corresponding to a 10% or 5% danger of death, respectively, is not regarded casually. Inequalities in risk perception highlight the contextual sensitivity of percentages in communicating threats.
To address this challenge, Tao proposed the NoS scale as a more intuitive unit for expressing the probability of avoiding adverse outcomes, such as fatalities, system failures or natural hazards. The scale is based on a logarithmic transformation of the probability of failure, effectively counting the number of 9 s in the success rate. For example, a 90% success rate equates to 1 NoS, 99% to 2 nines and 99.9% to 3 nines. This framing enables uniform risk language across sectors and applications.
In harmony with the NoS concept, Tao (Reference Tao2021) offers a precise framework for quantifying safety levels concerning various activities affecting one or more individuals over a specified time frame. It establishes that a workout with probability “p” of yielding a “safe” outcome and a complementary probability (1−p) of resulting in an “unsafe” outcome can be characterized by a specific number of NoS, denoted “k.” The formula rigorously determines this quantification:
 $$ k=-{\log}_{10}\left(1-p\right) $$
where $ {\mathit{\log}}_{10} $
, the logarithm to base 10, plays a pivotal role in the computation. This formula is equivalent to
$ {\mathit{\log}}_{10} $
, the logarithm to base 10, plays a pivotal role in the computation. This formula is equivalent to
 $$ p=1-{10}^{-k} $$
which defines the relationship between probability and NoS, offering a mathematical foundation for our approach. Another notable aspect of this notion is its recognition of the uncertainties inherent in probability measurement and the flaws in the assumptions and approximations used in subsequent analyses. As a result, the measurement of NoS is limited to the first decimal place, and all evaluations are approximated to the nearest tenth of an “NoS.”
This formulation provides a mathematically rigorous yet intuitive structure for translating probabilities into a universal risk scale. To account for uncertainties in estimating probabilities, Tao recommends rounding NoS values to the nearest tenth. This acknowledges the inherent limitations in empirical data and probabilistic modeling.
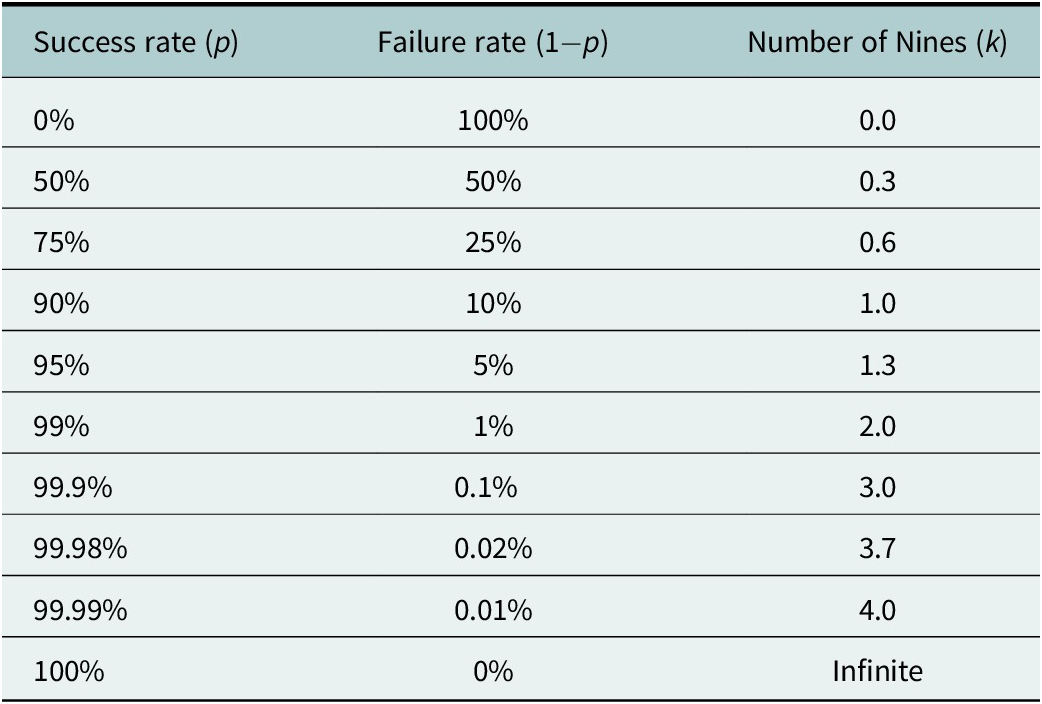
A sample conversion table (Table 4) illustrates how common probability values correspond to their NoS equivalents. For instance, a 95% success rate (or 5% failure rate) yields ~1.3 NoS, while a 99.9% success rate results in 3 nines. Table 4 serves as a practical reference for converting standard percentage-based assessments into the NoS framework.
Relationship between success rate, failure rate and Nines of Safety

This logarithmic structure implies that each additional nine represents a tenfold reduction in failure probability. While infinite safety is theoretically unachievable, striving for higher nines is both desirable and practical. The NoS framework thus provides a scalable, comprehensible method for articulating risk levels across different domains, especially within flood risk communication, where clarity and comparability are paramount.
In the context of flood hazards, where both spatial and temporal uncertainties abound, the NoS approach offers a flexible yet robust system for modeling and disseminating risk-related information. By translating raw probabilities into a compact and consistent unit, the NoS bridge the communication gap between technical experts and the public, enabling more informed and equitable decision-making. For this study, all NoS-time estimations are computed under the stationary-hazard assumption for illustrative consistency.
NoS in flood risk communication
The NoS framework provides a powerful lens for communicating flood risk in a standardized, intuitive manner. Unlike traditional percentage-based risk indicators that can often confuse nonexpert audiences, the NoS metric provides a logarithmic scale that quantifies the probability of a “safe” outcome, that is, the likelihood of avoiding an undesirable event such as flooding. Within this framework, a greater number of nines corresponds to higher levels of safety, allowing diverse stakeholders to grasp risk levels with minimal ambiguity.
NoS is applied to the hazard probability associated with potential flood events. It enables transforming complex hazard probabilities into a single, digestible communication value. This translation is particularly beneficial for comparing vulnerability across spatial or temporal contexts or for assessing the impact of interventions. Additionally, NoS provides a consistent probabilistic framework that can be contextualized with physical and socioeconomic indicators to support more transparent risk communication within specific domains, such as flood hazard, facilitating cross-disciplinary discourse between scientists, planners and the general public. Although NoS uses a common logarithmic expression across applications, the interpretation of its classes (e.g., NoS = 1 or 2) remains context-dependent, reflecting the specific hazard or system being evaluated.
Two primary variables determine the resulting NoS: (a) the number and contributing risk indicators and (b) the duration of exposure to flood hazards. Each additional contributing factor, whether a hydrological model output, demographic vulnerability or policy mitigation, modifies the overall NoS value, either enhancing or diminishing perceived safety. Including these parameters within a probabilistic and temporal framework yields a more precise and actionable representation of flood risk.
NoS at different flood return period zones
In the NoS framework, temporal dynamics are central to characterizing flood susceptibility. One of the most widely used temporal concepts in hydrology is the flood return period, which is the average interval (in years) between events of a given magnitude. From a NoS perspective, these return periods can be translated into annual exceedance probabilities, which are then mapped onto the logarithmic safety scale using the NoS formulation:
 $$ k=-{\log}_{10}\left(1-p\right) $$
where p is the probability of a safe outcome (i.e., no flooding in a given year) and k is the number of NoS. Alternatively, the chance of flooding over a multiyear exposure period can be calculated using:
 $$ Risk\ of\ flooding\ over\;t\; years=1-{\left(1-p\right)}^t $$
This equation shows that even in zones with long return periods, prolonged exposure significantly increases the likelihood of a flood event. For instance, residing in a 1-in-100-year floodplain (i.e., p = 0.01) for 30 years yields a 26% chance of experiencing at least one flood at that time – contradicting the often-misinterpreted notion that such zones are “safe.” Table 5 shows the return periods into annual failure probabilities and corresponding NoS values:
NoS rating with flood return period (years)

As demonstrated, areas with longer return periods (e.g., 1-in-500 or 1-in-1,000 years) naturally have higher NoS values, but long-term exposure, such as living or working in these areas for decades, erodes these safety margins. NoS captures changes in hazard probability over time. In contrast, dynamic vulnerability is reflected through exposure and susceptibility factors, offering a time-sensitive risk communication tool for flood-prone communities.
Physical parameters of flood risk assessment
As with time duration, adding a single indicator will affect the overall safety rating based on the indicator’s relationship to the risk, as defined by the NoS concept. Even if a precaution is <100% effective, it will add additional NoS against the risk. Suppose an activity carries “k” NoS against a particular risk, and a distinct precaution can independently protect against that risk with “l” NoS (that is to say, the probability that the protection is adequate is $ 1-{10}^{-l} $
. Consequently, the number of nines in the activity increases from “k” to “k + l” when this precaution is taken (Tao, Reference Tao2021).
$ 1-{10}^{-l} $
. Consequently, the number of nines in the activity increases from “k” to “k + l” when this precaution is taken (Tao, Reference Tao2021).
Flood risk evaluation requires a thorough approach that considers physical factors to assess a region’s susceptibility. Flood risk is assessed using Digital Elevation Models (DEMs), soil type, land use, drainage density and other factors (Littidej and Buasri, Reference Littidej and Buasri2019; Saleem et al., Reference Saleem, Huq, Twumasi, Javed and Sajjad2019; Vignesh et al., Reference Vignesh, Anandakumar, Ranjan and Borah2021). For this study, we are considering only these four parameters: elevation, soil type, land use and drainage density. Other parameters can be integrated within this scale in the same manner according to their importance in the flood risk assessment.
DEMs provide accurate elevation data and reveal a region’s topography (Rabus et al., Reference Rabus, Eineder, Roth and Bamler2003). This trait helps identify flood-prone lowlands. Flood modelers may define floodplains, identify flood-prone areas and estimate floodwater levels using DEMs (Manfreda et al., Reference Manfreda, Di Leo and Sole2011). The low elevation is prone to being affected by floods with a greater risk and vice versa (Tonn and Guikema, Reference Tonn and Guikema2018). Soil composition significantly affects flood risk assessment (Wang et al., Reference Wang, Lai, Chen, Yang, Zhao and Bai2015). Various soil types have different permeabilities, which affect water infiltration (Huat et al., Reference Huat, Ali and Low2006). Impermeable soils, such as clay, can increase surface runoff and flooding (Sjöman and Gill, Reference Sjöman and Gill2014; Kelly, Reference Kelly2018). Sandy or loamy soils absorb water more readily, reducing the risk of flooding (White, Reference White2008; Palmer and Smith, Reference Palmer and Smith2013).
The distribution and management of land, known as land use, affect flooding susceptibility. Urbanization may increase runoff and flooding by expanding impervious surfaces like roads and buildings (McGrane, Reference McGrane2016). However, locations with ample open land or green spaces can absorb more water, reducing flooding (Givoni, Reference Givoni1991; Farrugia et al., Reference Farrugia, Hudson and McCulloch2013). The size and effectiveness of natural and manufactured drainage networks, including rivers, canals and stormwater infrastructure, are measured by drainage density (Peacock et al., Reference Peacock, Audet, Bastviken, Futter, Gauci, Grinham, Harrison, Kent, Kosten and Lovelock2021). Increased drainage density may help convey surplus water more efficiently, reducing flooding risk (Pallard et al., Reference Pallard, Castellarin and Montanari2009). Inundation may be more likely in areas with poor drainage (Johnson et al., Reference Johnson, Munasinghe, Eyelade and Cohen2019).
Socioeconomic parameters
Socioeconomic factors are equally significant in predicting vulnerability and driving mitigation options for flood risk (Djordjević et al., Reference Djordjević, Butler, Gourbesville, Mark and Pasche2011). Income, age and population are essential socioeconomic factors in flood risk assessment (Cançado et al., Reference Cançado, Brasil, Nascimento and Guerra2008; Carson et al., Reference Carson, Windsor, Hill, Haigh, Wall, Smith, Olsen, Bathke, Demir and Muste2018; Chakraborty et al., Reference Chakraborty, Rus, Henstra, Thistlethwaite and Scott2020). Community resilience to floods depends on income. Due to budgetary constraints, lower socioeconomic households often struggle with pre- and post-flood preparedness and recovery (Lamond et al., Reference Lamond, Joseph and Proverbs2015). Vulnerable people may struggle to afford flood insurance, emergency supplies or home repairs after a flood (Rhodes and Besbris, Reference Rhodes and Besbris2022). However, households with higher incomes may be better able to allocate resources to preventive measures and a faster recovery. Economic inequalities are essential when assessing flood hazards.
Flood risk dynamics are affected by population demographics, particularly age groups (Faber, Reference Faber2015). In flood circumstances, seniors and small children often need special care, evacuation and refuge. Evaluating age-group distribution in flood-prone areas helps customize evacuation strategies, allocate resources efficiently and meet the needs of vulnerable age cohorts (Isia et al., Reference Isia, Hadibarata, Jusoh, Bhattacharjya, Shahedan, Fitriyani and Syafrudin2023). Flood risk is estimated using the socioeconomic status of the population. High-population areas may have more trouble evacuating and organizing storm response. High population densities can further worsen the socioeconomic impacts of floods, such as forced relocation, financial losses and strain on public infrastructure and resources (Chan, Reference Chan, Aldrich, Oum and Sawada2014).
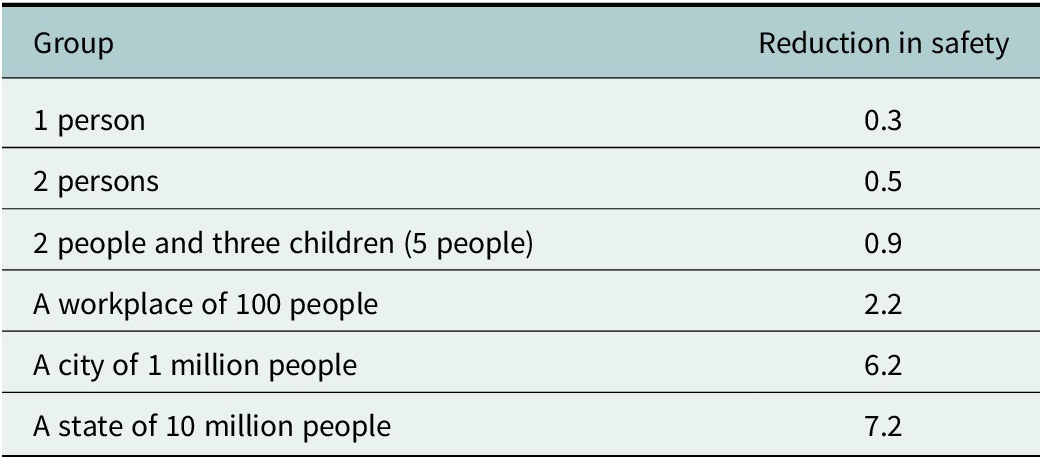
Understanding population distribution and density is essential to estimating flood damage and identifying vulnerable places. Including socioeconomic considerations with physical factors in flood risk assessment models improves susceptibility assessments. By considering income disparities, age group distributions and population densities, stakeholders can tailor flood mitigation, preparedness and response methods to meet the needs and challenges of different socioeconomic groups in flood-prone communities (Teo et al., Reference Teo, Goonetilleke, Ahankoob, Deilami and Lawie2018). A comprehensive strategy improves comprehensive flood resilience and equity. According to Tao (Reference Tao2021), if a group of n people is independently exposed to a given risk. If there are at most m nines of individual safety (Eq. 5) against that risk, there is at least a 50% chance that one group member is affected by the threat.
 $$ m={\mathit{\log}}_{10}\frac{1}{1-{2}^{\frac{-1}{n}}} $$
If there are k NoS individually, then the probability that all the members of the group avoid the risk is given by Eq. 6,
 $$ {\left(1-{10}^{-k}\right)}^m\le \frac{1}{2} $$
which is equivalent to k as given below in Eq. 7.
 $$ k\le {\mathit{\log}}_{10}\frac{1}{1-{2}^{-\frac{1}{n}}} $$
Eqs. 6–8 illustrates how the cumulative safety level decreases as the number of exposed individuals increases. This derivation assumes homogeneous and independent exposure – that is, each experiences the same hazard probability $ p $
. While this assumption allows a closed-form analytical relationship, it does not capture the spatial and socioeconomic heterogeneity of real flood exposure.
$ p $
. While this assumption allows a closed-form analytical relationship, it does not capture the spatial and socioeconomic heterogeneity of real flood exposure.
In practice, individuals face different hazard intensities and levels of vulnerability depending on location and socioeconomic context. A more general formulation can be expressed as
 $$ P=1-\prod_i\left(1-{p}_i\right) $$
where $ {p}_i $
is the failure probability for the i-th individual. This generalization allows the NoS to incorporate variable exposure and correlation effects when such data are available. Future work will implement this heterogeneous formulation using spatially resolved flood probability layers and demographic weighting.
$ {p}_i $
is the failure probability for the i-th individual. This generalization allows the NoS to incorporate variable exposure and correlation effects when such data are available. Future work will implement this heterogeneous formulation using spatially resolved flood probability layers and demographic weighting.
The baseline safety rating for an individual remains constant at NoS = 0, representing the event’s inherent hazard probability. When the population at risk expands, the cumulative probability that at least one person experiences the event increases – even though the underlying flood hazard remains unchanged. For instance, in a two-person group, the combined probability of at least one occurrence results in a marginal NoS decrease of approximately −0.3. Extending this to a 3-person family yields a reduction of −0.5, while a 10-person household corresponds to a decrease of roughly −1.0. Larger collectives show more pronounced aggregate exposure effects: a workplace of 100 individuals reflects an approximate −2.0 reduction, and a city with 1 million inhabitants experiences a decline of about −6.0 (Table 6).
Illustration of cumulative NoS reduction as group size increases, reflecting aggregate exposure probability (not changes in the underlying flood hazard)

This relationship does not imply an increase in flood hazard with population size but rather illustrates the compounding exposure probability within larger groups. Although these simplified reductions do not capture correlations or dependencies among individuals, they offer an analytical foundation for understanding how perceived safety diminishes as exposure expands across spatial and demographic scales.
This idea becomes particularly relevant when evaluating hazards in group settings, as the probability of at least one person encountering the risk increases with group size (Table 4). Although these reductions in safety may be somewhat idealized and fail to account for correlations and dependencies within groups fully, they provide a significant foundation for understanding the changing dynamics of risk across different spatial contexts.
Adding multiple indicators into the safety scale
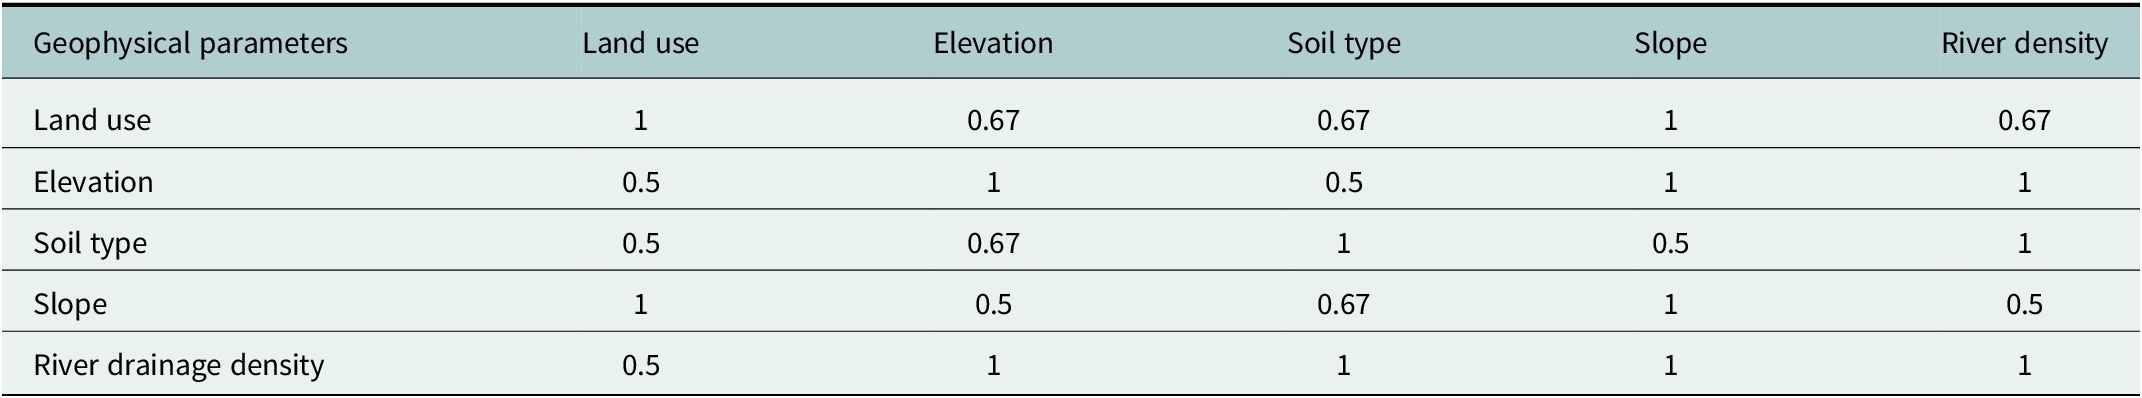
In practical contexts, it is common for multiple physical factors to be interdependent rather than operating in isolation. Conversely, these traits occur in conjunction, contributing to the overall formation of the flood risk landscape. Therefore, it is advisable to include multiple factors in the evaluation procedure to assess the intrinsic safety level within a particular area comprehensively. This requires a comprehensive understanding of the interactions among these variables and their combined impact on flooding. Cikmaz et al., (Reference Cikmaz, Yildirim and Demir2023) have comprehensively analyzed the complex interconnections using the Analytic Hierarchy Process to develop a systematic framework. The research delineates the subsequent interconnections between the factors (Table 7).
Relationship of multiple physical parameters

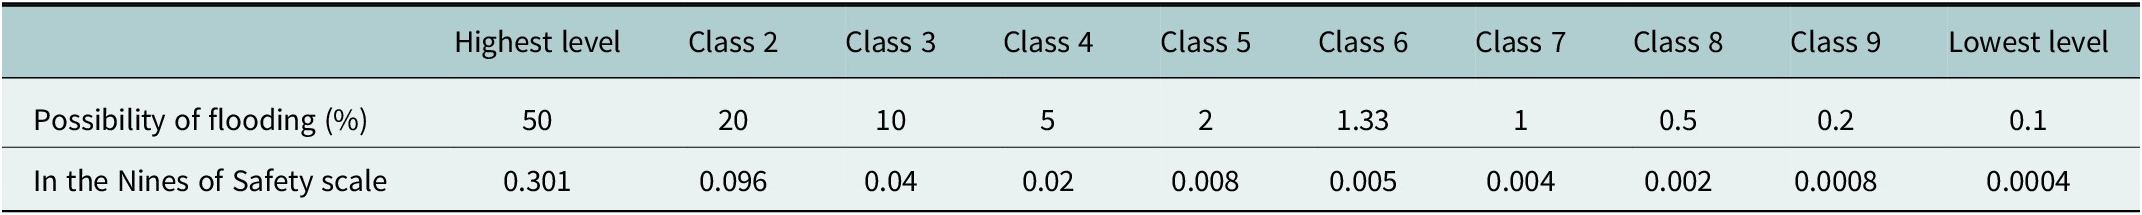
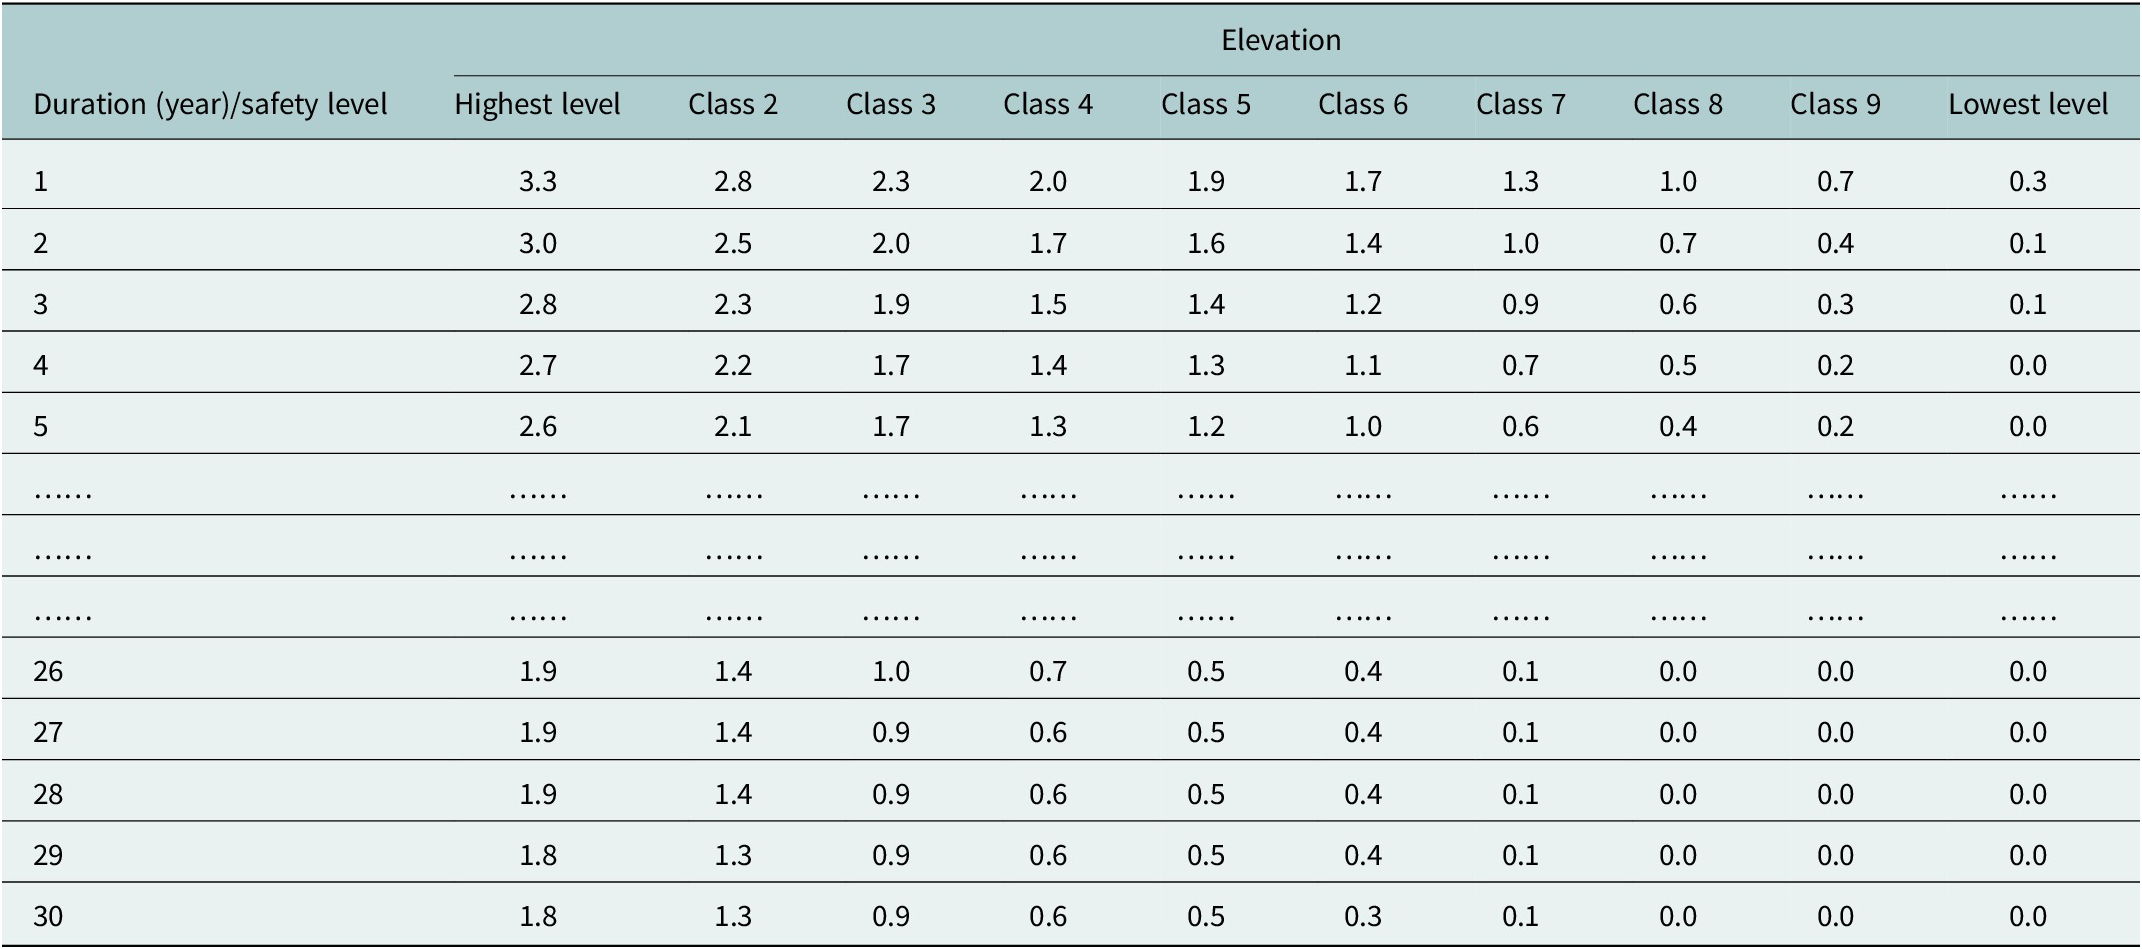
This information will help us understand the safety scale when we consider a new parameter and combine multiple parameters into the scale. If we classify elevation into 10 distinct classes using the natural breaks method, each class will pose a different set of safety concerns (Table 8).
Possibility (%) of flooding and NoS rating

The present study employs topographic and land-surface variables (e.g., elevation, slope and drainage density) as static proxies for relative flood susceptibility. This approach is used to demonstrate the NoS framework rather than to replace hydrodynamic or process-based flood modeling. While such empirical correlations offer an accessible communication tool, the physical dynamics of flooding – such as flow routing and hydrologic connectivity – require dedicated hydraulic simulations. Integrating these physical processes within the NoS framework represents an important direction for future work.
Estimation of base probability (P f )
For the Iowa City case study, the base flood probability ( $ {P}_f $
) for each spatial unit was derived using a Geographic Information System (GIS) based multicriteria flood susceptibility analysis. Five geophysical indicators, that is, elevation, slope, drainage density, soil type and land use, were selected as key determinants of flood likelihood. Each raster layer was first normalized to a 0–1 scale to represent relative susceptibility, where higher values indicate greater flood potential. A weighted overlay analysis was then applied to combine the standardized layers, following established frameworks in flood hazard mapping (e.g., Manfreda et al., Reference Manfreda, Di Leo and Sole2011; Tehrany et al., Reference Tehrany, Lee, Pradhan, Jebur and Lee2014).
$ {P}_f $
) for each spatial unit was derived using a Geographic Information System (GIS) based multicriteria flood susceptibility analysis. Five geophysical indicators, that is, elevation, slope, drainage density, soil type and land use, were selected as key determinants of flood likelihood. Each raster layer was first normalized to a 0–1 scale to represent relative susceptibility, where higher values indicate greater flood potential. A weighted overlay analysis was then applied to combine the standardized layers, following established frameworks in flood hazard mapping (e.g., Manfreda et al., Reference Manfreda, Di Leo and Sole2011; Tehrany et al., Reference Tehrany, Lee, Pradhan, Jebur and Lee2014).
The resulting composite index represents a spatially distributed relative flood probability map ( $ {P}_f $
) used as input for the NoS transformation. Where available, FEMA FIRMs and historical inundation extents were used to guide weight assignment and approximate calibration of flood-prone zones. All spatial processing was conducted in ArcGIS Pro 3.2, using 10-m U.S. Geological Survey (USGS) National Elevation Dataset (NED) elevation data, Natural Resources Conservation Service (NRCS) Soil Survey Geographic Database (SSURGO) soils, and USGS National Land Cover Database (NLCD) 2021 land-use maps.
$ {P}_f $
) used as input for the NoS transformation. Where available, FEMA FIRMs and historical inundation extents were used to guide weight assignment and approximate calibration of flood-prone zones. All spatial processing was conducted in ArcGIS Pro 3.2, using 10-m U.S. Geological Survey (USGS) National Elevation Dataset (NED) elevation data, Natural Resources Conservation Service (NRCS) Soil Survey Geographic Database (SSURGO) soils, and USGS National Land Cover Database (NLCD) 2021 land-use maps.
Results and discussion
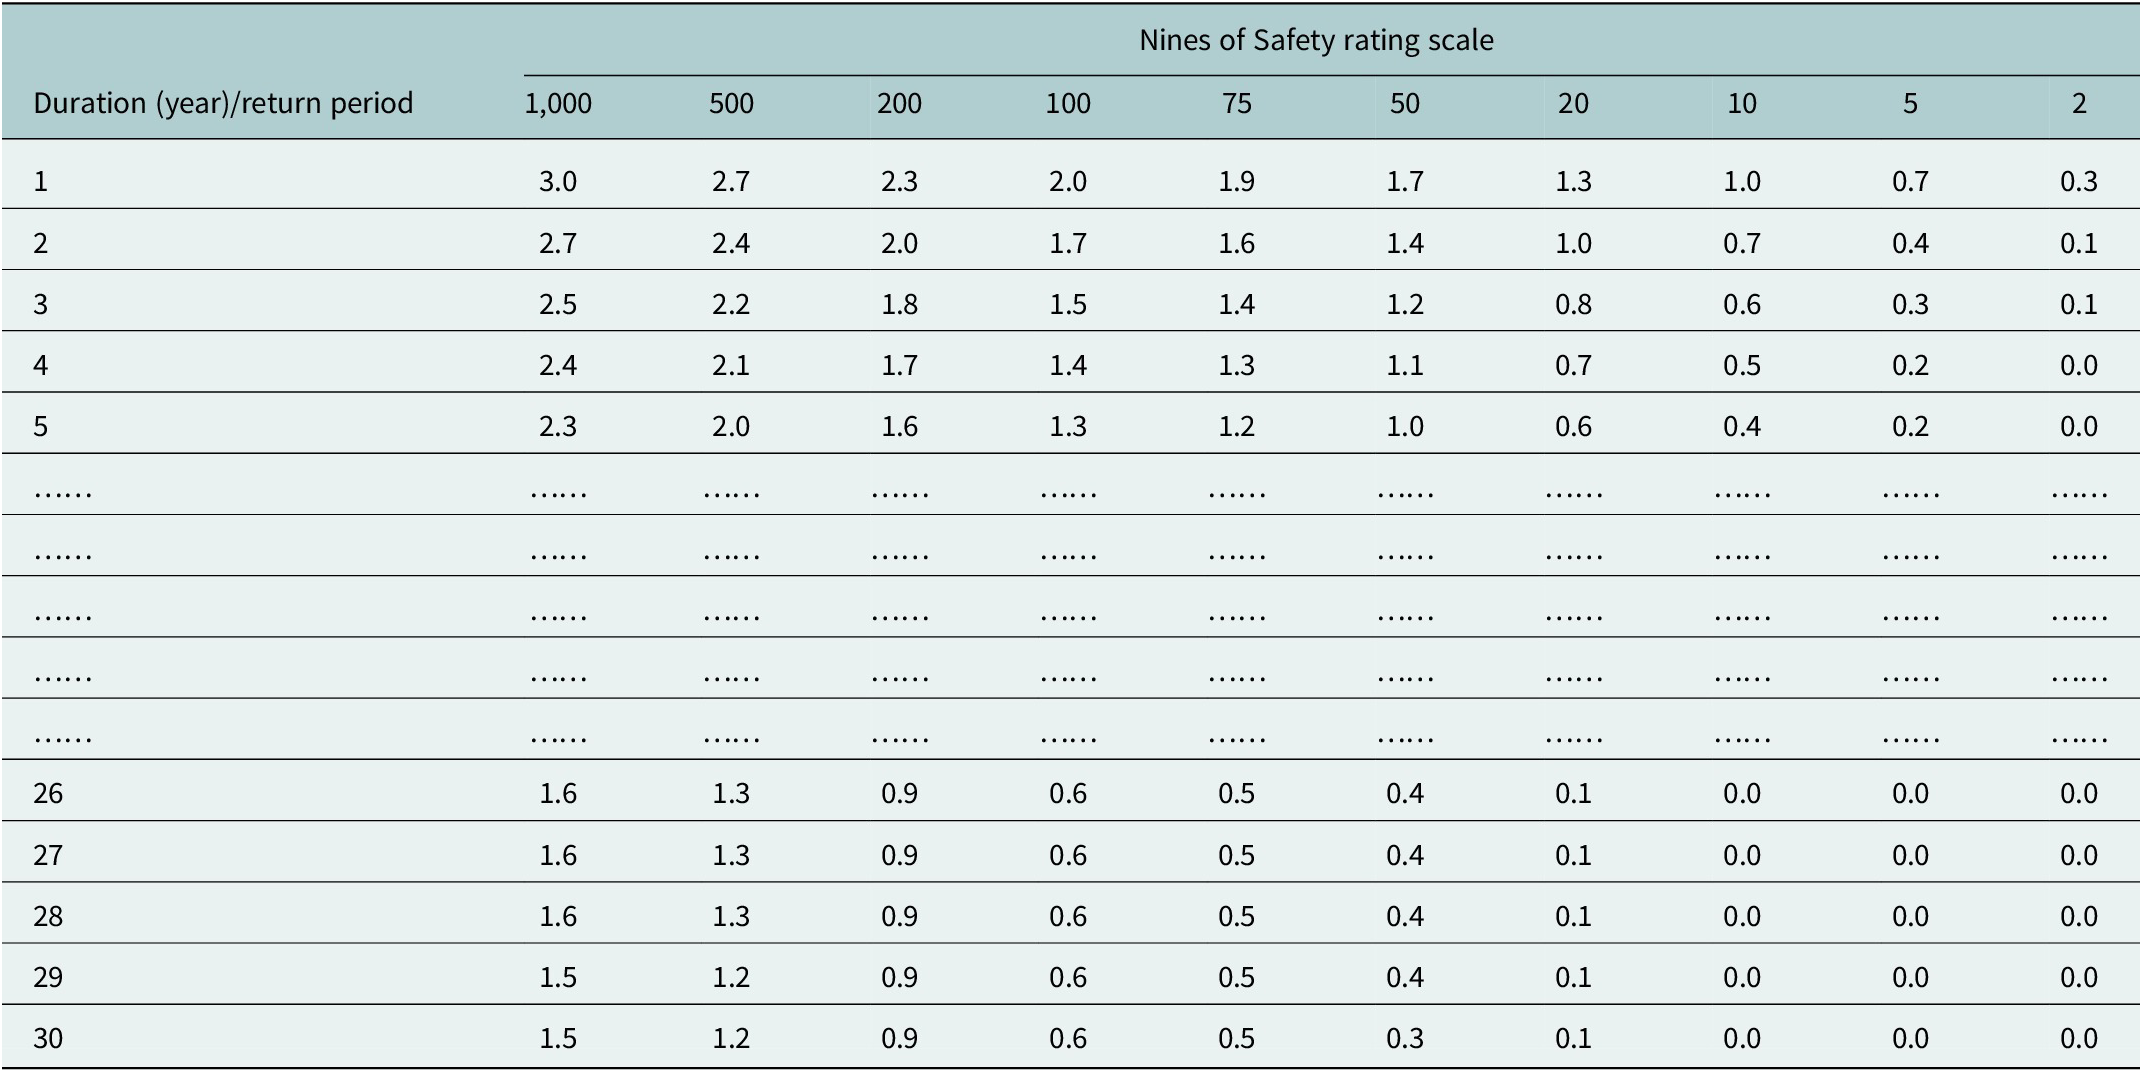
NoS and time duration
As discussed in the methodology section, the NoS largely depends on the time scale. When a person is exposed to a specific risk for a long time, the overall NoS affected by the risk increases over time. People living in precarious conditions become increasingly vulnerable day by day. So, the broad NoS scale would be like Table 7 over a specific period. Here, we have considered 30 years, as mortgages are typically 30-year terms. We can see from the table that NoS drops from 3 to 1.5 in a 1,000-year flood zone area over a 30-year mortgage term. On the other hand, it becomes zero (0) in 4 years for the 2-year return period flood zone, indicating that the probability of experiencing at least one flood during that time approaches certainty. While this reflects a very low NoS (safety) value due to high frequency, it does not necessarily imply that the area is physically unsafe, since the intensity of a 2-year flood event is typically low.
The temporal variation of NoS is shown in Table 9 is estimated under stationary conditions, meaning that hazard probabilities, exposure levels and vulnerability factors are assumed to be constant over the period considered. This assumption simplifies interpretation but may not hold in dynamic environments affected by climate change, land-use alteration or social adaptation.
NoS rating with time scale

Table 9 also shows the probability-based safety scale and does not capture the physical intensity or severity of the flood event. Lower NoS values for frequent (low return period) floods reflect high occurrence likelihood rather than high hazard intensity.
Physical parameters and NoS rating
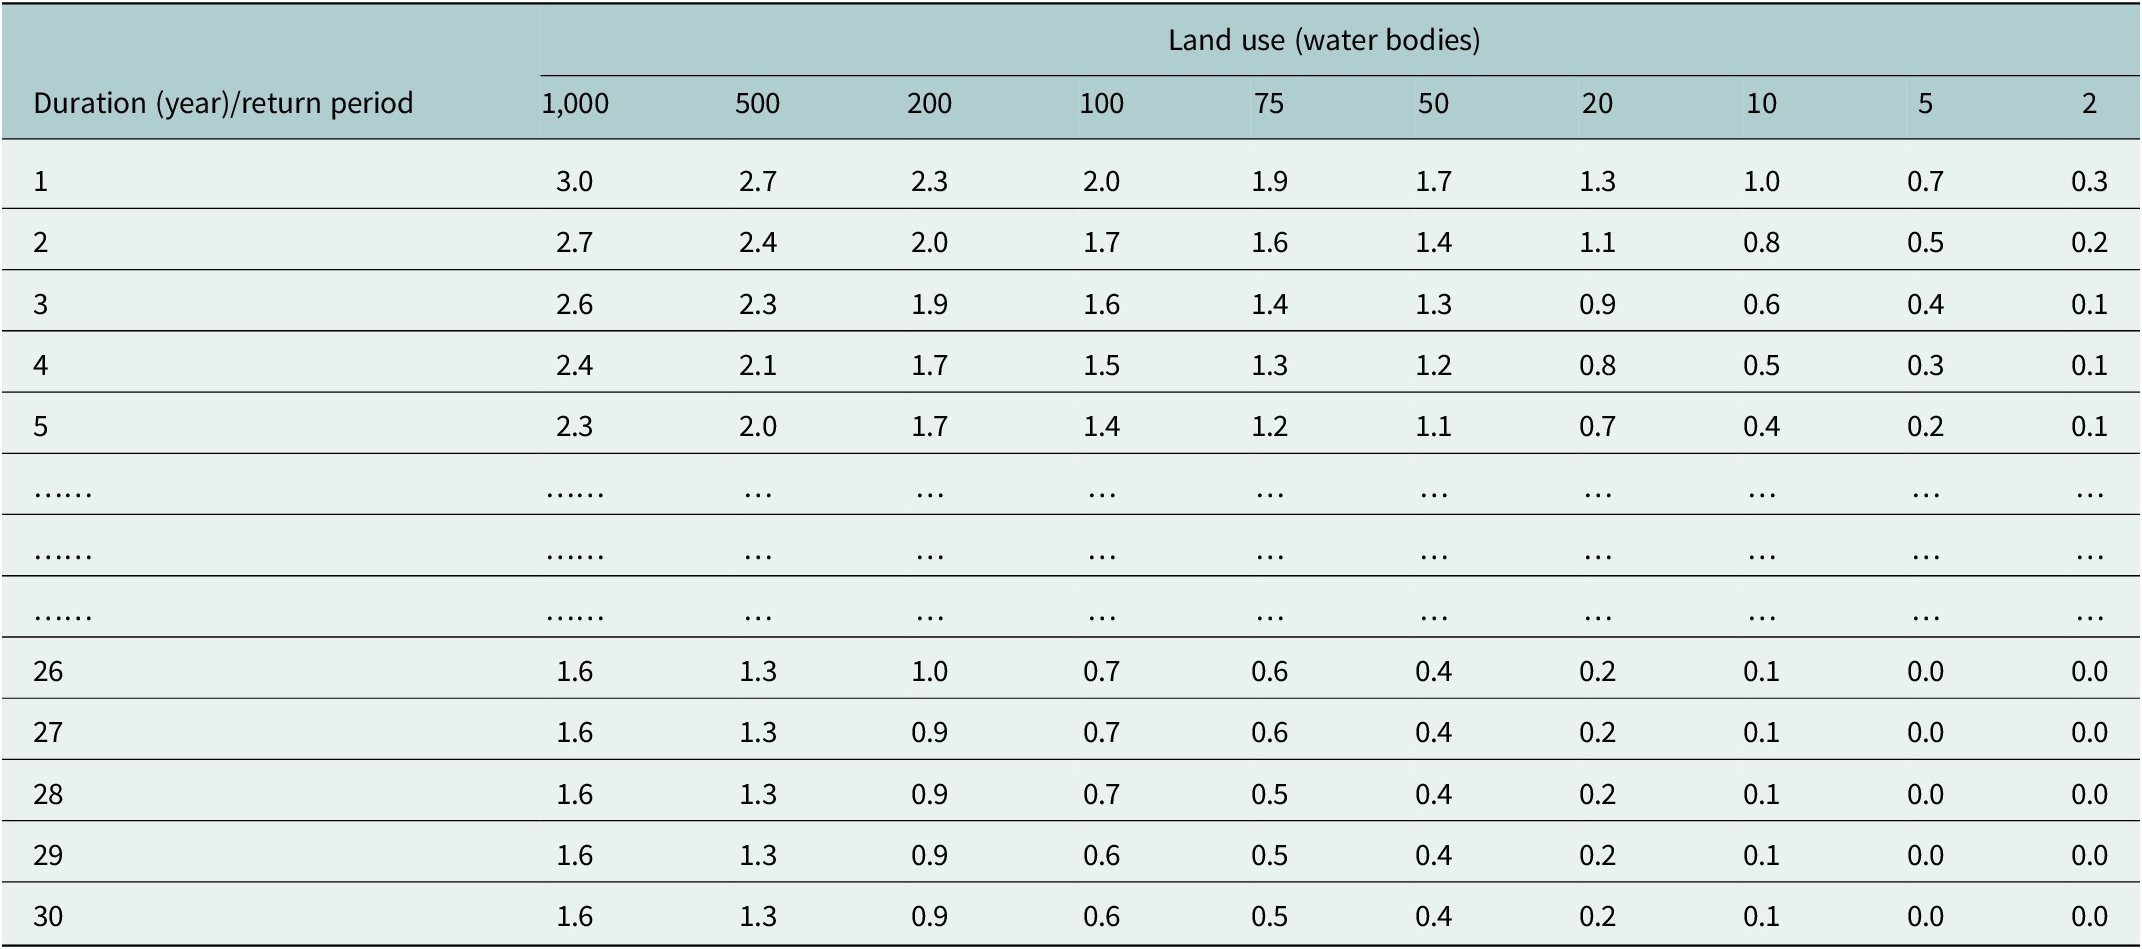
Land use (water bodies)
Geophysical parameters strongly correlate with flood risk and substantially affect the overall safety assessment of a location. Our investigation focused on the influence of land use on water bodies with the highest flood risk (Cikmaz et al., Reference Cikmaz, Yildirim and Demir2023). The presence of bodies of water plays a crucial role, with areas near them generally associated with heightened safety concerns. The NoS rating, the foundation of our evaluation, depends on classifying a location’s water body characteristics. According to Cikmaz et al. (Reference Cikmaz, Yildirim and Demir2023), their research demonstrates the direct relationship between water body classification and flood risk. For instance, locations near bodies of water in the lowest category pose the most significant inundation risk (~ $ 90\%\Big) $
. In contrast, those near bodies of water with higher classification are associated with progressively higher safety levels on the NoS scale. By classifying water body characteristics into distinct categories, our study provides a nuanced understanding of flood vulnerability, making it a valuable resource for precise risk assessment and strategic flood risk management planning.
$ 90\%\Big) $
. In contrast, those near bodies of water with higher classification are associated with progressively higher safety levels on the NoS scale. By classifying water body characteristics into distinct categories, our study provides a nuanced understanding of flood vulnerability, making it a valuable resource for precise risk assessment and strategic flood risk management planning.
According to our previous discussion, adding the time duration dramatically influences the overall safety rating. Table 10 presents the NoS Rating Scale for land use, with emphasis on waterbodies. This scale quantifies flood safety based on event duration (years) or return period. NoS values range from 0.0 (lowest safety level) to 3.0 (highest safety level). In the first row (Duration = 1 year), NoS values for return periods 1,000, 500, 200 and so forth are analyzed to determine safety. NoS 3.0 indicates strong safety, whereas NoS 0.0 indicates flooding vulnerability. It also shows that safety values decline with increasing duration or return period, underscoring reduced protection against flooding.
NoS rating for land use (waterbody) at different flood zones

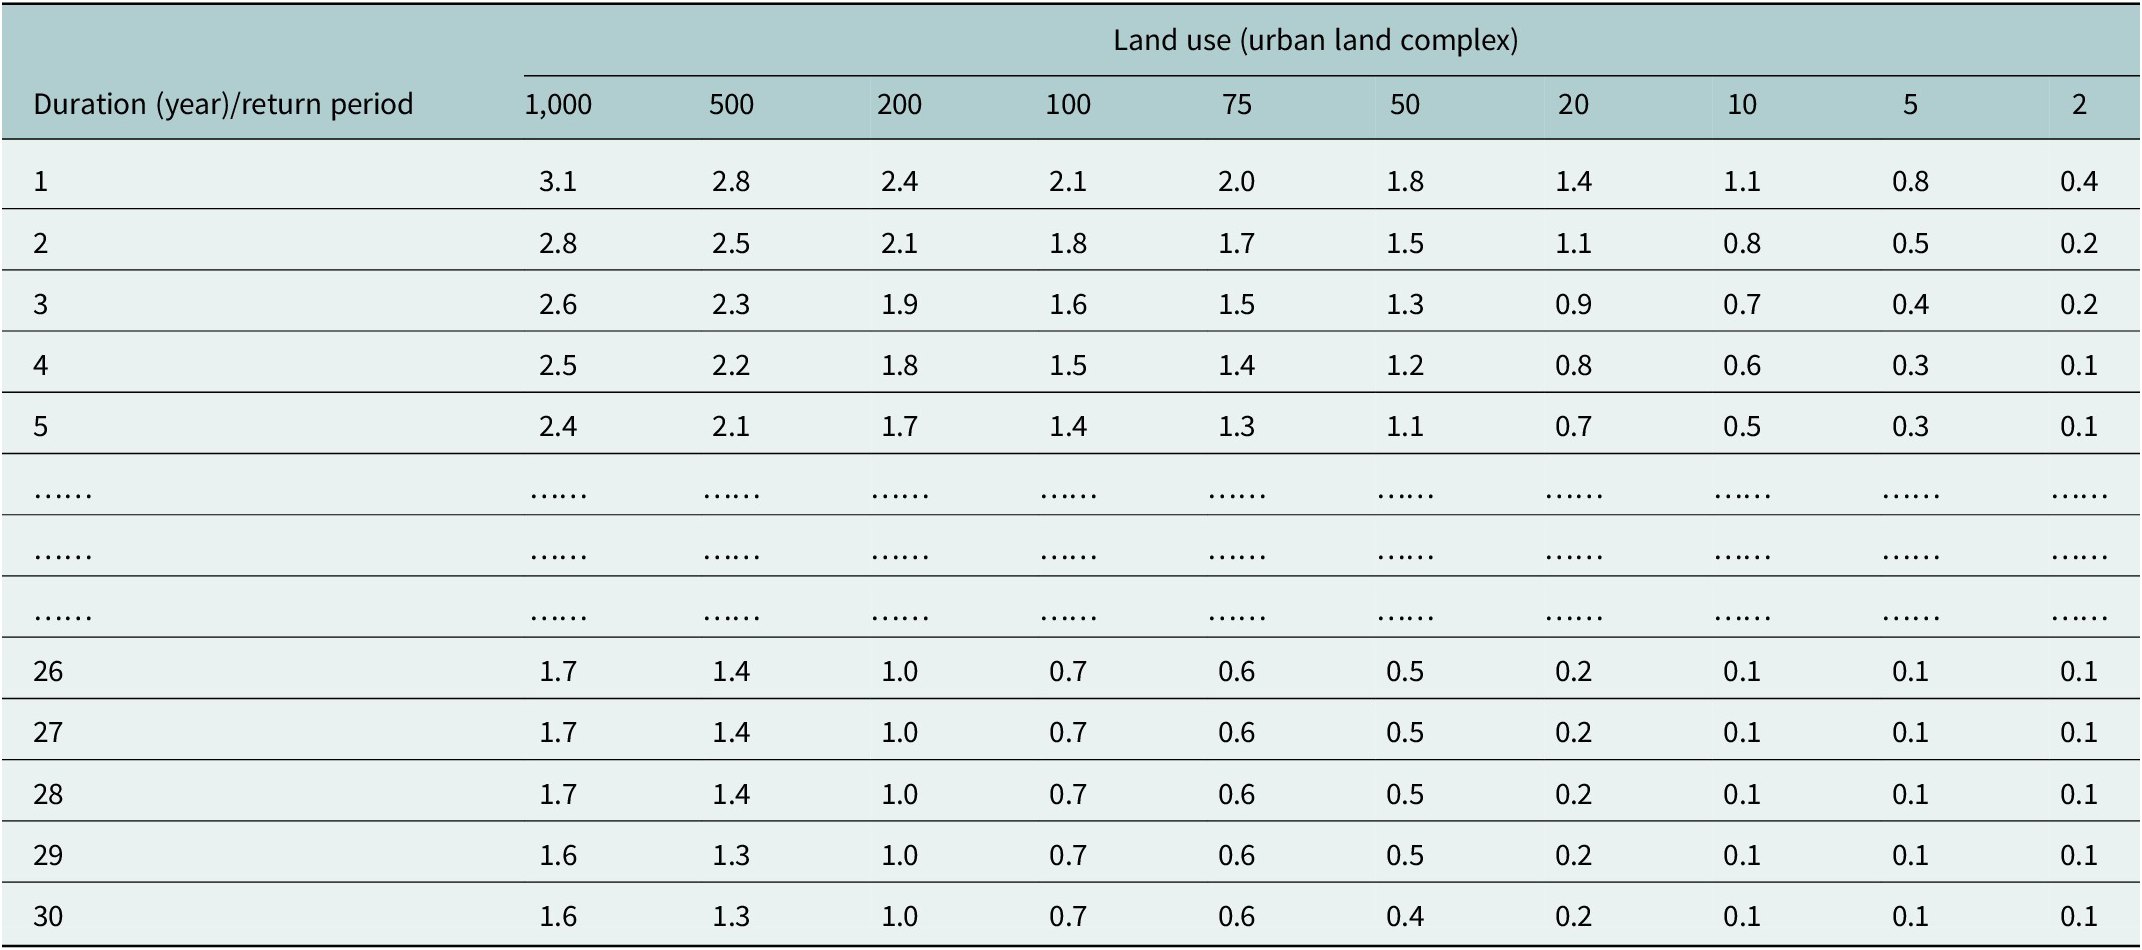
Land use (urban land complex)
For urban land complexes, the overall risk of water bodies is around 80% (Cikmaz et al., Reference Cikmaz, Yildirim and Demir2023). The flood risk is significantly influenced by agricultural cropland and vegetation (Yildirim and Demir, Reference Yildirim and Demir2022), accounting for nearly 75% of the overall contribution. This highlights the tremendous impact these factors have on susceptibility. In contrast, our assessment reveals that open spaces, forests and wetlands are the least vulnerable to flooding. When these diverse land cover categories are integrated, the resulting safety rating on the NoS scale indicates the level of safety. This comprehensive approach clearly depicts flood risk and emphasizes the crucial role of land cover types in accurate risk assessment and effective management measures. Considering the urban land complex, the overall NoS is as follows (Table 11).
NoS rating for urban land complex type land use type at different flood zones

NoS rating for varying elevations
If we add the elevation value to the NoS method and time duration to stay at that place, the overall NoS rating would be the following (Table 12):
NoS rating at different elevation levels

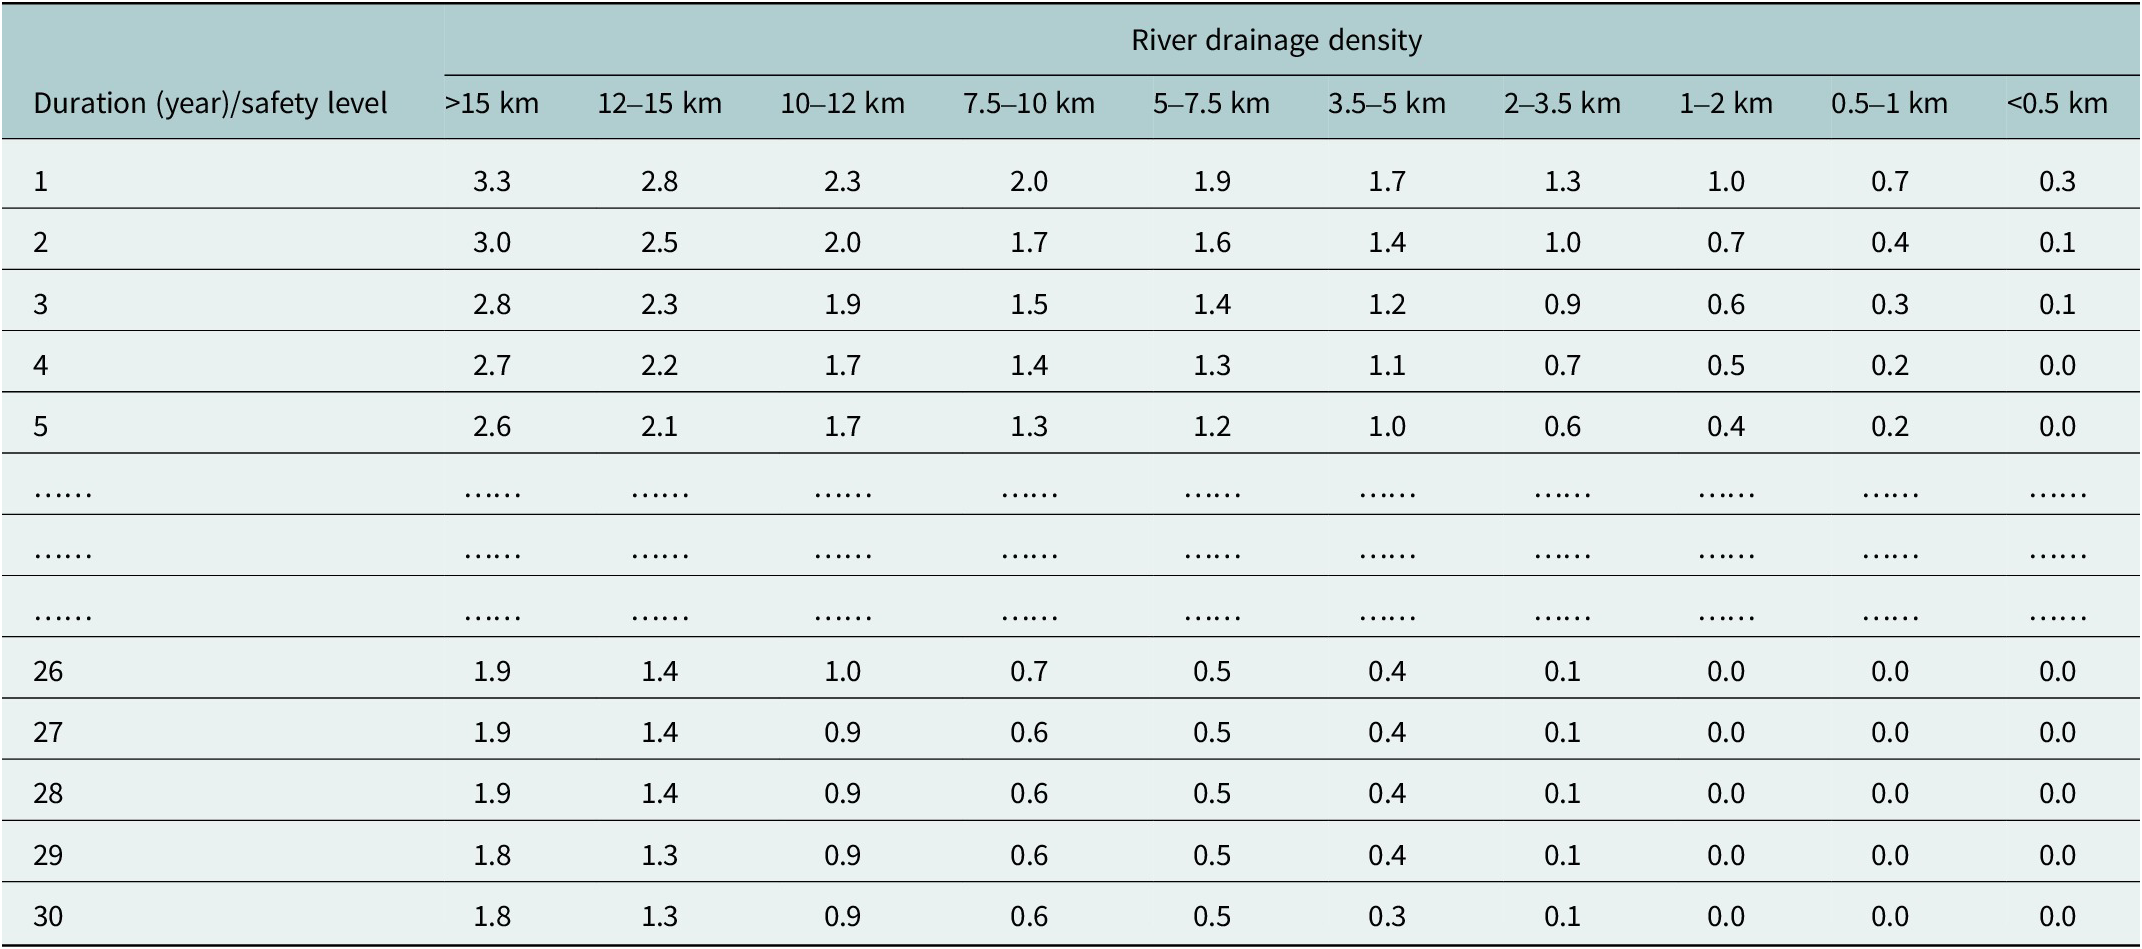
NoS rating for varying river drainage density
We have considered the Euclidean distance in kilometers for river drainage density. The classification is based on the natural break classification method. There is a linear relationship between flood risk and river drainage density. The greater the distance, the safer it is, or the higher the NoS rating is for that distance. River drainage density and slope pose a similar flood risk, like elevation. So, the overall safety in the nines of the safety scale will be the following (Table 13).
NoS rating at different drainage density values

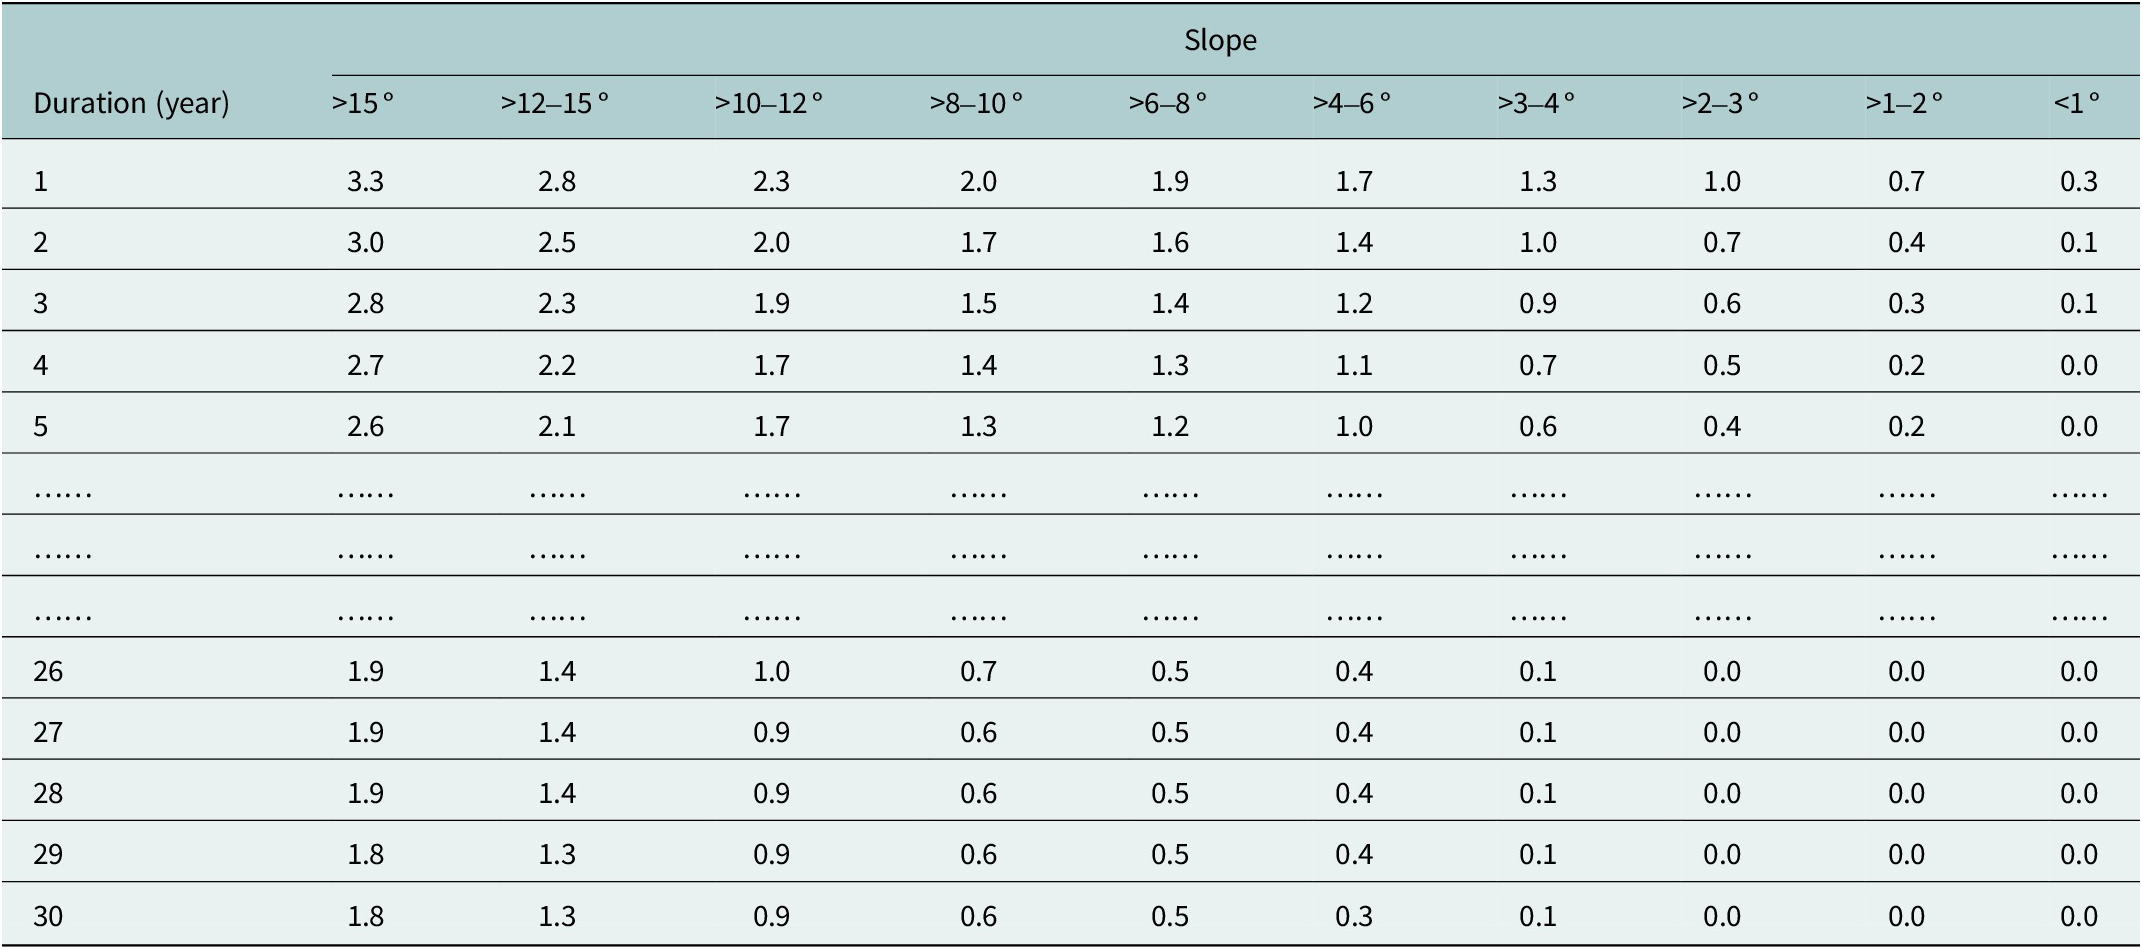
NoS rating for varying slope values
Steep inclinations are commonly associated with reduced flood vulnerability because they expedite downhill water movement, impeding accumulation and reducing the likelihood of flooding. This attribute facilitates adequate drainage and is considered a mitigating element against floods. Like river drainage density, slope (in degrees) also has a similar risk to flood risk. The higher the slope value, the lower the NoS rating, similar to drainage density (Table 14) (Figure 2).
NoS rating for different slope (degree) values

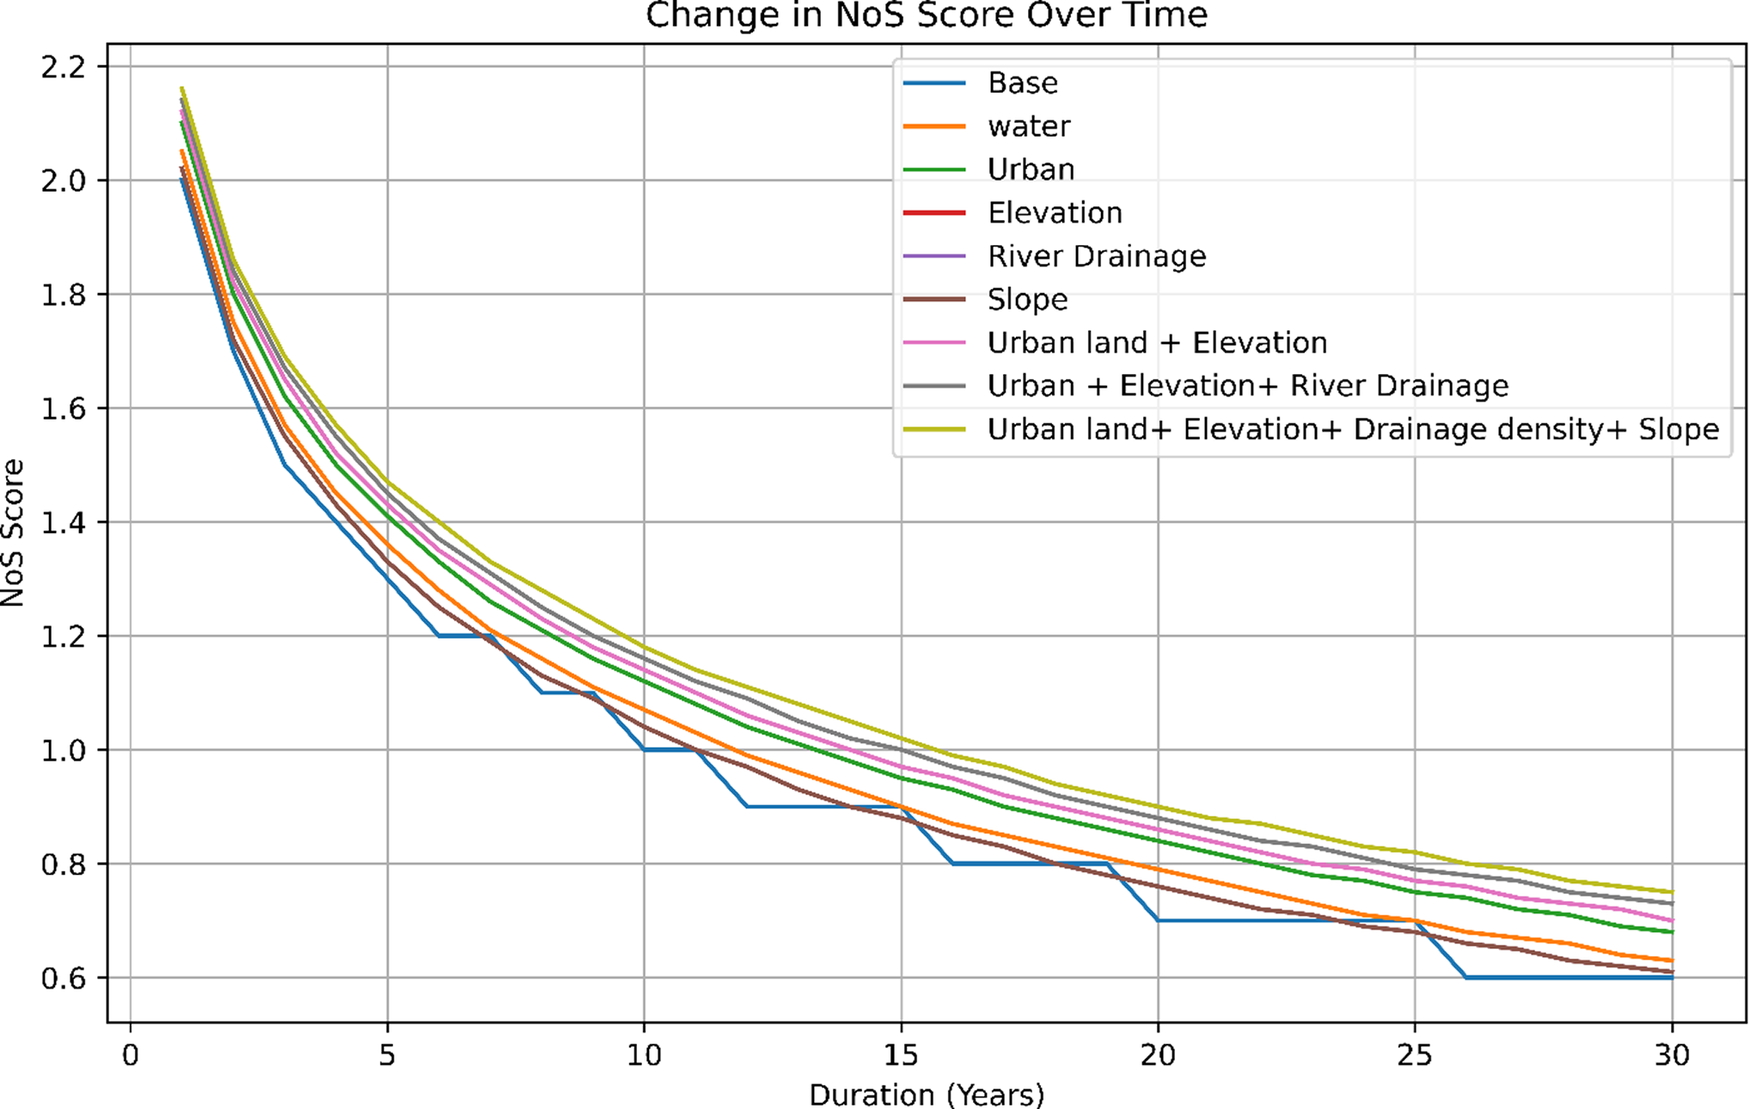
Combining many individual precautions leads to the accumulation of effects, enabling an elevated safety. This principle remains applicable to the numerous risk variables discussed in this study. For example, implementing precaution A increases the safety level to 0.7 NoS against a particular risk. Precaution B adds 0.7 NoS, while precaution C provides an extra 1.0 NoS. Assuming these precautions are independent, the combined implementation of all three measures results in a cumulative safety gain of 2.4 NoS rating relative to the risk indicated by the indicators (Figure 1).
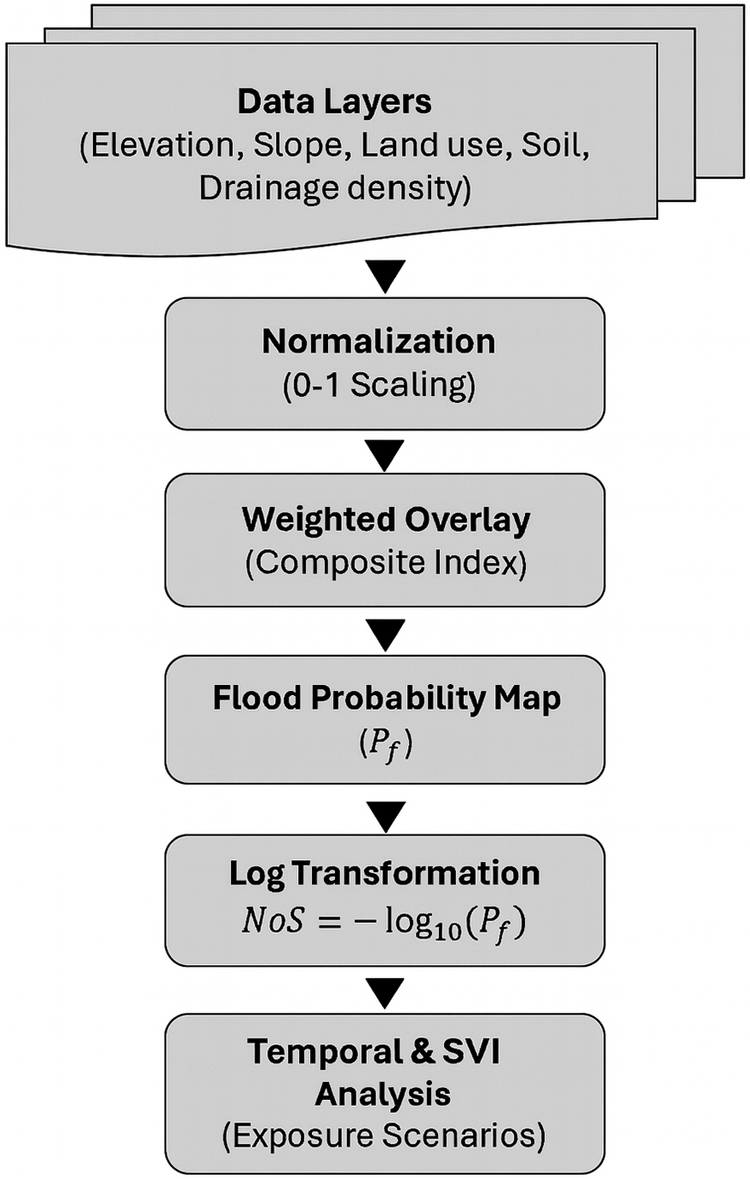
Operational workflow of the Nines of Safety (NoS) framework. The diagram illustrates the sequential transformation from geophysical indicators (elevation, slope, soil, drainage and land use) into a composite flood probability map (P₍f₎), followed by the logarithmic NoS scaling and temporal/SVI integration. This workflow operationalizes the NoS framework for spatial and temporal flood safety assessment.

NoS level with different physical parameters.

When assessing the effectiveness of a risk mitigation strategy in a research environment, the crucial question is the extent to which it enhances safety, rather than its absolute success or failure. Specifically, the focus is on determining the incremental improvement in safety the method provides, measured in terms of additional nines. Suppose an activity carries k NoS against a particular risk, and an action multiplies the chance of failure by some relative risk R. Then, the action removes $ {\mathit{\log}}_{10}R $
NoS (if R > 1) or odds −
$ {\mathit{\log}}_{10}R $
NoS (if R > 1) or odds − $ {\mathit{\log}}_{10}R $
NoS (if R < 1). The additional action adjusts the probability of failure from 10−k
to R × 10−k
=
$ {\mathit{\log}}_{10}R $
NoS (if R < 1). The additional action adjusts the probability of failure from 10−k
to R × 10−k
= $ {10}^{-\left(k-{\mathit{\log}}_{10}R\right)} $
.
$ {10}^{-\left(k-{\mathit{\log}}_{10}R\right)} $
.
Socioeconomic parameters in NoS scale
An area with a population of 1,000 should maintain at 3.2 NoS. If 100 people are added to that area in a year, safety will be reduced by 2. So, the overall safety scale (Table 15) would be:
NoS rating for adding 100 people

The negative values represent the opposite of safety. The lower the negative values, the higher the flood risk. Overall, the areas with the largest population are more susceptible to flood risk than smaller populated areas. Other socioeconomic factors work similarly. If the inclusion of any indicator is associated with 80% effectiveness, there will be an addition of 0.7 to the safety in the nines of the safety scale. Including vulnerable populations, such as individuals under the age of 5 years, women and those over the age of 65 years, in a specific location greatly increases their vulnerability to flood-related risks compared to other demographic groups. As a result, this increases the likelihood of flood danger overall, reducing safety assurance. Like the effect of the growing population on the NoS, incorporating this indicator also reduces the scale to two decimal places.
Building upon the preceding discourse, in which the introduction of 100 individuals to a specific region resulted in a proportional decrease in safety by a factor of 2 nines, it is crucial to acknowledge that the demographic makeup of this population plays an essential role in defining the level of safety (NoS) for such a location. For example, if 25% of the population is classified as belonging to the vulnerable group, it may be inferred that the remaining 75% face comparatively lower levels of exposure to the hazards associated with that group. As a result, 25% of the population identified as vulnerable is responsible for a decrease in safety of 0.12 nines. This reduction is in addition to the original decrement of 2 nines, resulting in a cumulative Safety of 3.12 for the entire population of 100 individuals. Other socioeconomic factors, such as income, race and ethnicity, education, prior experience, government policies, and so forth, will work similarly and add to or reduce NoS based on their association with flood risk.
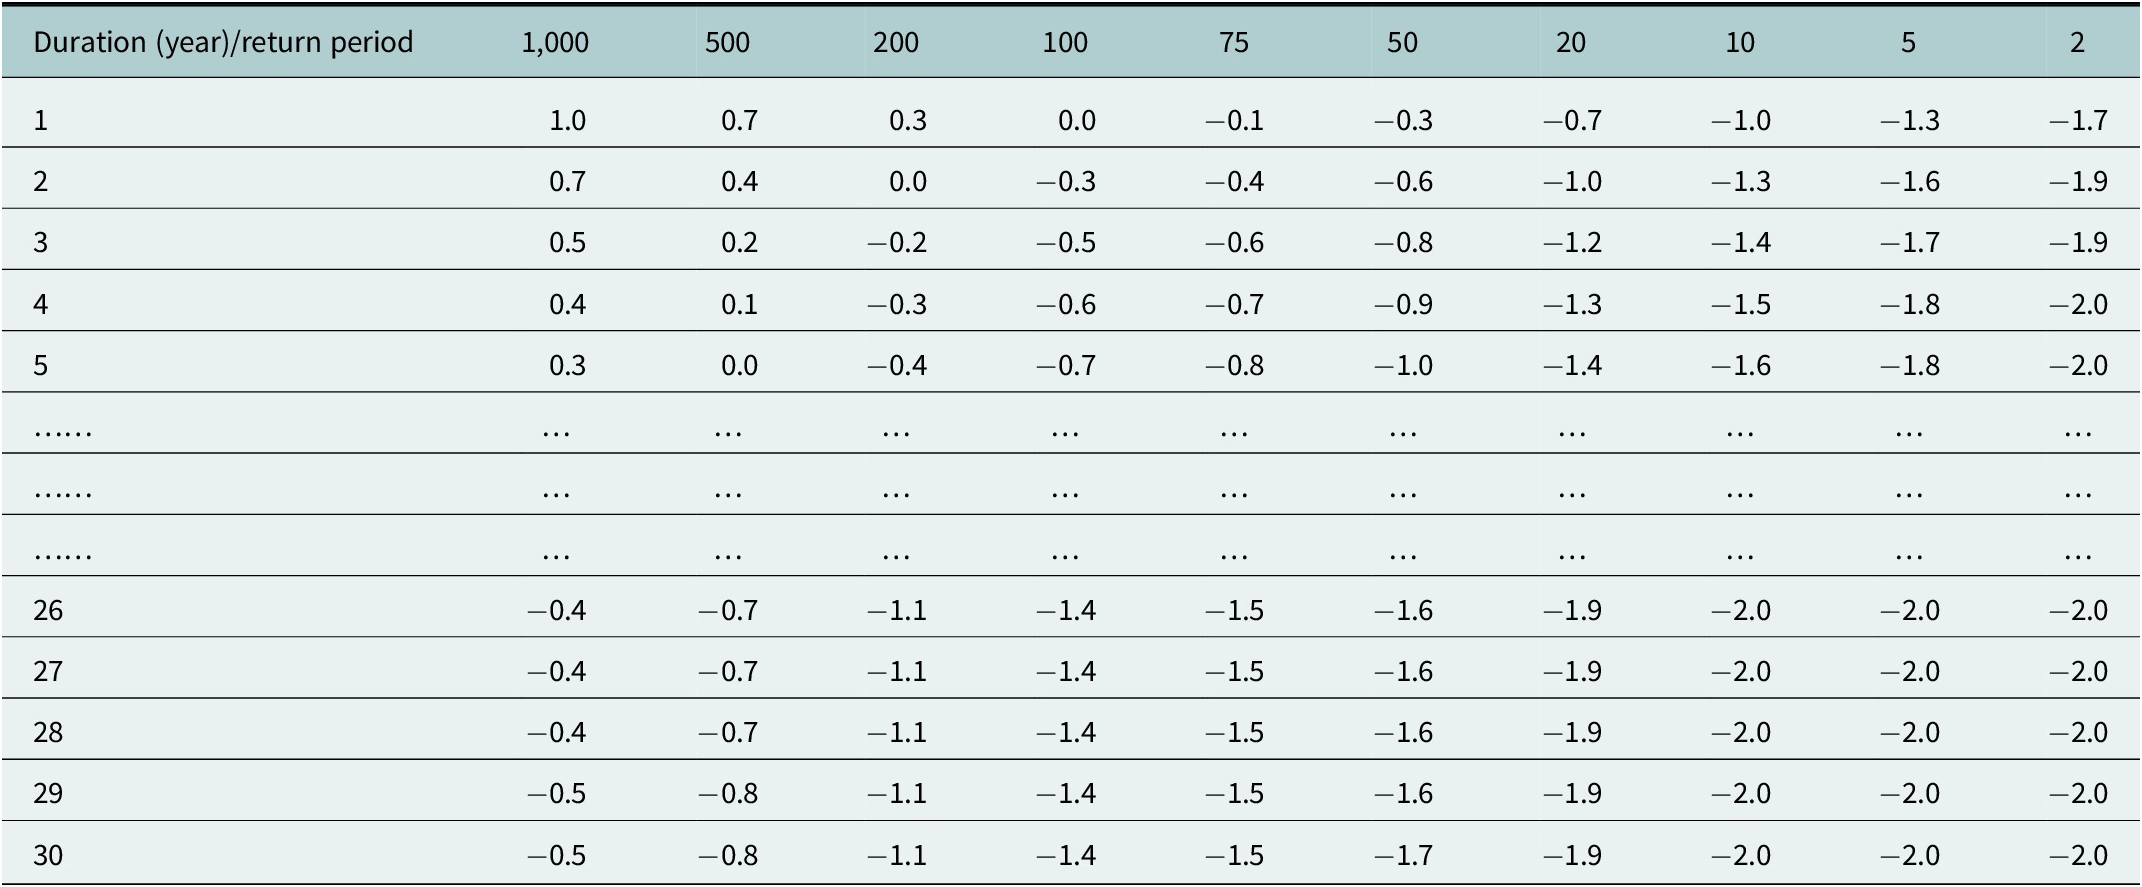
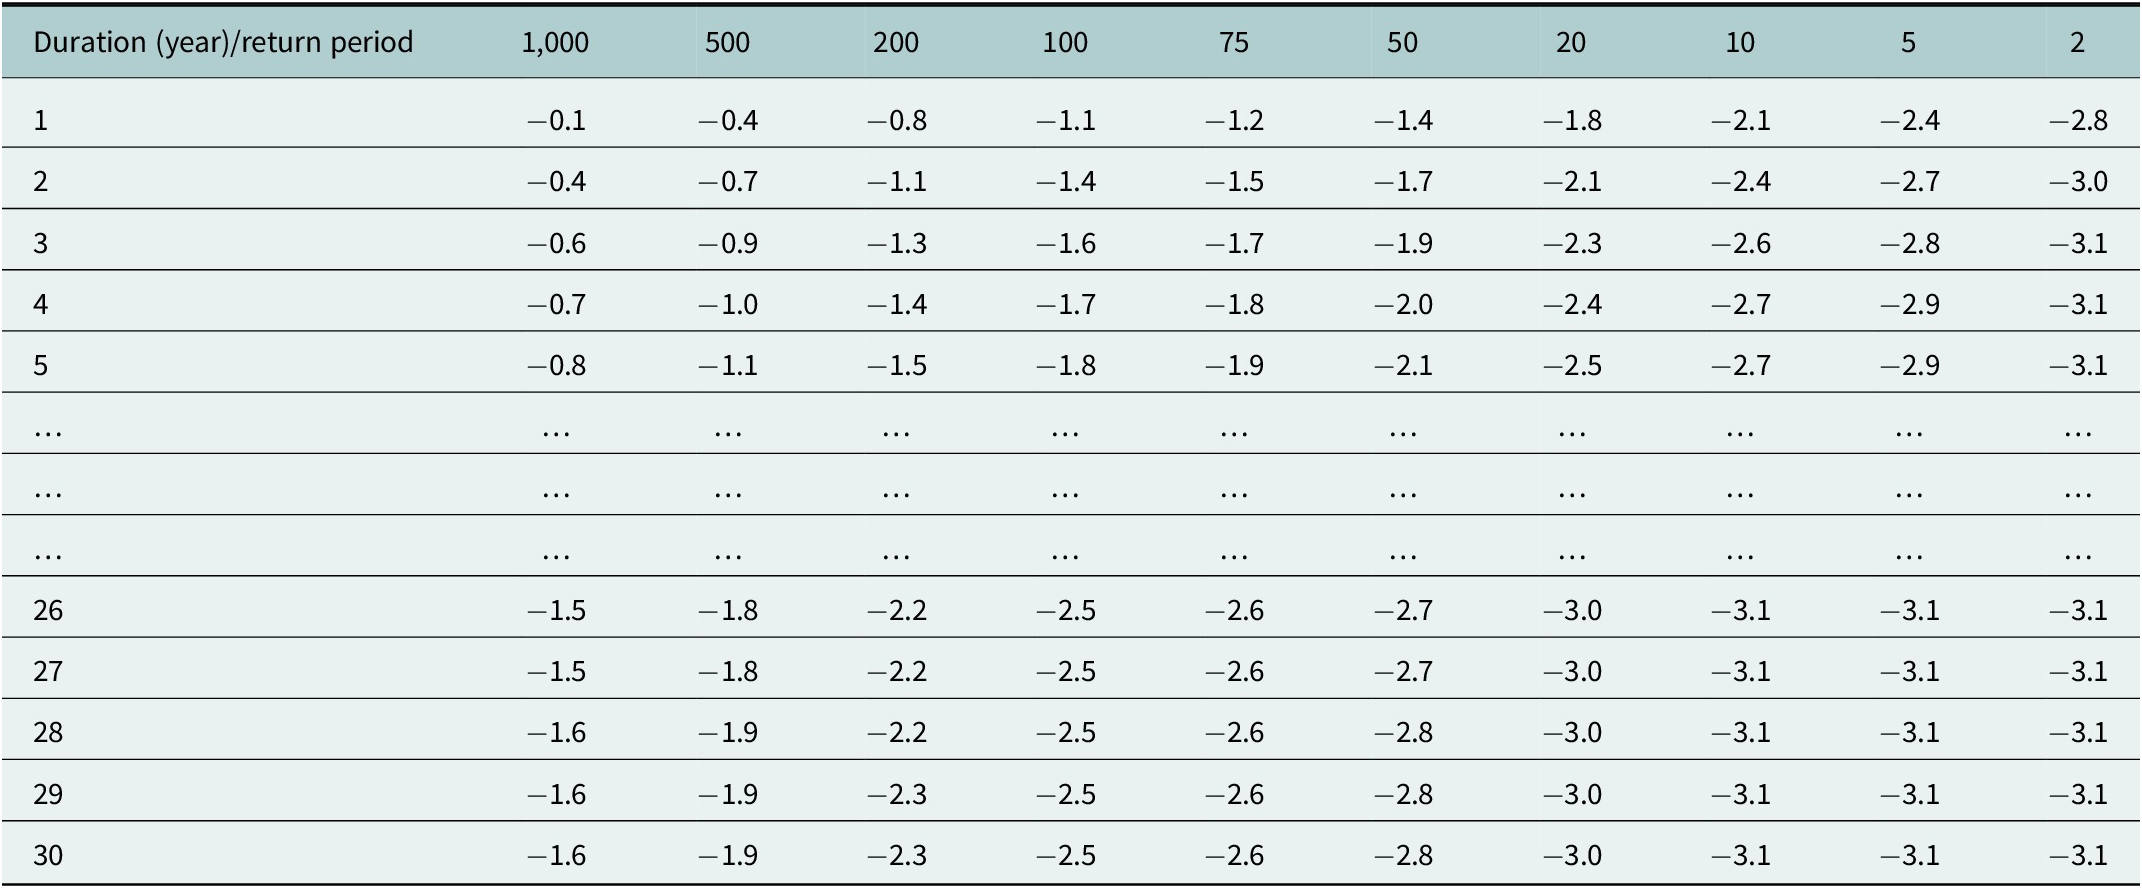
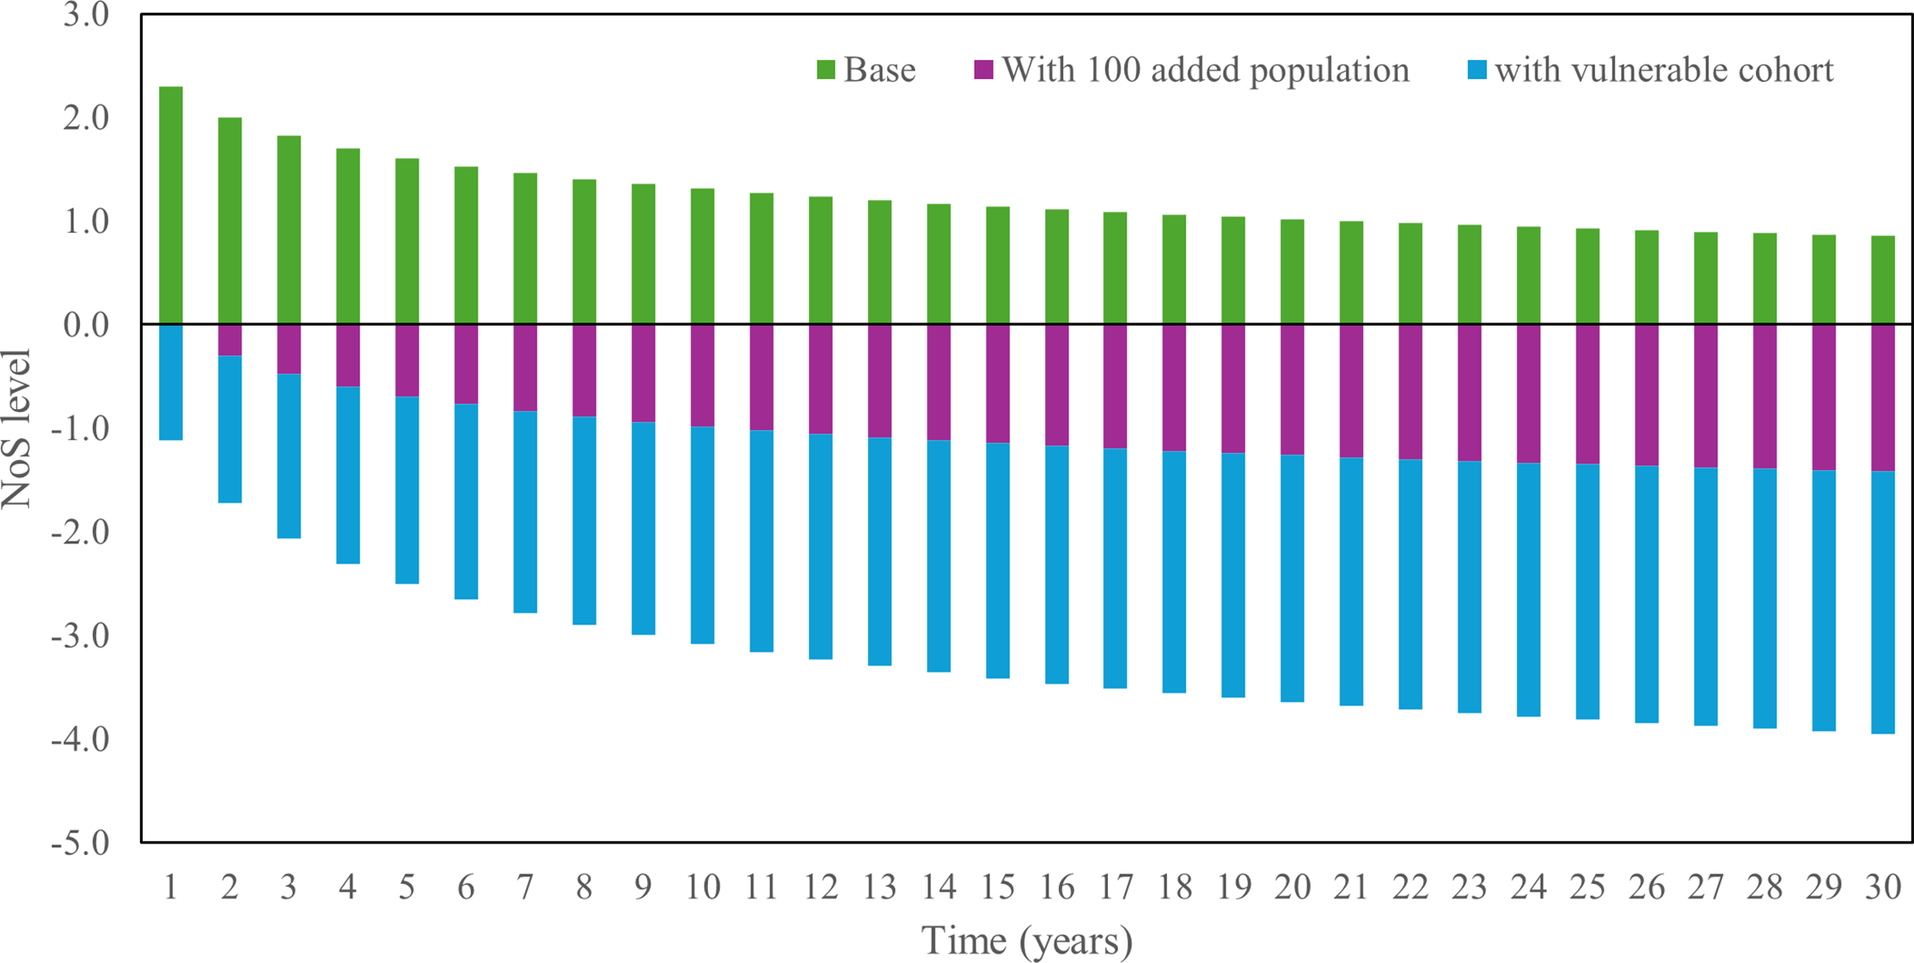
Table 16 shows a continuous trend in which a rise in duration is accompanied by a steady decline in the number of safety occurrences (NoS), suggesting a decline in safety levels. The extent of this decrease is particularly evident when examining the whole population and the more susceptible group, indicating a heightened vulnerability to flood hazards in the presence of certain demographic factors. The NoS values offer significant insights into the impact of population dynamics, particularly the incorporation of vulnerable populations, on the long-term safety assessment in flood-prone regions (Figure 3). Comprehending these patterns is crucial for policymakers and emergency planners to formulate precise flood risk mitigation and communication plans that account for evolving population dynamics and their impact on community resilience.
NoS rating for adding 100 people and a vulnerable group (25% are women, children under 5 years and aged above 65 years)

NoS level at the 100-year flood zone for two added socioeconomic variables.

Validation against the Social Vulnerability Index (SVI)
To assess the external validity of the NoS framework, we compared the NoS values derived for Iowa City against a simulated Social Vulnerability Index (SVI) profile. While the NoS approach is novel and grounded in geophysical and socioeconomic indicators, it is essential to demonstrate alignment with established vulnerability metrics used in disaster risk assessment, such as the SVI developed by the Centers for Disease Control and Prevention (CDC).
Since high-resolution SVI data for Iowa City at the neighborhood level are not publicly available in a directly usable format, we simulated SVI trends using known correlations between socioeconomic indicators (e.g., income, age, disability status, minority population and housing structure) and vulnerability scores derived from the national-level SVI methodology. This simulation mirrors typical vulnerability profiles of Midwest cities, particularly those with mixed urban-suburban compositions and historic flood exposure.
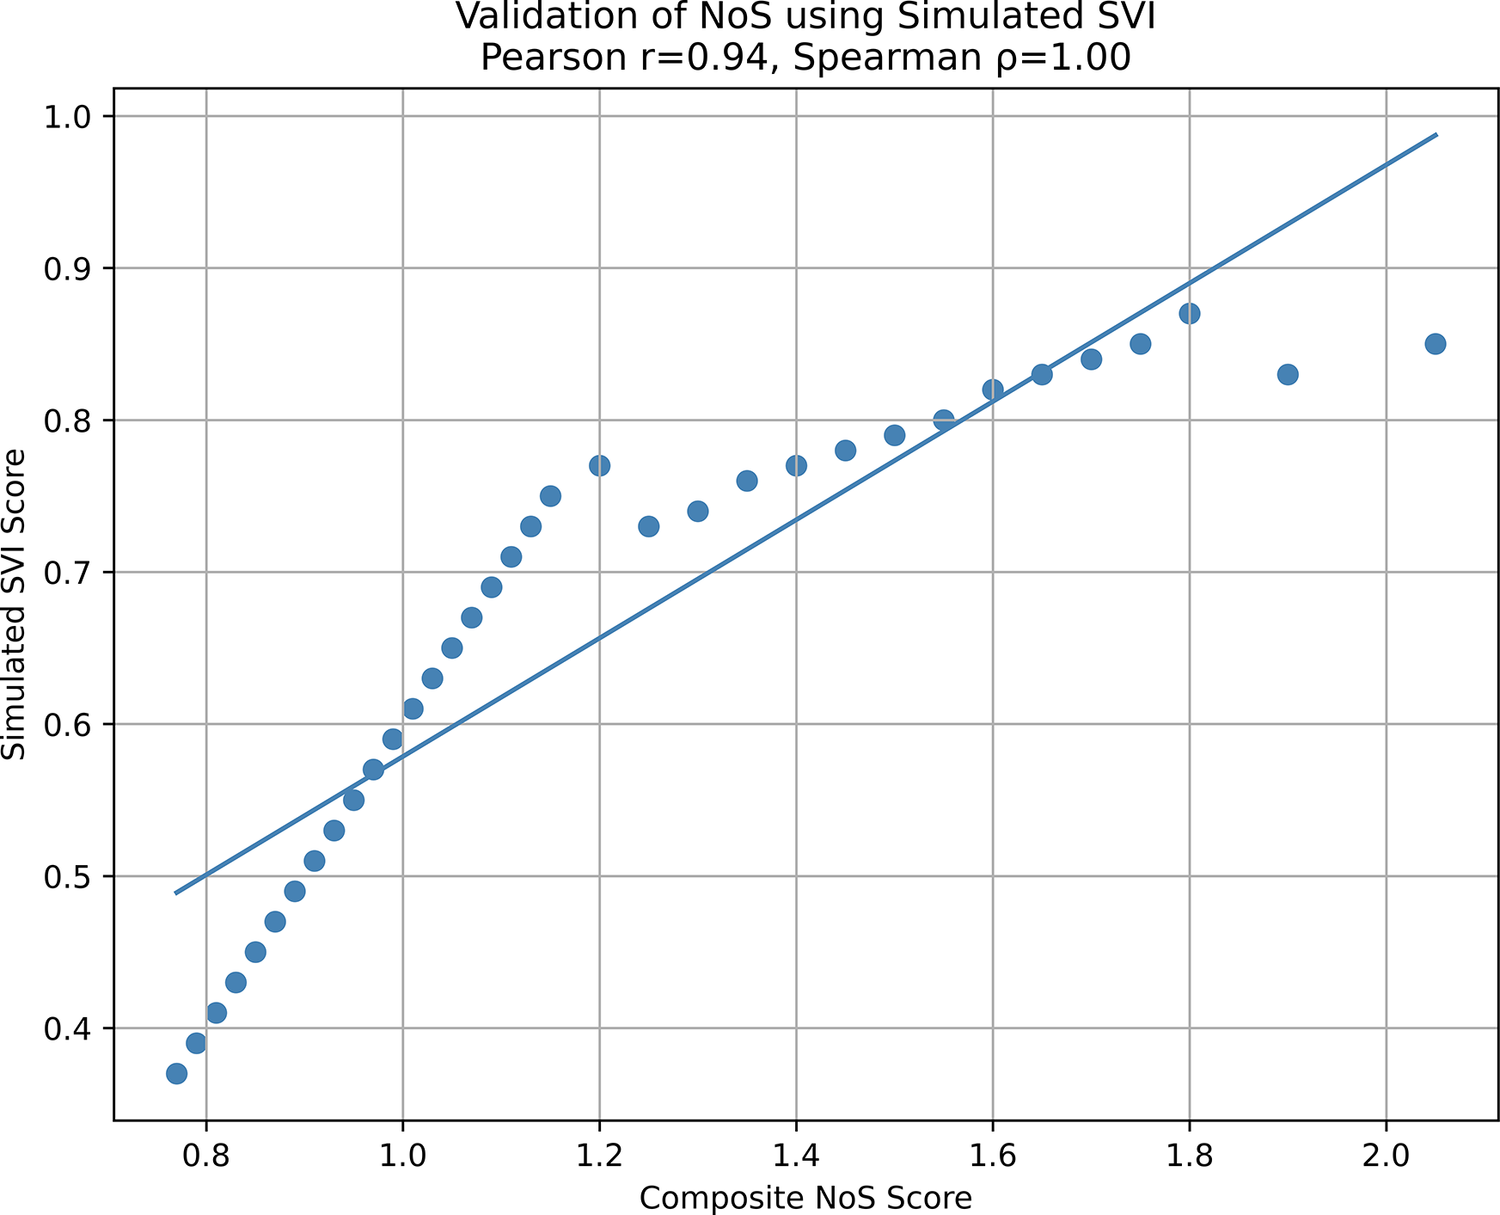
Figure 4 displays a scatter plot comparing the average NoS values (across 30 durations) against the simulated SVI for corresponding urban regions. A linear regression overlay reveals a strong negative correlation (R 2 = 0.93), indicating that areas with higher social vulnerability are associated with lower NoS scores. This relationship is consistent with the underlying logic of both frameworks: regions with lower capacity to prepare for, respond to or recover from floods are reflected as less “safe” in NoS terms and more “vulnerable” in SVI terms.
The scatter plot shows the relationship between simulated Nines of Safety (NoS) scores and simulated Social Vulnerability Index (SVI) values across selected Iowa City neighborhoods. The negative trend confirms that higher social vulnerability is associated with lower safety ratings.

This validation suggests that the NoS framework not only provides an intuitive metric for flood risk communication but also aligns closely with existing vulnerability assessment standards. Unlike SVI, which relies heavily on demographic and census data, NoS allows dynamic integration of geospatial factors, enabling more localized and event-specific assessment. However, future work should aim to apply NoS in other geographies and compare it with observed flood damage outcomes or insurance claim records to enhance empirical robustness.
The strong inverse correlation between NoS and the SVI confirms that communities with greater social fragility tend to exhibit lower safety levels on the NoS scale. While this relationship is conceptually consistent and expected, as higher vulnerability aligns with lower nonoccurrence probabilities, it reinforces the logical coherence of the NoS framework rather than serving as independent empirical validation. Future studies may extend this validation by integrating multihazard vulnerability indicators and comparing NoS patterns with observed damage or recovery metrics. While the correlation between NoS and SVI (r = −0.52) indicates a meaningful inverse relationship, its moderate strength reflects the multifactorial nature of urban vulnerability. The validation was intentionally limited to a single city to illustrate the framework’s feasibility rather than regional generalization. Future applications across diverse urban and hydrologic settings could further confirm transferability.
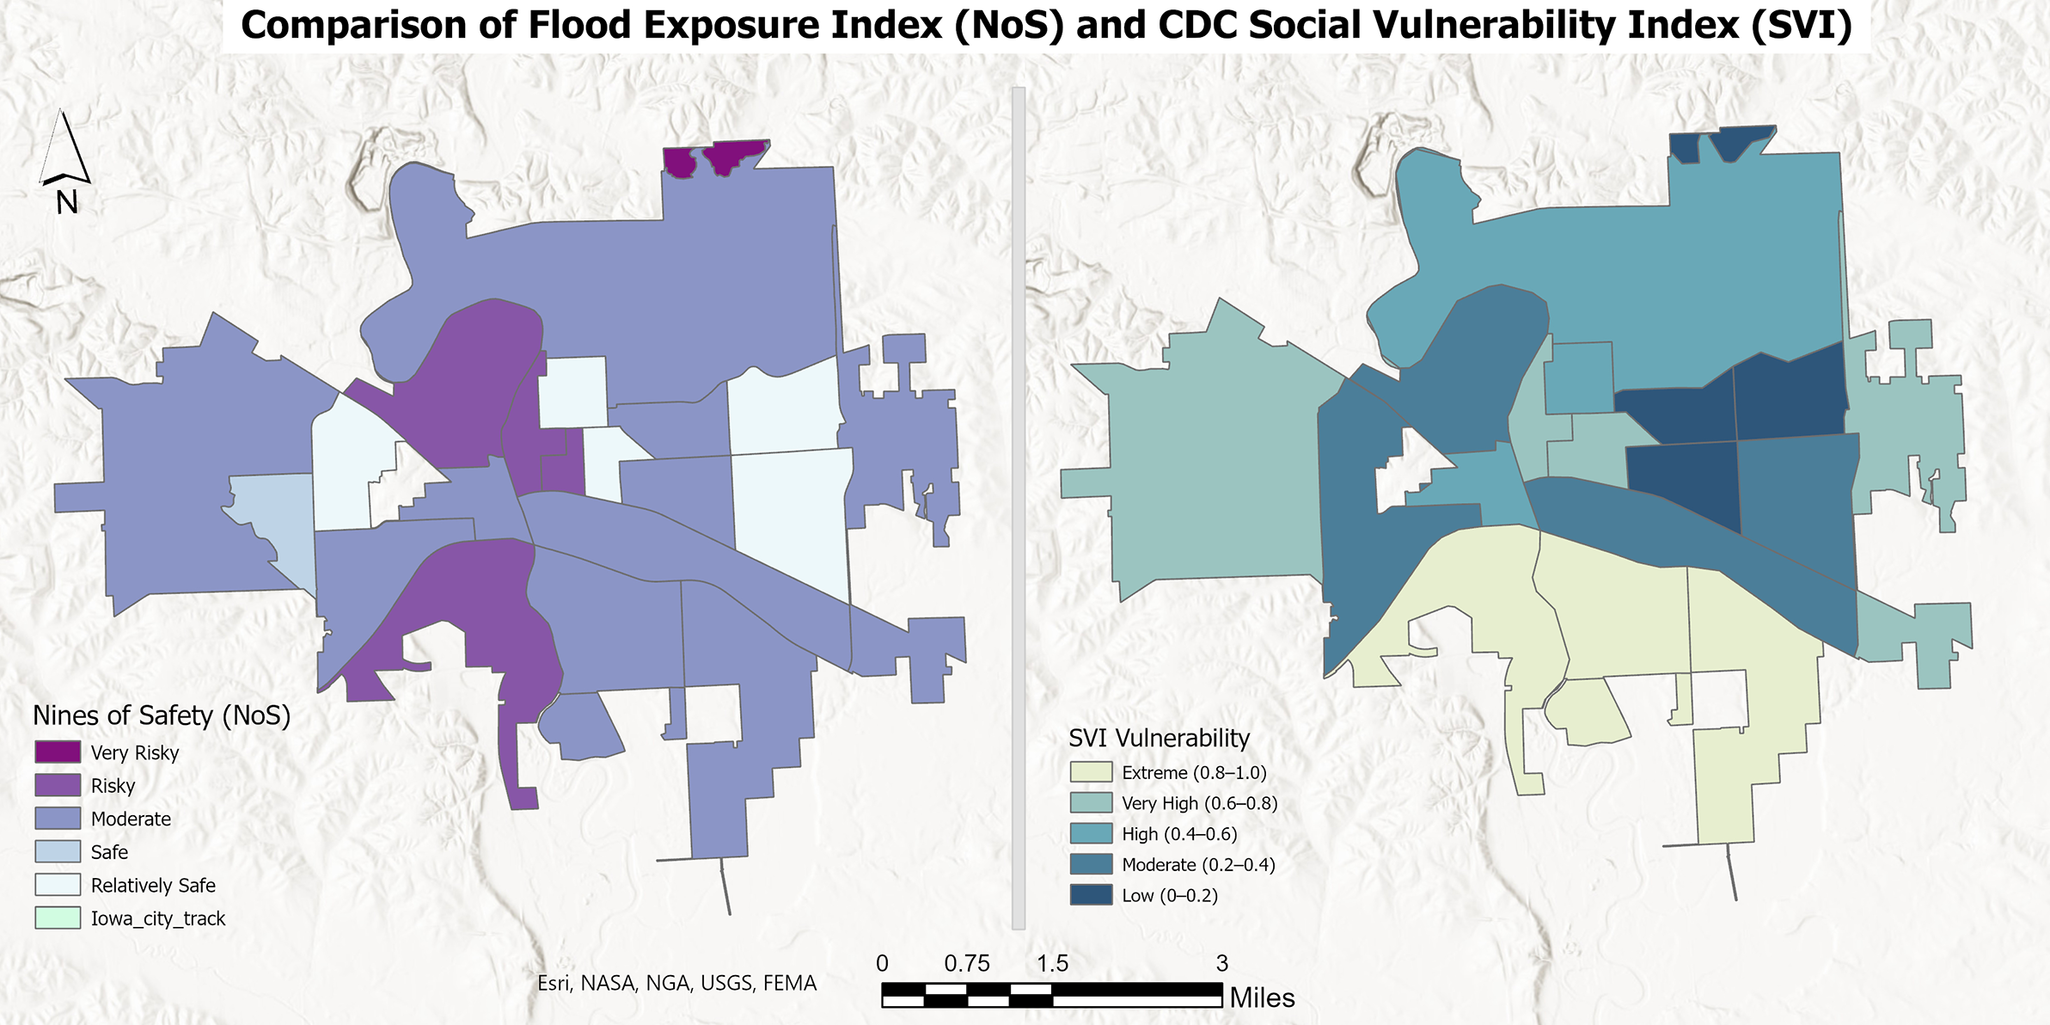
Comparative spatial analysis of physical and social vulnerability
Figure 5 compares the spatial distribution of the NoS flood exposure index with the CDC’s SVI at the census-tract level in Iowa City. The NoS map highlights areas with higher flood exposure (red/orange) concentrated along flood-prone corridors, while the SVI map indicates zones of heightened social vulnerability (darker blue) primarily within older urban neighborhoods. The spatial contrast between these two indicators supports the hypothesized inverse relationship between physical exposure and social vulnerability. Pearson’s correlation analysis (r = −0.52, p < 0.01) further validates this relationship, revealing that tracts with elevated flood exposure often correspond to areas of relatively greater socioeconomic resilience. These patterns emphasize the need for integrated planning that addresses both physical risk and community capacity within flood resilience strategies.
Spatial comparison of the Nines of Safety (NoS) flood exposure index and the CDC Social Vulnerability Index (SVI) across census tracts in Iowa City. The NoS map highlights flood-prone zones (darker purple) with lower safety ratings, while the SVI map shows social.

The Iowa City case study serves as a proof-of-concept for integrating geophysical and socioeconomic indicators; however, its affluent demographic composition limits the applicability of its findings to more socioeconomically diverse or high-vulnerability scenarios. Future applications of the NoS framework should prioritize underrepresented regions, including rural, coastal and low-income floodplains, to assess the impact of socioeconomic disparities, information access and infrastructure inequality on safety perceptions and responses. Expanding the framework to include diverse communities will promote equitable representation and enhance the robustness of the NoS approach.
While the NoS framework was conceptually developed to enhance intuitive communication of flood risk, this study did not conduct user-based evaluations to test its interpretability among nontechnical audiences. Future work will include public testing and stakeholder surveys to compare comprehension of NoS with traditional probabilistic expressions (e.g., “100-year flood” terminology). However, the nine-tier scale of NoS was intentionally designed to align with familiar categorical frameworks such as the Saffir-Simpson Hurricane Scale and the Air Quality Index, suggesting potential for effective communication once empirically validated.
Temporal decay of safety with exposure duration
In flood risk assessment, exposure duration plays a critical role in determining cumulative safety levels. Even if the annual probability of flooding remains constant, the likelihood of remaining “safe” diminishes with each passing year of exposure. To operate this effect, we modeled the temporal decay of NoS using the cumulative nonoccurrence probability, defined as:
 $$ {\boldsymbol{P}}_{\mathrm{safe}}\left(\boldsymbol{t}\right)={\left(\mathbf{1}-{\boldsymbol{P}}_{\boldsymbol{f}}\right)}^{\boldsymbol{t}},\mathrm{NoS}\left(\boldsymbol{t}\right)=-{\mathbf{\log}}_{\mathbf{10}}\left(\mathbf{1}-{\boldsymbol{P}}_{\mathrm{safe}}\left(\boldsymbol{t}\right)\right) $$
where $ {P}_f $
represents the annual flood probability, and
$ {P}_f $
represents the annual flood probability, and $ t $
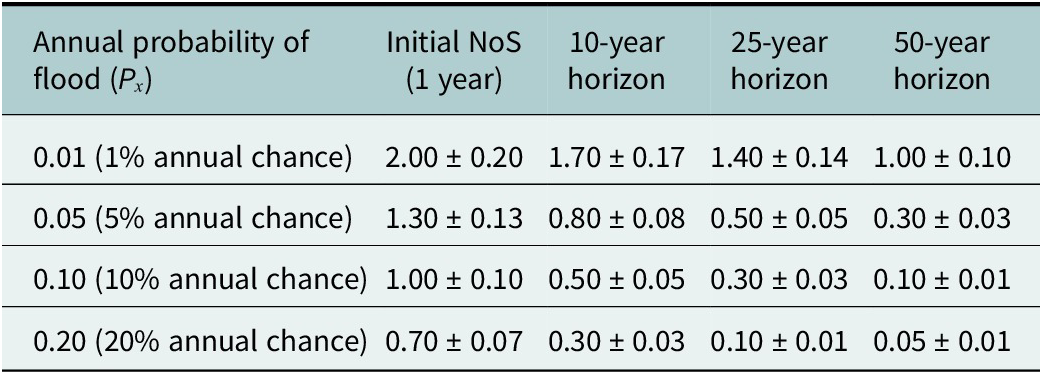
denotes exposure duration in years. Table 17 illustrates how NoS values gradually decrease with increasing exposure horizons, reflecting the “erosion of safety” over time. For example, an area with a 1% annual flood probability (NoS = 2.0) experiences a reduction to approximately NoS = 1.0 after 50 years of continuous exposure. This trend quantitatively demonstrates that long-term hazard persistence amplifies cumulative flood risk, underscoring the importance of incorporating temporal perspectives into safety communication and infrastructure planning. The temporal decay analysis assumes stationarity in flood probability and exposure, which may not hold under evolving climatic and land-use conditions. Incorporating nonstationary rainfall or exposure projections could extend this framework to dynamic climate scenarios (Table 17).
$ t $
denotes exposure duration in years. Table 17 illustrates how NoS values gradually decrease with increasing exposure horizons, reflecting the “erosion of safety” over time. For example, an area with a 1% annual flood probability (NoS = 2.0) experiences a reduction to approximately NoS = 1.0 after 50 years of continuous exposure. This trend quantitatively demonstrates that long-term hazard persistence amplifies cumulative flood risk, underscoring the importance of incorporating temporal perspectives into safety communication and infrastructure planning. The temporal decay analysis assumes stationarity in flood probability and exposure, which may not hold under evolving climatic and land-use conditions. Incorporating nonstationary rainfall or exposure projections could extend this framework to dynamic climate scenarios (Table 17).
Temporal decay of the Nines of Safety (NoS) across exposure durations for four representative annual flood probabilities. Uncertainty is expressed as ±10% of each NoS value to reflect plausible variation in geophysical and probabilistic parameters (The ± 10% uncertainty reflects typical variation in tract-scale flood probability and geophysical parameters, consistent with empirical margins in USGS and FEMA flood frequency analyses)

Conclusion
This study introduced and operationalized the NoS framework as a novel metric for quantifying and communicating flood risk. By establishing a probabilistic and logarithmic scale of safety, the NoS approach advances conventional flood risk communication beyond percentage-based metrics, offering an intuitive, scalable and comparative representation of the likelihood of avoiding adverse outcomes. This transformation is not only mathematically rigorous but also communicatively robust, bridging the gap between technical modeling and public comprehension.
Our multidimensional analysis underscores the critical role of both geophysical and socioeconomic determinants in shaping flood vulnerability. Physical indicators, such as DEMs, land use, soil types and drainage density, were shown to significantly affect flood susceptibility. However, geophysical exposure alone does not capture the whole risk landscape. Socioeconomic variables – particularly income levels, demographic age structures and population density were found to compound risk by influencing preparedness, exposure and recovery capacity. This layered vulnerability is especially pronounced for marginalized populations, such as children, the elderly and low-income households.
Notably, the NoS framework accounts for temporal exposure – demonstrating how cumulative time spent in flood-prone areas contributes to a progressive erosion of safety. This time-aware component introduces a vital longitudinal dimension to flood risk modeling, advocating adaptive planning strategies, regular updates to hazard assessments and sustained investment in early warning systems and infrastructure.
A key addition in this work is the simulation-based validation of the NoS framework using a proxy SVI. The comparative analysis revealed a strong inverse correlation between NoS scores and SVI levels – supporting the framework’s external validity and confirming its capacity to reflect underlying social fragilities. This alignment strengthens confidence in NoS as a legitimate and complementary tool for risk assessment, especially in settings where SVI data are limited or underutilized. While NoS simplifies the probabilistic expression of hazard occurrence, it does not represent event severity or social vulnerability. These dimensions remain complementary inputs for interpreting overall flood risk. While NoS offers a standardized probability expression, its semantic interpretation depends on the hazard domain and cannot be universally compared across unrelated fields such as medical safety or engineering reliability. The inverse NoS-SVI correlation reflects conceptual consistency between vulnerability and safety metrics; however, it should not be interpreted as independent validation of the NoS framework. The current implementation relies on static geophysical indicators (elevation, slope, land use and drainage density) rather than hydrodynamic flood models. While this limits direct process representation, the framework is compatible with physics-based simulations such as the Hydrologic Engineering Center’s River Analysis System (HEC-RAS) or the Ensemble Framework for Flash Flood Forecasting (EF5), which could provide finer-grained flood depth and velocity estimates in future studies.
Although the NoS framework was developed using US flood probability conventions such as FEMA’s 1% annual exceedance event, its probabilistic structure allows adaptation to international contexts. The European Union Floods Directive (European Parliament, 2007) and similar probabilistic systems in the United Kingdom (Environment Agency, 2018) and Australia (Australian Bureau of Meteorology, 2021) could incorporate NoS-based scales to express exceedance probabilities in a more intuitive, safety-oriented manner for public communication.
Overall, the NoS framework offers a transferable tool for translating complex flood probabilities into a unified, communicable safety score that integrates exposure, vulnerability and temporal risk. It provides planners and communities with an accessible language for resilience planning and equitable decision-making. Future work should test NoS performance across hazards, such as droughts or heatwaves, and evaluate its integration into early warning and communication platforms using empirical damage and preparedness data to validate its behavioral and operational effectiveness.
Open peer review
To view the open peer review materials for this article, please visit http://doi.org/10.1017/wat.2026.10017.
Supplementary material
The supplementary material for this article can be found at http://doi.org/10.1017/wat.2026.10017.
Data availability statement
All geospatial and census data used in this study are publicly available from the Federal Emergency Management Agency (FEMA), the US Census Bureau and the Centers for Disease Control and Prevention (CDC) Social Vulnerability Index (SVI) portal. The derived datasets and analytical scripts (ArcGIS Pro geoprocessing models and Python routines) used for calculating the Nines of Safety (NoS) are available from the corresponding author upon reasonable request to support transparency and reproducibility.
Acknowledgments
The authors used OpenAI’s ChatGPT (version GPT-5, accessed November 2025, https://chat.openai.com) to assist with improving the readability, clarity and grammatical accuracy of the manuscript. All conceptual content, data analysis and interpretations were developed entirely by the authors. The AI tool was not used to generate novel scientific ideas, results or conclusions.
Author contribution
Conceptualization: S.M.S.I. and I.D.; methodology: S.M.S.I.; data curation: S.M.S.I.; formal analysis: S.M.S.I.; investigation: S.M.S.I. and I.D; visualization: S.M.S.I.; writing – original draft: S.M.S.I.; writing – review and editing: S.M.S.I. and I.D.; supervision: I.D.
Financial support
This research did not receive any specific grants from public, commercial or non-profit funding agencies.
Competing interests
The authors declare none.


 Open access