


Introduction
A hallmark of biomineralization is the ability of many different organisms to induce the formation of a specific crystal polymorph or of a mineral with a specific composition. Well known examples are the common polymorphs of calcium carbonate, aragonite, and calcite (Lowenstam and Weiner, Reference Lowenstam and Weiner1989). Less well known are, for example, the abilities of deep-sea medusae and of the tamarisk tree to form partially hydrated calcium sulphate hemihydrate (bassanite) (Tiemann et al., Reference Tiemann2002; Weiner et al., Reference Weiner2021), as opposed to the more stable fully hydrated common form of calcium sulphate, gypsum, or the anhydrous form of calcium sulphate, anhydrite. Barnacles form their shells with highly crystalline well-ordered calcite, but a certain species reinforces its trapdoor (operculum) with less well-ordered calcite (Mor Khalifa et al., Reference Mor Khalifa2011). As the same mineral is always deposited by the same organism at the same tissue site, these processes are clearly genetically controlled. Significantly, very few examples of mixtures of the same compound with different structures at one site have been documented (Saunders et al., Reference Saunders2009; Wood et al., Reference Wood2022), unless during transformation of unstable precursors, or in pathological mineralization (Tsolaki and Bertazzo, Reference Tsolaki and Bertazzo2019), such as in pearls formed by mollusks (Soldati et al., Reference Soldati2008).
The mechanisms that organisms use to control polymorphism, order–disorder and solvation states, are in many respects some of the core issues in biomineralization, and for the most part, are still poorly understood. For this reason, we shall not limit ourselves to discussing only polymorphism, but we shall also include cases of crystals of the same substance in different hydration states, such as calcium carbonate crystallizing as the anhydrous calcite or aragonite, or as monohydrocalcite and amorphous calcium carbonate in its hydrated forms. Hydration and disorder are additional parameters that introduce interesting variations on different themes.
Even more puzzling is identifying the functional benefit, if any, of using one polymorph and not another, or a certain mineral over another structurally or compositionally closely related mineral. The exceptions are minerals with very specific properties, such as the magnetic properties of magnetite, used by magnetotactic bacteria to orient themselves in the Earth’s magnetic field (Blakemore, Reference Blakemore1975). The mineral barite is used for detecting the earth’s gravitational field in a manner akin to a plumb bob (Kreger and Boere, Reference Kreger and Boere1969; Lowenstam and Weiner, Reference Lowenstam and Weiner1989). So, the high density of barite makes sense. But there are so many other minerals used for gravity sensing, and not all of them have high density (Lowenstam and Weiner, Reference Lowenstam and Weiner1989). Some mollusks build their shells using calcite in one layer and aragonite in another layer (Boggild, Reference Boggild1930). We are not aware of a known functional benefit of aragonite over calcite or vice versa. It has been noted that certain mollusks living in warmer waters have more aragonite in their shells as compared to calcite than those in colder waters. This is not due to aragonite being more stable at higher temperatures, but is related to seasonal variations in water temperature (Dodd, Reference Dodd1964). So, the phenomenon can be regarded as a secondary outcome imposed by the environment and does not reflect basic properties of calcite and aragonite polymorphs.
In short, there are many more questions than answers. Despite this, or maybe because of this, we have chosen to revisit this intriguing problem.
The issues to be addressed
Is polymorph specificity embedded in the mollusk organic shell matrix? We will reexamine a study that we ourselves published (Falini et al., Reference Falini1996), that involved in vitro experiments addressing the issue of how mollusks may induce aragonite or vaterite to form specifically over the more stable calcite. We shall then examine other biological crystal formation processes to assess which, if any, of the lessons learnt from the calcium carbonate systems may apply and what other lessons we can learn.
Chiton teeth are a rich source of information on phase transformations in biomineralization because the stages of tooth formation can be analyzed individually, as they are separated in space and time. The teeth are composed of a hard external layer of magnetite that forms from a ferrihydrite precursor phase (Towe and Lowenstam, Reference Towe and Lowenstam1967), a middle layer of an iron oxyhydroxide, and an inner layer of carbonated hydroxyapatite, formed from an amorphous calcium phosphate precursor (Lowenstam and Weiner, Reference Lowenstam and Weiner1989). The discovery by Towe and Lowenstam that magnetite forms from a ferrihydrite precursor initiated our still ongoing quest to better understand the formation and function of transient amorphous precursors in biomineral formation and their possible contribution to polymorph specificity.
A fundamental issue is that very often the biogenic crystal structure is not the most stable polymorph. The investigation of structure–function relations of organic crystals formed by organisms fulfilling optical functions, namely structural colors and vision, provides an insightful perspective on this issue. Does the biological polymorph better fulfill its functional purpose, and why were crystals of purine and pteridines exploited during evolution? Was that only a matter of biological availability or did the crystal properties play a role in the determination made during evolution? And as always in biology, both options may be correct.
We shall finally juxtapose the evidence and the conceptual interpretations derived from physiological processes with those that have been identified in the pathological process of cholesterol crystallization. Is the crystal structure of the cholesterol polymorph used determined by the biological environment, and if it is, what are the biological factors that determine it? And based on such observations, we address a most basic issue: why, in non-pathological processes, do we almost never encounter mixed polymorph/mineral phases in the same depositional site?
Cholesterol under normal physiological conditions does not crystallize inside the body. But cholesterol crystallizes pathologically as a monohydrate, and as far as we know, only in the arteries and in the gallbladder. Two polymorphs have been identified, one of which can be templated on cell membranes and functions as the precursor of the stable polymorph. This observation highlights the fundamental issue of the role of crystal nucleation by templating on both normal and pathological biological assemblies.
Gaining insights into underlying biological mechanisms can be achieved both by documenting the in vivo processes and by taking advantage of the flexibility in designing in vitro experiments to gain more precise mechanistic understandings. Both approaches are necessary and complementary. Our preference in this review is to highlight the in vivo knowledge, and then, where appropriate, follow up with relevant in vitro information.
Before we address these issues, we shall first briefly review the history of polymorphism in general and the discovery of polymorphism in biomineralization. Knowing how concepts were established in the past is not only fascinating but can often be illuminating (see Dauphin, Reference Dauphin2023).
History of polymorphism: Calcite and aragonite
Eilhard Mitscherlich is recognized for coining the term ‘polymorphism’ (from poly = many and morphe = shape, form) in 1822 to describe a substance’s ability to exist in more than one crystalline form (Mitscherlich, Reference Mitscherlich1823). When X-ray crystallography was developed, these compounds proved to have different arrangements in the crystal lattice, and thus also different physical properties. Nye (Reference Nye1957) showed that the physical properties of crystals, including the optical, mechanical, electrical, magnetic, and thermal properties, are all determined by the crystal structure.
In the 1999 Bragg lecture entitled ‘Polymorphism; The Same Yet Different’ the late Prof. Jack Dunitz (ETH, Zurich) reflected on the change in outlook of chemists towards polymorphs during his lifetime, from an unwanted nuisance to a thriving research field (Dunitz, Reference Dunitz2000). Prof. Dunitz suggested that the impetus for this change of attitude came from the challenge of crystal engineering in the pharmaceuticals industry, and the need to predict crystal structures and molecular properties. We are still far from reaching that goal in biomineralization, but the research in crystal engineering is rich in examples that may inform us about the origins and the advantages of polymorphism (Bernstein, Reference Bernstein2007).
Mollusks use specific polymorphs of calcium carbonate in their shells. However, the first studies on mollusk shell structure were made long before polymorphism was defined, and crystal structures were determined. Réaumur (Reference Réaumur1717) already identified nacre and prismatic crystals in mollusk shells. He described ‘the red prismatic layer in the bivalve Pinna’ as ‘made of contiguous threads juxtaposed to each other and perpendicular to the surface of the shell…. In contrast, the inner nacreous layer had a smaller distribution and is a superposition of sheets parallel to the surface of the shell’ (Figure 1).
Scanning electron microscope (SEM) image of a fractured shell of the mollusk Atrina rigida. The shell architecture and structure must be the same as observed by Réaumur in Pinna (Réaumur, Reference Réaumur1717). (a) The outer prismatic layer is composed of calcite (top), and the inner nacreous layer is composed of aragonite (bottom). Inset: Atrina shells seen from the inside (top) and from the outside (bottom). (b) Magnification of the nacreous layer, composed of layers of aragonite thin flat tablets lying parallel to the shell surface. The tablets are separated by thin layers of organic matrix, composed of chitin, proteins, and glycosaminoglycans. (c) Fractured prismatic layer, composed of long prismatic calcite crystals perpendicular to the shell surface. The prisms contain a network of chitin and are permeated with proteins and polysaccharides.

The mineral calcite was named and identified as a distinct mineral species by Gaius Plinius Secundus (Pliny the Elder) in 79 CE. He derived the name from the Latin word for lime, calx (genitive calcis). The transparent form of calcite known as ‘Iceland spar’ was particularly significant in scientific history. Its strong double refraction (birefringence) effect was first described and documented by the Danish scientist Erasmus Bartholin in 1669, a key moment in the study of optics and crystallography (Bartholin, Reference Bartholin1669). René Just Haüy further developed the theory of crystal structure in the late 18th century after observing, like others before him, that shattered calcite crystals consistently broke into identical rhombic shapes, leading to the idea of a basic structural unit for crystals (Haüy, Reference Haüy1784).
Aragonite was first identified in 1790 by Abraham Gottlob Werner from specimens obtained in Molina de Aragón, Spain, from which the name aragonite was derived (Werner, Reference Werner1790). In 1808, J. L. De Bournon wrote a treatise ‘on calcium carbonate and arragonite, including an introduction to mineralogy, a theory of crystallization … and the determination of crystalline forms…’(le Comte de Bournon, Reference le Comte de Bournon1803). De Bournon identified the carbonate of lime as a crystalline component, and most importantly recognized that the shell of mollusks is secreted by the animals, but once secreted, the animal does not control the behavior of the mineral. De Bournon’s findings were confirmed and extended by William Benjamin Carpenter, who, in his work ‘On the Microscopic Structure of Shells,’ published in 1845, investigated the intricate internal structures of various shells using microscopy (Carpenter, Reference Carpenter1845). Carpenter further stated, ‘it cannot admit of a doubt, that the prismatic arrangement of the carbonate of lime in these shells is due to the nature of the organic basis in which it is deposited….’ His work is recognized as an important contribution to the understanding of shell formation.
In 1930, Bøggild analyzed mollusk shell structures composed of aragonite and calcite (Boggild, Reference Boggild1930). He used three methods to differentiate between calcite and aragonite: refractive index, specific gravity and a reaction of Meigen. Bøggild did not mention the potential of using X-ray diffraction for identifying calcite and aragonite, even though his study in 1930 followed close in time to Bragg’s determination of the calcite and aragonite structures (Bragg, Reference Bragg1915; Bragg, Reference Bragg1924). Calcite was among the first crystal structures determined by Lawrence Bragg in 1914 (Discussed in Bragg, Reference Bragg2014). In his introduction to the manuscript on the crystal structure of aragonite in 1924, Bragg writes: ‘Aragonite has the same composition as calcite, both being crystalline forms of calcium carbonate, CaCO3. A comparison of the structures of these two crystals is interesting because they represent one of the most striking cases of dimorphism amongst minerals. Calcite forms rhombohedral crystals, …. Aragonite crystals have orthorhombic symmetry… [but] … crystals of aragonite have an obviously pseudohexagonal character. … Repeated twinning … results in interpenetrating groups which are almost indistinguishable from simple hexagonal crystals’ (Bragg, Reference Bragg1924).
Indeed, calcite and aragonite structures are very similar (Figure 2). In particular, the positions of the calcium atoms in the ab plane are practically identical (Figure 2, bottom). Calcite and aragonite also have similar stabilities. Calcite is the more stable polymorph at ambient temperatures and is also kinetically favored in aqueous environments. However, in the presence of concentrations of magnesium four times greater than calcium [Mg2+] > 4[Ca2+], aragonite becomes more stable (Lippmann, Reference Lippmann1973). Mg ions, being smaller than Ca ions, their introduction in the calcite structure (up to 14% occupancy of the Ca sites) causes a local contraction in the unit cell relative to calcite, thus decreasing the stability of the mixed phase. Thus, in seawater, having 50 mM Mg2+ concentration and 10 mM Ca2+ concentration, aragonite should form preferentially. If so, how can calcite formation, as for example in mollusk shells, be induced in an environment where [Mg2+] > 4[Ca2+]? Alternatively, as crystallization occurs in a protected space, it is not directly exposed to seawater and therefore not influenced by seawater composition. Equally puzzling is then the question: how can aragonite formation be induced under conditions in which calcite is more thermodynamically stable? Several mollusks highlight the complexity of this issue as they contain a layer of calcite and a layer of aragonite in the same shell (Boggild, Reference Boggild1930). Furthermore, the use of aragonite or calcite by the mollusk does not reflect a propensity for, say, calcite to form prisms, as mollusks also form prisms from aragonite.
Crystal structures of calcite and aragonite. The crystal structure of calcite can be described using either a rhombohedral or a hexagonal unit cell. We use the hexagonal notation because it is easier to understand. Top: In both structures, in the (001) planes (that we call for simplicity ab planes because the a and b axes are parallel to them), layers containing only calcium ions alternate with layers containing only carbonate ions. The carbonate ions lie in both structures parallel to the ab planes. The difference between calcite and aragonite is that in calcite, the carbonates are all in the same layer, whereas in aragonite, the carbonates are staggered. Bottom: The lattice positions of calcium ions in the calcium layers of calcite and aragonite parallel to the ab plane, with profiles of the unit cells marked, respectively. Although the calcite structure is hexagonal, whereas the aragonite structure is orthorhombic, because of the quasi-hexagonal symmetry of aragonite, the positions of calcium ions are practically identical in the two structures. To facilitate observation of this feature, a profile of the unit cell of calcite in the ab plane is outlined with a dashed line in the aragonite ab plane on the right. In this graphic, as well as in all other graphic representations of crystal structures below, C atoms are represented in dark grey, O atoms in red, and Ca atoms in blue.

Specifically inducing the formation of aragonite or calcite
The concept of control of the organic components over mollusk shell layer structure was formulated in the 19th century, and the specificity of the organic matrix in the formation of aragonite or calcite was proposed in the 1950s (Gregoire et al., Reference Gregoire1955). Probably the first attempt to analytically address the issue was by Ed Hare, at the time a PhD student of Heinz Lowenstam at Caltech (Hare, Reference Hare1963). Hare hypothesized that the specificity was embedded in the matrix proteins and so he compared the amino acid compositions of matrix proteins from calcite and aragonite shell layers of the bivalve Mytilus californianus. To do this, he had to build his own amino acid analyzer, which he did. He found in both layers a large percentage of acidic and basic amino acids and suggested that these residues may be involved in the formation of the mineral crystals by binding calcium and carbonate ions, respectively. Indeed, he found differences between the protein amino acid compositions in the aragonitic nacre and the calcitic prisms and hypothesized their importance in polymorph specificity. Now, however, we know that such shell layers contain tens of different proteins (Marin, Reference Marin2020), and differences in the amino acid compositions of all of them combined are not informative. We also know that other components in the mollusk matrix, especially proteoglycans and glycosaminoglycans, participate in the process of crystal formation (Crenshaw, Reference Crenshaw1972; Marin et al., Reference Marin1996).
Addadi and Weiner’s first collaborative work (Addadi and Weiner, Reference Addadi and Weiner1985) investigated the interactions of acidic macromolecules extracted from bivalve mollusk shells and crystals of calcium dicarboxylates and of calcite. We showed that the interactions are stereo-specifically directed toward certain crystal faces, where the calcium-carboxylate motifs in the crystals are complementary to aspartic acid carboxylate motifs in the acidic proteins. By virtue of the same stereo-specificity, calcite crystals specifically nucleated from the (001) face (Figure 2, legend), where the calcium ions in the calcium layer are complementary to the aspartic acid carboxylate motifs on proteins absorbed on a rigid substrate. Only calcite formed, irrespective of whether the macromolecules were extracted from the aragonitic or the calcitic layer. This was (and still is) explained by the fact that the nucleated (001) calcium layer is identical in calcite and aragonite (Figure 2), and that calcite is more stable and kinetically favored over aragonite under the conditions used.
In 1987 (Addadi et al., Reference Addadi1987), we investigated the cooperative effect between sulfate groups of proteoglycans and carboxylate ions in the protein amino acids. We suggested that the strong cation attractors in the proteoglycans concentrate calcium ions in the vicinity of the acidic proteins in β-sheet conformation, thus promoting oriented crystal nucleation. Still, only calcite formed. In fact, it has proved difficult to obtain calcium carbonate polymorph specificity in vitro, even when using macromolecules extracted from mineralized tissues (Falini et al., Reference Falini2005; Suzuki et al., Reference Suzuki2009; Kalka et al., Reference Kalka2024). Key insights, such as the importance of protein phosphorylation, can, however, be obtained (Kalka et al., Reference Kalka2024). Here we examine in detail one of our own in vitro experiments.
The experiments of Falini et al (Reference Falini1996) unequivocally confirmed that the macromolecular ensemble in mollusk shells can control polymorph specificity. According to the knowledge existing at the time, there are three major components in a mollusk shell: β-chitin, silk fibroin, and acidic macromolecules. Falini et al. (Reference Falini1996) showed that the cooperation of all three components is needed to achieve polymorph specificity. When introduced in a scaffold of chitin impregnated with silk fibroin gel, the macromolecules derived from an aragonitic shell layer induced aragonite formation, whereas the macromolecules derived from a calcitic shell layer induced calcite formation. In the absence of extracted macromolecules, vaterite, the third and less stable polymorph of anhydrous calcium carbonate crystals, was deposited. In this third case, crystallization did not occur inside the substrate, but only on the surface.
The β-chitin used was from the pen of the squid Loligo, which is a mollusk but does not form a shell. So, there is no need to postulate a unique structure for the β-chitin that is involved in mineralization. The silk fibroin was extracted from Bombyx mori – the silkworm, demonstrating that a special mineralizing form of silk is not needed. The soluble macromolecule assemblages were extracted from a bivalve, a cephalopod, and a gastropod, suggesting that the results are probably applicable to all mollusks. Furthermore, in one case, the macromolecules from an aragonitic layer were from a crossed-lamellar structure and not nacre. In all cases, the induced mineral phase was in the form of spherulites and did not resemble nacre or crossed lamellar structure at all. Clearly, this in vitro setup is not able to control crystal shape and orientation, but can control polymorph specificity.
We now know that while the β-chitin has a highly ordered ‘crystalline’ sheet structure, the silk fibroin is present in the form of a gel and not a fiber (Levi-Kalisman et al., Reference Levi-Kalisman2001) (Figure 3a,c). Furthermore, the gel that is incorporated and squeezed between the aragonite crystal platelets in formed nacre contains glycosaminoglycans in amounts even larger than the silk proteins (Pereira-Mouries et al., Reference Pereira-Mouries2003). Interestingly, such gel phases exist not only in mollusk shells and not only in aragonite layers but were also observed in barnacles, which are arthropods that build their exoskeleton out of calcite crystals (Figure 3b,d) (Mor Khalifa et al., Reference Mor Khalifa2011).
Gel phase that flowed out from the original location between crystals in (a) the nacreous layer of the mollusk Brachidontis pharaonis, and (b) in the exoskeleton of the barnacle Bolanos amphitrite, composed of calcite crystals. The gel is trapped under pressure after crystal growth and flows out upon fracture of the shell. The images in (a) and (b) were taken using an environmental scanning electron microscope under conditions of high humidity. (c) Fractured nacre of the mollusk Brachidontis pharaonis imaged dry with SEM. (d) Optical micrograph of two Balanos amphitrite barnacle shells, viewed from the side (on the left) and from top operculum side (on the right). Figures in (b) and (d) were reproduced from Mor Khalifa et al. (Reference Mor Khalifa2011).

Most importantly, we now know that in mollusks the first-formed mineral phase is amorphous calcium carbonate (ACC), which subsequently crystallizes with the correct polymorph structure (Weiss et al., Reference Weiss2002; Jacob et al., Reference Jacob2011; DeVol et al., Reference DeVol2015). We also now know that ACC can exist in various hydrated or anhydrous phases, some of which are stable, and others are transient (Radha et al., Reference Radha2010), and most importantly, we know that transient ACC phases with a nascent aragonite or nascent calcite structure exist in vivo (Hasse et al., Reference Hasse2000; Politi et al., Reference Politi2006). Nascent aragonite or nascent calcite structures mean that the short-range order in the first calcium coordination spheres of the disordered phase is already that of the calcite or aragonite structure, respectively (discussed in detail below). This raises the fundamental question of the role of the transient precursor phase in polymorph specificity, in addition to what is presumed to be the abilities of some matrix proteins to induce polymorph specificity (Davila-Hernandez et al., Reference Davila-Hernandez2023).
We can conceive several scenarios that may account for the controlled formation of aragonite in mollusk shell nacre. The scenarios are presented for convenience in the case of aragonite, simply because more information exists on nacre than on the prismatic layer, but the general principles may well be valid for the prismatic calcitic layer as well.
-
I) The ACC phase is produced by mantle cells and introduced into the pre-formed ordered β-chitin-delimited interlamellar space filled with the silk fibroin/glycosaminoglycan gel phase. In this scenario, aragonite specificity is built into the disordered precursor phase (nascent aragonite) and the acidic macromolecules adsorbed on chitin are tailored to control oriented nucleation of the crystals. We do not know how the nascent aragonite structure is induced in the ACC phase. It is conceivable that the cells may produce ACC already with a nascent aragonite structure, or that the cells might produce ACC in a highly disordered phase, which then undergoes a phase transition to a nascent aragonite structure under the influence of the gel components.
-
II) Aragonite-inducing macromolecules adsorbed on the ordered chitin substrate induce specific and oriented nucleation of aragonite crystals from a disordered ACC phase stabilized by the gel. In this scenario, the specificity is built into the nucleating proteins, and the silk fibroin/glycosaminoglycan gel functions only as a medium where the ACC may be formed and/or stabilized.
-
III) Control over aragonite specificity is achieved by the combined activity of the nascent aragonite precursor phase and of specific aragonite nucleating proteins.
Amorphous calcium carbonate, monohydrocalcite, and structural water
In this section, we describe the interplay between amorphous calcium carbonate phases with or without structural water, as well as the interplay between monohydrocalcite, one of the hydrated crystalline phases of calcium carbonate, and the non-hydrated crystalline phases of calcite and aragonite. It has also been demonstrated that on the pathway from ACC to a crystalline polymorph, calcium carbonate hemihydrate (i.e. a mineral composed of two moles of CaCO3 per mole of water) is also formed (Zou et al., Reference Zou2019). This phase has also been identified in nacre and corals (Schmidt et al., Reference Schmidt2024).
In sea urchin larval spicules, Politi et al. showed using Extended X-ray Absorption Fine Structure (EXAFS) and X-ray PhotoEmission Electron Microscopy (XPEEM), that the ACC precursor phase transforms from an initial hydrated form to an anhydrous form prior to crystalline calcite formation (Politi et al., Reference Politi2006; Reference Politi2008). In the transient amorphous anhydrous phase, the short-range order around the calcium ions is already very similar to that of calcite. EXAFS spectra of ACC can determine the number of oxygen and carbon atoms around calcium and their distances from the Ca atom within the range of up to 4 Å (Taylor et al., Reference Taylor1993). EXAFS analysis of the embryonic shell of the snail Biomphalaria glabrata, which is composed of ACC that transforms into aragonite, revealed that the structure of aragonite is already preformed in the ACC phase (Hasse et al., Reference Hasse2000). The larval shell ACC is, in essence, proto-aragonite (also referred to as nascent-aragonite). In mature mollusk shell nacre, De Vol et al., also using X-PEEM, detected a transition from a hydrated to an anhydrous amorphous transient phase, and finally to crystalline aragonite (DeVol et al., Reference DeVol2015). They showed that the anhydrous phase has an X-ray absorption near edge structure (XANES) very similar, if not identical, to that of aragonite (proto-aragonite). Jäger and Cölfen, (Reference Jäger and Cölfen2007) also detected a heavily hydrated amorphous phase in mollusk shell nacre. In contrast to the anhydrous phases, the initially formed hydrated transient ACC phases in both mollusk nacre and sea urchin larvae appear to have the same XANES spectrum. It would be of much interest if we could directly convert these XANES spectra into the short-range structure of the coordination shell around the calcium atom, but this is still difficult (Kahil et al., Reference Kahil2022). A most intriguing question is how the nascent aragonite structure can be induced already at the level of the amorphous precursor?
From the above observations, we surmise that structural water stabilizes the initially deposited ACC phase, and after this phase is somehow dehydrated, it becomes unstable and crystallizes. This, in turn, raises the question of whether or not the mode of dehydration also induces the nascent structural organization? It has also been observed in vitro that confinement can stabilize ACC for days that would otherwise crystallize in minutes (Stephens et al., Reference Stephens2010).
The role of water in stabilizing ACC is supported by analyses of biogenic ACC phases that are stable throughout the lifetime of the organism. Such a stable ACC phase was first identified in 1898 in the triradiate calcareous spicules of a calcisponge (Minchin, Reference Minchin1898). Interestingly, Minchin first reported how the three arms of the triradiate spicule form separately, each crystal being deposited by a pair of cells in a shared membrane-bound space. The membranes shared by the six cells subsequently fuse, and the three separate crystals join at the center to yield one single crystal. Minchin did realize that the fusion of three separate crystals into one single crystal was dubious. He then discovered that the calcium carbonate deposited by each pair of cells, while separated from the others, is not crystalline but amorphous, and further crystallization occurs only after the six cells come together, while the initial amorphous deposits are preserved in the core of the spicule.
Three examples of stable ACC that were characterized by EXAFS, are i) the antler-shaped body spicules of the ascidian Pyura pachydermatina (Levi-Kalisman et al., Reference Levi-Kalisman2000); ii) the mineral hardening of the crustacean American lobster carapace (Homarus americanus), where ACC impregnates an α-chitin scaffold; iii) cystoliths, which are microscopic ACC concretions in the epidermal layer of the leaves of Ficus trees that have many external protrusions (Taylor et al., Reference Taylor1993; Levi-Kalisman et al., Reference Levi-Kalisman2002) (Figure 4a–c). These three ACC phases have different degrees of short-range order, manifested by the different atom occupancies in the layers of the Ca coordination sphere (Figure 4d). Most importantly, however, they all have the same stoichiometry, CaCO3.H2O, meaning that they contain water in a one-to-one molar ratio to the carbonate. Interestingly, their short-range order resembles the crystalline monohydrocalcite, which has the same stoichiometry as the three stable ACC cases (Figure 4e), more than the short-range order of other crystalline polymorphs of calcium carbonate.
Monohydrocalcite and stable ACC. (a) Antler spicule of the ascidian tunicate Pyura pachydermatina. The spicule is composed of stable ACC. (b) Close-up of the microstructure of the crustacean H. americanus carapace, composed of an α-chitin scaffold impregnated with ACC. (c) Cystolith from the leaves of the tree Ficus microcarpa, composed of ACC in a cellulose matrix. (d) Schematic representation of the population of atoms in the first coordination shells around Ca ions in the three ACC minerals in (a)–(c), according to EXAFS data analysis. The coordination shells are color-coded as the atoms in the crystal structure in (e) Ca blue, C grey, O red. The side scale bar gives a measure of the distance from the central Ca. (e) Crystal structure of monohydrocalcite (CaCO3.H2O) crystal structure data from (Swainson, Reference Swainson2008). The H atoms of water are color-coded pink. The unit cell contains three independent Ca coordination spheres, where each Ca contacts two water molecules. (f) Schematic representation of the population of atoms in the first coordination shell around Ca ions in monohydrocalcite. In the anhydrous crystalline structures, both calcite and aragonite have six carbonates in the Ca coordination sphere. In the amorphous minerals, as in monohydrocalcite, water molecules substitute for some carbonates. Figures (a)–(c) were taken from Levi-Kalisman et al. (Reference Levi-Kalisman2002).

The similarity between stable biogenic ACC and crystalline monohydrocalcite is further supported by the observation that in the infrared spectra of both monohydrocalcite and stable ACC, the carbonate peak around 1450 cm−1 is split into two peaks with more or less the same heights/areas (Figure 5). This implies that the carbonates are located in two different environments. Is this difference possibly related to the water molecules?
Fourier Transform Infrared spectra of (a) synthetic monohydrocalcite, and (b) synthetic amorphous calcium carbonate. Note that the main carbonate absorption peaks around 1450 cm−1 are both split into two peaks. The spectra were reproduced from the library of infrared spectra of the Kimmel Center for Archaeological Science, Weizmann Institute of Science (http://www.weizmann.ac.il/kimmel-arch/infrared-spectra-library).

Two questions consequently arise: Does water contribute to the stability of the amorphous phase? And why does the amorphous phase not transform into crystalline monohydrocalcite, which has the same composition and similar coordination? The metastable biogenic ACC phases, such as in the larval sea urchin spicules, are also hydrated (Politi et al., Reference Politi2008). In the larval spicules, X-ray absorption spectroscopy showed a broad distribution of states in the first coordination shell, which is ascribed to the presence of coordinated water (Politi et al., Reference Politi2006). So, although water molecules may well be involved in ACC stabilization, their presence alone is not sufficient to account for the stability. The number of the relatively short Ca–Ca contacts in the stable ACC phases, indicated by the number of Ca atoms in the 3rd coordination shell (Figure 4c), as well as in monohydrocalcite (Figure 4f) is lower than in calcite, aragonite, or vaterite (Levi-Kalisman et al., Reference Levi-Kalisman2002). This difference might also possibly stabilize the amorphous phases relative to the anhydrous crystalline polymorphs, but not relative to monohydrocalcite. Interestingly, monohydrocalcite is not very stable, easily dehydrates, and transforms into one of the anhydrous crystals (Lippmann, Reference Lippmann1973). There are very few known examples of monohydrocalcite in biomineralization (Lowenstam and Weiner, Reference Lowenstam and Weiner1989; Gauldie, Reference Gauldie1993) and even in those cases, there is a distinct possibility that the samples were of hydrated ACC rather than monohydrocalcite, where the identification was made by infrared spectroscopy, as both have some common features in their infrared spectra (Figure 5).
We are not able to determine with certainty the functional advantage(s) of one crystalline or amorphous polymorph over another. We can, however, make some reasonable guesses, but in only a few cases. The benefit to the lobster of using ACC over a crystalline phase in the carapace is that the lobster and other crustaceans dissolve the mineral phase during molt, and as ACC has a much higher solubility than the crystalline polymorphs, this should facilitate this process (Luquet and Marin, Reference Luquet and Marin2004; Reeder et al., Reference Reeder2013). The functional advantage of ACC in plant cystoliths could be related to their many external protrusions (Figure 4c). It has been experimentally demonstrated that the cystoliths scatter light into the light-deprived chloroplasts below the leaf surface layer and thus enhance photosynthesis (Gal et al., Reference Gal2012). The long-range disorder in ACC may be the factor allowing the mineralized particle to assume the favorable spiky morphology that promotes light scattering activity. This morphology would be much more difficult to achieve in a single crystal, although mineralized particles with the same function of facilitating photosynthesis by light scattering are composed of calcium oxalate monohydrate (whewellite) crystal aggregates (Gal et al., Reference Gal2012). In contrast to the lobster carapace and to the plant cystoliths, it is unlikely that the stable ACC in the ascidian Pyura pachydermatina has a functional importance, as other ascidian species form their spicules out of calcite, aragonite, vaterite, and even amorphous calcium phosphate (Figure 6) (Lowenstam, Reference Lowenstam1989).
Ascidian spicules. (a) Spicules from Bathypera ovoida, composed of calcite. (b) Spicules from Didemnidum sp., composed of aragonite. (c) Spicule from Culeolus murrayi, composed of amorphous calcium phosphate. (d) Spicules from H. momus, composed of vaterite. Original images were obtained by H.A. Lowenstam.

There is also good evidence documenting the fact that many organisms are able to control the extent to which the initial highly disordered precursor phase crystallizes. The evidence is based on the infrared spectrum grinding curve method that documents the relative extent of disorder in a mature mineral phase (Regev et al., Reference Regev2010; Poduska et al., Reference Poduska2011). This method has been used for both calcite and aragonite biogenic polymorphs. One interesting case is a barnacle that forms its exoskeleton from highly ordered calcite, but its operculum (trap-door) that seals the barnacle from dehydration at low tide, contains less well-ordered calcite (Mor Khalifa et al., Reference Mor Khalifa2011). This is possibly to achieve a better seal.
Vaterite
Vaterite is the third and least stable polymorph of the anhydrous crystalline calcium carbonate polymorphs. Vaterite has a hexagonal structure, as does calcite, but the molecular arrangement is fundamentally different. In both calcite and vaterite, planes of calcium ions alternate with planes of carbonate ions, but the carbonates in vaterite are arranged perpendicular to the ab plane (Figure 7a) as opposed to calcite, where they are parallel to the ab plane. The carbonates in the structure are not perfectly ordered, which has been hypothesized to derive from several coexisting interspersed crystal structures (Demichelis et al., Reference Demichelis2013; Kabalah-Amitai et al., Reference Kabalah-Amitai2013). Although the fine details of the vaterite structure are still under debate (San et al., Reference San2023), the disorder in the structure certainly affects the crystal stability. In agreement with Ostwald’s rule of phases, vaterite formation is kinetically favored over calcite and aragonite, and probably for this reason, vaterite is often mixed with more stable phases when formed in vitro.
Vaterite. (a) Vaterite crystal structure. (Crystal structure data from Wang and Becker (Reference Wang and Becker2009). The structure is hexagonal, with Ca planes alternating with carbonate planes perpendicular to the c axis. The carbonate ions are perpendicular to the Ca plane. (b) Spicules from the ascidian H. momus. The spicules are composed of vaterite. Image from the collection of H.A. Lowenstam. Inset: H. momus found in Makadi Bay, Hurghada, Red Sea, Egypt by Ysukharenko. https://redseacreatures.com/taxon/invertebrate/tunicates/sea-squirts/herdmania-momus. (c) Asteriscus otolith from the fish Abramis brama. The otolith is composed of vaterite. The image was adapted from Baimukanov et al. (Reference Baimukanov2025).

Vaterite, aragonite, and calcite have been observed together in a few biogenic skeletal materials (Ma and Lee, Reference Ma and Lee2006; Pracheil et al., Reference Pracheil2019). Notably, however, there are only a few known cases of vaterite being formed under controlled conditions as a pure and stable polymorph of CaCO3 in biomineralization. One case is the spicules of the ascidian Herdmania momus mentioned above (Figure 6d, Figure 7b) (Lowenstam and Abbott, Reference Lowenstam and Abbott1975). A second case is in fish. Fish have three pairs of otoliths in the inner ear: the sagitta, the lapillus, and the smallest is the asteriscus. They are essential for sound reception, gravity perception, and for detecting acceleration (Lowenstam and Weiner, Reference Lowenstam and Weiner1989). The sagitta and lapillus are composed of aragonite and/or vaterite, but the asteriscus is always composed of vaterite (Figure 7c), with few exceptions (Lowenstam and Fitch, Reference Lowenstam and Fitch1978; Lowenstam and Weiner, Reference Lowenstam and Weiner1989; Pracheil et al., Reference Pracheil2019). The vaterite would thus seem to have a clear-cut functional advantage in the asteriscus, but we have no idea what that may be. Experiments have been performed to show that certain macromolecules extracted from otoliths are involved in polymorph determination (Falini et al., Reference Falini2005; Kalka et al., Reference Kalka2024; Tohse et al., Reference Tohse2009).
Biogenic single crystals of calcite: Compelling evidence for controlled nucleation
The echinoderms are renowned for being able to form large (even tens of centimeters long) single crystals of calcite that can have exceedingly complex structures that do not express the stable (104) ‘cleavage rhombohedron’ faces of inorganic calcite. The cleavage rhombohedron morphology is detected only in the first crystal nucleating in the center of the sea urchin larval spicule (Theel, Reference Theel1892). This first crystal has precisely controlled orientation and determines the calcite crystallographic orientation of the whole spicule (Wolpert and Gustafson, Reference Wolpert and Gustafson1961). Besides the Echinodermata, there are only few examples of the whole skeletal element comprising a single crystal. The best known, perhaps, are the foraminifera Patellina and Spirillina, which produce shells with complex spiral structures, but the whole shell diffracts X-rays as a single crystal of calcite (Towe et al., Reference Towe1977). The shells are about 100–200 μm in diameter (Figure 8).
The shells of the foraminifera (a) Patellina and (b) Spirillina are built as one continuous spiral. Each shell diffracts X-rays as one single crystal of calcite. Scale bars 100 μm. The images were taken from: (a) https://www.marinespecies.org/foraminifera/aphia.php?p=image&pic=76499&tid=113626. (b) https://www.marinespecies.org/aphia.php?p=image&pic=173563&tid=492628.

Aizenberg et al. (Reference Aizenberg2003) elegantly demonstrated how large single calcite crystal formation can be achieved in vitro. They prepared a substrate onto which they imprinted one nucleation site. They then covered the whole substrate with a thin layer of ACC. They monitored the crystallization of the ACC using birefringence and showed how a millimeter- sized single crystal of calcite propagated from the nucleation site (Aizenberg et al., Reference Aizenberg2003).
We do know that in the case of sea urchin larval spicules, there is indeed one single crystalline nucleation site from which the calcite crystal propagates into a preformed membrane-confined ACC deposit (Beniash et al., Reference Beniash1997; Beniash et al., Reference Beniash1999). We presume that in adult echinoderms that produce much larger skeletal elements composed of a single crystal, the same mechanism is operative. In some cases, such as in the ‘vertebrae’ ossicles that are part of the brittle star articulated arms, the large and morphologically complex skeletal element is composed of just two single crystals and the plane separating the two crystals is aligned with the overall symmetry of the skeletal element (Figure 9). This clearly demonstrates exquisite control over nucleation. And we guess that control over nucleation is also the strategy used by the foraminifera, Patellina, and Spirillina.
(a) One of the ossicles (vertebrae) that make up the vertebral column of the brittle star Ophiocoma wendtii which has long, flexible arms (inset). Each vertebra consists of two single crystals of calcite whose orientations are correlated by a mirror plane. The dashed red line shows the interface between the two crystals. (b) The orientations of the two crystals composing the vertebra in (a) are revealed here by overgrowth of calcite crystals on the ossicle. The calcite crystals that grow epitaxially on the ossicle have the typical rhombohedral morphology shown on the top part of the picture, where c and a* are the crystal axes that define the crystal orientation. The orientations of the crystals overgrown on the two halves of the ossicle, represented by the yellow and green schematized morphologies in the bottom part of the picture, are related by a mirror plane. Inset: brittle star O. wendtii specimen.

Echinoderm skeletal formation certainly conforms with the need for both a preformed ACC entity and a well-defined nucleation site for controlling crystallization. In this case the nucleation surface is a single crystal of calcite.
Carbonated apatite formation in chiton teeth
In the early 1960s, Heinz Lowenstam noticed that the surfaces of the rocks in the intertidal zone of a beach in Bermuda had unusual chevron-shaped grooves. He then noticed that the animals responsible for producing these grooves were chitons, mollusks of the class Polyplacophora (Figure 10a) (Aspaturian, Reference Aspaturian1991). He later discovered that some of the teeth located on the tongue-shaped radula organ (Figure 10b) were capped with a very hard black mineral (Figure 10c), which he demonstrated is the iron oxide mineral, magnetite (Lowenstam, Reference Lowenstam1962). This hard outer layer enables the chitons to scrape the rock surfaces and extract the embedded algae. Lowenstam also recognized the enormous potential that the tooth rows along the radula provide for investigating the dynamic mineralization process, as the radula functions as a sort of conveyor belt (Lowenstam and Weiner, Reference Lowenstam and Weiner1989) (Figure 10c,d). The mature teeth are continuously discarded at one end and are formed at the other end. Thus, each row has teeth that are at a different stage of formation. It was later determined that tooth rows are discarded at a rate of one row every 12 to 48 hours, depending upon the species. Thus, each row represents approximately 0.5 to 2 days of tooth formation (Kirschvink and Lowenstam, Reference Kirschvink and Lowenstam1979). Although there are differences in the stages of tooth formation between species, in general, the first 10 or so rows are involved in constructing the α-chitin protein-rich organic framework of the tooth (Kirschvink and Lowenstam, Reference Kirschvink and Lowenstam1979), and then the mineral is introduced into the framework. The end result is a tooth with an outer very hard mineralized layer of magnetite, and one or two inner layers with other minerals (Figure 10d). For more details, see (Lowenstam and Weiner, Reference Lowenstam and Weiner1989; Joester and Brooker, Reference Joester, Brooker and Faivre2016).
Chiton radula. (a) Specimen of a chiton Acanthopleura loochooana dorsal side (left)and ventral side (right). (b) Schematic representation of the chiton mouth with the radula. The images in (a) and the schematic representation in (b) were adapted from Sun et al. (Reference Sun2023). (c) Optical microscope image of the radula of the chiton Acanthopleura haddoni, with tens of tooth rows. Each row has two mineralized teeth in the process of maturation. The teeth on the right side of the image are transparent because they are not yet mineralized. Mineralization starts in this image in the 8th row of teeth from the right, and progresses from row to row toward the left side of the image. The teeth become more and more opaque with increasing mineralization. (d) Scanning electron micrograph of five mineralized teeth. The earlier formed mineralized tooth on the right is marked by an asterisk. The mature teeth are spoon-shaped objects where the cap and external lining of the convex part contain magnetite. The concave part (not visible in this image) contains carbonated apatite.

In a seminal study, Towe and Lowenstam (Reference Towe and Lowenstam1967) discovered in the species Cryptochiton stelleri that the first mineral deposited in the outer layer was a highly disordered hydrated iron oxide (ferrihydrite), and that after 2–5 rows (equivalent to roughly 2–5 days of formation), this initial mineral phase transformed into crystalline magnetite. This was the first documentation of the formation of a disordered precursor mineral phase; a process that is now known to be the norm for almost all biologically produced solid phases, both inorganic and, from the little we know, also organic phases (Weiner and Addadi, Reference Weiner and Addadi2011; Xu et al., Reference Xu2025) (Figure 11).
(a) Magnetite (Fe3O4) crystal structure (Fleet, Reference Fleet1981). (b) Ideal crystal structure of ferrihydrite Fe10O14(OH)2.nH2O (Michel et al., Reference Michel2007). Ferrihydrite in nature is a poorly crystalline iron oxyhydroxide mineral. In C. stelleri, ferrihydrite is a magnetite precursor. Because the two structures are very different, the transformation probably involves reprecipitation. The H atoms are absent in the structure of ferrihydrite because they were not detected. Fe atoms are in brown.

In a follow-up study, Lowenstam and Weiner used infrared spectroscopy to monitor the stages of formation of the inner tooth layer of the chiton species Acanthopleura haddoni, which in the mature tooth is composed of crystalline carbonated hydroxyapatite (dahllite) (Lowenstam and Weiner, Reference Lowenstam and Weiner1985). They took advantage of the fact that iron oxide and hydroxide minerals of the outer two tooth layers absorb poorly in the infrared region of 800–500 cm−1. This region includes an absorption peak that in amorphous calcium phosphate (ACP) is rounded and broad, but as ACP crystallizes into carbonated apatite, the peak splits (Figure 12). The extent to which the peak splits reflects the degree of crystallinity (Termine and Posner, Reference Termine and Posner1966; Weiner and Bar-Yosef, Reference Weiner and Bar-Yosef1990). They could thus dissect out a mineralized tooth in sequential rows and, without any preparation process, except for mechanical grinding, obtain an infrared spectrum. By studying row after row, they showed that amorphous calcium phosphate (ACP) began accumulating in row 10 and remained as an amorphous/disordered phase until row 23 when the ACP began to crystallize. By row 60, it reached its maximum degree of order. We note that Lee et al. (Reference Lee2000) could not detect an ACP phase in the species (Lee et al., Reference Lee2000) Acanthopleura echinata using Raman spectroscopy. They, however, prepared the teeth following a method that involves dehydration, embedding, grinding, and polishing (Macey and Brooker, Reference Macey and Brooker1996); methods that could have resulted in the loss of the more soluble and less stable ACP phase.
Fourier Transform Infrared spectra of (a) synthetic amorphous calcium phosphate (ACP), and (b) carbonated hydroxyapatite (archaeological). Note that in the ACP spectrum, the peak at 561 cm-1 is not split, whereas in the crystalline carbonated hydroxyapatite, it is split into two peaks at 604 and 565 cm-1. This is the transformation monitored in the chiton tooth inner layer (Lowenstam and Weiner, Reference Lowenstam and Weiner1985). The spectra were reproduced from the library of infrared spectra of the Kimmel Center for Archaeological Science, Weizmann Institute of Science (http://www.weizmann.ac.il/kimmel-arch/infrared-spectra-library).

The observations of Lowenstam and Weiner (Reference Lowenstam and Weiner1985) are not only consistent with those of Towe and Lowenstam (Reference Towe and Lowenstam1967) that also shows a precursor phase for the magnetite, but they beg the question of what could trigger the onset of crystallization in row 23. A possible clue can be obtained from the study of the chiton Acanthopleura hirtosa (Saunders et al., Reference Saunders2009). They used a focused ion beam-scanning electron microscope (FIB-SEM) to extract thin wafers (800 nm thick) from mature teeth and then examined these wafers in the TEM. They were not able to detect discrete shapes for the apatite crystals, but describe ‘small (<100 nm) grains with no distinct morphology and random orientation.’ Distinct elongated textures are visible, however, raising the possibility that the crystals may be thin plates observed edge-on. At the interfaces between the outer magnetite layer, the middle oxyhydroxide layer, and the inner apatite layer, the crystals from one layer interpenetrate into the adjacent layer. Thus, there is no hermetic compartmentalization of the three layers by the pre-formed organic matrix framework. Furthermore, at the interface between the crystalline middle oxyhydroxide layer and the apatite layer an approximately 200 nm thick layer of ACP is present. Interestingly, Saunders et al. (Reference Saunders2009) point out that ‘Analysis of the diffraction data from the amorphous region shows that the maximum intensity in the first amorphous ring, corresponding to the most probable nearest neighbor atom spacing in the interface phase, is at 0.31 nm. This is the first spacing that is common to both the lepidocrocite (iron hydroxide mineral at the interface) and apatite structures and matches the {101} lepidocrocite spacing that repeats along the length of the lepidocrocite needles.’ We therefore raise the possibility that the lepidocrocite crystals, once in place, trigger the crystallization of the ACP into carbonate hydroxyapatite. We do not understand, however, why a thin layer of ACP still remains.
We thus learn from the chiton tooth that the ACP phase must be stable enough to exist for some 13 days but unstable enough to be able to crystallize when it comes into contact with an ordered substrate. Lowenstam and Weiner (Reference Lowenstam and Weiner1985) noticed that there is a rough alignment of the carbonate apatite crystal c-axes with elongated elements of the organic matrix, and they suggested that the matrix may be responsible for nucleation. Furthermore, some chiton species produce fluoridated carbonate hydroxyapatite (francolite), whereas others do not incorporate fluoride (Joester and Brooker, Reference Joester, Brooker and Faivre2016). Clearly, the composition of the disordered precursor phase is genetically controlled. So, the scenario of a tailored disordered precursor phase and a nucleating substrate best fits the formation process of this inner chiton tooth layer.
Carbonated apatite formation in bone
Since the 1960s, there has been a longstanding debate as to whether in mature bone the mineral is present in one or two phases: a disordered ACP phase and a poorly crystalline carbonated apatite phase, or only a disordered but crystalline phase (reviewed in (Glimcher, Reference Glimcher1984)). The consensus was, and still is, that in mature bone only one relatively disordered, but crystalline phase is present. The crystals of mature bone are so small (plates that are on average 500 long x 250 wide x 2-4 nm thick (Weiner and Price, Reference Weiner and Price1986) that many of the atoms are at the surface or just below the surface, resulting in inherent disorder and diffraction peak broadening, and in addition, many of the phosphate groups are replaced by carbonate groups (LeGeros, Reference LeGeros2002). Both these phenomena introduce disorder. In 2010, Mahamid et al used synchrotron microbeam X-ray diffraction, SAXS, and cryo-electron microscopy to demonstrate that ACP is the precursor phase in zebrafish fin bone formation (Mahamid et al., Reference Mahamid2010). Beniash et al showed that in mammalian tooth enamel, the relatively large carbonate apatite crystals are formed via a disordered precursor phase (Beniash et al., Reference Beniash2009). The presence of an ACP precursor phase in bone has been confirmed (Querido et al., Reference Querido2020). Thus, ACP precursor phases are involved in bone, enamel, and chitin tooth carbonated hydroxyapatite formation.
One conundrum in bone mineral formation is that the hydroxyapatite crystal has hexagonal symmetry (Figure 13). In mature bone, however, the crystal morphology does not reflect the symmetry of the crystal structure; the crystals are plate-shaped with the hexagonal c-axis parallel to the long axis of the plate. It must be emphasized that in mature bone, the crystals are not hydroxyapatite, but carbonated hydroxyapatite, where a substantial number of the phosphate groups are replaced by carbonate groups. Significantly, when carbonated hydroxyapatite is produced in vitro, the crystals are plate-shaped (Legeros et al., Reference Legeros1967). This contrast between structure and morphology led to the proposal that octacalcium phosphate (OCP) is an intermediate crystalline phase on the pathway from ACP to mature carbonated apatite formation (Brown and Chow, Reference Brown and Chow1976; Brown et al., Reference Brown1987). This proposal is supported by analytical measurements (Raman spectroscopy) (Crane et al., Reference Crane2006).
Crystal structures of OCP and of apatite. The apatite structure is hexagonal (c is the hexagonal axis) and crystallizes synthetically as hexagonal prisms elongated in the c direction. The hydroxyls and the carbonates in the structure of biogenic carbonated hydroxyapatite. (Ca10-x(PO4)6-x(CO3)x(OH)2-x) are not represented because they were not detected (Posner et al., Reference Posner1958), and their positions are not well defined. The OCP (Ca8H2(PO4)6.5H2O) structure (Mathew et al., Reference Mathew1988) has no symmetry besides translation. It is composed of layers with a structure identical to that of apatite alternating with hydrated layers parallel to the bc plane. The hydrated layer is shaded here in light blue to differentiate it from the apatite-like layers on both sides. As expected from inspection of the structure, OCP crystallizes from water as thin plates with the large face parallel to the bc plane. The water hydrogens are colored pink. The ionic bond network between Ca ions and phosphate O is represented by thin grey lines.

OCP has a primitive P-1 structure, in which layers that are identical to the hydroxyapatite structure alternate with hydrated layers along the bc plane (Figure 13). Because of the lack of symmetry and of the weaker interactions across the hydrated layer, OCP crystallizes from water as thin platelets with the plate face parallel to the bc plane. It thus makes sense that OCP crystallizes from the initial ACP phase, forming thin plates, and then OCP transforms by dehydration into carbonated hydroxyapatite, preserving the platy morphology.
There is, however, another possible way in which the platy morphology can be obtained. The first-formed disordered mineral (ACP) is presumably introduced into spaces inside the pre-formed organic matrix composed mainly of Type I collagen, as has been demonstrated in vitro (Nudelman et al., Reference Nudelman2012). Crystallization takes place within the collagen fibril and possibly on the surface of the collagen fibril. The crystals are oriented with their c-axes aligned roughly with the long axis of the collagen fibril. It has been proposed that this preferred orientation is due to the shape of the preformed spaces that exist in the structure of all collagen fibrils (Katsura et al., Reference Katsura, Suga and Nakahara1991; Xu et al., Reference Xu2020), whether they are part of bone or not, namely, very thin (about 1.5 nm) elongated grooves. The grooves have the shape and dimensions that are similar to the initially formed plate-shaped crystals, and as the crystals grow in thickness, they compress the collagen triple helical molecules separating adjacent grooves (Bonar et al., Reference Bonar1985). Thus, just the shape of the grooves and the anisotropic growth of the crystals along the c-axis could be sufficient to produce oriented plate-shaped crystals. We note that there is no additional electron density in the grooves that could indicate the presence of a nucleating molecule.
In summary, it appears nowadays that bone mineral formation, at least within collagen fibrils, best fits the scenario in which a tailored ACP precursor phase is introduced into the confined volume (groove), where it crystallizes, probably via a transient intermediate crystalline phase (OCP), without the apparent presence of a specific nucleation substrate. We also note that the shape and orientation of the crystals in mature bone are quite different from the crystals in the chiton tooth carbonate apatite layer, which are described by Saunders et al. (Reference Saunders2009) as having no distinct shape or orientation.
Tailored ACP phases
In a survey of stable biogenic phosphate minerals formed by marine invertebrates, Lowenstam identified 16 marine species from 5 different phyla that form phosphate minerals (Lowenstam, Reference Lowenstam1972). Only one class, the inarticulate brachiopods, forms crystalline carbonate hydroxyapatite. All the others produced no X-ray diffraction, and these minerals were described as being amorphous hydrogels. Lowenstam heated these samples to 500 °C and then used X-ray diffraction to analyze the resulting crystalline mineral. He identified among the crystalline products carbonated hydroxyapatite (dahllite), brushite, whitlockite, and francolite. These observations show that the stable ACP phases produced by different organisms are different, possibly in minor elemental contents, in addition to the major calcium and phosphate components. It is conceivable that the organisms are tailoring their stable ACP phases.
Additional evidence for tailoring of stable ACP phases was obtained using both EXAFS and XANES absorption spectra to study ACP granules in the hepatopancreas of the terrestrial snail Helix aspersa and the marine crab Cancer maenas. In both cases, the ACP phase is hydrated, and the water is bound to calcium in the first hydration sphere. Interestingly, the XANES spectra point to the major anion in the ACP granules of the crab being in an environment similar to calcium orthophosphate, whereas in the snail, the anion in the granules is in an environment similar to calcium pyrophosphate (Simkiss et al., Reference Simkiss1990).
Molecular crystals
The term ‘molecular crystals’ refers to crystals that are either entirely or partly composed of organic molecules. A common example of the former among the crystals formed by organisms is guanine, and an example of the latter is calcium oxalate monohydrate or dihydrate (whewellite and weddellite). In fact, Lowenstam and Weiner (Reference Lowenstam and Weiner1989) listed 12 such biologically formed molecular crystals, including calcium citrate, calcium tartrate, calcium malate, various oxalates, sodium urate, uric acid, and various hydrocarbons.
For lack of a better definition, we include the biologically formed molecular crystals under the broad definition of biomineralization. The issues and questions that arise with biogenic molecular crystals around polymorphism or the presence of amorphous and transient phases are, in fact, similar if not identical to those discussed above regarding inorganic crystals produced by organisms. The molecular and crystal structures in molecular crystals are more diverse and anisotropic than those of inorganic crystals, both in geometry and the variety of intermolecular interactions, such that their crystal structures are determined in three dimensions by a delicate balance among geometry, symmetry and interactions. Examination of their polymorphism within the scope of biomineralization provides useful information about stability in biological environments, functionality, or lack thereof.
Molecular crystals fulfilling optical functions
Molecular crystals fulfilling optical functions are not widespread in biomineralization, but they occupy a special niche, where their molecular and structural properties, and in particular, their high refractive indices, are taken advantage of in biology (Addadi et al., Reference Addadi2024). The combination of electron-rich aromatic or quasi aromatic molecules, forming planar H-bonded molecular layers or molecular ribbons that have high polarizability, and are stacked in the third dimension in a very anisotropic structure, is the source of the high refractive index of the crystals.
Anhydrous guanine crystals are frequently used by animals to fulfill optical functions. Guanine crystals are responsible for the structural colors in fish scales, in spiders, and in copepod cuticles, and are even used to control the color of angry chameleons (Denton and Land, Reference Denton and Land1971; Chae and Nishida, Reference Chae and Nishida1994; Teyssier et al., Reference Teyssier2015; Gur et al., Reference Gur2017). Guanine crystals with different morphologies are used to form concave mirrors in the eyes of scallops (Land, Reference Land1965) and in the vision apparatus of fish (Wagner et al., Reference Wagner2009).
Crystals of anhydrous guanine exist in at least two polymorphs, which are in fact polytypes, meaning that the structure in the plane of hydrogen-bonded molecules is the same in the two polymorphs. The only difference between the two structures is in the symmetry operation relating the stacking of planes in the third dimension (Figure 14) (Hirsch et al., Reference Hirsch2015). Most significantly, all the biogenic guanine crystals have the β-structure, while the synthetic crystals generally assume the α-structure. Crystals in the β-structure were obtained synthetically, but only under specific conditions (Guo et al., Reference Guo2023; Alus et al., Reference Alus2024; Indri et al., Reference Indri2025; Brenman-Begin et al., Reference Brenman-Begin2026). The α-structure is marginally thermodynamically more stable than the β-structure, but despite this was never observed in biology (Hirsch et al., Reference Hirsch2015). Notwithstanding the recent successes in obtaining the β polytype synthetically, it is difficult to understand by which means the biological environment induces this polytype, and why it is favored in so many different settings.
α and β structures of anhydrous guanine. Top: structural formula of guanine. The structure of the H-bonded network in the bc plane, represented in the top images, is identical. The stacking of the planes occurs by operation of a glide plane along the c axis for the α structure and along the b axis for the β structure. The effect of this operation on the stacking can be seen in the bottom images, where the H-bonded layers, seen edge-on in the ac plane, are staggered along the c axis in the α structure. In the β structure, staggering of the planes occurs along the b axis. The effect of the glide planes in the different directions may also be seen from the profiles of the unit cells.

Crystals of xanthine also form three polytypes with the same structure in the planes of H-bonded molecules (Ifliand et al., Reference Ifliand2025). In the three polytypes, each H-bonded plane is related to the next by a b-glide, a c-glide, or an n-glide, respectively (Figure 15). The biogenic crystals extracted from the eye of the jumping bristletail (an insect) have the structure of the polytype characterized by a b-glide. In the synthetic crystals, the structure of the polytype characterized by a c-glide was first determined, followed later by the detection of other polytypes (Figure 15) (Hughes et al., Reference Hughes2025; Leung et al., Reference Leung2025). Biogenic xanthine crystals are only known, so far, from this insect, so we do not know how general this observation is.
Xanthine crystal polytypes with predicted and verified structures. Top: structural formula of xanthine. (a) The structure in the H-bonded cb layer is identical in all three polytypes. (b) The biogenic polytype of space-group Cmcb, where superimposed planes are related by a glide plane along the b axis. (c) The synthetic polytype of space-group Bmcb, where superimposed planes are related by a glide plane along the c axis. (d) The synthetic polytype of space-group Imcb, where superimposed planes are related by an n glide plane along the diagonal of the unit cell.

Both guanine and xanthine biogenic and synthetic polytypes have practically the same refractive indices, and thus the same reflectivity and the same optical properties. In fact, the calculated refractive index of the biogenic polytype is the lowest of the three polytypes. The polytype used for biological purposes cannot, therefore, be due to improved optical properties.
The crystals that function as multilayer reflectors, either to produce structural colors or to concentrate light for better vision, need to form stacked crystal columns. In these columns, each crystal is a thin plate exposing the crystal face with the highest refractive index to the impinging light rays. Groups of prismatic crystals scatter light rather than reflecting light in one direction. It could thus be conceivable that if the biogenic crystal polytypes of guanine and xanthine adopt the plate-like morphology that is advantageous for their function of reflecting light, compared to the synthetic polytypes, a functional preference based on morphology could be operative in biology. Indeed, the guanine crystals in the β-polytype fulfilling optical functions do mostly crystallize as very thin plates (Figure 16a,b), whereas the synthetic guanine crystallizing from water in the α-polytype assumes a prismatic morphology (Figure 16c). The same holds for xanthine, where the biogenic crystals form as thin plates, and the synthetic crystals form from water as prisms (Figure 16e,f). However, the biogenic guanine crystals that scatter light extracted from the matt-white colored spider Latrodectus pallidus (Levy-Lior et al., Reference Levy-Lior2010), as well as those extracted from the dinoflagellate Calciodinellum operosum (Jantschke et al., Reference Jantschke2019) and from the unicellular green alga Phacotus lenticularis under stress (Shaked et al., Reference Shaked2025) have prismatic morphologies, and yet they assume the β-structure (Figure 16d). In addition, the theoretical growth morphology predicted for both α and β-structures is prismatic, and α-guanine crystallizes from some solvents, such as DMSO, as thin plates. We conclude that for guanine and xanthine crystals, there is no apparent reason for organisms to prefer the biogenic polymorph to the synthetic one based on functional, optical, and morphological considerations.
Anhydrous guanine and xanthine crystal morphologies. (a), (b) Biogenic β-guanine crystal platelets. The crystal in A) was isolated from a zander fish eye. (b) Edge-on view of a stack of crystals from an iridophore cell of a Neon Tetra fish scale. (c) Synthetic α-guanine crystal prisms crystallized from 80% water/20% DMSO. (d) Biogenic β-guanine crystal prisms isolated from the matt-white colored spider L. pallidus (Levy-Lior et al., Reference Levy-Lior2010). (e) Biogenic β-xanthine platelets from a TEM micrograph of crystals extracted from the jumping bristletail insect Lepismachilis rozsypali (Friedman et al., Reference Friedman2022). (f) Synthetic xanthine crystal prisms.

The same conclusion does not hold for isoxanthopterin, a quasi-aromatic pteridine molecule with high electron density, similar to the purines guanine and xanthine. The biogenic structure of isoxanthopterin is characterized by planes of H-bonded molecules common also to guanine and xanthine crystals (Figure 17a) (Palmer et al., Reference Palmer2018). The crystal structure of the synthetic polymorph in the H-bonded planes, in contrast to the biogenic one, consists of molecular ribbons that interdigitate, forming an undulated plane (Figure 17b). The refractive indices of the biogenic polymorph are slightly higher than those of the synthetic polymorph, which could conceivably be a reason for its use for optical purposes (Hirsch et al., Reference Hirsch2019).
Biogenic and synthetic isoxanthopterin crystal structures. Top: structural formula of isoxanthopterin. (a) The crystal structure of biogenic isoxanthopterin molecules H-bonded in the bc plane (top) and three planes of H-bonded molecules viewed almost edge-on down the b axis (bottom); the stacked layers of the H-bonded quasi-aromatic molecules are completely flat. Consequently, the refractive indices in the plane are very high (n > 2), and the crystals have high reflectivity. (b) The crystal structure of synthetic isoxanthopterin molecules H-bonded in the bc plane (top) and two planes of H-bonded molecules viewed almost edge-on down the c axis (bottom); the stacked layers are undulating, such that the refractive indexes and the reflectivity are lower.

In the crustacean decapod eyes (crayfish, shrimps, prawns), the isoxanthopterin thin crystal plates assemble into spherical core-shell nanoparticles made of concentric lamellae, which function as very effective light scatterers (Figure 18a,b) (Palmer et al, Reference Palmer2018). This enables light missed by the receptors in the first pass to be used by the same receptors in a second pass after being backscattered by the nanoparticles.
Biogenic light scattering particles. (a), (b) Spherulites composed of layers of isoxanthopterin crystal thin plates arranged tangentially to the sphere and stacked around an empty core. The spherulite is fractured in (a) and intact in (b). These cryo-SEM-micrographs were taken from high-pressure frozen and freeze-fractured eyes of the shrimp Litopenaeus vannamei. The geometry of the spherulites is optimized to achieve high back scattering power (image taken from Schiffmann et al., Reference Schiffmann2020). (c) Prismatic crystals of 7,8-dihydroxanthopterin.

It is puzzling that the same back scattering function and geometry fulfilled by the isoxanthopterin complex particles in the crustacean eyes is fulfilled in the eyes of the zander fish by prismatic crystals of 7,8-dihydroxanthopterin (Figure 18c) (Zhang et al., Reference Zhang2019). The crystal structure of 7,8-dihydroxanthopterin consists of interdigitating ribbons, similar to those of synthetic isoxanthopterin, with refractive indexes much more isotropic, as is appropriate for a light scattering object (Zhang et al., Reference Zhang2019). Thus, biology uses for the same back scattering function in animal eyes, two substantially different solutions: the crustacean eyes evolved complex polycrystalline core-shell particles made of highly anisotropic crystals, whereas in the fish eyes, haphazardly assembled, isotropic prismatic single crystals are used. Furthermore, the zander fish have a mirror in the back of the eye that is made of guanine crystals. Guanine is an abundant molecule in the purine degradation pathway. In birds, it is a metabolic end product, hence the word ‘guanine’ is derived from guano, the waste product of birds. Guanine can crystallize in vitro and in vivo (Figure 16) in the form of prismatic crystals, a shape that corresponds in fact to the theoretically predicted morphology of guanine crystals. The prismatic crystals of guanine in the matt-white colored spider L. pallidus in Figure 16 have a light scattering function (Levy-Lior et al., Reference Levy-Lior2010). Yet, in the zander fish eyes, crystals of 7,8-dihydroxanthopterin are deposited, close to the site of formation of guanine crystals. Admittedly, 7,8-dihydroxanthopterin is also part of animal metabolism, but it is much less abundant than guanine. Not only is the crystal polymorph used in biology mysterious, but also the molecule used for forming the crystal.
Molecular crystals in single-celled eukaryotes
In a comprehensive survey using Raman microimaging of more than 200 species of many different single-celled eukaryotic phyla, it was discovered that 77% of the species have crystalline organic inclusions. Of these inclusions, the vast majority (80%) are anhydrous guanine, and the rest are guanine monohydrate, uric acid, and xanthine (Pilátová et al., Reference Pilátová2022). The functions of these crystals do not appear to be optical, but because these molecules are rich in nitrogen, it was proposed that they function as a means of nitrogen storage, nitrogen detoxification, or exposure to high levels of nitrates or ammonia (Pilátová et al., Reference Pilátová2022). In one case of a calcareous alga, it was demonstrated that the intracellular guanine crystals were produced as a response to stress (Shaked et al., Reference Shaked2025). Irrespective of the function of these molecular crystals, these studies show that molecular crystals are widespread in single-celled eukaryotes.
Pathological crystallization of cholesterol: Insights into possible triggers of crystallization and polymorph selection
In pathological crystallizations, including the pathological deposition of calcium oxalate crystal aggregates in the kidney (Wesson and Ward, Reference Wesson and Ward2007) or of sodium urate monohydrate in the joints (Rodriguez-Navarro et al., Reference Rodriguez-Navarro2024), crystallization is induced inside the organism, but there is no control over crystal formation. Consequently, there is no genetic programming involved to control the structure of the crystals that are formed. In this context, the pathological crystallization of cholesterol in humans provides interesting and unique insights into possible triggers of crystallization and of polymorph selection; the two themes of this review.
Cholesterol is an essential component of animal metabolism (Bukiya and Dopico, Reference Bukiya and Dopico2022). Cholesterol molecules, which have a vital physiological function in all cell membranes, may be pathologically deposited in the form of crystals of cholesterol monohydrate in the gallbladder, where the crystals may aggregate with bile acids, forming gallstones (Lambou-Gianoukos and Heller, Reference Lambou-Gianoukos and Heller2008). A more serious, and much more frequent pathology occurs when cholesterol monohydrate crystals deposit in the artery walls in atherosclerosis (Abela and Nidorf, Reference Abela and Nidorf2023). In fact, the word ‘cholesterol’ is derived from the Greek chole (=bile), and stereos (=stiff, solid), so cholesterol is defined as the solid material in bile. The origin of the word derives from the discovery of the cholesterol molecule around 1760 by Francois Poulletier de la Salle, a French chemist, when he isolated cholesterol crystals from gallstones (Chevreul, Reference Chevreul1823).
The keys to understanding crystallization and polymorph selection are in the structures (Figure 19). Cholesterol can crystallize in an anhydrous form, as a hemihydrate, or as a monohydrate (Varsano et al., Reference Varsano2022). Crystallizations within the body occur in an aqueous environment, where cholesterol crystallizes as a monohydrate, with two known polymorphs: the monoclinic polymorph and the triclinic polymorph (Figure 19). The crystals of the triclinic polymorph adopt the shape of rhomboid platelets (Figure 20a). The crystal structure of the triclinic polymorph was determined by Craven (Craven, Reference Craven1976) and was recently reanalyzed and optimized (Figure 19a) (Shepelenko et al., Reference Shepelenko2022). The shape and structure of the monoclinic polymorph (Figure 20b) proved to be a lot more enigmatic.
The two polymorphs of cholesterol monohydrate crystals viewed in the cb planes. (a) The triclinic structure; (b) the monoclinic structure. The unit cells are shown in the rectangles, and the scale is the same for both structures. The structural formula of the cholesterol molecule is juxtaposed to the structures to facilitate the understanding of the molecular orientation in the two structures, and the structural formula side by side with its color-coded image is reproduced at the top of the figure. The cholesterol molecule forms layers in the ab plane, with the molecules making hydrophobic contacts. Each layer contacts the neighboring layers through hydrophobic contacts on one side (highlighted in light orange), and hydrophilic contacts on the other (highlighted in light blue). Note that the hydrophobic contacts between the cholesterol terminal aliphatic chains are stronger in the triclinic structure in (a), where the side chains contact each other over a wide range, whereas in the monoclinic structure in (b) they are juxtaposed end to end. The water molecules are H-bonded to the hydroxyl moieties of the cholesterol molecules in the hydrophilic layer (shown in Figure 21).

Cholesterol monohydrate crystals in (a) the triclinic, and (b) the monoclinic polymorph. The helical ribbons in (b) are single crystals of cholesterol monohydrate. The image in (b) was reproduced from Zastavker et al. (Reference Zastavker1999).

In 1992, Chung et al described how filaments first formed and grew into helical ribbons (Figure 20b) (Chung et al., Reference Chung1992). These ribbons then transformed into the well-known cholesterol crystal rhomboid plates (Figure 20a). The same sequence of microstructures was subsequently reproduced in synthetic analogues of bile (Konikoff and Carey, Reference Konikoff and Carey1994).
Solomonov et al determined the structure of a monoclinic polymorph of cholesterol monohydrate formed under applied pressure in cholesterol monolayers and multilayers (Solomonov et al., Reference Solomonov2005). In parallel, Weihs et al detected by electron diffraction the same crystal polymorph in cholesterol ‘ribbon-like, transient crystals,’ nucleating from model and native gallbladder biles (Weihs et al., Reference Weihs2005). They also followed in time the subsequent transformation of the ribbon-like monoclinic polymorph into the stable rhomboid-shaped triclinic polymorph. The monoclinic polymorph structure was later optimized by Shepelenko (Figure 20b) (Shepelenko et al., Reference Shepelenko2022).
More than ten years after the discovery of Solomonov et al and Weihs et al, it was discovered that helical ribbons of cholesterol can be produced in macrophage cell cultures supplemented with cholesterol (Varsano et al., Reference Varsano2018). These experiments were performed while investigating macrophages as models for cholesterol crystal deposition in atherosclerosis. The motivation for performing such experiments was the following. The cholesterol function in animals is to regulate the fluidity of all cell membranes. Inside the cell membranes, the cholesterol molecules mix with lipids, mainly with saturated phospholipids, preventing them from segregating into two-dimensional crystalline domains. Ziblat et al. showed in model bilayer membranes that if the concentration of cholesterol in the membrane exceeds its solubility in the lipid mixture, cholesterol may segregate inside the bilayer membranes into cholesterol domains that have the structure of the monoclinic polymorph (Ziblat et al., Reference Ziblat2011). These membrane domains can template the formation of crystals of the monoclinic polymorph of cholesterol monohydrate, which assume the morphology of helical ribbons like those forming from bile acids, or may rapidly transform into the more stable triclinic polymorph (Varsano et al., Reference Varsano2019). The formation of such helical crystals was observed in model systems of phospholipid/cholesterol bilayers, with a pronounced preference for specific saturated phospholipid components, as well as in cultured macrophage cells supplemented with excess cholesterol from LDL particles (Varsano et al., Reference Varsano2019). An important observation was made by Varsano et al. who observed by electron imaging and diffraction that helical ribbons appeared to emerge from the cell membrane and determined that the ribbons were cholesterol monohydrate crystals with the structure of the monoclinic polymorph (Varsano et al., Reference Varsano2019). Thus, the metastable monoclinic polymorph crystal appears to nucleate by templating on a biological membrane and then grows and transforms into the stable triclinic polymorph. Why is the triclinic polymorph more stable? Why is crystallization of the metastable monoclinic polymorph favored? How does the transformation proceed?
The triclinic and monoclinic polymorphs have similar structures (Figure 19) consisting of layers of aligned cholesterol molecules, held together by hydrophobic interactions (detailed in Figure 19). Each layer interacts with the neighboring layer on one side through hydrogen bonds between the hydroxyl group hydrophilic heads and with water, and on the other side through hydrophobic interactions between their hydrophobic tails. In an aqueous environment, the cholesterol molecules in the crystals expose the hydrophilic hydroxyl groups to the water. The hydroxyl groups are the only hydrophilic groups in the molecule. In both polymorphs, the structure of one hydrophobic bilayer, delimited on the two sides by networks of hydroxyls and water molecules, resembles the structure of the bilayer membranes in cells (Shepelenko et al., Reference Shepelenko2022).
Thus, a key issue arises: the monoclinic structure has higher symmetry than the triclinic structure, but the triclinic structure is the most stable polymorph (Shepelenko et al., Reference Shepelenko2022). The formation of the metastable monoclinic polymorph from phospholipid bilayer membranes is apparently favored because of the interactions with the water molecules. In the monoclinic structure, the mixed hydroxyl/water network is similar to the hexagonal network of hydrogen bonds in crystalline water, that is in ice, and this complex is more stable than the hydroxyl/water network in the triclinic structure (Figure 21). This would account for the cholesterol domains in the phospholipid model membranes, and presumably in the cell membranes, preferentially assuming the structure of the monoclinic polymorph. The two-dimensional crystalline domains in the cell membrane would then subsequently template crystals of the monoclinic polymorph. Once the first crystal layers are formed, the cholesterol/water interactions at the hydrophilic surface become less prevalent, and the hydrophobic interactions in the bulk of the crystal dominate. These interactions are more stable in the triclinic polymorph than in the monoclinic polymorph (Figure 19), causing a single crystal to single crystal transformation of the monoclinic polymorph into the more stable triclinic polymorph (Addadi et al., Reference Addadi2023).
Cholesterol hydroxyl hydrogen-bond network with water molecules in the cholesterol monohydrate (a) triclinic, and (b) monoclinic crystal structures in the ab plane. The unit cells are shown in the center, and the scale bar is valid for both structures. For convenience, the oxygen atoms of water are colored in red and the oxygen atoms of the cholesterol hydroxyl groups in orange. In the monoclinic structure, the cholesterol hydroxyls can form with the water molecules a relatively stable hexagonal network similar to the water hexagonal network in ice, shown in the inset in (b). The ice-like network in the monoclinic structure is more stable than the hydroxyl/water network in the triclinic polymorph structure.

The biological relevance of the above observations is as follows. In atherosclerosis, cholesterol crystals are deposited in the human artery walls. The crystals, together with lipids and cellular debris, form aggregates that deposit inside the artery walls, giving rise to atherosclerotic plaques. Upon plaque rupture, the aggregate fragments are transported in the blood vessels and may cause brain strokes or heart attacks. The environment of cholesterol crystal deposition in the artery walls, and the reason for the presence of cholesterol in the arteries, are totally different from the environment of cholesterol in the gall, related to cholesterol excretion from the body. In the pathological crystallization of cholesterol in gallstones, as in the crystallization of calcium oxalate or uric acid in kidney stones, the stones form from metabolic waste products that the body is in the process of eliminating. In contrast, the presence of cholesterol and cholesterol trafficking in the arteries is essential to fulfill its physiological function in regulating the fluidity of all cell membranes in animals. To fulfill the physiological function, cholesterol and cholesteryl esters are transported in the blood by low-density lipoproteins (LDLs) and are delivered to the cells, where cholesterol is shuttled to the cell membranes or stored in lipid droplets. Excess cholesterol is removed from the cells by high-density lipoproteins (HDLs) (MacRae et al., Reference MacRae, Feingold, Adler and Ahmed2019). It has also been considered that cholesteryl esters of saturated lipids, such as cholesteryl palmitate or stearate, form layer structures akin to that of the monoclinic polymorph of cholesterol monohydrate. It was proposed that such structures, which are known to exist at the surface of lipid droplets formed in cells, may also nucleate monoclinic crystals of cholesterol monohydrate by epitaxy (Shepelenko et al., Reference Shepelenko2022).
It is interesting that the pathological deposition of cholesterol crystals in the human body is an example where we have a rational interpretation of how the crystals form and how the presence of one crystal polymorph over the other occurs, whereas in most examples in biomineralization, we do not have such insights. This may well be because there is no programmed biological control over crystallization in pathology. The cascade of events leading to crystal deposition is consequently subject to rules that operate also in the chemical and the physical synthetic domain, and that we understand much better than in the biological domain.
Discussion
Indeed, we can conclude that there are many more questions than answers! As questions lead to a better understanding, we start with a brief overview of some of the major open questions.
Very little is known with certainty about what controls the use of one polymorph over another, or about what determines the use of one solid phase over another in biomineralization, and this includes whether the solid phase is crystalline or amorphous, anhydrous or hydrated.
We now know that precursor phases are important and that these phases can be tailored. We do not know much about how they are tailored, nor where precursor phases form – inside cells or in the extracellular environment. Often, we do not even know at what stage during the formation process it is determined which polymorph or which phase will be formed.
We are puzzled by the fact that in most cases, the polymorph that is thermodynamically more stable would fulfill its functional role in the biomineralized tissue in the same manner as the less stable phase. So why in biology is one polymorph often consistently formed?
We are of the opinion that some answers to these open questions could be obtained if we had a better understanding of the microenvironment in which the solid phase forms. We know well that this occurs in a confined space (Lowenstam and Weiner, Reference Lowenstam and Weiner1989; Xu et al., Reference Xu2025), but we often have little knowledge of what exactly is in that confined space? What macromolecules, proteins, and carbohydrates are present, what small molecules are present, what is the ionic composition within these microenvironments, the pH, and much more? What are the roles of gel phases and membrane surfaces that are associated with at least some formation processes? We now elaborate on some of the issues described above.
Many, if not most, processes of biological mineralization involve the formation of a precursor phase that crystallizes to form the final crystalline mineral product. There is evidence that some precursor phases can be formed such that they already have the propensity to form the specific final product. So, polymorph specificity could be built into the precursor phase. The transformation of the precursor amorphous phase into a crystalline phase requires one or more nucleation events. As many of the crystalline phases have preferred orientation, which we assume arises from a nucleating surface, it is also possible that polymorph specificity is built into the nucleation step. We note, however, in the calcite/aragonite polymorph choice, that producing an anionic nucleating surface, such as the surface of an acidic nucleating protein that can induce only aragonite and not calcite formation, or vice versa, is conceptually very difficult, as the structures have almost identical calcium ion organization in the nucleation plane. So, specificity may be achieved by one or the other of the two options: precursor phase alone or together with nucleation. A third alternative is that there is built-in redundancy such that both approaches are operative and, in this way, the same polymorph is always formed irrespective of its stability.
We have presented evidence for some precursor amorphous phases in vivo having a nascent structure of calcite or aragonite. It has also been demonstrated in vitro that ACC can be produced with proto-vaterite and proto-calcite structures depending upon pH (Gebauer et al., Reference Gebauer2010). We have also presented evidence that, in vitro, some of the matrix macromolecules do have the ability to specifically induce aragonite to form, provided they are in the appropriate microenvironment. We do not know how widespread either of these options is in different biological mineralizing systems. We do, however, know that there are almost no examples of mixed polymorphs being present in a given mineralized structural unit, whereas this can occur in pathological systems, and certainly in non-biological systems, such as plaster and wood ash, where aragonite and calcite form together (Toffolo and Boaretto, Reference Toffolo and Boaretto2014). From this, we conclude that organisms are able to determine the specific polymorph to be formed with high fidelity.
In the Falini et al experiment (Falini et al., Reference Falini1996), specificity was only achieved in the presence of a gel phase, whereas no specificity was achieved in the presence of the adsorbed macromolecules only. We note that a mixture of macromolecules occluded inside the mollusk shell, including acidic proteins, proteoglycans, and glycosaminoglycans, was used together in the experiments, such that some macromolecules could have been active in the gel phase as well. This leaves open the possibility that a precursor phase with nascent order was formed in the gel phase and contributed to polymorph specificity (Kozell et al., Reference Kozell2026).
The possible functions of gel phases in mollusk shell formation are still enigmatic. Levi-Kalisman et al. (Reference Levi-Kalisman2001) thought of the gel as a filler that maintained the distances between organic matrix layers prior to the introduction of the mineral phase. It is also highly possible that the gel phase prevents calcium carbonate crystallization at low saturation levels, and thus allows ACC formation. We also note that water molecules in a gel phase are not organized as in liquid water. It is thus interesting to consider the possibility that the gel phase, together with the occluded macromolecules, may locally structure the water molecules in such a way as to promote ACC formation. On the other hand, ACC may be produced in one form or another in vesicles inside the cells associated with the mineralized tissue, and is then transported to the gel, where the ACC can undergo further structural transformations.
X-ray spectroscopic analyses showed both in biogenic calcite and in biogenic aragonite that the first-formed phase is hydrated and undergoes dehydration prior to crystallization (Addadi et al., Reference Addadi, Novoa, Braga and Addadi2008). It would thus appear that an initial ACC phase is transiently stabilized by structural water. The water is then somehow removed, generating a metastable anhydrous amorphous phase that has the short-range order typical of the crystalline phase, which finally crystallizes.
Some organisms produce ACC that is stable throughout their lifetimes, and this includes ACC-producing bacteria (Benzerara et al., Reference Benzerara2014). Three stable ACC phases produced in animals and in plants all have a stoichiometry of one calcium carbonate to one water molecule. This is the same in the crystalline calcium carbonate mineral monohydrocalcite. We assume that in both cases the water molecules in the structure are instrumental in the stabilization of the structure, although it is difficult to understand exactly how. The transient mineral phase of calcium carbonate hemihydrate has also been identified in vivo (Schmidt et al., Reference Schmidt2024). Considering the stable and transient ACC species, the calcium carbonate hemihydrate, and the crystalline monohydrocalcite, it appears that there are different hydration states of calcium carbonate, and the ability to easily separate and extract the water molecules determines the stability of the species. The water molecules that are closest to the Ca ion, in the first coordination shell, are expected to be more stable than the more mobile water molecules in highly disordered ACC. In the more disordered ACC, the water molecules are spread among closer and far-removed coordination shells, such that they are expected to be more easily removed. Whichever pathway these processes follow, it is clear that ‘amorphous calcium carbonate’ is a general name that covers many different species of ACC with different compositions and organization, especially of the water molecules.
Some deep insight into polymorph control was achieved in the investigations of the pathological processes involved in cholesterol monohydrate crystal formation in arteries and in the gall bladder. The first-formed polymorph is the monoclinic form, which transforms into the more stable triclinic form. There is a fascinating structural match between aspects of the monoclinic structure and the ordered surface of cell membranes, which could well induce specific nucleation of the monoclinic polymorph. So, it is perhaps not a coincidence that the thermodynamic laws of crystallization are more evident in a pathological situation and not in normal physiological situations, where biology somehow maneuvers around thermodynamics!
The absence of functional advantages is most evident in the case of the crystals of the purines guanine and xanthine, whose function is to reflect light as part of the vision apparatus of certain animals, or for the production of structural colors. The polymorphic crystals are very similar in structure, being in fact polytypes, that is having the same structure in the plane that determines the optical properties and differing in the plane juxtaposition. They consequently also have the same optical properties and very similar stability. The organisms show total fidelity in the use of one polymorph over another, whereas synthetically both polymorphs can be obtained, with preference in the case of guanine for the more thermodynamically stable polymorph, and in the case of xanthine for a different polytype than the biogenic one. The reason for the biological preference cannot be in the crystal morphology either, because the synthetic and biogenic polymorphs have very similar theoretical morphology. Intensive research is being performed with some success in several laboratories to determine in which environment and in the presence of which additives the biogenic polymorph may be systematically formed with the correct morphology (Guo et al., Reference Guo2023; Alus et al., Reference Alus2024; Indri et al., Reference Indri2025; Brenman-Begin et al., Reference Brenman-Begin2026).
For guanine and xanthine, the use of the molecular component of the crystals reflects an intrinsic aspect of the metabolism of the cells responsible for mineral formation. Both guanine and xanthine are byproducts of purine catabolism, and guanine is the final waste product in birds, guano, hence its name. Thus, the abundance of the molecules and their availability may be the reason why guanine is commonly formed for producing structural colors and manipulating light in vision. However, in biology, only the β polymorph is formed and not the α polymorph. Could this be because the conditions inside the vesicles in which guanine crystals form promote the one polymorph and not the other? Perhaps it is due to the way the initial phase of guanine, which has also been shown to be highly disordered, interacts with the inner membrane surface?
Perhaps the most exasperating aspect of understanding polymorph specificity in biomineralization is the almost total absence of evidence for functional advantages of one polymorph over another. There are exceptions. But the paucity of exceptions proves the rule – there do not seem to be obvious functional advantages for producing one polymorph over another. So, we should consider another possibility for polymorph specificity. During evolution, there was initially an advantage of forming one polymorph over another when a particular taxonomic group evolved, and then subsequently the system was ‘hard-wired’ for that polymorph and was not able to switch to a functionally more beneficial polymorph. The only option was to further adapt the same polymorph to changing functions. It is interesting to note that when most of the animal phyla first evolved in the early Cambrian, seawater had higher concentrations of phosphate, as inferred from the secondary diagenetic phosphatization process in Cambrian rocks (Cook and Shergold, Reference Cook and Shergold1984). This correlates with many of the phyla initially forming phosphatic mineralized tissues (Lowenstam and Weiner, Reference Lowenstam and Weiner1989). Most of these went extinct presumably because this was a major disadvantage when seawater phosphate levels decreased. Only groups within two major phyla continued to form phosphatic hard tissues: the inarticulate brachiopods and the vertebrates within the Chordata phylum (Lowenstam and Weiner, Reference Lowenstam and Weiner1989).
Conclusions
-
1. The formation of many biogenic solid phases may involve a complex interplay between the pre-defined properties of the transient disordered precursor phase and the structured surfaces involved in nucleation. This might lead to a redundancy in control that, in turn, could be responsible for the high fidelity by which a specific solid phase is used by most mineralizing organisms.
-
2. We puzzle over the fact that although the specific solid phase used is clearly under strict control, the functional benefits of forming one polymorph over another are usually not at all clear.
-
3. Pathological formation of cholesterol crystals involving cells and cell membranes appears to follow principles that relate substrate structure to nucleation and polymorph type.
Acknowledgements
We gratefully acknowledge the collaboration of many colleagues and students during the years, without whom this work would not have been possible.
Financial support
This research received no specific grant from any funding agency, commercial or not-for-profit sectors.
Competing interests
The authors declare none.


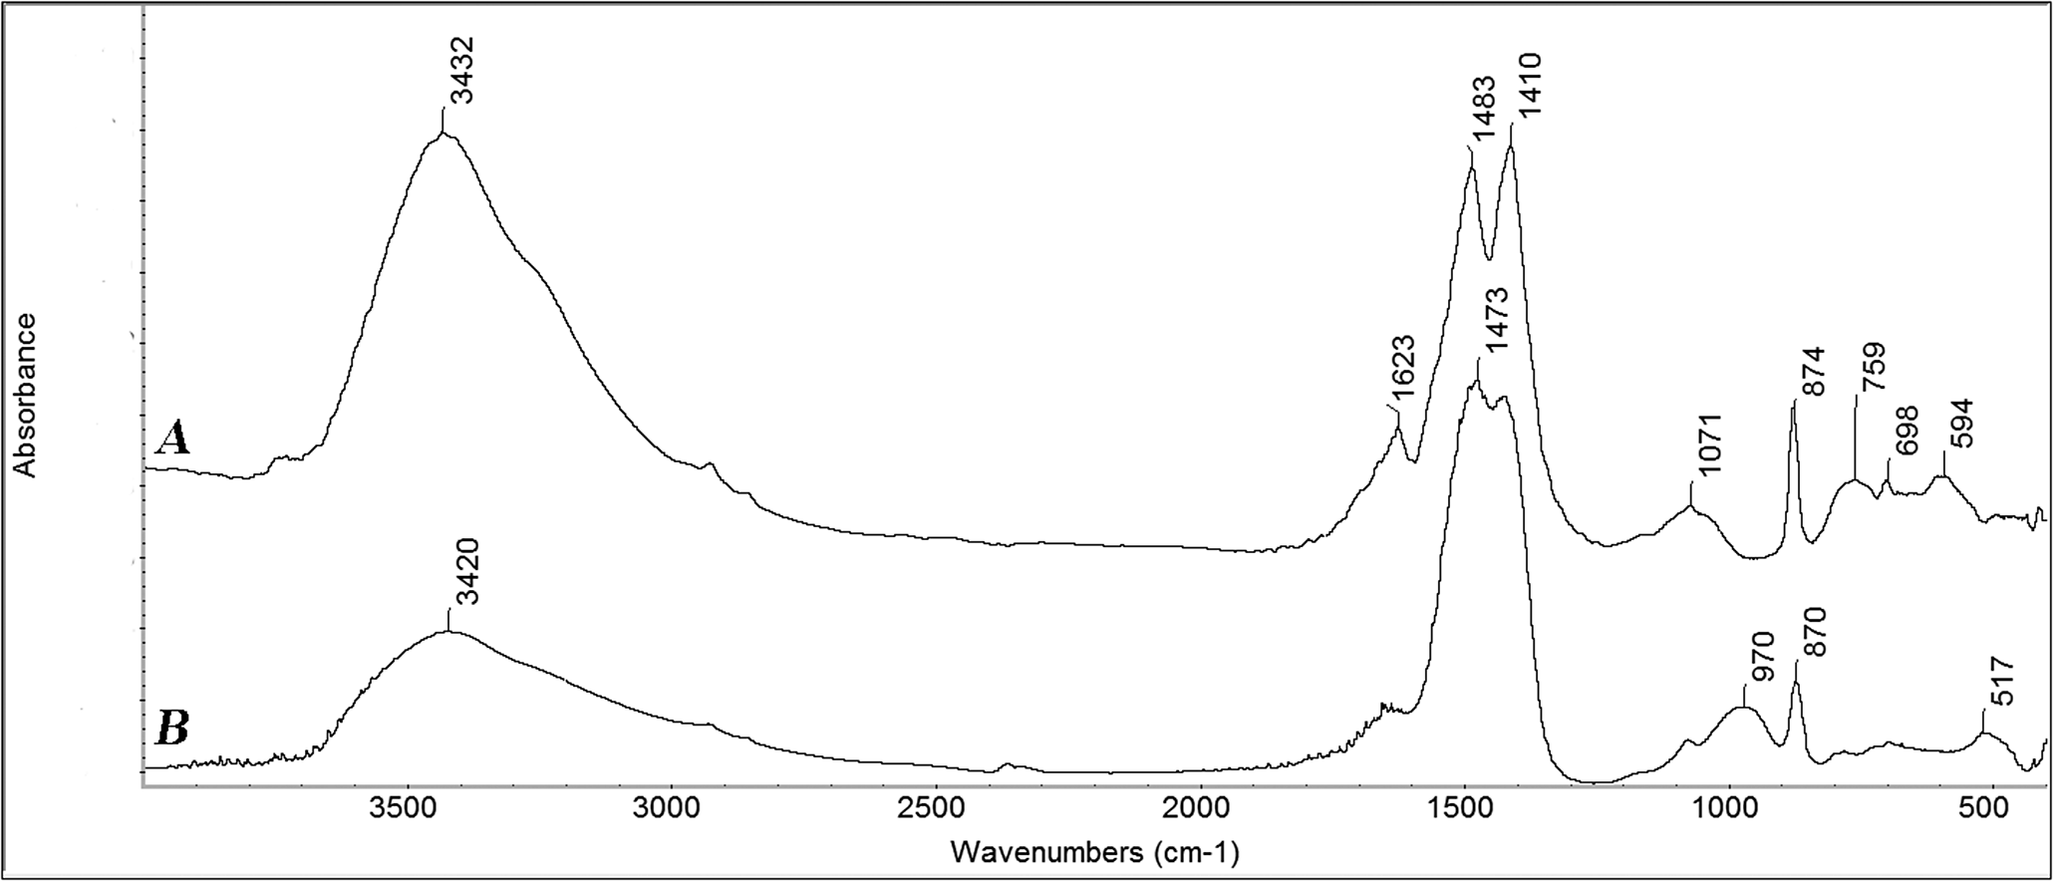


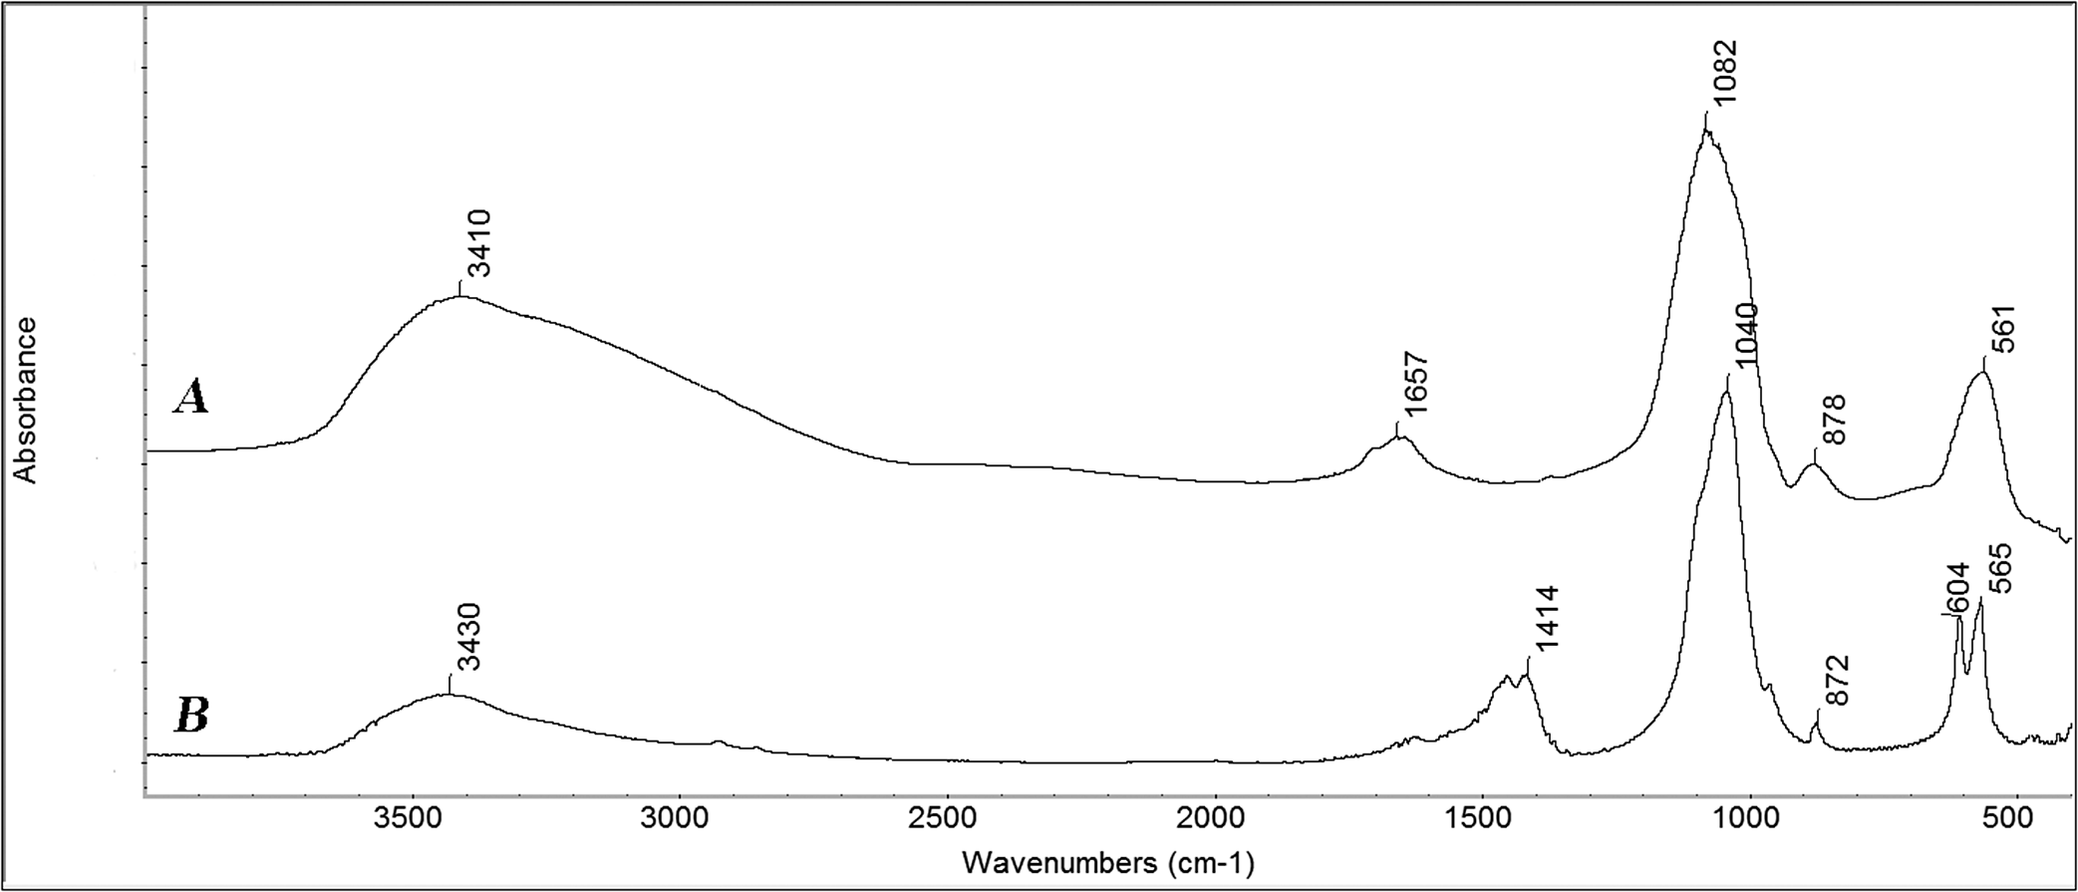


 Open access