

INTRODUCTION
The “governor’s residency” (Building 101) at Tel ‘Eton is a large and well-built structure whose construction involved massive preparations and quality building materials, including ashlar stones. The building was destroyed in the late 8th century BCE during an Assyrian military campaign, and the remains were sealed within a heavy destruction layer. This elite “four-room” dwelling was cleaned continuously during its existence, and the subsequent lack of raised floors made it difficult to date its construction and time of use. A number of radiocarbon (14C) dates from a foundation deposit and from the floors’ make-up, however, show that the building was built already in the 10th century BCE. The dating of the residency to the 10th century has two important contributions, one to the debate over the historicity of the contested United Monarchy of Kings David and Solomon (e.g., Finkelstein Reference Finkelstein1996; Finkelstein and Silberman Reference Finkelstein and Silberman2001; Bruins et al. Reference Bruins, van der Plicht and Mazar2003; Finkelstein and Piazetsky Reference Finkelstein and Piasetzky2011; Garfinkel et al. Reference Garfinkel, Streit, Ganor and Hasel2012, Reference Garfinkel, Streit, Ganor and Reimer2015; Mazar Reference Mazar2011, and see more below), and a second, much broader, by revealing the devastating impact of what we term here as the old-house effect on large-scale archaeological reconstructions.
The lack of evidence for public construction and state apparatus in the region of Judah before the 8th century, expressed for example by the total lack of ashlar construction, is one of the oft-quoted evidence against the historical plausibility of a kingdom centered in Judah. The building of the “governor’s residency,” along with other lines of evidence, suggests that the settlement at Tel ‘Eton was transformed in the 10th century BCE, lending important support to the historicity of the United Monarchy (which was supposed to have existed from some point in the beginning or first half of the 10th century to around 930 BCE). Notably, Building 101 also exhibits the earliest evidence for the use of ashlar stones in the region of Judah, and the mere erection of this edifice challenges one of the arguments against the historical plausibility of the United Monarchy (i.e., that ashlar construction appeared hundreds of years later).
Furthermore, the long life of the “governor’s residency”—some 250–300 years—serves as a cautionary tale regarding the unequal distribution of archaeological finds, and how some episodes (most notably destruction events) are disproportionally represented in the archaeological record. Some historical episodes will therefore result in gigantic amounts of finds, while hundreds of years of occupations will not only leave very limited tangible remains but these will usually receive very little scholarly attention. The old-house effect should therefore be considered before the absence of evidence is used as evidence in large-scale archaeological reconstructions. The second part of the article, therefore, briefly presents this effect and explains why formation processes (due to the impact of destruction events on the creation of the archaeological record)—not social complexity—are responsible for the relative rarity of Iron Age IIA finds in Judah. While only Iron IIA Judah is explicitly discussed, we note that the same effects can be seen in other epochs and regions.
TEL ‘ETON: BACKGROUND
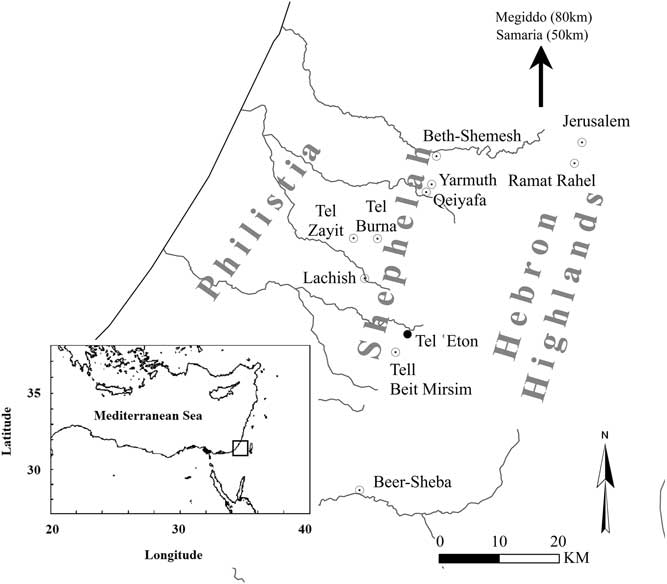
Tel ‘Eton is a large site, located in the southeastern part of the Judean Shephelah (foothills), Israel (Figure 1). The mound is situated at the edge of the trough valley which separates the hill-country and the lowlands, at an important crossroad. Since 2006 the site has been excavated by the current expedition (e.g., Faust Reference Faust2011, Reference Faust2014c, Reference Faust2016; Faust and Katz Reference Faust and Katz2015). It appears that the site was occupied in the Early Bronze Age (mid-third millennium BC), and this was followed by a hiatus during the Intermediate Bronze Age (2400–2000/1900 BC), and probably also during the Middle Bronze Age (2000/1900–1550 BC). Both survey data and excavations indicate that the site was quite large and significant during much of the Late Bronze Age (mainly its second part, i.e., roughly 14th–13th centuries BCE), but that the Iron I (roughly 12th–11th centuries BCE) settlement was smaller. Occupation expanded in the Iron Age IIA (roughly 10th–9th centuries BCE according to the Modified Conventional Chronology; Mazar Reference Mazar2005, Reference Mazar2011), and the large Iron II city that developed was destroyed by the Assyrian army in the late 8th century BCE (the end of the Iron IIB). Seventh-century remains were identified in the plain northwest of the mound (Sapir and Faust Reference Sapir and Faust2016), but settlement on the mound itself was resumed only in the 4th century when a fortified structure, surrounded by additional buildings, was established on its top. This settlement ceased to exist in the 3rd century BCE, and the mound was abandoned (Faust et al. Reference Faust, Katz and Eyall2015).
Location map of Tel ‘Eton and other sites mentioned in the text. (All figures courtesy of the Tel ‘Eton Archaeological Expedition.)
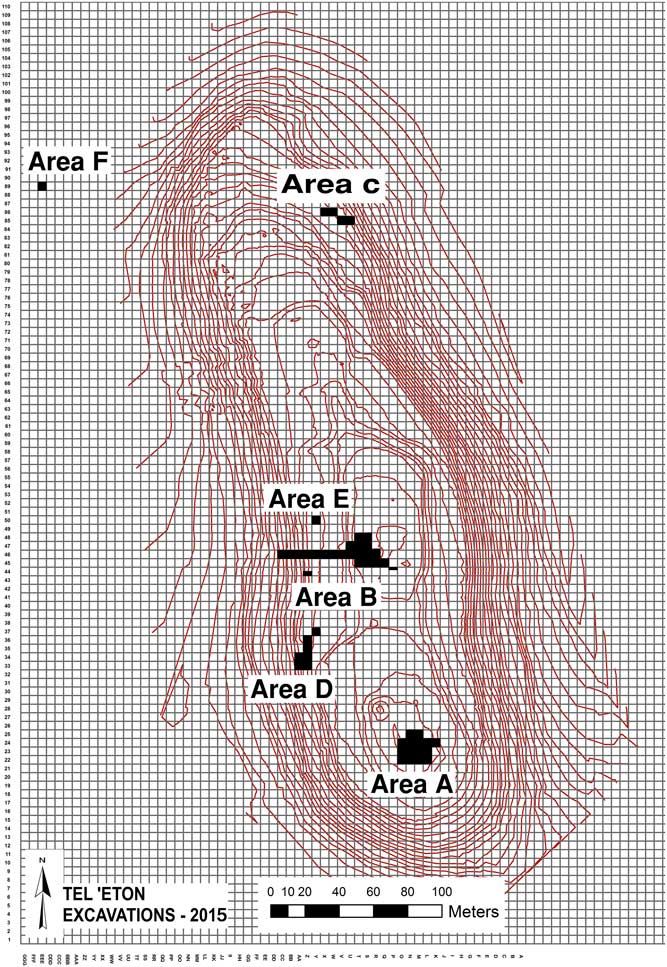
Given the massive and widespread destruction of the late 8th century BCE and its proximity to the topsoil, it is not surprising that this is the main level excavated so far, remains of which were unearthed—usually in a good state of preservation—throughout the site (Figure 2). The remains include parts of many buildings in Areas A, B, and D, as well as a few walls and an installation in Area C. City walls, that on the basis of both direct and circumstantial evidence functioned in this period, were unearthed in Areas C and D, and probably also B (where its dating is less secure). Among the major finds from this period is a large “four-room” residency unearthed at the top of the mound (Building 101), in Area A, and interpreted as the “governor’s residency” (Faust and Katz Reference Faust and Katz2017; Faust et al. Reference Faust, Katz, Sapir, Avraham, Marder, Bar-Oz, Weiss, Auman-Chazan, Hartmann-Shenkman, Sadiel, Vilany, Tserasky, Sarah, Ackerman, Timmer, Katz, Langgut and Benzaquen2017) (Figures 3 and 4).
Plan of Tel ‘Eton, with excavation areas marked.
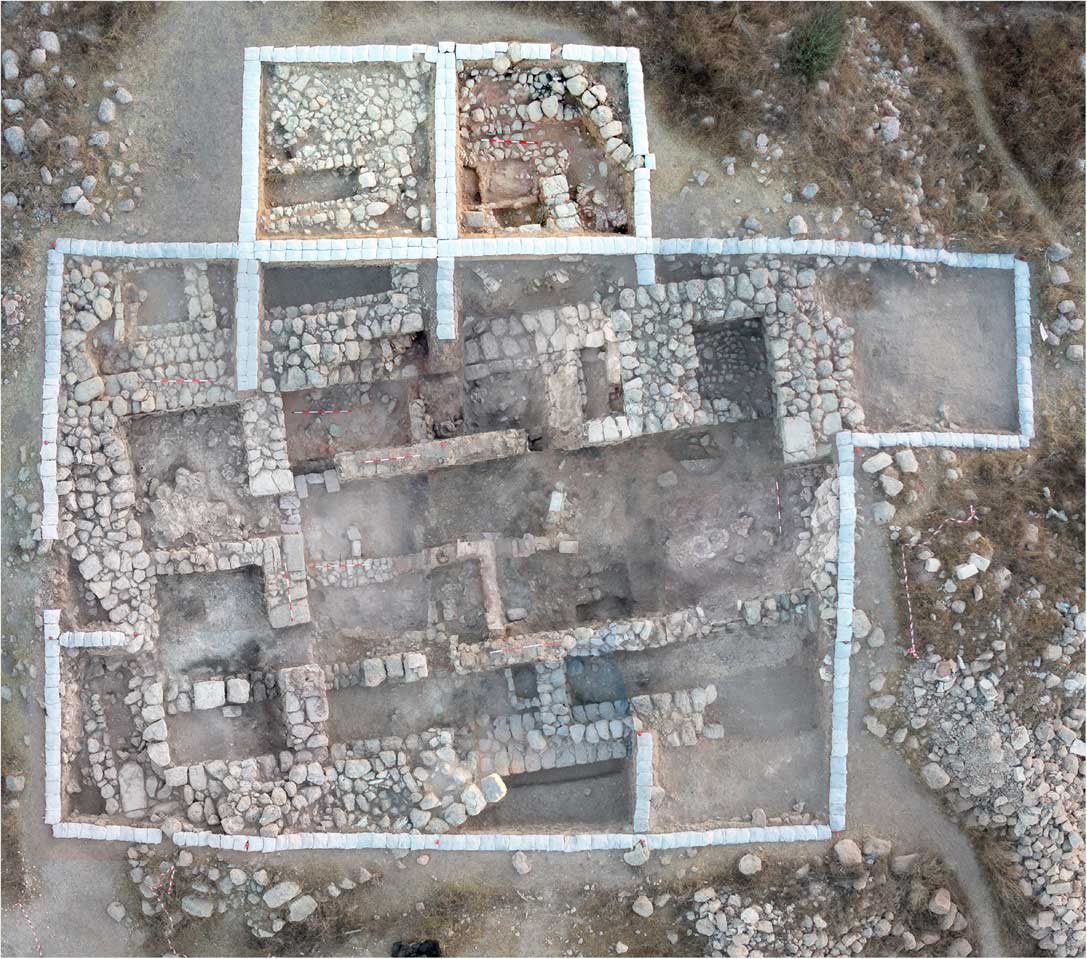
Composite aerial photograph of Area A, showing Building 101. (Photographs by Sky-View and Griffin Aerial Imaging; dividing lines not marked.)
THE “GOVERNOR’S RESIDENCY”
Building 101 was excavated in the course of 10 seasons (2006–2015), and was unearthed in an excellent state of preservation—the walls were typically still standing to 1–1.5 m height, and hundreds of vessels and artifacts, as well as botanical material and other finds were unearthed (more below). Excavations were slow, the debris were completely sifted, all sherds (including body sherds) were registered, large segments of the floors were excavated using a 20×20 cm grid, and much of them were collected for further study (Faust Reference Faust2011; Faust and Katz Reference Faust and Katz2017; Faust et al. Reference Faust, Katz, Sapir, Avraham, Marder, Bar-Oz, Weiss, Auman-Chazan, Hartmann-Shenkman, Sadiel, Vilany, Tserasky, Sarah, Ackerman, Timmer, Katz, Langgut and Benzaquen2017).
The building follows the “four-room” plan. The four-room house is a well-known type of Iron Age dwelling, that was extremely dominant in Israelite settlements (e.g., Shiloh Reference Shiloh1973; Netzer Reference Netzer1992; Holladay Reference Holladay1997; Bunimovitz and Faust Reference Bunimovitz and Faust2003; Faust and Bunimovitz Reference Faust and Bunimovitz2003, Reference Faust and Bunimovitz2014), and whose ideal plan is that of a long house comprised of three long sections and a broad section at the back. The term, however, is generic, and the actual number of sections varies, and there are also three-, two-, and five-room houses. Additionally, the use of the word “rooms” is somewhat misleading, since the various sections or spaces are sometimes sub-divided. Despite the variation, however, the planning is quite rigid, and four-room houses are easily identified. This style of house began to appear in the Iron Age I, and its mature plan evolved mainly in the early phases of Iron Age II.
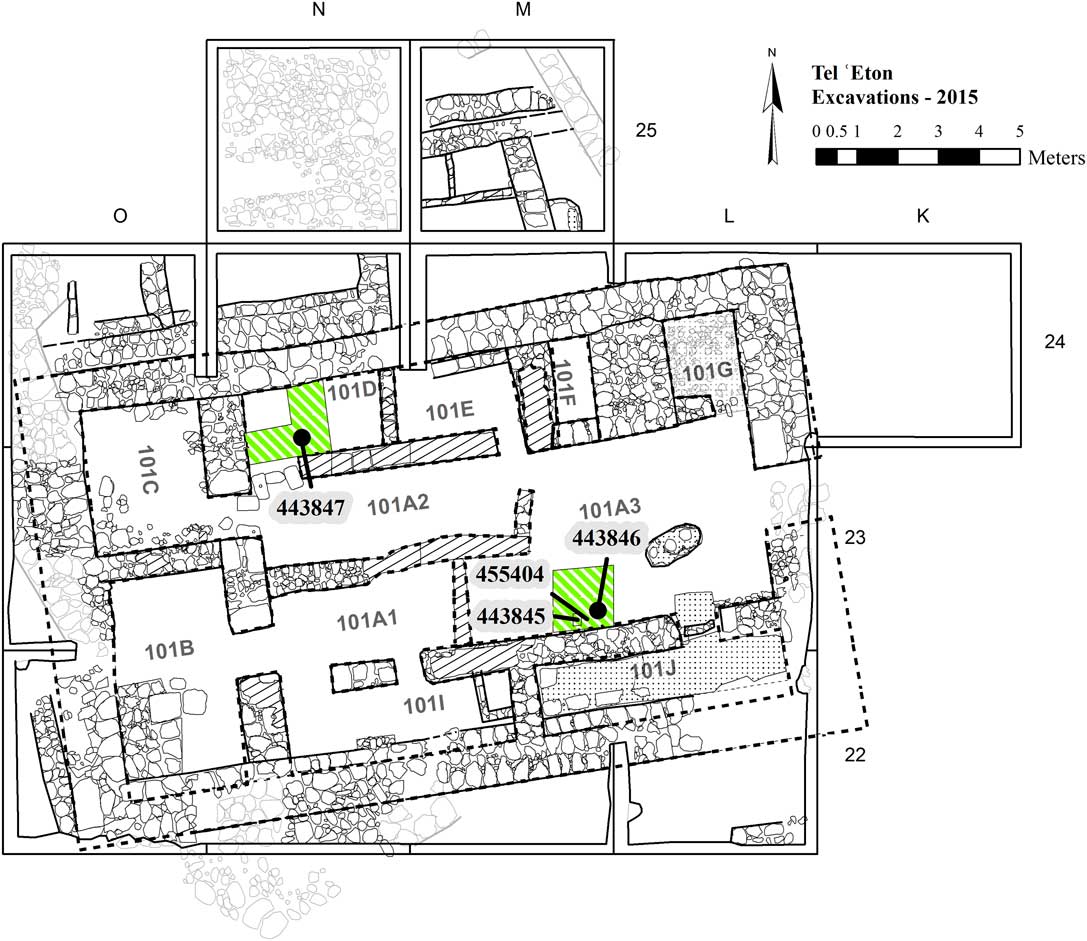
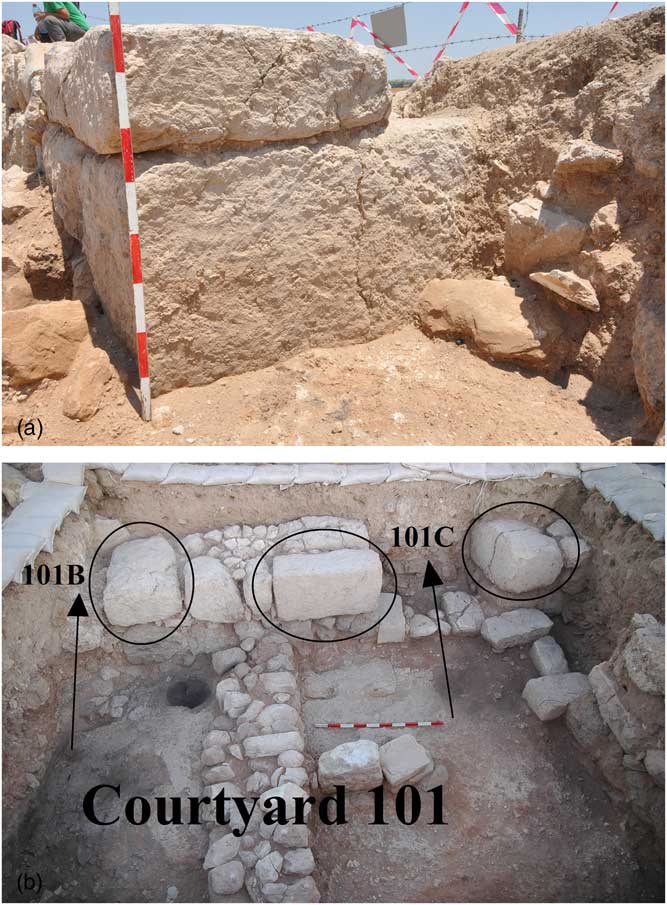
A wide array of evidence suggest that Building 101 was an elite residency (see extensive discussion in Faust et al. Reference Faust, Katz, Sapir, Avraham, Marder, Bar-Oz, Weiss, Auman-Chazan, Hartmann-Shenkman, Sadiel, Vilany, Tserasky, Sarah, Ackerman, Timmer, Katz, Langgut and Benzaquen2017): (1) the building is some 230 m2 large (ground floor only), compared with an average of some 40–70 m2 for most urban Iron Age dwellings (Faust Reference Faust2012: 110–12, 159–63, and references); (2) it is located in the highest part of the mound, in an area which dominates large parts of the city as well as agricultural lands and roads below it; (3) its construction is of high quality, and includes ashlar stones (Figures 5a and 5b), and more; (4) massive preparations were made in order to facilitate the construction of this building (below); (5) dozens of storage vessels attest to the possession of many surpluses; (6) the existence of bullae and sealings is an evidence of a high ranking official; (7) the house is built almost exactly on the east-west axis. Eastern orientation was common in the Iron Age, as part of Israelite cosmology (Faust Reference Faust2001), but not many urban houses could be built almost exactly on this axis, and this is also indicative of its elite nature; (8) in most directions no other buildings abutted Building 101, and even in the northwest, where one building was built adjacent to it, the two did not share common walls, and each building had its own outer walls, creating double systems of walls (Figure 4). Such a practice is common in the Iron Age II, and is usually indicative of high class structures (cf., Faust Reference Faust1999, Reference Faust2012: 112; Faust and Bunimovitz Reference Faust and Bunimovitz2014: 149–50); (9) the building, which occupied the highest point on the mound, was significantly higher than its immediate surroundings (the adjacent area) from at least two or even three directions; (10) The relative rarity of animal bones (compared to other excavated areas), the lack of evidence for floor raising (despite evidence for floors’ modifications following long-term use), as well as the phytoliths which were found in relatively low quantities in all rooms (a maximum value of about 22,000/g, and usually much less), suggest that the building was cleaned continuously during its existence; (11) while animal bones were relatively few (above), the assemblage includes a large percentage of wild animals, suggesting the that the inhabitants enjoyed high quality food. All in all the finds suggest that the inhabitants were of high socioeconomic status, especially in light of what we know of Iron Age housing in other cities in Israel and Judah. Building 101 was not only part of a small group of elite Iron Age houses (Faust Reference Faust2012: 112; Faust and Bunimovitz Reference Faust and Bunimovitz2014: 149–50), but it belongs to the upper echelon of this group, and we subsequently called it the “governor’s residency” (see extensive discussion in Faust et al. Reference Faust, Katz, Sapir, Avraham, Marder, Bar-Oz, Weiss, Auman-Chazan, Hartmann-Shenkman, Sadiel, Vilany, Tserasky, Sarah, Ackerman, Timmer, Katz, Langgut and Benzaquen2017).
Ashlar stones: (a) ashlar stones at the main entrance to the building, looking north; (b) ashlar stones at the corners of the entrances to the rooms at the broad space (Rooms 101B and 101C), looking west.
THE DATE OF THE “GOVERNOR’S RESIDENCY”
As noted, the house was destroyed during one of the Assyrian campaigns of the late 8th century BCE, as is evidenced by the large ceramic assemblage of smashed vessels dating to this period that were unearthed on its floors, along with hundreds of additional artifacts and dozens of arrowheads, attesting to the violent nature of the destruction (Katz and Faust Reference Katz and Faust2012; Faust Reference Faust2016; Faust et al. Reference Faust, Katz, Sapir, Avraham, Marder, Bar-Oz, Weiss, Auman-Chazan, Hartmann-Shenkman, Sadiel, Vilany, Tserasky, Sarah, Ackerman, Timmer, Katz, Langgut and Benzaquen2017).
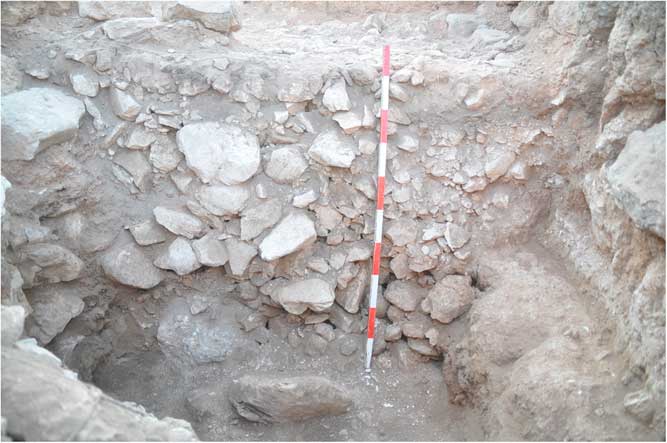
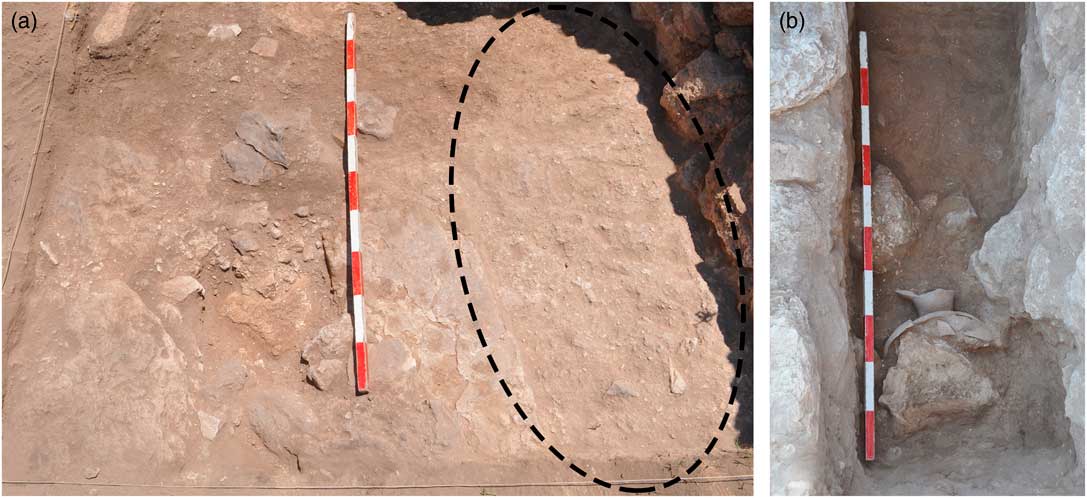
But when was the house built? Since, as noted above, the building was cleaned continuously during its existence, no floor raisings were identified, and we could not use the material from within the floors to date its construction. Attempts to cut through the floors in the courtyard and in Room 101D (for locations, see Figure 4) in order to reach the previous stratum, and thus to learn about the terminus post quem of the building, also failed to produce results, since the foundations and floors make-up were massive, at least 1 m thick. In room 101D, instead of reaching the previous level, we unearthed a thick layer composed of small fragments of limestone, mixed with ash (the material was quite loose), reaching a depth of about 1 m. The walls of this room, by contrast, were based on a layer of hard soil, mixed with chalky material (Figure 6). Another section (1.5×1.5 m) was opened in the courtyard (Space 101A3), in a second attempt to find the preceding phase. We assumed that in the courtyard there was less need for make-up or foundations, and hence we will more easily find the earlier occupation. This assumption, however, was proved to be wrong. Immediately below the earth floor we uncovered flat and long chalk blocks that were lain there on an east–west axis, mixed with compact earth that included many chalky sediments (Figure 7a). We excavated the compact chalky earth, and within it, near Wall F1231, we uncovered a foundation deposit (a chalice; Figure 7b). Such deposits were prevalent in Canaanite sites during the 13th–11th centuries, probably as a result of Egyptian influence (Bunimovitz and Zimhoni Reference Bunimovitz and Zimhoni1993; Bunimovitz and Lederman Reference Bunimovitz and Lederman2016a: 215–223; below we will see that, rarely, the practice continue into the Iron Age IIA). The form of the chalice also appears early (the end of the Late Bronze Age or the very beginning of the Iron I; cf., Amiran Reference Amiran1969; Grutz Reference Grutz2007).
Section in the floor of Room 101D, revealing a loose layer of small fragments of limestone mixed with ash (looking east). Note the earth layers (below the stone foundations) to the right (south).
(a) The section in the courtyard, looking east. Note the chalk tablets (mainly in the left) and the hard, compact earth (to the right), which was subsequently excavated and in which the foundation deposit (Figure 7b) was unearthed (approximate area is marked); (b) the foundation deposit below the floor of space 101A3 in the course of the excavations (looking east).
This, however, was more confusing than helpful. Not only was it hard to believe that the structure could have existed for so long—from the Late Bronze Age or Iron Age I to the late 8th century—but the plan itself is characteristic of the Iron Age II, and we found it practically impossible to place it in earlier epochs. With the absence of floor raisings we could not use pottery to date the construction, and since the unique foundation deposit was seemingly far too early to be associated with the building, we radiocarbon dated material from within the foundation deposit and the floor make-up.
SAMPLING
The samples that were selected for radiometric dating were collected as part of the routine protocol in the course of the excavations. All the charred organic material was collected without human touch, kept in aluminum foil, and stored at the expedition laboratory at Bar-Ilan University. In addition, soil samples from all loci (with the exception of topsoil) were collected and stored at the laboratory, facilitating additional study of the remains, and sometimes the finding of additional samples for dating. The most promising samples for the dating of the building, from the best contexts, were later selected for analysis (Figure 4). Thus, although short-lived samples are preferred, we decided that it was best to take the charcoals found within the foundation deposit (Beta 443845) because foundation deposits provide the best possible context for dating the construction of a structure. Given the typologically early date of the chalice, and to rule-out a possible suggestion (although extremely unlikely in terms of the archaeological context) that the chalice is earlier than the structure, we decided to take an additional sample from the floor make-up above the foundation deposit. No short-lived samples were available from this limited context (a bone was sent for dating but did not produce enough collagen), and we therefore used charcoal (Beta 443846). A third sample was taken from the floor make-up of room 101D (Beta 443847). Exposure of the floor make-up in this room was wider, so short-lived samples were available and we selected an olive pit. Since the samples were taken from within the foundation deposit and from the make-up below the floors, the stratigraphic context is definite (see more below). Given the results (Table 1; Figure 8), it is clear that the use of charcoals did not lead to a significant dating bias in comparison to the date of the short-lived olive pit. Hence it seems that the old wood effect, if present at all, was limited (see below). The fourth sample (Beta 455404), from the level that preceded Building 101, was taken from the material into which the foundation deposit was embedded, and for this we chose an olive pit that was found within the soil sample taken from this material.
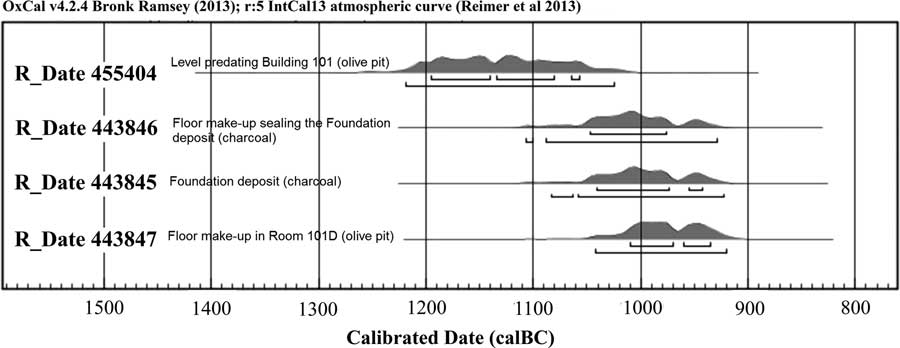
Stratigraphic sequence of calibrated dates in Area A, calibrated and determined with the OxCal 4.2 program (Bronk Ramsey Reference Bronk Ramsey1995, Reference Bronk Ramsey2009), using the IntCal13 calibration curve (Reimer et al. Reference Reimer, Bard, Bayliss, Beck, Blackwell, Bronk Ramsey, Buck, Cheng, Edwards, Friedrich, Grootes, Guilderson, Haflidason, Hajdas, Hatté, Heaton, Hoffmann, Hogg, Hughen, Kaiser, Kromer, Manning, Niu, Reimer, Richards, Scott, Southon, Staff, Turney and van der Plicht2013).
14C results for the four samples that were taken from the floor make-up of the “governor’s residency” and below it, determined and calibrated with the OxCal 4.2 program (Bronk Ramsey Reference Bronk Ramsey1995, Reference Bronk Ramsey2009), using the IntCal13 calibration curve (Reimer et al. Reference Reimer, Bard, Bayliss, Beck, Blackwell, Bronk Ramsey, Buck, Cheng, Edwards, Friedrich, Grootes, Guilderson, Haflidason, Hajdas, Hatté, Heaton, Hoffmann, Hogg, Hughen, Kaiser, Kromer, Manning, Niu, Reimer, Richards, Scott, Southon, Staff, Turney and van der Plicht2013).
RADIOCARBON DATING THE “GOVERNOR’S RESIDENCY”
The work on these samples (including pretreatment, measurement of δ13C, 14C dating and calibration) was performed in the laboratories of Beta Analytic (Miami, Florida, USA). OxCal v4.2 (Bronk Ramsey Reference Bronk Ramsey1995; Reference Bronk Ramsey2009) and the IntCal13 calibration curve (Reimer et al. Reference Reimer, Bard, Bayliss, Beck, Blackwell, Bronk Ramsey, Buck, Cheng, Edwards, Friedrich, Grootes, Guilderson, Haflidason, Hajdas, Hatté, Heaton, Hoffmann, Hogg, Hughen, Kaiser, Kromer, Manning, Niu, Reimer, Richards, Scott, Southon, Staff, Turney and van der Plicht2013) were used for calibration. The δ13C is the IRMS δ13C measured on the pretreated samples. Results are shown in Table 1 and Figure 8.
The three 14C results from the foundation deposit (Beta 443845) and the floor make-up of Building 101 (Beta 443846-7) are almost identical, covering the second half or late 11th century and the first half or two thirds of the 10th (1σ) or much of the 11th–10th centuries BCE (2σ). The fourth sample (Beta 455404), which was taken from the level into which the foundation deposit was embedded and on top of which Building 101 was erected, is dated to the 12th–11th centuries BCE, providing a terminus post quem for the construction.
Two additional points should be stressed, however:
1. The youngest possible date for the construction, within the 2σ Calibrated Age Range, is 921 BCE, thus apparently ruling out any construction date which is later than the time of the United Monarchy (from the first half of the 10th century to around 930 BCE).
2. Two of the three samples used to date the building are charcoals and their dates (which are practically identical) are slightly earlier than the third sample of an olive pit (Beta 443847). The latter date of a short-lived seed should receive more weight, thereby supporting a late 11th–10th century date.
Furthermore, the 10th century is also the only possible date in which the foundation deposit and the elaborate “four-room” residency could coexist. It was shown recently that the tradition of depositing foundation deposits, typical of the late 2nd millennium BCE, lingers into the Iron Age IIA (Bunimovitz and Lederman Reference Bunimovitz and Lederman2016a: 219, 221),Footnote 1 while “classical” four-room houses are not known before the Iron Age IIA. The 10th century is therefore the only time in which this type of housing could coexist (chronologically) with the tradition of placing foundation deposits, fitting neatly with the 14C results, and placing the construction of Building 101 in the 10th century BCE.
The complex history of Tel ‘Eton’s fortifications will be addressed in a separate article, but we would like to note that the early phase of the Iron Age II fortifications in Area D seems to date to the same period, mainly on the basis of the pottery assemblage unearthed in the layers abutting the city wall. Additionally, two short-lived 14C samples were taken from the lower layers abutting the city wall, the latest of which can be used to date the accumulations, and is dated to the 10th century BCE (Beta 443844, [2796±21 BP] 1006–900 (95.4%); 976–914 (68.2%)). Since it is likely that the city wall and the large edifice were part of the same construction operation, the full range of the short-lived dates (Beta 443844, 443847) strongly suggests that the construction event occurred most likely in the middle or first half of the 10th century BCE—precisely the time of the United Monarchy.
A Question of Context: Can Floor Make-Up Be Used for Dating?
The use of charred remains from the floor make-up might raise some methodical objections. Could not the material be residual, and therefore earlier or at least contaminated?
While material from below the floors could, in theory, be residual and earlier, this appears quite clearly not to be the case here. This is supported by both direct (the actual contexts from which the samples were taken) and indirect (the dates and the cultural remains) reasoning:
1. The exact context of the samples is quite straightforward. Sample Beta 443847, from the floor make-up of Room 101D, was taken from within a thick layer of small fragments of limestone mixed with ash, located between different sediments that were placed below the walls (Figure 6). This is not a residual material, and it was intentionally brought to its present location when Building 101 was erected.
2. The context of sample Beta 443845 is also not residual, as it was taken from within the foundation deposit (the chalice). This is the best possible context from which to date a construction of a building. Moreover, in order to make sure that the chalice is not a remnant of an earlier phase (an extremely unlikely suggestion in itself since, archaeologically speaking, the context was clear) we took an additional sample (Beta 443846) from the floor make-up above the foundation deposit. The radiometric results clearly confirm that the chalice was indeed deposited at the same time as the sediments above it.
3. This is also confirmed, indirectly, by the earlier date of the sediments into which the chalice was inserted (Beta 455404). This early date provide the time of the level into which the building was embedded. Should the results (from the floors’ make-up) be residual, they were likely to be of a similar age to that of the preceding level (more below). That this is not the case, further strengthens the significance of the results from the floor make-up.
4. The mere fact that all three samples taken from the floors’ make-up (and the foundation deposit) are practically identical (with the short-lived one being only slightly later) also, indirectly, strengthen their validity. Not only are all contexts quite secure, but it is highly improbable that all dates are residual, and that all the residual material dates to such a short episode. Such a short time-span does make sense, however, if all the samples should be associated with the construction of the building. Again, the earlier date of the sediments into which the foundation deposit was deposited also supports the validity of the later dates from the floors’ make-up.
5. This date is supported by two aspect of the cultural remains: (a) the early date of the foundation deposit itself, which cannot be pushed much beyond the very end of the 2nd millennium BCE; (b) the mere tradition of placing foundation deposits below buildings died away gradually during the final phase of the 2nd millennium BCE, and the latest known examples are from the Iron Age IIA. These points could push the date of the structure backward (i.e., earlier) and make a later date very difficult to attain, hence indirectly also support the validity of the radiometric dates.
In summary, the archaeological contexts of the samples is quite secure, and archaeologically speaking they are unlikely to be residual or early. While there is always a danger that a certain sample might be residual (due to various post-depositional processes), the validity of the dates is further supported by the fact that the three dates are practically identical (as this is extremely unlikely to be incidental). Furthermore, should the samples from the floor make-up be residual, they are likely to date to the level that preceded the construction of the building. These sediments, however, were shown to date to the 12th–11th century BCE, and it is therefore quite clear that none of the samples was derived from this level. Finally, both the form of the chalice that served as the foundation deposit and the mere cultural tradition of depositing such artifacts below buildings, make the suggestion that the building was built later than the radiometric dates (and hence that the latter are residual) extremely unlikely.
TEL ‘ETON IN THE 10TH CENTURY BCE IN CONTEXT
Our knowledge on the Iron Age I settlement that existed at the site before the new construction is very limited, but given the distribution of the remains it is quite clear that it was smaller than both the new Iron Age IIA city and the preceding Late Bronze Age settlement (Faust and Katz Reference Faust and Katz2015; Faust Reference Faust2016). Since the settlement at Tel ‘Eton expanded significantly in size during the Iron Age IIA, the combined evidence suggests that the settlement was transformed from a village into a central town with a city-wall and a residency with ashlar blocks, at some point in the late 11th or (more likely) the first half or three quarters of the 10th century BCE.
As for the agent of change, apart from the overall historical considerations that clearly point toward the United Monarchy as the only possible agent (as Philistia weakened at the time; e.g., Ehrlich Reference Ehrlich1996; Stager Reference Stager1998: 171; Mazar Reference Mazar2007: 135; Faust Reference Faust2013a, Reference Faust2014d, Reference Faust2015a, and below), the plan of the “governor’s residency” provides an additional hint. The building is one of the finest examples of the four-room house plan which dominated Israelite sites and was extremely rare elsewhere (Shiloh Reference Shiloh1973; Netzer Reference Netzer1992; Holladay Reference Holladay1997; Bunimovitz and Faust Reference Bunimovitz and Faust2003; Faust and Bunimovitz Reference Faust and Bunimovitz2003, Reference Faust and Bunimovitz2014), and this in itself strongly suggest that the transformation of Tel ‘Eton should be associated with the highland polity, i.e., the debated United Monarchy.Footnote 2
This seems to fit nicely with the overall changes the Shephelah experienced in the course of the Iron Age II. During the Iron Age I the Judean Shephelah was only sparsely settled and the sites of Tel ‘Eton, Tell Beit Mirsim, Tel Yarmuth, and Beth-Shemesh (and probably also in Tel Halif) apparently formed an isolated Canaanite enclave along its eastern edge, in or around the trough valley (Faust and Katz Reference Faust and Katz2011; Bunimovitz and Lederman Reference Bunimovitz and Lederman2011; Lederman and Bunimovitz Reference Lederman and Bunimovitz2014; Faust Reference Faust2013b). Then, in the late 11th–early 10th century (the transition from the Iron Age I to the Iron Age IIA) the fortified settlement of Kh. Qeiyafa, whose nature is hotly debated, was erected (Garfinkel et al. Reference Garfinkel, Streit, Ganor and Hasel2012, Reference Garfinkel, Streit, Ganor and Reimer2015; Garfinkel, Kreimerman and Zilberg Reference Garfinkel, Kreimerman and Zilberg2016; Piasetzky Reference Piasetzky2016; see also Faust Reference Faust2014d). Later, in the course of the Iron Age IIA, the older Canaanite centers experienced significant changes. Beth-Shemesh, located farther north, was fortified in the mid-10th century or slightly later according to the excavators (Bunimovitz and Lederman Reference Bunimovitz and Lederman2001, Reference Bunimovitz and Lederman2016a, Reference Bunimovitz and Lederman2016b), however this dating is disputed (Piasetzky Reference Piasetzky2016). The nearby site of Tell Beit Mirsim was excavated almost a century ago, so no 14C dates are available, but pottery typology suggests that it was also fortified at some point during the Iron Age IIA (Albright Reference Albright1943; see also Katz and Faust Reference Katz and Faust2014). The above-mentioned construction operations in these sites were, according to the excavators of all these sites, part of the process in which they were incorporated within the highland polity, just like the gradual construction of new sites in the region, e.g., Lachish, Tel Zayit and Tel Burna, all associated by the excavators with the highlands (Ussishkin Reference Ussishkin2004, Reference Ussishkin2014; Tappy Reference Tappy2009, Reference Tappy2011; Shai et al. Reference Shai, Cassuto, Dagan and Uziel2012; for a large-scale reconstruction of the changes in the Shephelah in relation to the various polities, see Faust Reference Faust2013b, Reference Faust2014a, Reference Faust2014d, Reference Faust2017, and many references).Footnote 3
The lack of evidence of destruction that preceded the new construction at Tel ‘Eton suggests that the changes did not follow a military conquest, and rather resulted from alliances between the Canaanites in Tel ‘Eton (Faust and Katz Reference Faust and Katz2011, Reference Faust and Katz2015; Faust Reference Faust2015b; see also Bunimovitz and Lederman Reference Bunimovitz and Lederman2011; Lederman and Bunimovitz Reference Lederman and Bunimovitz2014) and the new Israelite polity that expanded its influence at the time. Indeed, this is supported by the fact that the construction of the new type of architecture (a classical four-room house) involved traditional Canaanite conventions, as is evidenced by the mere placing of a foundation deposit.
It is important to stress, however, that while the exact date (within the Iron Age IIA) of the transformation of the other two trough valley settlement (Tel Beth-Shemesh and Tell Beit Mirsim) into fortified centers associated with the highland polity is not secure, the dating of the changes at Tel ‘Eton and their nature provide a more direct link with the United Monarchy.
TEL ‘ETON IN THE 10TH CENTURY BCE, THE EARLIEST EVIDENCE FOR THE USE OF ASHLARS IN JUDAH, AND THE UNITED MONARCHY
We noted above that the mere historicity of the United Monarchy is questioned by many. We cannot repeat the debate here in any detail, but for our purposes we may note that among the main challenges to the historical plausibility of such a kingdom is the absence of fortifications, public works and any evidence for statehood or state apparatus in the region of Judah—the core of the supposed kingdom—before the 9th century BCE, or even later (Jamieson-Drake Reference Jamieson–Drake1991; Finkelstein and Silberman Reference Finkelstein and Silberman2001; Herzog and Singer-Avitz Reference Herzog and Singer–Avitz2004; Ussishkin Reference Ussishkin2008; Finkelstein and Piasetzky Reference Finkelstein and Piasetzky2011). Some suggested that ashlar stones—an indication of high quality construction—were not found in this region before the late 8th century BCE. Thus, Finkelstein and Silberman (Reference Finkelstein and Silberman2001: 159) noted that “In Israel, regional administrative centers developed in the early ninth century. They were fortified and provided with elaborate palaces built of ashlar blocks… Yet in the south, ashlar masonry… appear only in the seventh century BCE” (see also Finkelstein Reference Finkelstein1999; Finkelstein and Silberman Reference Finkelstein and Silberman2001: 235, 245). Later, Finkelstein (Reference Finkelstein2015: 202) even used its appearance in Judah as a proof of Israelite material culture arriving in Judah, writing that “Ashlar masonry, typical of elaborate Israelite structures (especially in Samaria and at Megiddo) in the Late Iron IIA, appears in Judah in the late 8th century (the Beer-sheba altar) and later (Ramat Rahel)”.
Our findings support the view that the skepticism is unwarranted. The finds at Tel ‘Eton show that public buildings were constructed in the 10th century, and even ashlar stones were used at this time (Figures 3–5), contradicting the logic behind some of the arguments against the plausibility of the United Monarchy.
Furthermore, Building 101 not only provides rare evidence for 10th century state-induced activity in the region, but can also shed light on the reasons why scholarship did not yet uncover more such examples.
THE LONG LIVES OF HOUSES AND STRATA: THE OLD-HOUSE EFFECT AND THE ARCHAEOLOGY OF IRON AGE IIA JUDAH
The insights gained from the study of the “governor’s residency” at Tel ‘Eton should serve as a cautionary note against the argument that the lack or rarity of finds from some phases within the Iron Age in Judah indicate that there was no substantial social complexity in these epochs (and hence that there was no United Monarchy or that Judah became a full-blown state only in the Iron Age IIB, e.g., Jamieson-Drake Reference Jamieson–Drake1991; Finkelstein Reference Finkelstein1996, Reference Finkelstein1999; Finkelstein and Silberman Reference Finkelstein and Silberman2001; Herzog and Singer-Avitz Reference Herzog and Singer–Avitz2004). While the absence of evidence can (and should) sometimes serve as evidence (e.g., Stephens Reference Stephens2011; see also Faust Reference Faust2006, for example, pp. 35–64), this line of reasoning should be used carefully, and only when we are positive that the evidence should have been present, can we use its absence as an argument. Thus, while a legitimate line of reasoning in itself, it appears that this logic is not applicable here, and in the present case the absence (or rarity) of evidence is insufficient. Consider, for example, the lesson from Building 101. We have plenty of information on its destruction by the Assyrian army during the final phase of the 8th century BCE, and on its final phase(s) of use, including hundreds of complete vessels and artifacts, buried within a thick (1.5 m) accumulation (e.g., Katz and Faust Reference Katz and Faust2012; Faust and Katz Reference Faust and Katz2017; Faust et al. Reference Faust, Katz, Sapir, Avraham, Marder, Bar-Oz, Weiss, Auman-Chazan, Hartmann-Shenkman, Sadiel, Vilany, Tserasky, Sarah, Ackerman, Timmer, Katz, Langgut and Benzaquen2017). But until now we could not say anything about the time of its construction, and even its period of usage. We tended, partly under the “impression” that any earlier date would be unlikely, to estimate that it was built earlier in the 8th century BCE. This would have fitted the more skeptical approaches nicely, substantiating the lack of significant remains from the Iron Age IIA. Only the careful excavations of the house in the course of 10 seasons, partially at least using prehistoric methods, along with the chance find of the foundation deposit and the use of carefully planned 14C dating strategy, allowed us to date the construction of the building.
Building 101 is not an exception in this regard, and the structures uncovered on top of the Stepped Stone Structure in the City of David (Jerusalem) can serve as an additional example. A series of structures in this part of the city were excavated by Kenyon in the 1960s and by Shiloh in the 1970s and 1980s, and it is quite clear that the entire quarter was destroyed in the early 6th century by the Neo-Babylonian army (Kenyon Reference Kenyon1974: 162; Shiloh Reference Shiloh1984: 18–20; Steiner Reference Steiner2001: 80). On the basis of the finds from within the destruction, Kenyon (Reference Kenyon1974: 161-165) discussed the function of this 7th century quarter at length, but did not pay much attention to the question when were the structures built. Shiloh (Reference Shiloh1984: 17–18), in the preliminary report, stated that the residential houses were built only in the end of the Iron Age, during the 7th century, and then, on the basis of the evidence unearthed in the destruction layer, paid much attention to the function of these 7th century structures (Shiloh Reference Shiloh1984: 18–20). Steiner (Reference Steiner2001: 80, 105, table 6.7), who published the final report of Kenyon’s excavations, noted that it is difficult to date the beginning of the occupation due to “the nature of the documentation”, and attributed the construction to the late 8th or the 7th century BCE. Still, a thorough examination of the material within the floors of the buildings excavated by Shiloh, conducted many years after the excavations ended and published by Cahill (who is responsible for the final publication of the material), showed that they were built already during the Iron Age IIA (Cahill Reference Cahill2003: 56–66). It is important to note that this analysis was conducted and published only because of the heated debate over the historicity of the United Monarchy, showing the lack of attention to such mundane finds, even when they are excavated properly.
An understanding of site formation processes explains why this is the case. At Tel ‘Eton, and from this perspective this site is representative of many sites in Judah, a major destruction occurred in the late 8th century BCE (Katz and Faust Reference Katz and Faust2012; see also Mazar Reference Mazar2005; Ussishkin Reference Ussishkin2014). The remains were buried in situ, with dozens of structures and thousands of vessels and additional artifacts. The massive remains cannot be missed and are well represented in excavations, enabling various types of detailed and sophisticated analysis, historical and social alike, leading to intense scholarly discussion. In some other sites (e.g., Jerusalem) the first Iron Age destruction occurred only in the early 6th century BCE (at the time Nebuchadnezzar II), but what is important is that no large-scale destruction events took place before the late 8th century BCE, i.e., between the 10th–8th centuries (this lies at the heart of the debate on the chronology in Judah, see for example Na’aman Reference Na’aman1996: 19; Katz and Faust Reference Katz and Faust2014, and references).
Building 101 is indeed an extreme case since it did not experience floor raisings, but even when floors are raised (as in the City of David, above), the remains embedded in them are usually extremely limited, rarely datable, and to make things even worse, almost always understudied (see the Jerusalem case, above). Vessels that were broken during daily life were discarded, and only the smallest sherds were left in situ, embedded within the floors. The rest were dumped outside the settlement, and are rarely recoverable. The tiny sherds embedded within the floors, however, are usually not indicative (most are body sherds, and even tiny rims are not always datable). Indeed, unlike vessels in destruction layers, those fragments are often not studied as their context is not always clear (among other things due to the difficulty of recognizing floor raising), and even when they are, they rarely receive much attention, and are not always even published (above). Thus, the remains, of all types, from the hundreds of years preceding the destruction of the late Iron Age are extremely limited and underrepresented.
We will briefly exemplify the rarity of finds with reference to three classes of artifacts: (1) ostraca, (2) figurines, and, later, also (3) cooking pots. The rarity of categories (1) and (2) in Iron Age IIA contexts (while they are abundant in later Iron Age contexts) is a well-known phenomenon which led to a suggestion that both the large-scale adoption of writing and the widespread usage of figurines started only in the late 8th century BCE (e.g., Finkelstein and Silberman Reference Finkelstein and Silberman2001: 235–238; Byrne Reference Byrne2004: 139; Darby Reference Darby2014)—a pattern that explicitly led some scholars to suggest the statehood was not achieved before the late 8th century (e.g., Jamieson-Drake Reference Jamieson–Drake1991; Finkelstein and Silberman Reference Finkelstein and Silberman2001: 235–238, and see above). But the same phenomenon can be seen also in cooking pots (class (3) above). While 137 complete cooking pots were collected from late 8th century destruction layers in Judah, not a single such complete vessel was so far published in 9th century BCE occupations in the same region (up to 2014).Footnote 4 Naturally, nobody would suggest that there were no cooking pots in the 9th century BCE. The lack of 9th century finds is simply a result of the nature of site formation processes. The number of complete cooking pots supplies objective information regarding the scale of the finds from the different Iron Age sub-phases, and put the numbers of figurines and ostraca (and other finds of course) in a much better comparable context, casting doubt on some of the common explanations (even if not disproving them).
The implications of our findings for the study of the United Monarchy are clear.Footnote 5 Thus, while the lack of evidence can, and should, be used as evidence, this should be done carefully. The main qualifying factor is whether we should have found the evidence. In the present context we claim that since there were no regional-scale destruction events in Judah before the 8th century, only little is expected to be found in these earlier contexts. Hence, the fact that only little is found in 9th century contexts cannot be used to claim that there was no central polity at this time.
Interestingly, when architectural features and elements of town-planning are studied carefully, evidence for social complexity during the Iron Age IIA is identified in practically every site, and in most cases the differences between the settlement of the Iron IIA and Iron IIB are less significant than one might be impressed from some common summaries. This is the case, for example, in Lachish, Tell Beth-Shemesh, Beer-Sheba, and Tell Beit Mirsim, where urbanism peaked already in the Iron Age IIA, and the famous Iron Age IIB cities were not significantly different from their predecessors (e.g., respectively, Ussishkin Reference Ussishkin2004, Reference Ussishkin2014; Bunimovitz and Lederman Reference Bunimovitz and Lederman2001, Reference Bunimovitz and Lederman2016a, Reference Bunimovitz and Lederman2016b; Herzog and Singer-Avitz 2016; Albright Reference Albright1943: 37; Katz and Faust Reference Katz and Faust2014: 117).Footnote 6 In contrast to the impression one might get from some of the discussions (e.g., Finkelstein and Silberman Reference Finkelstein and Silberman2001), 8th century BCE Judah did not experience a sudden revolution in all respects (in some it did), and the demographic and cultural “peak” identified at this time was only the apex of a long process that started long before.
Buildings and strata can exist for a few centuries, until they are destroyed, but almost all the finds will reflect this latter event. We therefore suggest that Building 101, despite the differences between it and other buildings, is representative of a much more widespread phenomenon—the old-house effect—which should warn us against using the rarity of well-dated Iron Age IIA finds as evidence for the late development of social complexity in Judah. We will develop this issue elsewhere, but it is important to note that the old-house effect is operating in all regions and periods, and hence creates biases that can, and should, be taken into consideration in historical reconstructions.
CONCLUSIONS
The new 14C dates from Tel ‘Eton suggest that the site was transformed around the first half of the 10th century BCE (the most probable period within the full 2σ calibrated age range that covers the late 11th century—first three quarters of the 10th century). A new edifice, probably serving as a residence of the family of a high ranking official (the “governor’s residency”), was built on the top of the mound, using impressive building technology (including ashlar construction) and representing large investment. The construction of the building coincided with the expansion of the mound (and probably also with the erection of the city wall), signifying a major change of the entire site. Both historical circumstances and the plan of the building—a classical four-room house—connect the changes with the highland polity, most likely the contested United Monarchy.
The dating of the building erection to the 10th century BCE not only provides clear evidence for public construction in Judah at this time, but it also refutes the claim that there was no use of ashlar in this region during the Iron Age IIA. This, first and foremost, disproves one of the major contentions of the skeptical approach, which uses the lack of such construction to deny Judah of social complexity prior to the late 8th century BCE.
Moreover, despite the long life of Building 101, between 250–300 years, all the tangible remains reflect its last (destruction) phase, and practically nothing attests to its long life and history. We believe that the old-house effect has a great impact on scholarly reconstructions all over the world and throughout many periods, and that Building 101 can serve as a cautionary tale regarding the mere logic of using the absence or rarity of finds. In our case, the rarity of finds from the Iron Age IIA in Judah was used as evidence for the lack of social complexity, but it appears that many buildings that were destroyed by the Assyrians and Babylonians in the late Iron Age were built centuries before. Thus, by comparing the meager Iron Age IIA finds with those unearthed within the destruction layers of the late Iron Age, some studies misconstrued the social and political history of the region.
ACKNOWLEDGMENTS
Much of the previous research of the building was facilitated by a grant from the Israel Science Foundation, “The Birth, Life and Death of a Four Room House at Tel ‘Eton” (284/11). We would also like to thank the Ingeborg Rennert Center for Jerusalem Studies for its support, the staff of the Tel ‘Eton excavations for its help, and the anonymous reviewers and the editors for their comments.


 Open access