

1. Introduction
The retreat of mountain glaciers in response to ongoing climate change is expected to have a major impact on alpine environments globally (Reference Huss, Jouvet, Farinotti and BauderHuss and others, 2010). Many studies predict detrimental societal, ecological and economic impacts due to glacier retreat-related hydrological changes (Reference Braun, Weber and SchulzBraun and others, 2000;Reference Jansson, Hock and SchneiderJansson and others, 2003;Reference Hannah, Sadler and WoodHannah and others, 2007;Reference VergaraVergara and others, 2007;Reference Brown, Milner and HannahBrown and others, 2010; Reference Kistin, Fogarty, Pokrasso, McCally and McCornickKistin and others, 2010; Reference Uehlinger, Robinson, Hieber and ZahUehlinger and others, 2010). In the Cordillera Blanca, Peru, coupled natural-human studies have shown that, in the context of an increasing regional population, the vulnerability of Andean society is tied directly to water availability (Reference Mark, Bury, McKenzie, French and BaraerMark and others, 2010;Reference BuryBury and others, 2011). However, evaluating the influence of meltwater runoff on large river basin flows in different environments remains a major scientific challenge (Reference Milner, Brown and HannahMilner and others, 2009;Reference Kaser, Grosshauser and MarzeionKaser and others, 2010). This challenge is often amplified by logistical difficulties in gathering long-term, reliable measurements like those faced in high-elevation tropical environments (Reference Hofer, Molg, Marzeion and KaserHofer and others, 2010).
In conditions of continuous retreat, glaciers generate a transitory increase in runoff as they lose mass (Reference Mark and McKenzieMark and McKenzie, 2007). This increase is limited in time as the amount of frozen water stored in the glaciers decreases (Reference Mark, McKenzie and GómezMark and others, 2005). As a consequence, the reduction in ice volume will yield a significant increase in annual runoff for only a few decades, followed by a decrease in runoff (Reference Huss, Farinotti, Bauder and FunkHuss and others, 2008). This trend will be even more pronounced during the season of low flow, a period of the year when the relative contribution of glacier meltwater is at its maximum (Reference Stahl and MooreStahl and Moore, 2006;Reference Nolin, Phillippe, Jefferson and LewisNolin and others, 2010). Year-to- year variability of runoff from a glacierized mountain basin is moderated by the interaction of temperature and precipitation (Reference Collins and TaylorCollins and Taylor, 1990). This buffering effect is greatest in basins that have moderate glacier cover, while variation in runoff is greatest in heavily glacierized and unglacierized watersheds. For example, Reference Hagg, Braun, De Jong, Ranzi and CollinsHagg and Braun (2005) suggest that the minimum year-to-year variations are found where the percentage of glacierized area is 20-50%.
Glaciers, which are vulnerable to predicted future warming, buffer stream discharge from highly seasonal precipitation (Reference Bradley, Vuille, Diaz and VergaraBradley and others, 2006;Reference VuilleVuille and others, 2008a). Reference Kaser, Juen, Georges, Gómez and TamayoKaser and others (2003) describe the response of Cordillera Blanca glaciers to recent climatic fluctuations in a comprehensive analysis of glacier mass balances based on discharge and precipitation data. The use of historical hydrologic observations for predictive modeling has not always led to consistent conclusions about the future contribution of glacial meltwater to streamflow. For example, Reference Juen, Kaser and GeorgesJuen and others (2007) and Reference Vuille, Kaser and JuenVuille and others (2008b) showed that reduced glacier size leads to decreased volume of glacier melt. This decrease is compensated by an increase in direct runoff. Thus, the mean annual total runoff remains almost unchanged, but the seasonality is considerably amplified. On the other hand, other studies suggest that water supply will peak after several decades of continually increasing as a result of net glacier loss, followed by a sudden decrease (Reference PouyardPouyaud and others, 2005).
In this context, accurate predictions of both societal adaptive capacity and water resource availability require sustained measurements and more quantitative assessments of glacier retreat impacts at the watershed scale.
The objective of the present study is to evaluate the influence of recent and ongoing glacier recession on the hydrological regime for different watersheds of the Cordillera Blanca. In particular, it aims to evaluate the impact of glacial retreat on changes to historical trends in watershed discharge characteristics. To reach these objectives, we apply the Mann-Kendall method in analyzing trends in daily average historical discharge records from nine glacierized watersheds. We present a new water-balance model that synthesizes hydrographs for different basin parameters and glacier retreat scenarios. This model, validated to trends in the historical field data, allows us to refine the theoretical curves of glacier retreat influence on hydrological regimes and to anticipate how these regimes will continue to change in the future.
2. Study Site
The upper Río Santa watershed in northern Peru captures runoff from the Cordillera Negra to the west, with a dry climate and no glaciers (Reference Mark and McKenzieMark and McKenzie, 2007;Reference Suarez, Chevallier, Pouyaud and LopezSuarez and others, 2008), and the Cordillera Blanca to the east, which receives more precipitation and is Earth’s most glacierized tropical mountain range. The glacier coverage of the Cordillera Blanca has declined from 800-850 km2 in 1930 to slightly less than 600 km2 at the end of the 20th century (Reference GeorgesGeorges, 2004). The majority of glaciers terminate in watersheds that are drained by the Rio Santa to the Pacific Ocean (Fig. 1). In the Río Santa, meltwater provides 10-20% of the total annual discharge, and may exceed 40% in the dry season (Reference Mark and SeltzerMark and Seltzer, 2003). The region has a strong precipitation seasonality, which is typical of the outer tropics where more than 80% of precipitation falls between October and April, and the austral winter receives almost no precipitation. In addition, the average annual air temperature is less variable than daily temperature. Glacial ablation occurs continually through the year, although sublimation reduces the melt rate during the dry season to some extent. Accumulation, on the other hand, occurs mainly during the wet season, and only on the higher- elevation portions of the glaciers (Reference Kaser, Juen, Georges, Gómez and TamayoKaser and others, 2003).
The Cordillera Blanca and locations of the precipitation measurement stations (circles) and discharge measurement stations

The Cañon del Pato 50 MW hydroelectric generation plant located at Huallanca on the Río Santa defines the outflow of a 5000 km2 watershed that captures runoff from the majority of the glacierized valleys of the Cordillera Blanca. Starting when the dam was put into operation, the watershed’s streamflow has been carefully monitored. As a result, many of the glacierized Santa tributaries were equipped with stream stage and precipitation gauges starting in the 1950s. Regrettably, the long-standing gauge network fell into disrepair at the end of the 20th century in the midst of reforms that privatized hydroelectric generation (Carey, 2010). By the beginning of the 21st century, only three of the stream stage stations - La Balsa (situated just upstream of the power plant), Paron and Llanganuco- remained in operation or had been reactivated after an interruption of several years.
3. Methodology
3.1. Data acquisition and screening
In 2008, Ohio State University, McGill University, the French Institut de Recherche pour le Developpement (IRD) and the Peruvian glaciology unit of the Autoridad Nacional del Agua (ANA) launched a joint project to improve the stream-gauging station network throughout the Cordillera Blanca. Of a total of 13 stations put into operation in 2008 and 2009, five were at historical network measurement points (Fig. 1): Chancos, La Recreta, Pachacoto, Querococha and Miraflores (the latter not used in this study).
The stations presented in this study are equipped with two Solinst 3001 Levelogger series pressure transducers. One transducer is placed into the water at a depth that ensures constant immersion, and a second transducer is placed above the maximum water level to measure atmospheric pressure. The water level is calculated by subtracting the atmospheric pressure from the total pressure measured by the submerged transducer. Both sensors record the pressure at synchronous 15 min intervals, and, for the purpose of this study, records are averaged to daily values. Water levels are converted to discharges using standard hydrological techniques (Reference DingmanDingman, 2002).
In addition to the new discharge data, we analyzed the original historical discharge dataset which begins in 1952 and includes time series for 17 stations. A quality-control analysis of the time series was used to prevent interpretation errors. Suspect drops, peaks or plateaus disqualified portions of a station’s record. Missing data and interruptions in records were evaluated for possible interpolation in order to avoid the losses of valuable data which arise from the outright rejection of years with gaps. At the same time, the following rules were developed to prevent filling data gaps inappropriately: (1)gaps of less than 7 days were systematically filled using linear interpolation between the two points delimiting the gap;(2) for gaps greater than 7 days, a decision was made case by case, with linear or polynomial interpolation applied where there was no risk of corrupting the time series; (3) years that had remaining gaps were systematically rejected;and (4) time series for which more than 12 years were rejected were not considered for the study. Of the 17 stations, only 9 were found suitable for the trend analysis based on these criteria. About 6000 (less than 5%) of the 132 000 daily discharge values were derived from interpolation (Table 1). A total of 66 years of data were rejected due to potentially insufficient data quality. Despite the efforts and major discarding made during the data screening, it remains possible that the interpolation could have affected the quality of the datasets. This risk, characteristic of historical data research, has to be considered when interpreting the study results, though by following our strict criterion these problems should be minimized.
A description of discharge measurement points, drainage basins, the discharge time series and the interpolations made. ‘Number of years available’ is the number of years with recorded data that were screened for quality control. The number in parentheses, where shown, is the number of these years of data from the new rehabilitated stations

In the historical dataset, Paron represents a special case. Beginning in the mid-1980s after several years of civil engineering work, the level of Lake Paron was regulated by a drainage tunnel. Therefore, even though the discharge at the lake outlet continued to be monitored, it was inappropriate to use these records for the purpose of the present study.
Precipitation records originally included time series for 36 measurement points, with the oldest starting in the late 1940s and the most recent ending in the early 2000s. As the original data quality differed from location to location, a group of seven measurement points was selected for a reconstituted time series for 1954-99 (Reference PouyardPouyaud and others, 2005). In the present study, we make use of these seven time series (Paron, Llanganuco, Chancos, Huaraz, Querococha, Pachacoto and La Recreta) to study precipitation trends for the Cordillera Blanca region (Fig. 1).
3.2. Trend analysis
The impact of glacier retreat on medium to large watersheds includes changes in annual discharge, dry-season discharge and flow variability (e.g. Reference Braun, Weber and SchulzBraun and others, 2000;Reference Jansson, Hock and SchneiderJansson and others, 2003;Reference Barnett, Adam and LettenmaierBarnett and others, 2005;Reference Hagg, Braun, De Jong, Ranzi and CollinsHagg and Braun, 2005;Reference Stahl and MooreStahl and Moore, 2006;Reference CollinsCollins, 2008;Reference MooreMoore and others, 2009). Therefore, when there is sustained glacier retreat it should be possible to quantify the influence of glacier retreat on watershed hydrology by identifying trends in these discharge characteristics.
In the present study, three discharge characteristics were used to quantify change in: (1) the mean annual discharge, Q; (2) the dry-season discharge;and (3) the yearly coefficient of variation in daily discharge, Cv. As the timing of the dry season may vary slightly from one year to another, we used two values for dry-season discharge: the dry-season average, Q d, and the lowest, 10-consecutive-day average for a given year, Q min. Q d was computed by averaging daily discharge from July and August, the lowest discharge months at La Balsa.
The Mann-Kendall test (Reference MannMann, 1945), a nonparametric distribution-free method, was used to identify significant trends in Q, Q d, Q min and Cv time series and to differentiate between significant evolution of annual parameters and random variations. This test was used in numerous hydrological studies (e.g. Reference Hirsch and SlackHirsch and Slack, 1984;Reference MarengoMarengo, 1995; Reference KundzewiczKundzewicz and others, 2005;Reference Xu, Liu, Fu and ChenXu and others, 2010), and was justified by its high efficiency even with non-normal, incomplete time series (Reference Yue and PilonYue and Pilon, 2004). The sign of the standard normal statistic (e.g. Reference Xu, Liu, Fu and ChenXu and others, 2010) indicates the slope of the trend. A positive slope denotes an increase with time, whereas a negative slope indicates a decrease. The tested significance levels, a, are 0.001, 0.01, 0.05 and 0.1.
Mann-Kendall tests were performed on all historical time series that were found acceptable through the quality control described above. The new discharge measurements were considered in the trend analysis where the number of years between the end of the historical record and the station rehabilitation time was considered as not liable to bias the trend analysis. As a consequence, for datasets that present more than 50% of years with missing data over the 19892009 period, the recent measurements are given for information only and are not integrated into the historical time series used for the trend analysis. This criterion, although not 100% selective, was used to ensure the trend analysis quality while keeping time series as long as possible. If significant bias wereto still arise from these minortemporal gaps, it would be detected at the model validation stage (see Section 4.4. below).
Mann-Kendall tests were applied at two levels. At the first level, the overall time-series trend was evaluated by considering the complete period of the accepted records. For stations that had a change in the trend, a linear trend characterization would have misrepresented the true rate of parameter change with time. Therefore trends on subsets of the complete time-series segments were analyzed. Possible minima or maxima in the complete time series were identified where the derivative of the quadratic regression equation (for the different parameters of interest) was zero. A second level of Mann-Kendall linear trend analysis was then applied to sub-periods corresponding to the time before and after the year of trend change. The same procedure was applied to yearly precipitation amounts.
3.3. Trend interpretation model
We related detected measured trends to changes in glacial hydrological influence by using a simple model of water balance. This model generates synthetic hydrographs from the watershed area, the glacierized surfaces, and the annual rate of loss of ice area. The glacierized coverage of a watershed is a critical parameter that generates disparities among basins in hydrological response to glacial retreat (Reference Birsan, Molnar, Burlando and PfaundlerBirsan and others, 2005;Reference Lambrecht and MayerLambrecht and Mayer, 2009; Reference Alford and ArmstrongAlford and Armstrong, 2010;Reference Koboltschnig and SchdnerKoboltschnig and Schoner, 2010; Reference ViviroliViviroli and others, 2010). However, the percentage of glacier area alone is often insufficient to describe glacial influence on stream discharge for a given watershed. The melt component of basin discharge is primarily dependent on the energy balance of snow and ice with different characteristics such as hypsometry, orientation or density (Reference OhmuraOhmura, 2001). These factors vary from basin to basin, creating differences in hydrological response to glacier retreat. Here we account for these variations by using the annual rate of ice area loss, γ.
The following water balance equation is used with yearly average values for studied watersheds:
where Q is the stream’s outflow, ΔS is the change in water storage over the same period, PP is the yearly volume of precipitation entering the watershed, ET is basin-wide evapotranspiration and GWin and GWout are the groundwater fluxes entering and leaving the watersheds respectively. Considering that all watersheds studied are situated in mountainous environments, we hypothesize that the net watershed groundwater exchange, GWin-GWout, is very small compared to the other components of the water balance and can be ignored. The evapotranspiration term includes evaporation from rivers and lakes (ETrl), evaporation from bare soil, vegetative surfaces (ETngl) and sublimation from ice and snow surfaces (Sub) (adapted from Reference DingmanDingman, 2002). Substituting, Eqn (1) then becomes
For time series that are several decades long, we consider that the change of water storage is only dependent on glacier volume changes, with other storage variations balancing over decadal time periods. ΔS is therefore assumed to be equivalent to the annual change in glacier volume expressed in water equivalent. To account for the amount of sublimated volume as a factor, the PP term is split into precipitation that falls on a glacierized area and that which reaches the ground in non-glacierized areas:
where ΔV gl is the interannual change in glacier volume expressed in water equivalent, pp and etngl are the average depth of precipitation received and the non-glacierized evapotranspiration per unit area respectively, d melt is the fraction of annually ablated ice (or snow or firn) that is not lost by sublimation and A gl and A T are the glacierized areas and total watershed areas respectively.
To simplify Eqn (3), we introduce β, a factor that relates V gl to the glacierized area, A gl. Assuming β is constant over time, we can consider
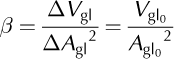
where V glo and A glo are the initial ice volume and glacier area respectively.
The annual rate of ice area loss, γ, is the interannual change in glacial area, ΔA gl, divided by the glacial area, A gl, of the previous year. In a time-series context, applying simple algebra to this definition for a given year, n, makes it possible to relate γ n to Δ(A gl n 2 ) and the glacierized area, A gl n , to the initial glacier cover A gl0 as follows:

Combining Eqns (3-5) leads to the following expression of the annual discharge for a given year, n:
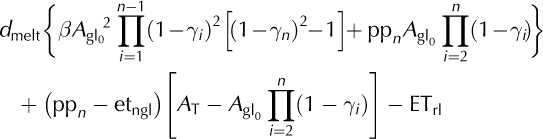
With Eqn (6) it is possible to estimate the annual average discharge using data on precipitation and glacial retreat, as well as the watershed and initial glacierized surfaces. This assumes that the evapotranspiration terms, ETrl and ETngl, and the sublimation factor, (1 -d melt), do not vary significantly during the study period.
When focusing on the dry season, a distinction is made between fast flow and slow flow for the non-glacierized area of the watershed. Fast flow is defined here as the portion of precipitation that reaches the watershed outlet within a few days of falling, and assumes no loss due to evapotranspiration . Slow flow is defined as water released from the watershed over a time-span longer than a few days, and is assumed to be mainly groundwater-based. Considering that the Cordillera Blanca receives almost no precipitation between June and September, it is assumed that the fast- flow component for the dry season is negligible. The dry- season slow-flow discharge, q ngl, accounts for the water released from groundwater minus the specific evapo- transpiration, ETngl, from non-glacierized areas.
Focusing on the dry season requires accounting for the seasonality of the glacier melt rates. During the dry season, the specific humidity is low, and the vertical water-vapor pressure gradient over the glacier surface is generally positive downward, making conditions favorable for sublimation to occur and decreasing the amount of energy available for total ablation (Reference Winkler, Juen, Molg, Wagnon, Gómez and KaserWinkler and others, 2009). We introduce a, defined as the fraction of annual ablation that occurs during July and August, and use d′melt instead of d melt to adapt Eqn (6) for dry-season discharge:
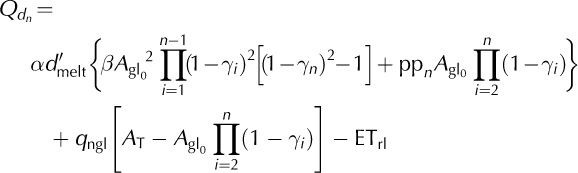
Again it is possible to estimate the average discharge of the dry season using precipitation and the rate of glacial retreat time series, as well as the watershed and initial glacierized surfaces. This assumes that ETrl, q ngl and the sublimation factor, (1 - d melt), do not vary significantly over the study period.
The yearly coefficient of variation of discharge, Cv, is

where Q melt, Q slow and Q fast are the melt, slow-flow and fast-flow components of the yearly average discharge respectively, σQ melt, σQ slow and σQ fast are the melt, slow-flow and fast-flow standard deviations and ∑cov describes the sum of flow-types pairs covariance. If we consider the individual coefficient of variation for the three flow components as being constant over the years, the equation is

Based on Eqns (6), (7) and (9), the model generates annual average discharge, dry-season discharge and discharge coefficient of variation for periods greater than 10, years. Due to the diverse assumptions made in the model design, it is expected that the trends in modeled parameters, as well as the final (for A gl = 0) versus initial discharge ratios, will be most accurately reproduced.
3.4. Assessing influence of precipitation on discharge trends
Eqns (1-6) indicate it is possible to estimate the annual average discharge using only precipitation and glacial retreat data if we assume that the evaporation- and sublimation-related terms do not vary significantly during the study period. This means that characterizing the impact of glacier retreat on discharge first requires characterizing the influence of precipitation.
A correlation study between the seven precipitation time series at Parόn, Llanganuco, Chancos, Huaraz, Querococha, Pachacoto and La Recreta (Reference PouyardPouyaud and others, 2005) was used to assess the spatial homogeneity of precipitation across the region. A trend analysis (described earlier) was also performed on each time series, and the results of both analyses were used to further explore the regional variability and possible regional patterns of yearly precipitation values. We then statistically compared discharge parameters from all studied watersheds to regional precipitation records. When a ‘minimal correlation’ (R 2 ≥ 0.2 and p-value ≤0.1) was not obtained between Q, Q d, Q min or Cv and the yearly amount of precipitation of the closest measurement points, it was considered that discharge variability cannot be explained by precipitation changes. For all cases where a minimal correlation was detected, a new trend analysis was performed with the precipitation time series using the same time periods as the corresponding discharge parameter. In cases where significant trends of similar sign (i.e. positive or negative) were detected both in precipitation records and in discharge parameter values, the discharge parameter trend was excluded from the result interpretation.
In addition, to avoid identifying trends related to temporary climatic phenomena that could arise from shortening time series, the discharge dataset was screened for generalized common patterns in measurements. If such a case was detected, corresponding datasets were similarly excluded.
3.5. Estimation of glacier coverage
The published data on glacierized areas by watershed that we considered cover different time periods: (1) 1963-70 and 1997 (Reference Mark and SeltzerMark and Seltzer, 2003);(2) 1990-91 (Reference Kaser, Juen, Georges, Gómez and TamayoKaser and others, 2003);(3) 1930, 1970 and 1990 (Reference GeorgesGeorges, 2004); and (4) 1948, 1962 and 1973 (for Yanamarey glacier only) (Reference Hastenrath and AmesHastenrath and Ames, 1995). Combining these published data required occasional adjustments to ensure consistent definitions of watershed areas. There are only minor differences in watershed areas between the first two studies, so the calculation of watershed glacial cover was considered comparable for publications 1 and 2. However, the extensive dataset in Reference GeorgesGeorges (2004) features a format that presents glacierized areas by mountain group, rather than by watershed. To accurately compare formats, we first evaluated the proportion of glaciers in the mountain groups of publication 3 that drain into the watersheds of publications 1 and 2, and weighted the published glacierized areas accordingly to derive watershed-based glacier coverage for the same years 1930, 1970 and 1990. The same procedure was applied for the computation of the Querococha watershed glacierized area with publication 4. Overlaps between studies were used to fine-tune the weighted average factors.
Advanced Spaceborne Thermal Emission and Reflection Radiometer (ASTER) satellite imagery was used for recent estimates of glacier area. Despite the lower resolution of ASTER imagery compared to other sources, it has provided an important multitemporal data product to map glacier changes as part of the Global Land Ice Measurements from Space (GLIMS) project, and the Cordillera Blanca has been featured as a specific case example of the GLIMS application (Reference Racoviteanu, Arnaud, Williams and OrdonezRacoviteanu and others, 2008; Reference Raup, Khalsa, Armstrong, Helm, Dyurgerov, Lacoste and OuwehandRaup and others, 2008). We selected images from 2001-03 and 2009-10 with available images that spanned the entire mountain range. This necessitated compilations of multiple images to obtain cloud-free coverage. For each time period, we computed the amount of glacierized coverage by digitizing glacier boundaries with GIS software. The lower termini were used to evaluate changes in area. Delimiting edges between individual glaciers at the upper regions of watersheds is inherently uncertain given the steep terrain, uniform surface reflectance and limited image resolution. But because our objective was to compute relative changes in glacierized area aggregated by watershed, we did not need to distinguish between individual glaciers. We did not apply ASTER resolution (15 m panchromatic) to define individual glaciers, but rather the changes in total glacier coverage between periods. We calculated the watershed areas using 1:100 000 digitized contours and lakes and rivers from Instituto Geografico Nacional, Peru. The glacier- ized area of each watershed was calculated based on the method and recommendations formulated by Reference Racoviteanu, Paul, Raup, Khalsa and ArmstrongRacoviteanu and others (2009).
The resulting glacier coverage data were used to compute the annual rate of ice loss, γ, for each studied watershed. Linear extrapolations were used between the discrete years of published or estimated glacierized areas to estimate the annual values required for the model. The glacier coverage data are used to generate synthetic datasets for model calibration and were limited to the years matching those used for the discharge data trend analysis.
3.6. Model parameterization and validation
The initial parameterization of the model was based on published parameter values (Table 2). When directly applicable parameters were not available, specific parameters were developed to estimate them, such as the factor β that relates the watershed glacierized area, A gl, to its volume, V gl (see Eqn (4)). We used the glacier volume-area power relationship (Reference BahrBahr, 1997;Reference BahrBahr and others, 1997) to determine the relationship between the volume of a single glacier and its surface area in the Cordillera Blanca. As tropical glaciers are generally thinner than alpine glaciers due to their relatively high inclination (Reference Kaser and OsmastonKaser and Ost-maston, 2002), the scaling factor of the power equation was computed based on published local volumes and areas. We used published glacier volumes or mass balances for glaciers situated in the tropical Andes in Bolivia (Reference RamirezRamirez and others, 2001;Reference Rabatel, Machaca, Francou and JomelliRabatel and others, 2006;Reference SorucoSoruco and others, 2009) and in Peru (Reference Hastenrath and AmesHastenrath and Ames, 1995;Reference Ames and HastenrathAmes and Hastenrath, 1996). Using the scaling exponent of 1.375 suggested by Reference BahrBahr (1997), the best nonlinear regression result (R 2 = 0.94;root-mean-square error = 0.008 km) was obtained with a scaling factor of 0.04088 (Fig. 2).
Initial parameters for the hydrological model. The ‘Range’ column indicates the parameter range used for the model application to different watersheds. No range means that the parameter is constant regardless of watershed

Ice volume versus glacier area for tropical glaciers of the Andes. Black dots represent measured values from Reference Hastenrath and AmesHastenrath and others (1995), Reference Ames and HastenrathAmes and Hastenrath (1996), Reference RamirezRamirez and others (2001), Reference Rabatel, Machaca, Francou and JomelliRabatel and others (2006) and Reference SorucoSoruco and others (2009). The blue line plots the Reference BahrBahr and others (1997) equation with slope adjusted to fit the measured values. The dashed portion of the blue line corresponds to the projection of the trend outside the regression range. The red curve represents the ice volume evaluated for the glacierized area of a watershed rather than for a single glacier.

While valid for individual glaciers, the resulting power relationship is not directly applicable to the model which requires watershed glacierized area. For watersheds with an area of less than 1 km2, the ice volume estimation would remain valid, but it would be overestimated for larger glacierized areas that are usually a combination of several individual glaciers. To establish a relation between individual glaciers and watershed glacierized area thicknesses, we used a simplified version (using three bins) of the area-frequency distribution of the 485 glaciers of the Cordillera Blanca that was established by Reference Racoviteanu, Arnaud, Williams and OrdonezRacoviteanu and others (2008). We calculated the initial watershed glacierized volumes, V gl0 , as follows:

where i is the repartition bin number, n i is the number of glaciers for bin i, and V ui is the corresponding glacier volume area of the bin compiled from Reference Racoviteanu, Arnaud, Williams and OrdonezRacoviteanu and other (2008). The β factor is determined from a watershed’s initial conditions using Eqn (10) and remains constant during the simulation. The relation between V gl0 and A glo that results from the Eqn (10) is plotted in Figure 2.
The initial values of other parameters and the sources used to estimate them are given in Table 2. A limited number of initial parameters (Table 2) were adjusted to obtain the best possible fit between projected and measured variables at the study watersheds. The model’s ability to reproduce trends was assessed by comparing model output to the Mann-Kendall results of the measured discharge data. Evaluating the model’s ability to situate the final (Q end) versus the initial (Q 0) discharges ratio was not achievable directly, as none of the observed discharge time series covers the complete disappearance of the glaciers. Therefore, we used the stream’s yearly discharge in the last year of the time series, Qn , instead of Q end. The error associated with Q n /Q 0 ratio estimation was therefore considered greater than those related to Q end/Q 0.
3.7. Model sensitivity to glacier retreat scenarios
Once calibrated, the model was used for a sensitivity analysis to determine how the key model parameters affect the simulated trend of discharge-related parameters under different scenarios of glacier retreat. Annual precipitation was kept constant across the entire simulation period, based on results of the precipitation trend analysis shown below.
A ‘median’ scenario was defined, based on a quasiexponential increase of γn and on studied watershed characteristics. Sensitivity analysis was done by comparing this median simulation (scenario a) with five ‘variant’ scenario outputs (b-f, Table 3), each differing from the median scenario in one parameter only. Because of the numerous ways in which γ n can vary with n, two variants of the γ n function were tested: scenario e had a continuous glacial retreat scenario (linear) while scenario f involved more complexity (an oscillating function with periodic negative recession phases and a positive average in the period studied). Simulations were run until the glacier area approached zero and the yearly average discharge stabilized.
Parameter values and formulas used in the sensitivity analysis scenarios. The ‘Median’ scenario (a) is the reference scenario. Other letters in parentheses (b-f) refer to the parameter changed for a given scenario

The median scenario was also used to explore the notion of phases of glacier retreat as a function of watershed parameters, a useful prognostic used in other studies (e.g. Reference CollinsCollins, 2008;Reference Milner, Brown and HannahMilner and others, 2009;Reference MooreMoore and others, 2009). Four different phases were defined on the basis of significant trend changes that occur in model outputs while the glacier coverage decreases. This classification was subsequently used to categorize the nine different studied watersheds.
3.8. Potential future hydrologic impacts of glacier retreat
To determine how glacier retreat will affect future hydrological regimes, the model was run in a ‘rapid-retreat simulation’ with a hypothetical extreme rate of glacier retreat. The rapid-retreat initial conditions are comparable to those of our study watersheds in 2009 as opposed to decades ago. The ‘median’ retreat scenario (scenario a, Table 3) was used as a starting point and more than 2000 Q 0 values were calculated based on combinations of percentage of initial glacierized area cover A gl0 and annual rate of ice area loss, γ0. A gl0 ranged from 0.1% to 50%, γ0 from 0 to 0.04, and watershed area was constant at 200 km2. For each of the initial condition combinations, the annual rate of ice area loss, γ, was increased by 1% of glacier area per year until the glacier was completely melted, which was almost 50 times faster than the average γ increase observed at the nine studied watersheds between 1930 and 2009. This hypothetical retreat would generate a meltwater release and a subsequent discharge increase for at least the first simulation year regardless of the initial condition. The magnitude and duration of this simulated increase reflected the capacity of glaciers to further increase the watershed flows. To evaluate this capacity ∫ Q +, a dimensionless parameter that represents the amount by which the perturbed discharge, Qi , exceeds initial discharge, Q 0, was used, and was computed as follows:

Simultaneously, the impact on the watershed annual discharge of a glacier completely melting was evaluated by computing Q end/Q 0, the final versus initial mean annual discharges ratio. This ratio provides a direct indication of how much the annual discharge will decrease once the glacier disappears compared with that calculated based on initial conditions.
In addition to annual discharges, the rapid-retreat simulations were used to compute ∫ Q + and Q end/Q 0 for dry-season discharge.
We estimated the ∫ Q + and Q end/Q 0 values for the studied watershed by comparing watershed A gl and γ values calculated for 2009 with the rapid-retreat simulation results. This method of interpretation of simulated results made it possible to qualitatively describe potential future hydrologic impacts of glacier retreat on the studied watersheds.
4. Results and Discussion
4.1. Changes in glacierized area
The studied watersheds have a wide range of percent glacierized area (Table 4). With 39% in 2009, Paron is the most highly glacierized watershed, while La Recreta is the least glacierized, with 1% the same year. From 1930 to 2009 the percent glacierized area within every watershed decreased. This is confirmed by the γperiod values (the annual rate of ice area loss from 1930 to 2009;Table 4) which are all positive for the period studied. The La Balsa watershed, which drains the entire upper Río Santa, has an average of 0.61% a-1 area loss, which is the median for the nine studied watersheds. The Llanganuco and Querococha watersheds exhibit the fastest glacial area reduction, with an average loss of 1% a-1 and 1.1% a-1 respectively. Los Cedros has the lowest γperiod, with an average loss of 0.38% a-1. Except for Colcas, Los Cedros and Parόn, there is a clear acceleration in glacierized area reduction across the studied watersheds over the past two decades. The average γ value for the period 1990-2009 was double that for 1930-2009 at Chancos, La Recreta, Pachacoto and Querococha, indicating a probable exponential rate of depletion. La Balsa values confirm this acceleration. The 1990-2009 annual percentage glacier area loss reaches 0.81, which is roughly 30% greater than was measured during the 1930-2009 period.
Glacierized percentage of watershed areas. Years in italics are derived from publications (Reference Kaser, Juen, Georges, Gómez and TamayoKaser and others, 2003; Reference Mark and SeltzerMark and Seltzer, 2003; Reference GeorgesGeorges, 2004). The others (2002 and 2009) were computed using ASTER satellite imagery. The specific acquisition dates for selected ASTER images were 1 August 2001, 25 May 2002, 17 June 2002, 13 July 2003, 28 May 2009, 11 June 2009, 13 July 2009, 29 July 2009, 7 August 2009 and 29 May 2010. The historical values for Querococha are from Reference Hastenrath and AmesHastenrath and Ames (1995) and cover slightly different time periods indicated in parentheses. γperiod and γ90-09 represent the average rate of ice area loss for the periods 1930-2009 and 1990-2009 respectively T

The recession-rate results provide an internally consistent comparison of changes overtime. Our protocol to generate γ time series invokes a level of uncertainty, estimated at around 5% based upon our inclusion of historical estimates of glacierized areas from different sources and comprising different interpretations of glacier areas by different methods (Table 4). Despite these unavoidable limitations, the generated time series was considered to be adequate for the purpose of this study because the model simulations generated from these time series are used to compute trend analyses only and the results obtained from these simulations are compared to observed discharges for model validation.
4.2. Trends in discharge parameters
The dry-season average discharge time series are used to illustrate how the studied watersheds evolve hydrologically over time (Fig. 3). Overall, the data show a dominant decrease in dry-season average discharge during the study period. An increase in dry-season average is observed with the Parόn dataset, a particularity that could be related to the length of the study period for this watershed. No trend is detected in the Llanganuco dry season throughout the study period. There is a decrease in dry-season stream discharge between the 1950s and 1990s for the seven other watersheds. This regionally dominant pattern is also observed in the La Balsa time series which has lost more than 10% of its average dry-season discharge in little more than half a century. This decrease cannot be attributed fully to the change in glacial cover, as other factors (e.g. changes in land use, agricultural practices or population density) also might have affected regional river discharge regimes. However, high-elevation watersheds like Querococha or Pachacoto, where there is low human impact, also present an overall dry-season discharge decrease, suggesting that the change in glacial cover explains, at least partly, the observed dry- season discharge decrease at La Balsa. Four of the watersheds feature a local maximum in polynomial regression curves and four a minimum. No maximum or minimum is detected at Llanganuco. The timing of minima or maxima in polynomial regression curves varies from 1958 for Paron to 1994 for La Balsa. These differences in curve profiles suggest that it is unlikely that trends related to short interannual climatic phenomena would be detected by the Mann- Kendall test.
Dry-season average discharge calculated from daily data (solid blue line). Linear and quadratic regression lines (curves) calculated from datasets are drawn in black dashed lines and full black curves respectively.

For Mann-Kendall tests with significance values of 0.1 or lower, the random origin of trends can be excluded, allowing further refinement of the trend analyses (Table 5). With the exception of Parόn, all significant discharge trends indicate a decrease in discharge throughout the total period and/or during the second sub-period. On no occasion were contradicting indications observed between Q, Q d and Q min. At Chancos, Los Cedros and Querococha, the decrease in discharge was preceded by an increase in at least one of the three discharge parameters. This phase ended much earlier (around 1962) at Los Cedros than at the two other locations (1980 and 1975, respectively). On five occasions, Cv presented significant trends. At La Balsa and La Recreta, the results indicate an increase in variability with time, either for the full period of record or at least for one of the subperiods. The only watersheds where significant decreases in yearly discharge variability were detected are Paron (across the full time series) and Colcas (in the first sub-period). The results show that an increase in discharge is systematically associated with a decrease in variability and vice versa.
Results of Mann-Kendall trend analysis. The ‘α’ columns describe the level of significance of the reported trends. Statistically significant trends are in bold

For the precipitation records, the trend analysis shows a more heterogeneous situation. Of the seven time series we studied, three exhibit a negative trend and four a positive trend during the 1954-99 period. Chancos and Huaraz both have positive, statistically significant trends. The same disparity is observed for trends analyzed using sub-periods: three (one significant) of the seven time series show a negative trend during the first sub-period, and two (one significant) during the second sub-period. Years of minimum or maximum values differ widely between measurement locations. These results suggest the absence of a clear region-wide trend in precipitation over the study period. This spatial disparity is confirmed by the correlation study performed on the seven precipitation datasets (Table 6). Significant R 2 vary from only 0.09 between Parόn and Chancos, to 0.54 between Pachacoto and La Recreta. Most of the R 2 values are around 0.3, corresponding to a low level of linear correlation. These results are in line with previously published studies that describe unclear trends in regional precipitation data or in projections (Reference Urrutia and VuilleUrrutia and Vuille, 2009;Reference Chevallier, Pouyaud, Suarez and CondomChevallier and others, 2010). Reference VuilleVuille and others (2008a) also describe the lack of a clear trend in precipitation for the Cordillera Blanca area. They report a difference in tendency between regions situated south (a possible decrease) and north (a possible increase) of about 11° S. Situated between 8°38’ S and 10°02’ S, the Cordillera Blanca lies near the boundary of these two regions. Therefore, since using a single precipitation time series to represent a regional tendency is not possible, time series from the three nearest measurement points are used for comparison to each watershed’s discharge parameters.
Coefficient of determination (R 2) and statistical significance (p-value) calculated for the seven precipitation time series. R 2 values appear below the oblique line, p-values above. R 2 values equal to or over 0.2 associated with a p-value under 0.1 are in bold

4.3. Precipitation influence on discharge trends
Results of the correlation study between precipitation records and discharge parameters are reported in Table 7. First, we note that the degree of influence (number and magnitude of detected ‘minimal correlations’) varies from watershed to watershed. Broadly, the watersheds that present the lowest relative glacierized areas (Table 4) have discharge parameters more correlated to annual precipitation. The degree of influence of precipitation on discharge parameter variation also differs from parameter to parameter. With only one exception (Q d at La Recreta), Q d and Q min do not correlate, or correlate weakly, with the precipitation. Correlation with Q and Cv is more established but still weak, as less than 50% of the calculated R 2 values do not reach the minimal correlation level and 75% of those that do are below 0.5. As a general pattern the influence of precipitation on discharge parameter variations is small (Table 7), and mainly affects the less glacierized watersheds. Based on this correlation study, trends in all studied discharge parameters at Colcas and Paron are considered to be free of the influence of precipitation, while at the other watersheds only Q d and Q min are independent of precipitation (Q min only at La Recreta).
Coefficients of determination (R 2) and their associated statistical significance (p-value) calculated between the precipitation records from the three closest measurement points and the discharge parameters of each gauging station. R 2 values equal to or over 0.2 associated with a p-value above 0.1 are in bold

The lack of a regional trend in yearly precipitation amounts, as well as the weak level of correlation that exists between discharge parameters and yearly precipitation, makes it difficult to justify using a precipitation trend to force the model. We therefore fix watershed-specific yearly precipitation values in all model simulations.
4.4. Model validation
Modeled discharge trends were compared with measured discharge trends by counting how often a significant trend detected in measured discharge was reproduced by the model. The results in Table 8 are reported as the percentage of times that both trends were similar for both linear and quadratic regressions. Of the 37 significant trends detected using the Mann-Kendall test, 36 were correctly reproduced by the model for an overall match value of 97%. Despite the uncertainty related to the glacierized area evaluation and the hydro-climatic datasets, the model reproduced the trend of the four different parameters used in the study very satisfactorily. The model performance in estimating the Q end/Q 0 ratios is poorer than in reproducing trends, but its mean absolute error, less than 0.17, is acceptable for the purpose of the study. Evaluating the Q n /Q 0 ratios correctly is not explicitly required, as the simpler Q end/Q 0 ratio only is used. This validation step did not highlight any deviation that would characterize dataset bias related to gaps in the historical data. This supports the assumption made earlier that these gaps did not generate mis-estimation of the trends.
Model performance evaluation. The ‘Linear trends’ and ‘Quad. trends’ columns provide a comparison of the number of observed (Obs.) significant trends in the time series and the number of matching trends in the modeled results (Mod.) for linear and quadratic regressions respectively. The ‘Q n /Q 0’ column shows the error calculation components for the Q n /Q 0 ratios

4.5. Model simulations
To test the model sensitivity, six synthetic sets of time series were generated. The median scenario (Fig. 4a) visually conforms to the expected hydrologic progression (see citations in section 3). While the glacier area is continually decreasing, both the annual average discharge and the dryseason discharge experience a period of increase followed by a period of decrease and then a period of stabilization below the initial levels. The ending dry-season discharge is approximately 50% lower than at the beginning, while the ending annual average discharge declines by no more than 10% of its initial level. The maximum dry-season discharge occurs approximately 10 years before the maximum annual average discharge. The period of increasing discharge is shorter than the decreasing and stabilization periods combined. In contrast to what was observed for average discharge, the coefficient of variation first decreased slightly for more than 50 years and then increased rapidly until it stabilized at a value that is approximately 50% higher.
Results of sensitivity analysis simulation. The thick black lines and the blue lines are the mean annual and dry-season discharge respectively, the yellow dashed line is the annual discharge coefficient of variation, the red dotted line is the glacierized area and the green dash-dotted line is the applied annual rate of glacier area loss. All parameters are given relative to year zero values. (a) presents the ‘Median’ scenario output, while the other five graphs are variants described in Table 3: (b) A gl0 increase; (c) A T increase; (d) γ 0 increase; (e) linear γ n increase; and (f) oscillating γ n .

When the same simulation is run with a higher initial glacierized area (Fig. 4b), we see an important change in the amplitude of the output parameters’ variation. The variation tempo remains similar to that obtained using scenario a, but all the minima are lower and the maximum is higher with scenario b. This is visually evident in the case of the coefficient of variation whose final value is approximately 150% that of scenario a. The difference in scenario c (Fig. 4c) is less pronounced. Although a change in amplitude is observed, it is minor if we consider that the watershed area is five times that of scenario a. Starting with an initial annual glacier area loss of 0.5% instead of 0 (Fig. 4d) leads to a much greater difference. None of the discharge values shows a period of increase, while the coefficient of variation increases continuously. End values are different from those achieved with scenario a as mean annual and dry-season discharges end lower, while the coefficient of variation is higher.
Changing the annual rate of glacier area loss to a linear function (Fig. 4e) does not affect the end values. For this case, the rate of change is affected, with maximum discharge values (minimum for Cv) occurring earlier than in scenario a. These extreme values are of slightly higher amplitude as well. Similarly, the last tested scenario (Fig. 4f) preserves the end values computed with scenarios a, c and e but amplifies the intermediate fluctuation. The amplification, which is caused by an extreme glacier area loss applied to the first 30 years of the simulation, is the largest observed among the six datasets. The strong model response to the first γn increase wave is not replicated in the second and third waves. Peaks in the discharge average and coefficient of variation are of low amplitude in the second wave and not detectable in the third.
Overall, the sensitivity analysis shows that the watershed area has the least effect on the simulations. It supports the hypothesis that not only is A gl0 critical to determining how glaciers influence a watershed’s hydrology, but also that γ, the rate of glacier area loss, is critical. Regardless of scenario, the complete disappearance of glaciers always led to a decrease in annual discharge, an even greater decrease in dry-season discharge and an increase in variability. The sequence of a single increase followed by a decrease in discharge is for continuous retreat scenarios. With a fluctuating glacier area (scenario f), local minima and maxima are simulated but the hydrological response decreases and approaches zero as the glacier area decreases.
We used the ‘median’ scenario, which is based on a quasiexponential increase of γ n and on the studied watersheds’ characteristics, to depict typical hydrological impact phases (Fig. 5). The evolution of hydrological parameters under the ‘median’ glacier retreat scenario enables us to distinguish four impact phases. Phase one, the early stages of deglaciation, is characterized by a smooth increase in dry-season and yearly average discharge due to a smooth initial deglaciation and ends when the coefficient of variation reaches its minimum. In phase two, the increase in annual average discharge slows until it reaches its maximum while the dry-season discharge increases and then declines and the coefficient of variation begins to increase. Phase three starts from the maximum average annual discharge and covers the pronounced decline in discharges and the corresponding increase in the coefficient of variation. Phase four includes the end of the glacier influence on outflows when changes in discharges are progressively less pronounced, asymptotically reaching a non-glacierized basin state.
‘Typical’ glacier retreat hydrological impact phases (delimited and labelled in red). The thick black line and the blue line represent the mean annual and dry-season discharge respectively, and the yellow dashed line corresponds to the annual discharge coefficient of variation. As the phases are conceptual, axes are kept unit-free.

This four-phase sequence is based on a continuously increasing rate of ice area loss. As observed in the sensitivity analysis, deviations from this path may change the phase sequence. However, the probability of this occurring decreases as we move away from highly glacier- ized conditions. Returning to a phase two from a late phase three or a phase four would necessitate either extremely high rates of deglaciation or a new long-term glacial expansion. The likelihood of this happening is not supported by recent climate change projections (Reference Urrutia and VuilleUrrutia and Vuille, 2009).
Each watershed is interpreted individually by comparing the significant trends in measured discharge to the definition of the impact phase (Table 9). This interpretation applies to the final year of observations used in the trend analysis. Significant trends in discharge parameters that show possible influence from precipitation data (three in total) are excluded from the phase allocation exercise (described above in Section 3.4). Results from the phase determination suggest that seven of the nine studied watersheds are in impact phase three. One watershed, La Recreta, shows characteristics of phase four, and another, Parόn, is still in phase one at the end of the studied discharge time series. With an overall linear regression- based decrease in dry-season discharge, La Balsa exhibits watershed characteristics of phase three. A transition from phase two possibly occurred around 1970, the year in which the increase in Cv becomes significant based on the quadratic regression-based analysis, although this possibility is not confirmed by other parameters. The fact that, on the second sub-period, an increase in Cv is measured in parallel to the dry-season discharge reduction is an indication that glacial factors are at least partially the cause for the measured decrease in discharge.
Trends associated with the ‘typical’ glacier retreat model compared to measured trends. The symbols used for trend description are ‘+’ for an increase, ‘-’ for a decrease, ‘+,-’ for an increase followed by a decrease, and ‘-,0’ for a decrease followed by parameter stabilization. The ‘Phases’ rows summarize phase definitions. Reproduced watershed data are indicated for statistically significant trends only (Table 5). In case of trends that were split by quadratic regression, the year separating the two sub-periods is given in parentheses. Trends excluded from the phase allocation due to possible precipitation influence are in gray. The cause of rejection is presented in the ‘Possible precipitation influence’ column. The watershed names are followed by the year to which the interpretation statement applies

None of the 38 measured significant trends used in this study contradicted each other in phase allocation, confirming the model’s ability to simulate the impact of long-term glacier retreat on regional stream discharge trends.
4.6. Glaciers’ potential to further influence hydrological regimes
The rapid-retreat simulation results relate ∫ Q + and Q end/Q 0 values to initial A glo and γ0 conditions (Fig. 6). ∫ Q + values are relative, as the highest values represent a high potential for generating further increase in discharge, and the lowest values a low potential. ∫ Q + values vary from 0 to 18. The lowest values (0-1) represent an almost negligible capacity of a glacierized area to generate a significant flow increase even under the extreme retreat rates used in this set of simulations. In contrast, the highest values characterize watersheds where discharge parameters are highly sensitive to changes in glacier retreat path. Q end/Q 0 values vary from 0.1 to 1. The lowest values, obtained for the dry season, represent drastic stream discharge reductions while values above 0.9 will have a low impact on water resources.
Variations of ∫ Q + (top graphs) and Q end/Q 0 (bottom graphs) for the rapid-retreat simulations, as a function of percentage of glacierized area and the annual rate of ice area loss. Colors represent values of ∫ Q + (indicator of the glacier’s capacity to further increase the watershed flows) and of Q end/Q 0 (starting and ending simulated discharge ratio). Full year simulations appear on the left, and dry-season simulations are reported at the right. All parameters are dimensionless.

The results show the critical role of γ0 in a glacierized watershed’s response to glacial retreat, especially for glacial cover greater than 5%. A watershed that has a 25% glacierized area, for example, shows annual ∫ Q + values that range from almost 0 to 10, depending on the value of γ0, and is even more pronounced when only the dry season is considered. The same situation is observed with the Q end/Q 0 ratio where changes in γ0 can decrease the projected loss in discharge once the glacier is melted by more than 40%.
We estimate the studied watersheds’ ∫ Q + and Q end/Q 0 values by comparing their characteristics to the rapid-retreat scenarios (Fig. 6). With the lowest ∫ Q + values, La Recreta’s and Querococha’s discharge should not experience a glacierized area-loss-related measurable increase in annual or dry-season discharge. Once the glaciers have completely disappeared, the discharge at La Recreta should remain almost unchanged compared to the present level, while Querococha should exhibit a slight dry-season decline.
Future glacier influence should be slightly greater for Pachacoto, even if there is a low probability of an increase in melt-related average discharge. The main difference between Querococha and Pachacoto is in their dry-season Q end/Q 0 ratios, which are about 0.8 and 0.6 respectively.
In the long term, Parόn is the watershed that should experience the most drastic glacier retreat impact. Not only do its glaciers present the highest potential to generate retreat-related discharge increases at yearly and dry-season levels, but with the complete disappearance of glaciers the dry-season discharge could decline to less than 40% of its present level. Yearly discharge averages would also decrease, but to about 70% of their present level.
Colcas and Los Cedros have almost the same glacierized area percentage and annual rates of ice area loss. These two watersheds have ∫ Q + values that are among the highest, although their Q end/Q 0 ratios are close to the average. These characteristics suggest that the potential for an increase in discharge is among the highest, but that the drop in flows after the glaciers have receded will be less drastic than for Chancos or Llanganuco, the latter being predicted to decrease by more than 60% compared with the actual dry-season regime. Plots of La Balsa ∫ Q + values and Q end/Q 0 ratios vary between extremes. When a full year is considered, the potential to further increase discharge due to glacier retreat acceleration is very low. Similarly, the Q end/Q 0 ratio remains high, around 0.9, for the Rull year average. The dry-season situation is different, as the ∫ Q + value for La Balsa is average while the Q end/Q 0 ratio is approximately 0.7. A loss of 30% of the dry-season discharge at that station would not be without consequences, especially when considering that, on some occasions, the Río Santa almost dries up before it reaches the Pacific Ocean.
5. Conclusion
Glaciers are major components of the hydrological system in many tropical Andean watersheds, making their ongoing retreat a threat to water resources. Predicting the exact consequences of glacial retreat is difficult due to the complexity and scales of the processes involved. Our ASTER-based measurements of recent glacier changes indicate that glacier recession is accelerating in the Rio Santa upper watershed, with the overall glacierized area decreasing annually by 0.81% between 1990 and 2009.
To assess past and present influences of glaciers on stream discharge, we reanalyzed historical and modern discharge data from the Cordillera Blanca. Using a combination of regression and trend analyses, we found statistically significant indications that these systems have crossed a critical threshold, and now exhibit decreasing annual and dry- season discharge. La Balsa station, which measures discharge from the upper Rfo Santa, is undergoing a decline in dry-season flow that probably began during the 1970s. The weak correlation that exists between the discharge parameters and precipitation supports the hypothesis that these trends are driven by the glacier retreat measured during the same period.
The link between glacial retreat and water resources is analyzed by the use of a simple water balance model. It simulates how glacier retreat can influence the annual and dry-season discharge, as well as the annual discharge variability, and reveals four impact phases of the resulting hydrological changes. Examining historical records and fitting them to these phases suggests a declining contribution of meltwater to the studied watershed outflows. At some watersheds, like Querococha, La Recreta, Pachacoto and La Balsa, the decline in discharge is likely not reversible. The decrease in the dry-season discharge should therefore continue for many decades as the watersheds enter an asymptotic decrease phase prior to the glaciers’ complete loss of influence on hydrologic regimes. Once the glaciers are completely melted, the discharge will likely be lower than today. In particular, dry-season discharge may decrease more than 60% from present for Paron and Llanganuco. At La Balsa, dry-season average discharge should decline to 70% of current levels.
The model sensitivity analysis confirms that the initial glacierized area is a major driver of glacier influence on hydrology. It also shows that, unlike the total watershed area, annual rate of ice area loss is as important as the initial glacierized area.
Although the upper Rfo Santa watershed still has, and should maintain, abundant water resources when annual total discharge is considered, the dry-season situation is clearly different. A decline in dry-season surface water availability has probably already begun and should continue. Considering the vulnerability of the local population to climate change and declining water resources (Reference BuryBury and other, 2011), our results can represent a future social, ecological and economic concern.
Despite the overall consistency of the results of the present research, it must be recognized that they may possibly be influenced by uncertainty related to data interpolation and glacierized area estimation. The method we used is promising and could potentially be applied to other regions of the world. However, the findings that result from its application to the Cordillera Blanca need to be confirmed by other means. In addition, the method’s accuracy should be further tested through future studies.
Acknowledgements
We are grateful for the historical discharge information provided by Abel Rodriguez and Duke Energy, Peru, and for the funding provided by the US National Science Foundation (BCS-0752175), The Ohio State University’s Climate, Water and Carbon Program, and McGill University. We thank Robert Carver for insightful comments.


