


Nomenclature
- $ \oplus $
-
vector concatenation operation
-
${\hat \alpha _i}$
-
a scalar
-
${\hat \beta _i}$
-
leave-one-out vector
-
$BN$
-
BN function
-
$C\left( \cdot \right)$
-
critic
-
$cond$
-
condition vector
-
$\skew6\hat{d}_{i}$
-
discrete value
- drop
-
dropout
-
$FC_{u \to v}(x)$
-
application of a linear transformation to a u-dimensional input to obtain a v-dimensional output
-
$gumbel_{\tau}(x)$
-
application of the Gumbel softmax function with a parameter
${\rm{\tau }}$
to a vector
${{x}}$
-
$h$
-
track angle
-
$h_{i}$
-
the
${\rm{i}}$
hidden layer -
$k{\rm{\;}}$
-
Gaussian kernel function
-
$leaky_{\gamma}\left( x \right)$
-
application of the leaky ReLU activation function on
${\rm{x}}$
with leaky ratio
${\rm{\gamma }}$
-
${\rm{m}}$
-
the maximum number of variables of Y
- M
-
number of historical tracks
-
$n$
-
the maximum number of variables of X
-
$N$
-
number of points in the track
-
$r_{i}$
-
${\rm{i}}$
th random sample
-
$s_{i}$
-
average trajectory point of the generated dataset
-
$\hat{s}_{i}$
-
average trajectory point of the real dataset
-
$\sigma $
-
width parameter of the kernel function
-
$t$
-
time
-
$tanh$
-
${\rm{tanh}}$
function
-
$v_{xy}$
-
ground speed
-
$x$
-
latitude
-
$X$
-
a random variable in the generated distribution
-
$y$
-
longitude
-
$Y$
-
a random variable in the actual distribution
-
$z$
-
geometric height
-
$\theta $
-
a parameter


Acronyms
- ADS-B
-
automatic dependent surveillance-broadcast
- ATM
-
air traffic management
- ATS
-
air traffic service
- CGAN
-
conditional generative adversarial networks
- CNN
-
convolutional neural network
- CTGAN
-
conditional tabular generative adversarial networks
- DSW
-
dynamic space warp
- ET
-
echo top
- GH
-
geometric height
- GMM
-
Gaussian mixture models
- GRU
-
gated recurrent units
- GS
-
ground speed
- HKO
-
Hong Kong observatory
- HMM
-
hidden Markov models
- ICAO
-
International Civil Aviation Organization
- Lat
-
latitude
- Lon
-
longitude
- LSTM
-
long short-term memory
- MED
-
mean Euclidean distance
- MLP
-
multilayer perceptron
- MMD
-
maximum mean discrepancy
- RMSE
-
root mean square error
- SA
-
self-attention
- SMOTE
-
Synthetic Minority Over-sampling Technique
- TA
-
track angle
- TBO
-
trajectory-based operations
- TGAN
-
table generative adversarial networks
- TMP
-
atmospheric temperature
- TP
-
trajectory prediction
- VIL
-
vertically integrated liquid
1.0 Introduction
In the past a few decades, civil aviation transportation has developed rapidly, posing significant challenges to the existing air traffic management (ATM) system. To address this issue, the International Civil Aviation Organization (ICAO) proposed the Global ATM Operational Concept, identifying trajectory-based operations (TBO) as a core technology [1]. Within this model, precise aircraft trajectory prediction (TP) is crucial for understanding the overall operational status of the airspace, as well as for improving and ensuring the efficiency and safety of the ATM system. This prediction provides the most direct reference for aircraft surveillance and control forecasts [Reference Huang and Ding2].
The challenge in accurately predicting aircraft trajectories lies in the influence of environmental conditions [Reference Zeng, Chu, Xu, Liu and Quan3]. These conditions include meteorological factors, airspace congestion and infrastructure service capacity. Convective weather and severe turbulence significantly impact flight safety, and they are the primary reasons for changes in aircraft trajectories. Typically, aircraft follow planned air traffic service (ATS) routes as outlined by the flight plan. However, when encountering convective weather or severe turbulence, ATS may direct en-route aircraft to alter their flight paths (either horizontally or vertically) and adjust their arrival times at given positions to avoid severe weather effects. Even if aircraft follow their planned routes, significant deviations can occur due to the impact of severe weather. Therefore, it is crucial to consider weather factors, particularly the impact of severe weather on aircraft TP [Reference Shi, Xu, Pan, Yan and Zhang4].
Weather information has long been used in aircraft TP. However, due to the dynamic and uncertain nature of weather, effectively leveraging its impact to improve TP accuracy remains a challenge [Reference Degas5]. To address this issue, artificial intelligence technologies such as deep learning have been introduced to aircraft TP to enhance forecasting accuracy [Reference Schimpf, Wang, Li, Knoblock, Li and Apaza6]. Nevertheless, most current studies fail to differentiate between weather types or fail to thoroughly investigate their data characteristics and impact on deep learning performance. In practical operations, severe weather significantly impacts ATM systems and is a critical issue for all sectors of air transportation. In TP, the focus is primarily on flyable weather conditions [7]. For description convenience, this paper classifies flyable weather conditions into two categories: normal and severe. Severe weather refers to meteorological conditions such as severe convective weather, heavy precipitation and low visibility, which have significant negative impacts on aviation safety and operations [7]. It excludes extreme weather conditions that render flight impossible. Other common weather conditions that affect flight but do not have a substantial impact are classified as normal weather. Due to the data scarcity, flight data under severe weather conditions account for only a small proportion compared to historical trajectory data under normal weather conditions, leading to an imbalanced dataset in aircraft TP. The flight data under severe weather conditions are considered minority-class samples. Existing TP models often perform poorly when learning features from minority-class samples in imbalanced datasets. This is because data-driven methods treat minority-class samples as outliers or fail to capture their features due to insufficient sample size, leading to decreased prediction accuracy.
Considering this situation, this paper proposes an aircraft TP framework consisting of data augmentation and TP models, with an improved conditional tabular generative adversarial network (CTGAN) used as the data augmentation network. To validate the effectiveness of this approach, the widely used long short-term memory (LSTM) model is incorporated into a hybrid model, termed CTGAN-LSTMs, to address the challenging task of four-dimensional (4D) aircraft TP, considering the influence of severe weather conditions. The main contributions of this paper are as follows:
-
(1) A novel aircraft TP framework integrating data augmentation and prediction networks, specifically designed to address data imbalance in severe weather scenarios;
-
(2) Development of the CTGAN-LSTMs hybrid model demonstrating significant accuracy improvements for short-term TP under severe weather;
-
(3) The improved performance of CTGAN over traditional Synthetic Minority Over-sampling Technique (SMOTE) for augmenting minority-class trajectory data is validated.
Through these contributions, this research significantly enhances the ability to predict aircraft trajectories under severe weather conditions, providing a feasible approach to improve TP accuracy based on minority-class sample data. The structure of this paper is as follows. Section 2 provides a literature review on the current background of aircraft TP considering the influence of weather. Section 3 introduces the overall framework of the method developed in this paper, including data preprocessing, improvements to CTGAN, design of model evaluation metrics, model training process and trajectory prediction. Section 4 presents the experimental setup and results. Section 5 discusses our contributions and limitations of the research work. The conclusions of the study are presented in Section 6.
2.0 Introduction
2.1 Application of weather data
The commonly used aircraft TP methods considering the impact of weather can be summarised into two categories based on the prediction approach: traditional kinetic approach and machine learning approach.
Traditional kinetic approach includes state estimation methods and dynamic methods. State estimation methods establish motion equations based solely on aircraft attributes such as position, velocity and acceleration. Although this model is relatively simple, it may lead to significant errors due to its inability to accurately capture aircraft manoeuvering uncertainty over long term [Reference Zeng, Chu, Xu, Liu and Quan3]. Dynamic methods build TP models based on aerodynamic principles. Modeling requires considering various factors, including aircraft performance, status, environmental conditions and intent. This involves a large number of parameters. Some parameters may be commercially sensitive and challenging to obtain. Additionally, specific parameters exhibit dynamic characteristics and change continuously during flight, making accurate estimation challenging.
Weather is a critical input parameter for TP and significantly influences prediction accuracy. Various methods have been proposed to reduce weather-induced uncertainties. For instance, Porretta et al. [Reference Porretta, Dupuy, Schuster, Majumdar and Ochieng8] utilised a standard civil aircraft 3D point mass model to simulate dynamics, decomposing wind fields into nominal and random components to improve TP accuracy. Tang et al. [Reference Tang, Chen and Zhang9] proposed methods to correct meteorological forecasts and extract nominal flight profiles, significantly enhancing strategic 4D trajectory forecasts.
Despite these improvements, traditional methods struggle to meet the high-precision, multi-dimensional demands of the TBO environment. As a result, there is a growing interest in machine learning approaches that leverage historical flight and meteorological data. These methods, such as Gaussian mixture models (GMM), hidden Markov models (HMM), multilayer perceptrons (MLP), convolutional neural networks (CNN), LSTM and generative adversarial networks (GAN), have shown promise in distinguishing weather impacts on trajectories [Reference Ma and Tian10, Reference Liu and Hansen11].
Ayhan and Samet were the first to propose the concept of surrounding weather data (feature cubes) [Reference Ayhan and Samet12], significantly influencing the subsequent development of TP models under weather impact. Their approach involved conceptualising airspace as a 3D grid network and storing weather information in each grid. By establishing the relationship between each trajectory point and the weather grid ahead, these grids became joint cubes for 4D trajectories. They then used an HMM model to predict trajectories with weather uncertainty. Subsequent research on aircraft TP considering weather impact has broadly referenced the concept of weather cubes.
Liu and Hansen proposed a deep generative network framework for aircraft TP [Reference Liu and Hansen11], which consists of an LSTM encoder network and a mixture density LSTM decoder network. The decoder network learns spatiotemporal correlations from historical flight trajectories and outputs parameters of a GMM. This model uses beam search, adaptive Kalman filtering and Rauch-Tung-Striebel smoothing algorithm during inference. It can take high-dimensional weather features (wind, temperature and convective weather) and the final flight plan as input conditions to predict the aircraft’s 4D trajectory.
Inspired by Ref. [Reference Liu and Hansen11], Pang et al. proposed a network architecture that embeds convolutional layers into LSTM units to predict trajectories based on convective weather conditions before aircraft takeoff and flight plans [Reference Pang, Xu and Liu13]. In this model, echo top (ET) data are used as weather condition data and flight plan input to the LSTM layer to predict the aircraft’s position. The results showed an accuracy improvement in 47% of flight plans and the average accuracy increase is 12.3%. However, this result focuses on 3D trajectory prediction (ignoring altitude factors). Subsequently, Pang et al. replaced the previous LSTM units with conditional generative adversarial networks (CGAN) architecture to predict trajectories based on ET data and flight plans [Reference Pang and Liu14]. This improved flight plan accuracy to 55.2%, with an overall variance reduction of 22.1%. Building upon this, Pang et al. extended their research to 4D TP [Reference Pang, Zhao, Yan and Liu15], reporting errors in the forms of latitude, longitude and feet altitude. The errors typically are within 1 degree of latitude or longitude in horizon, approximately 60 nautical miles (nmi), and the vertical error is 100 feet (ft) in altitude. This study improved the accuracy of aircraft TP by explicitly considering weather uncertainty through weather feature extraction methods.
Recent research on weather-related aircraft TP is referenced in Ref. [Reference Schimpf, Wang, Li, Knoblock, Li and Apaza6]. Schimpf et al. proposed a generalised hybrid-recurrent prediction model for aircraft TP to eliminate potential biases in model training across different routes and dates. This model combines CNN, self-attention (SA), LSTM and gated recurrent units (GRU), enabling route generalisation and improving flight TP accuracy. In this approach, the weather is processed into cubes using conventional methods. After feature extraction, it is connected with relevant trajectory point information as feature inputs for model learning and prediction. The study also comprehensively compares weather products used in previous literature and their combined effectiveness, suggesting that the ET feature is the most suitable overall weather product for aircraft TP.
To summarise, current research has significantly addressed weather-related aircraft TP tasks. However, these studies have not conducted an in-depth analysis of the data characteristics associated with different weather types, and the proposed methods fail to effectively address the TP challenges under severe weather conditions. High-precision aircraft TP under severe weather conditions remains a challenge.
There are two main challenges in predicting aircraft trajectories under severe weather conditions. First, the quantity of flight data corresponding to severe weather is scarce, accounting for a small proportion of the flight sample dataset, and belongs to the minority class. Commonly used deep neural networks typically employ small-batch random sampling methods to improve training efficiency and model generalisation ability. Since the probability of selecting minority-class samples is low, it is difficult to accurately capture the hidden complex relationships. The second challenge is that, compared to normal weather, severe weather has a greater impact on aircraft trajectories, leading to more significant trajectory deviations. Machine learning algorithms easily identify these deviations as outliers and may be ignored. Therefore, research on TP techniques based on imbalanced data is key to solving the TP problem under severe weather conditions.
2.2 Imbalanced data processing
2.2.1 Basic handling methods of minority-class samples
Minority-class samples refer to one or more types of samples that occupy a tiny proportion of the entire dataset. The causes of data imbalance can be attributed to two factors: first, the inherent imbalance in natural phenomena, and second, practical limitations in the data collection process, which result in fewer samples from one or more classes. The emergence of minority-class issues is closely related to how sample data is utilised during the training process of deep learning models. Common machine learning methods often use small-batch random sampling techniques to accelerate the training process and enhance the model’s generalisation ability. As a result, the chances of selecting minority-class samples are lower, making extracting relevant feature knowledge challenging. This is especially true for deep neural networks, which learn complex nonlinear relationships from data distributions. A minimal number of minority-class samples makes it difficult for the model to accurately capture the hidden and complex relationships.
There are four main methods to address data imbalance: data-level methods, algorithm-level methods, cost-sensitive methods and ensemble methods [Reference Majeed and Hwang16]. Among these, data-level methods are the most basic because they do not require modifications or adjustments to software models. We have chosen this approach to handle aircraft TP problems under severe weather conditions. Data-level methods include oversampling and undersampling techniques. Undersampling reduces the majority class size, which is sometimes impractical in real-world scenarios due to the smaller resulting dataset. Oversampling expands the minority class by adding more samples, which is widely used to balance class distribution in datasets [Reference Spelmen and Porkodi17]. Oversampling poses less risk of overfitting than undersampling when dealing with minority-class sample issues [Reference Cheng, Zhang, Yu, Yang, Zou and Gao18]. The over-sampling techniques are also known as data augmentation methods.
Minority-class samples are different from small samples because the former involves the issue of data imbalance. This requires a greater focus on the relationship between minority and majority class samples. When performing data augmentation, it is crucial to maintain a clear boundary between the minority and majority classes to avoid misclassification in future applications. Additionally, minority-class samples often consist of several smaller subclasses, and the relationships and distribution characteristics among these subclasses are vital for achieving finer-grained learning and improving the performance of machine learning models. This is an important aspect to consider when predicting minority-class samples.
2.2.2 SMOTE data augmentation method
The most commonly used oversampling technique is SMOTE, which generates synthetic data by applying linear interpolation between minority class points and their K nearest neighbours [Reference Majeed and Hwang16]. Reducing the possible risk of overfitting, reducing information loss, and strong adaptability are the outstanding advantages of SMOTE. Unlike random oversampling, SMOTE minimises the risk of overfitting by synthesising new samples instead of simply copying existing samples and retaining more original data information, which can minimise information loss. In addition, SMOTE is simple in principle and easy to use. The number of synthesised samples and the number of neighbouring samples (K value) can be adjusted as needed, thereby flexibly controlling the number and quality of generated samples, and it has strong adaptability. Given the above advantages of SMOTE, it has been widely used in various industries. SMOTE also has some limitations, mainly the assumption of uniform distribution of samples, blurred category boundaries and noise sample problems. SMOTE assumes that minority-class samples are uniformly distributed in the feature space without considering that minority-class samples are composed of several slight separations or sub-concepts. However, in real-world datasets, minority-class samples may not be uniformly distributed. Secondly, when SMOTE generates new samples, it may create samples in the boundary area between different categories, causing the category boundaries to become blurred. Finally, if there are noise samples in the minority-class samples, SMOTE may generate new synthetic samples based on these noise samples, thereby introducing more noise. The main reason for the above limitations is that the data distribution patterns assumed by SMOTE may not match the actual ones because they are not generated from the original minority-class distribution. These deficiencies affect the quality of synthetic data and may cause a decline in the quality of subsequent machine learning model training and application performance [Reference Pang, Zhao, Yan and Liu15, Reference Cheng, Zhang, Yu, Yang, Zou and Gao18, Reference Pei, Xue, Zhang, Shang, Yao and Zhang19].
2.2.3 Deep learning data augmentation methods
In recent years, GANs, a novel neural network technology, have been widely applied in fields such as image generation [Reference Vondrick, Pirsiavash and Torralba20], data generation [Reference Reed, Akata, Yan, Logeswaran, Schiele and Lee21] and image resolution enhancement [Reference Brock, Donahue and Simonyan22] through the competition between generators and discriminators to learn the distribution of given data. GANs are also suitable for data augmentation and trajectory synthesis [Reference Ding, Wang and Zhao23]. Reference [Reference Zhang, Chen, Jia, Tian and Du24] is the only paper we have collected that applies data augmentation techniques to aircraft TP. Zhang et al. [Reference Zhang, Chen, Jia, Tian and Du24] aimed at application scenarios where the number of TP sample data is scarce, using WGAN-GP (a GAN model) to expand the trajectory sample data and training the LSTM model for aircraft TP based on the sample data sets before and after enhancement. Experiments show that as the sample data set expands, the TP accuracy of LSTM increases significantly. The model is designed for small sample scenarios rather than minority-class sample scenarios of data imbalance. It is based on automatic dependent surveillance-broadcast (ADS-B) data without considering the impact of weather factors. Nevertheless, it represents a valuable attempt to apply data augmentation methods to improve aircraft TP accuracy.
CTGAN [Reference Xu, Skoularidou, Cuesta-Infante and Veeramachaneni25] is the latest network model developed based on the GAN framework. It has achieved good application results in handling imbalanced data [Reference An, Sun, Wang and Wei26] and detecting network attacks [Reference Alqarni and El-Alfy27]. The CTGAN architecture combines the advantages of CGAN and table generative adversarial networks (TGAN). It excels in handling unique challenges associated with tabular data, such as the non-Gaussian distribution of continuous columns, the imbalanced distribution of discrete columns and the mix of discrete and continuous columns, allowing tabular data to be used directly as input [Reference Xu and Veeramachaneni28]. This model outperforms traditional GANs in data feature extraction [Reference Cote, Hartman, Mercier, Meyers, Cummings and Harmon29].
Considering that the ADS-B data mainly used in aircraft TP tasks can be easily converted into a table form, and from the perspective of data distribution, ADS-B data lacks symmetry and does not conform to the Gaussian distribution characteristics; from the standpoint of sample data composition, the number of aircraft trajectory data samples under severe weather conditions is scarce and disproportionate to the number of samples under typical meteorological conditions, resulting in an unbalanced distribution of sample data; using CTGAN for data augmentation can effectively address the problem of severe weather datasets being minority-class samples that are difficult to recognise by commonly used machine learning TP algorithms. The authors’ previous research has demonstrated that the CTGAN model is well-suited for aircraft TP using ADS-B data as the primary flight data [Reference Zhang and Liu30]. In this context, CTGAN combined with an LSTM-based hybrid framework is expected to be a viable solution to the complex problem of deplaning TP tasks associated with severe weather conditions using a suitable data augmentation network.
3.0 Methods
Since weather parameters are continuous variables, severe weather is a fuzzy concept whose boundaries are artificially defined and have statistical significance. For individuals in severe weather conditions where flights are possible, some of their trajectories are similar to those in normal weather conditions, making it difficult to distinguish them manually. Due to severe weather severity and specific factors, there may be different subclass distributions in minority-class samples. SMOTE performs data enhancement based on the uniform distribution assumption rather than the actual distribution; CTGAN generates synthetic data using the distribution learned from the samples. At the same time, CTGAN can process unbalanced data, which increases the sampling frequency of minority-class samples. When the boundaries of minority-class samples are artificially defined, it can also increase the enhancement of subclasses with a smaller proportion, which helps to reduce the accuracy requirements for setting the boundaries of severe weather. Combining severe weather characteristics and the advantages and disadvantages of SMOTE and CTGAN, CTGAN is more suitable for data enhancement in severe weather aircraft TP. To verify the effect of data enhancement, based on the representativeness of LSTM in aircraft TP tasks, we designed a hybrid model based on CTGAN and LSTM for short-term TP experiments. LSTM can be replaced by other TP models (including hybrid models) to adapt to different application scenarios. Taking LSTMs as the aircraft TP model as an example, the TP method based on data enhancement considers severe weather conditions. It combines CTGAN with LSTM models. The overall framework of the proposed 4D aircraft TP method, considering severe weather conditions and combining CTGAN with LSTM-based models, is illustrated in Fig. 1. It comprises four parts: data preparation, data augmentation, model training and trajectory prediction.
The general framework of the 4D aircraft TP method based on the improved CTGAN and LSTM-based architecture.

First, we preprocess ADS-B and weather data, using the processed weather data as conditions combined with ADS-B data as input. Second, we use an improved CTGAN model to augment the small-proportion severe weather trajectory data, controlling the quantity of generated synthetic data to maintain the essential characteristics of the data distribution before and after merging with the original trajectories. This allows the LSTM-based model to learn more effectively.
Subsequently, we combine the synthetic data generated by CTGAN (augmented data) with the processed ADS-B data and weather cube feature data to form a new dataset, which is then input into the LSTM network for training. Finally, the trained LSTM-based model is used for aircraft TP. Of course, based on this architecture, other data augmentation networks and prediction networks can replace CTGAN and the LSTM-based model to form new hybrid models, with the basic process remaining unchanged.
3.1 Data preparation
3.1.1 ADS-B data preprocessing
During the broadcasting process, ADS-B data may cause data errors due to system failures and sensor errors, so it needs to be preprocessed before use. Common ADS-B data errors include data duplication, anomalies, data missing, etc. The data preprocessing process used in this paper is shown in Fig. 2.
The ADS-B data preprocessing flow chart.

Unlike common ADS-B data preprocessing workflows, this study introduces another step of aligning aircraft time parameters. Since CTGAN does not require equal-length trajectory samples for data augmentation, there is no need to interpolate the original data, preserving the original data distribution and improving the accuracy of the CTGAN-generated data. Different flights on the same route typically have varying departure, arrival and waypoint times. To facilitate the training of the CTGAN model with more flight data, the time parameters of the trajectory data need to be aligned.
Given that the trajectory characteristics of inbound and outbound flights differ, time parameters must be processed separately for each. For outbound flights, the time of origin is set when the aircraft leaves the ground during takeoff. For inbound flights, the time origin is set when the aircraft passes a designated waypoint.
Since ADS-B data may experience gaps during transmission, these missing data points can increase the time intervals between some trajectory points [Reference Ali, Ochieng and Zainudin31]. For example, the interval between adjacent ADS-B data points is typically 0.5–2 seconds, but occasionally it can exceed 30 seconds. Therefore, interpolating the flight data points near the designated waypoint is necessary when determining the relative time origin for inbound flights. The time of the trajectory point closest to the waypoint within a certain radius is chosen as the relative time origin. This alignment method is consistent with our previously published work [Reference Zhang and Liu30]. The time parameter alignment process is illustrated in Fig. 3.
The diagram of alignment of arrival flight time parameters [Reference Zhang and Liu30].

3.1.2 Weather data preprocessing and flight data selection under severe weather conditions
In current aircraft TP tasks, weather information commonly includes ET, vertically integrated liquid (VIL) features, atmospheric temperature (TMP) and U/V wind components. According to the study in Ref. [Reference Schimpf, Wang, Li, Knoblock, Li and Apaza6], ET data is one of the most indicative of weather’s impact on trajectories. Therefore, this study employs ET data as the model input for preprocessing and generating the feature cube.
We generate the weather feature cubes using the method described in Ref. [Reference Pang and Liu14]. We extract a weather cube ahead of the current position from the original weather file for each trajectory point and rotate it according to the aircraft’s heading angle. Weather data is collected one layer above and below the current altitude. By scaling the original resolution of the weather file by a factor of 10, we can generate a 32 × 32 × 3 feature cube for each trajectory point. In this way, the weather bandwidth can cover a sufficient area. Thus, we obtain a set of weather cubes that match the ADS-B trajectory data.
The feature extraction from the weather cubes follows the methods in Refs [Reference Schimpf, Wang, Li, Knoblock, Li and Apaza6, Reference Pang, Zhao, Yan and Liu15]. Specifically, we use three convolutional layers and two dense layers, each followed by two dropout layers with a dropout rate of 1%. The convolution kernel sizes are [6 × 6, 3 × 3, 1 × 1], the convolution stride lengths are [1 × 2 × 2], and the convolution filter sizes are [1 × 2 × 4]. The dense layer sizes are [3 × 15]. This allows us to obtain weather cube feature data that matches the ADS-B trajectory data.
In this study, we selected flight data under severe weather conditions. First, based on historical weather forecasts from the Hong Kong Observatory (HKO), we identified dates with unfavorable weather and extracted flight data and corresponding ET (convective weather) data for those days. Previous studies on convective weather datasets indicate that flight trajectories are categorised as encountering weather deviations only when they experience convective weather at 25,000 feet or for at least 2 minutes [Reference DeLaura, Robinson, Pawlak and Evans32]. Therefore, we filtered the flight data based on the maximum and average values of the corresponding ET data. The threshold for the ET maximum value is set to 25,000, and the average value threshold is set to 2,000. By this method, we screened flight data under severe weather conditions. Figure 4 visualises the data filtering process, adopting the method outlined in Ref. [Reference Pang, Zhao, Yan and Liu15]. The X-axis represents the data pairs, and the Y-axis represents the maximum and average values of each data pair. The red line shows the thresholds used in different indicators.
Visualisation of the data filtering process using thresholds on ET data. (a) represents maximum ET value. (b) represents mean ET value.

3.2 Data augmentation
3.2.1 Improved CTGAN architecture
The architecture of the improved CTGAN for TP tasks under severe weather conditions referenced our previous study [Reference Zhang and Liu30]. There are two significant differences from the original CTGAN to adapt to the features of ADS-B data.
Training parameters for the improved CTGAN

The improved CTGAN architecture considering severe weather conditions.

The first improvement involves the aircraft characteristics contained in ADS-B data. We sample using actual data frequencies rather than logarithmic frequencies. This is done to maintain the diversity of the enhanced data types and prevent the generator from unrealistically oversampling trajectories under severe weather conditions, significantly affecting model convergence [Reference Nugraha, Pardede and Subekti33].
The second improvement is replacing the original CTGAN’s one-hot encoding with leave-one-out encoding to avoid problems of parallelism and multicollinearity in high-dimensional situations, where one-hot encoding can lead to too many and overly sparse generated features.
Unlike previous studies, this research introduces weather cube feature data as conditions. It aims to generate adverse weather data as much as possible during synthetic data generation to enhance data. Figure 5 illustrates the architecture of the improved CTGAN, with differences from the original CTGAN marked in red.
The improved CTGAN architecture consists of two parts: the generator network and the discriminator network. We perform data enhancement by adding features of aircraft trajectories under severe weather conditions and random noise. In the generator network, the random column vectors of ADS-B data are normalised using a variational Gaussian mixture model. After decoding the weather cube feature data using leave-one-out encoding, it is concatenated with the normalised column vectors to form a combined vector. This vector and random noise are input into the fully connected generator layer.
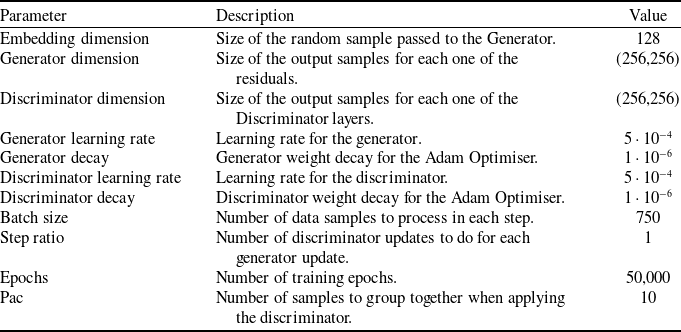
In the discriminator network, we use weather cube feature data as a condition to bias the network towards generating aircraft trajectory data under severe weather conditions, achieving the effect of data enhancement. The parameter settings of the entire architecture are the same as in our previous study, with specific parameters shown in Table 1. Formulas 1 and 2 represent the generator and discriminator networks, respectively.
 \begin{align}\left\{{\begin{array}{*{20}{c}}{{h_0} = z \oplus cond}\\[4pt]{{h_1} = {h_0} \oplus ReLU\left( {BN\left( {F{C_{\left| {cond} \right| + \left| z \right| \to 256}}\left( {{h_0}} \right)} \right)} \right)}\\[4pt]{{h_2} = {h_1} \oplus ReLU\left( {BN\left( {F{C_{\left| {cond} \right| + \left| z \right| + 256 \to 256}}\left( {{h_1}} \right)} \right)} \right)}\\[4pt]{{{\hat \alpha }_i} = \tanh \left( {F{C_{\left| {cond} \right| + \left| z \right| + 512 \to 1}}\left( {{h_2}} \right)} \right)\;\;\;\;\;\;\;\;\;1 \le i \le {N_c}}\\[4pt]{{{\hat \beta }_i} = gumbe{l_{0.2}}\left( {F{C_{\left| {cond} \right| + \left| z \right| + 512 \to {m_i}}}\left( {{h_2}} \right)} \right)\;\;\;\;1 \le i \le {N_c}}\\[4pt]{{{\hat d}_i} = gumbe{l_{0.2}}\left( {F{C_{\left| {cond} \right| + \left| z \right| + 512 \to \left| {{D_i}} \right|}}\left( {{h_2}} \right)} \right)\;\;\;1 \le i \le {N_d}}\end{array}} \right.\end{align}
 \begin{align}\left\{ {\begin{array}{*{20}{c}}{{h_0} = {r_1} \oplus .. \oplus {r_{10}} \oplus con{d_1} \oplus .. \oplus con{d_{10}}\;\;\;\;\;\;\;\;}\\[4pt]{{h_1} = drop\left( {leak{y_{0.2}}\left( {F{C_{10\left| r \right| + 10\left| {cond} \right| \to 256}}\left( {{h_0}} \right)} \right)} \right)\;}\\[4pt]{\begin{array}{*{20}{c}}{{h_2} = drop\left( {leak{y_{0.2}}\left( {F{C_{256 \to 256}}\left( {{h_1}} \right)} \right)} \right)\;\;\;\;\;\;\;\;}\\[4pt]{C\left( \cdot \right) = F{C_{256 \to 1}}\left( {{h_2}} \right)\;\;\;\;\;\;\;\;\;\;\;\;\;\;\;\;\;\;\;\;\;\;\;}\end{array}}\end{array}} \right.\end{align}
where $ \oplus $
represents the vector concatenation operation;
$ \oplus $
represents the vector concatenation operation; $z$
represents random noise;
$z$
represents random noise; ${\rm{F}}{{\rm{C}}_{u \to v}}\left( x \right)$
denotes the application of a linear transformation to a u-dimensional input to obtain a v-dimensional output;
${\rm{F}}{{\rm{C}}_{u \to v}}\left( x \right)$
denotes the application of a linear transformation to a u-dimensional input to obtain a v-dimensional output; ${\rm{leak}}{{\rm{y}}_\gamma }\left( x \right)$
represents the application of the leaky ReLU activation function on
${\rm{leak}}{{\rm{y}}_\gamma }\left( x \right)$
represents the application of the leaky ReLU activation function on $x$
with leaky ratio
$x$
with leaky ratio $\gamma $
;and
$\gamma $
;and ${\rm{gumbe}}{{\rm{l}}_\tau }\left( x \right)$
represents the application of the Gumbel softmax function with a parameter
${\rm{gumbe}}{{\rm{l}}_\tau }\left( x \right)$
represents the application of the Gumbel softmax function with a parameter $\tau $
to a vector
$\tau $
to a vector $x$
. The
$x$
. The ${\rm{tanh}}$
,
${\rm{tanh}}$
, ${\rm{BN}}$
and
${\rm{BN}}$
and ${\rm{ReLU}}$
functions are used for batch normalisation.
${\rm{ReLU}}$
functions are used for batch normalisation.
3.2.2 Evaluation metrics
During the data augmentation process, the CTGAN treats each row of input tabular data as an independent sample for random sampling without considering the order between rows. It learns the overall distribution characteristics of the data through these samples. Based on the input data and learned distribution characteristics, it outputs generated data in tabular form. For the aircraft TP model, the input to the CTGAN generator is usually actual time series trajectory data. The generated output data consists of non-time-series random data reflecting the distribution characteristics of the trajectories. Therefore, there is no direct one-to-one correspondence between them. For evaluating model training results, if the distributions of two datasets are very close, then the means of their trajectory parameters will also be very close. The mean can approximately reflect the difference between actual and generated distribution. Therefore, we use the mean value to evaluate the model.
According to the requirements of the data augmentation task described in this paper, evaluation metrics need to meet two conditions: first, to determine the quality of the generated data, ensuring that the data distribution of the new samples is similar to the original data; second, to eliminate the noise introduced by the generated data to avoid the fusion of generated data and original data leading to classification ambiguity. Therefore, to accurately evaluate the model, we use the maximum mean discrepancy (MMD) [Reference Borji34] from the perspective of data distribution and the mean Euclidean distance (MED) from the standpoint of numerical prediction to calculate the trajectory distance and eliminate the noise introduced by the generated data.
-
(1) Maximum mean discrepancy
The MMD is a commonly used GAN evaluation indicator. It finds continuous functions $f$
in the sample space and calculates the mean difference among different distribution functions
$f$
in the sample space and calculates the mean difference among different distribution functions $f$
to obtain the average
$f$
to obtain the average $f$
between the analysed datasets. To determine whether the two distributions are similar, we use the mean of the generated data to calculate the MMD. If a Gaussian kernel function is used to replace
$f$
between the analysed datasets. To determine whether the two distributions are similar, we use the mean of the generated data to calculate the MMD. If a Gaussian kernel function is used to replace $f$
, the formula can generally be interpreted as:
$f$
, the formula can generally be interpreted as:
 \begin{align}MM{D^2}\left({X,Y}\right) = \left\|\frac{1}{{{n^2}}}\sum\limits_{i}^{n}\sum\limits_{i'}^{n} k\left({{x_i},{x_i}^{'}}\right) - \frac{2}{{nm}}\mathop \sum \limits_i^n \mathop \sum \limits_j^m k\left( {{x_{i}},{y_{j}}} \right) + \frac{1}{{{m^{2}}}}\mathop \sum \limits_{j}^{m} \mathop \sum \limits_{j'}^{m} k\left( {{y_j},{y_j}^{'}} \right)\right\|_H\\[-30pt]\nonumber\end{align}
 \begin{align}k\left({u,v} \right) = {e^{\frac{{ - u - {v^2}}}{{2{\sigma ^2}}}}}\end{align}
where $X$
refers to a random variable in the generated distribution;
$X$
refers to a random variable in the generated distribution; $Y$
refers to a random variable in the actual distribution;
$Y$
refers to a random variable in the actual distribution; $n$
represents the maximum number of variables of X;
$n$
represents the maximum number of variables of X; $m$
represents the maximum number of variables of Y;
$m$
represents the maximum number of variables of Y; $k$
represents the Gaussian kernel function; and
$k$
represents the Gaussian kernel function; and $\sigma $
is the width parameter of the kernel function. The smaller the MMD is, the more accurate the model is.
$\sigma $
is the width parameter of the kernel function. The smaller the MMD is, the more accurate the model is.
-
(2) Mean Euclidean distance
The MED is a typical metric for calculating the distance between trajectories. The ADS-B data can provide information such as longitudes, latitudes and altitudes (geometric altitudes in ADS-B) in the WGS-84 coordinate system. The measurement units of these parameters are different. Latitude and longitude are measured in degrees, and altitude is usually measured in feet. The latitude and longitude ranges are $\left[0,\pm\,90\right]^{\circ}$
and
$\left[0,\pm\,90\right]^{\circ}$
and $\left[ {0, \pm 180} \right]^{\circ}$
, respectively, and the altitude can be hundreds or thousands of times the magnitude of the longitude and latitude. Therefore, a unified dimension is needed to reduce dimensional differences. We first transform these three parameters into a Cartesian coordinate system. Then, based on a point-by-point calculation of the Euclidean distance between the two datasets, the MED is obtained by taking the average. The calculation equation is as follows:
$\left[ {0, \pm 180} \right]^{\circ}$
, respectively, and the altitude can be hundreds or thousands of times the magnitude of the longitude and latitude. Therefore, a unified dimension is needed to reduce dimensional differences. We first transform these three parameters into a Cartesian coordinate system. Then, based on a point-by-point calculation of the Euclidean distance between the two datasets, the MED is obtained by taking the average. The calculation equation is as follows:
 \begin{align}MED = \frac{1}{n}\mathop \sum \limits_{i = 1}^n \left| {{s_i} - {{\hat s}_i}} \right|\end{align}
where ${s_i}$
represents the average trajectory point of the generated dataset and
${s_i}$
represents the average trajectory point of the generated dataset and ${\hat s_i}$
represents the average trajectory point of the real dataset.
${\hat s_i}$
represents the average trajectory point of the real dataset.
3.3 Model training
During the model training process, the data augmented by the improved CTGAN will be mixed with the processed original ADS-B trajectory data, with a certain proportion of the augmented data representing trajectories under severe weather conditions. This mixture forms a new dataset. The latest mixed dataset will be interpolated at 1-second intervals for learning by LSTM-based models.
This paper uses four commonly used TP models, LSTM, CNN-LSTM, CNN-LSTM-Attention and CNN-BiLSTM, to learn from the new mixed dataset. This is done to validate the impact of data augmentation on the accuracy of aircraft TP.
In this study, the training objective is to minimise the multi-task loss combining:
-
(1) Trajectory prediction loss:
 \begin{align}\nonumber\\[-24pt]{\mathcal{L}_{traj}} = \frac{1}{N}\mathop \sum \limits_{t = 1}^N \|{\hat y_t} - {y_t}\|_2^2 + \lambda \cdot KL\left( {p\left( {{{\hat y}_t}} \right)\!\|\,p\left( {{y_t}} \right)} \right)\end{align}
where ${\hat y_t}$
and
${\hat y_t}$
and ${y_t}$
are the predicted and ground-truth coordinates at time
${y_t}$
are the predicted and ground-truth coordinates at time $t$
, respectively. The second term introduces Kullback-Leibler divergence to capture uncertainty in dense traffic scenarios (weighted by
$t$
, respectively. The second term introduces Kullback-Leibler divergence to capture uncertainty in dense traffic scenarios (weighted by $\lambda = 0.1$
).
$\lambda = 0.1$
).
-
(2) Auxiliary regularisation:
To prevent overfitting on short-term patterns, we incorporate a velocity constraint term:
 \begin{align}{\mathcal{L}_{vel}} = \frac{1}{N}\mathop \sum \limits_{t = 2}^N \|\left( {{{\hat y}_t} - {{\hat y}_{t - 1}}} \right) - {\left( {{y_t} - {y_{t - 1}}} \right)\|_1}\end{align}
The final loss is $\mathcal{L} = {\mathcal{L}_{traj}} + 0.3 \cdot {\mathcal{L}_{vel}}$
.
$\mathcal{L} = {\mathcal{L}_{traj}} + 0.3 \cdot {\mathcal{L}_{vel}}$
.
3.4 Trajectory prediction
The goal of 4D TP is to predict the spatiotemporal state sequence of an aircraft through a trained model. If every track point is regarded as ${S_i}$
, the 4D trajectory is regarded as a random variable
${S_i}$
, the 4D trajectory is regarded as a random variable $P$
, and we assume that
$P$
, and we assume that $T$
follows the distribution of
$T$
follows the distribution of $P = {\rm{\;}}P\left( {{s_{1:N}};\,\theta } \right)$
, the 4D TP problem can be expressed as
$P = {\rm{\;}}P\left( {{s_{1:N}};\,\theta } \right)$
, the 4D TP problem can be expressed as $P\left( {{s_{1:N}};\,\theta } \right)$
. According to the maximum likelihood estimation, the 4D trajectory distribution is expressed as:
$P\left( {{s_{1:N}};\,\theta } \right)$
. According to the maximum likelihood estimation, the 4D trajectory distribution is expressed as:
 \begin{align}{S_i} = \left\{ {t,x,y,z,{v_{xy}},h,\;\;w} \right\}\\[-30pt]\nonumber\end{align}
 \begin{align}T = \left\{ {{T_1} = s_{1:N}^1, \ldots {T_k} = s_{1:N}^k, \ldots ,{T_M} = s_{1:N}^M} \right\}\\[-30pt]\nonumber\end{align}
 \begin{align}{}^{argmax}\!\!{}_{\theta} p\left( {D{\rm{|}}\theta } \right) = {\vphantom{\prod}}^{argmax}\!\!{\vphantom{\prod}}_\theta\!\prod\limits_{i = 1}^M P\left( {s_{1:N}^i;\,\theta } \right)\end{align}
where $t$
represents time,
$t$
represents time, $x$
represents latitude,
$x$
represents latitude, $y$
represents longitude,
$y$
represents longitude, $z$
represents geometric height,
$z$
represents geometric height, ${v_{xy}}$
represents ground speed,
${v_{xy}}$
represents ground speed, $h$
represents track angle and
$h$
represents track angle and $w$
represents the weather cube;
$w$
represents the weather cube; $N$
denotes the number of points in the track and M denotes the number of historical tracks;
$N$
denotes the number of points in the track and M denotes the number of historical tracks; $\theta $
stands for a parameter.
$\theta $
stands for a parameter.
The essence of model training is to learn the distribution of $P\left( {s_{1:N}^i;\,\theta } \right)$
. In this paper, the trained LSTM-based models learn the distribution of
$P\left( {s_{1:N}^i;\,\theta } \right)$
. In this paper, the trained LSTM-based models learn the distribution of $P\left( {s_{1:N}^i;\,\theta } \right)$
. If we input the current aircraft trajectory through the model, we can get a predicted trajectory that corresponds to the input trajectory distribution and follows the time order.
$P\left( {s_{1:N}^i;\,\theta } \right)$
. If we input the current aircraft trajectory through the model, we can get a predicted trajectory that corresponds to the input trajectory distribution and follows the time order.
4.0 Experiments and Analyses
4.1 Data preparation
We chose the flight segment near the Hong Kong International Airport (HKIA) as our experimental data. HKIA is one of the busiest airports in the world, handling many flight takeoffs and landings daily and providing abundant data to verify the performance of prediction models. The airspace structure around Hong Kong Airport is complex, containing multiple inbound and outbound flight routes and corridors, which helps test the model’s applicability and accuracy in complex environments. Additionally, located in the subtropical region near the South China Sea, Hong Kong is significantly affected by extreme weather, such as typhoons and heavy rain every year, which substantially impacts aviation traffic. Choosing Hong Kong Airport allows effective research into the effects of weather factors on aircraft trajectories and optimising prediction models to improve accuracy under adverse weather conditions. Therefore, selecting flight segments near Hong Kong Airport as experimental data has practical significance and provides rich and complex experimental conditions, contributing to prediction models’ comprehensive and reliable performance.
The ADS-B data in this study comes from the HKO and the OpenSky website, covering flight data with severe weather conditions from 2016 to 2022. The corresponding ET data is obtained from the China Meteorological Administration.
In this dataset, flights from the KADLO waypoint to the VHHH waypoint (airport) account for nearly 1/4 of all data, and flights on this route have a flight time of over 1 hour. Therefore, we focused on experiments and analysis on this route. Due to severe weather conditions, many aircraft did not follow the usual flight routes. Their trajectory data deviated significantly from the expected path and sometimes did not pass through essential waypoints. These significantly deviated trajectories are extreme cases and were not included in this study. We chose to retain trajectory data passing through the ABBEY waypoint on this route, excluding trajectories with significant deviations to ensure the quality of experimental data and the objectivity of model predictions. After processing, we selected 200 trajectories that met the criteria. The Fig. 6 shows a schematic of the trajectory of inbound flights on this route.
Inbound flight trajectories from KADLO to VHHH in the Hong Kong region.

4.2 Test environment and model parameter settings
The experiment is performed on a PC with Microsoft Windows 10 (CPU: 12th-Gen Intel(R) Core i9-12900KF at 3.20 GHz, RAM: 64.0 GB, GPU: NVIDIA GTX 3,080). The improved CTGAN-based models were built using Keras and TensorFlow. The parameters of the improved CTGAN architecture are based on our previous research shown in Table 1.
The parameter setting for different LSTM-based models

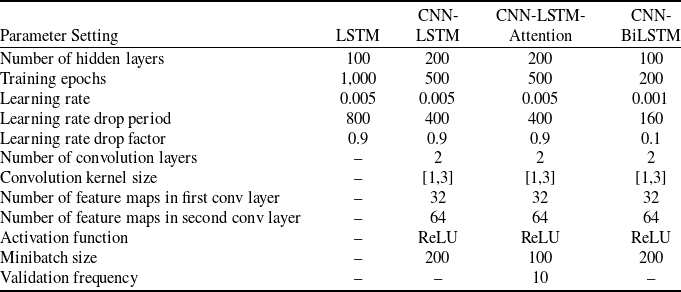
In this study, we conducted a comparative analysis using MATLAB to run prediction algorithms based on LSTM models. The ratio of the training set to the test set was set to 0.8 and 0.2, respectively. We selected four commonly used neural network architectures for comparison: LSTM, CNN-LSTM, CNN-LSTM-Attention and CNN-BiLSTM. The specific parameter settings are shown in Table 2. With these model parameters, we could compare the performance of different neural network models in predicting aircraft trajectories under severe weather conditions and analyse their effects on the experimental dataset.
4.3 Model testing and analysis
4.3.1 Data augmentation validation based on the improved CTGAN model
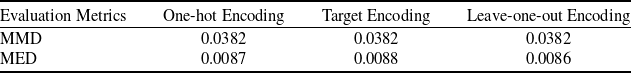
Since this study introduces a weather module as a condition that differs from previous research, it is necessary to verify which encoder is optimal for the improved CTGAN model. We used three different encoders, One-hot, Target and Leave-one-out, and calculated their respective MMD and MED according to formulas (3) and (5). The results are shown in Table 3. Smaller MMD and MED values indicate higher accuracy of the generated trajectories. When both values equal 0, the generated data is identical to the actual data. As shown in Table 3, the MMD values for all three encoding methods are the same, indicating that the differences in data distribution between the generated and actual data are consistent across different encoders. However, the MED value for the Leave-one-out encoder is the smallest, suggesting that it produces the most accurate trajectory distances. Therefore, the Leave-one-out encoder is the most effective.
Evaluation results of the improved CTGAN model under different encoding methods

To intuitively observe the similarity between model-generated and real data distribution, we calculate the probability density distribution using the kernel function as the PDF for all parameters. This difference in probability density distribution visually reflects the distance between the generated and accurate data distribution.
Figure 7 shows the PDFs of the generated data for the variables of time, latitude, longitude, geometric height, ground speed and track angle. The blue line representing the actual data distribution fits well with the red line representing the generated data distribution. This result indicates that the distributions of the actual data and the generated data are highly similar and consistent with the calculated evaluation metrics. Therefore, the generated data can be used for data augmentation. Figure 8 shows the value of the loss function for the generator and discriminator with every 50 epochs for training. It shows that the model has converged.
Distribution comparison between the generated and real data.

Loss function value of the generator and discriminator for training.

4.3.2 Model comparison with different data percentages
-
(1) Comparison of short-term prediction errors for LSTM-based models under severe weather conditions
LSTM-based models tend to be limited by the chaos phenomenon when predicting long time series data [Reference Lin, Li, Bi and Qin35]. As the prediction period extends, the output probability density of the expected trajectory tends to become uniform due to the flight uncertainty. Therefore, most LSTM models struggle to provide accurate medium to long-term predictions (prediction periods exceeding 10 minutes). Our comparative experiments only compare the short-term prediction accuracy under severe weather conditions.
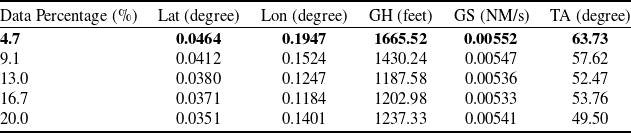
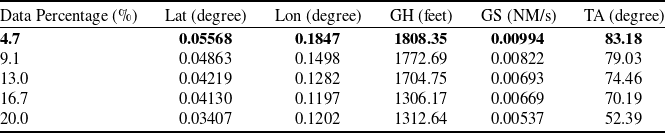
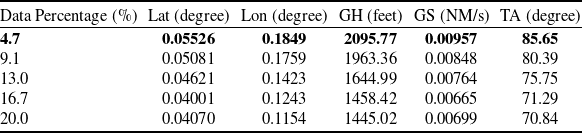
We set the sliding window of the LSTM-based model to 40 and the prediction step to 5 minutes. Using our proposed improved CTGAN-LSTMs hybrid model, we enhance the proportion of trajectory data under severe weather conditions according to a specific ratio. We then conduct comparative experiments and calculate the average root mean square error (RMSE) of trajectory parameters. The results are shown in Tables 4–7. ‘Lat’ represents latitude, ‘Lon’ represents longitude, ‘GH’ represents geometric height, ‘GS’ represents ground speed and ‘TA’ represents track angle.
RMSE of LSTM model with different data percentages of severe weather conditions

RMSE of CNN-LSTM model with different data percentages of severe weather conditions

To more intuitively compare the impact of data augmentation on the prediction accuracy of aircraft trajectories under severe weather conditions, we plotted the data from Tables 4–8 into line graphs based on latitude, longitude, geometric height, ground speed and track angle, as shown in Fig. 9. These charts allow us to compare the average RMSE of different models under various data percentage conditions, illustrating the effect of data augmentation on short-term prediction tasks under severe weather conditions.
RMSE of CNN-LSTM-Attention model with different data percentages of severe weather conditions

RMSE of CNN-BiLSTM model with different data percentages of severe weather conditions

Comparison of mean horizontal and vertical errors of the LSTM model for flight CPA475; the prediction time span is 5 minutes

Comparison of the prediction RMSE of the LSTM, CNN-LSTM, CNN-LSTM-Attention and CNN-BiLSTM models for different data percentages.

Overall, data augmentation significantly improved the prediction accuracy of all models under severe weather conditions. As the proportion of augmented data increased, the average RMSE of all models decreased. For CNN-LSTM, CNN-LSTM-Attention and CNN-BiLSTM models, the CNN-LSTM model performed the best across most parameters, especially in predicting longitude, geometric height and ground speed. Although introducing attention mechanisms and bidirectional LSTM improved performance for specific parameters, the overall performance of the CNN-LSTM model remained superior.
When comparing CNN-LSTM and LSTM models, despite the CNN-LSTM model showing more significant accuracy improvements with increased data proportions – especially in longitude, geometric height and ground speed predictions – the LSTM model performed well and stably under minor sample conditions for some indicators. Therefore, while the CNN-LSTM model may perform better on comprehensive metrics after data augmentation reaches a certain percentage, using the LSTM model can yield better prediction results when handling minority-class sample severe weather aircraft TP tasks.
From Fig. 9, we can observe that for the LSTM model, the average RMSE of each model decreased with increasing data proportions. The prediction accuracy improvement, around 13%, was the most significant in data augmentation. Specifically, when the data proportion increased from 4.7% to 13%, the RMSE for latitude (Lat) decreased by about 18.10%, longitude (Lon) by approximately 35.93%, geometric height (GH) by around 28.68%, ground speed (GS) by the smallest margin of about 2.90% and track angle (TA) by about 17.68%. On average, the RMSE decreased by about 20.46%, according to the LSTM model’s results. This indicates that increasing the data volume positively impacts model performance, enabling more accurate predictions of target variables.
-
(2) Visual analysis of typical trajectory prediction
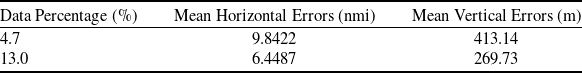
To intuitively compare the effect of our proposed improved CTGAN-LSTM framework on TP tasks under severe weather conditions, we selected flight CPA475 as an example to analyse the TP parameter differences of the LSTM model. Specifically, we analysed and visually compared the changes in data proportions of 4.7% and 13%. The results are shown in Fig. 10. For the LSTM model, when CTGAN enhanced the minority-class sample trajectory data under severe weather conditions, the prediction accuracy for all parameters saw significant improvement. This result is consistent with the findings shown in Table 4. We also calculated the mean horizontal and vertical errors in Table 8 to show the difference further. It should be noted that this comparative experiment uses a prediction time span of 5 minutes, which causes an apparent vertical error. However, this error will be significantly reduced if we shorten the prediction time span.
Comparison of the prediction results of the LSTM model for flight CPA475.

4.3.3 Comparison of data enhancement quality with SMOTE
The quality of synthetic data is a crucial factor influencing the effectiveness of data augmentation. Therefore, it is necessary to compare the quality of data generated by the improved CTGAN with that generated by the commonly used SMOTE technique. Considering that the LSTM model yields better prediction results when handling minority-class sample TP tasks under severe weather conditions, the comparative experiment was conducted using the LSTM model with the same settings as in Table 2. Here, the number of nearest neighbours for SMOTE was set to 5.
The MMD for the enhanced data generated is 0.0442, and the MED is 0.00075. Compared to the improved CTGAN model (MMD is 0.0382, MED is 0.0087), the data generated by SMOTE has a larger MMD but a more petite MED. This indicates that from the data distribution perspective, the data generated by the improved CTGAN is closer to the actual data distribution. However, regarding trajectory point distance, the data generated by SMOTE has a more minor error.
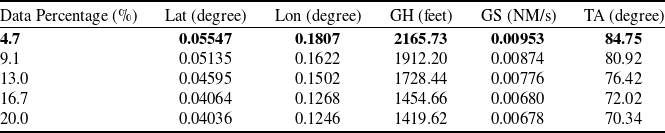
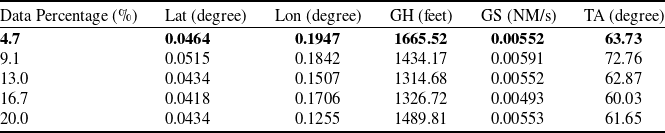
Table 9 shows the impact of different data percentages on the average RMSE of five variables predicted by the LSTM model after using the SMOTE data augmentation technique. Lat represents latitude, lon represents longitude, GH represents geometric height, GS represents ground speed and TA represents track angle.
RMSE of LSTM model with different data percentages using SMOTE data augmentation

For latitude, when the data percentage increases from 4.7% to 9.1%, the RMSE increases from 0.0464 to 0.0515. As the data percentage rises to 13.0% and 16.7%, the RMSE decreases to 0.0434 and 0.0418, respectively. However, when the data percentage increases to 20%, the RMSE rises to 0.0434 again. The RMSE shows a trend of first increasing, then decreasing and slightly increasing, indicating that increasing the data volume and using SMOTE can improve the model’s prediction performance for latitude to a certain extent, but there are fluctuations.
For longitude, when the data percentage increases from 4.7% to 13.0%, the RMSE decreases rapidly from 0.1947 to 0.1507. As the data percentage increases to 16.7%, the RMSE rises to 0.1706. However, as the data percentage increases to 20%, the RMSE decreases again to 0.1255. The RMSE shows a general downward trend as the data percentage increases, but there are significant fluctuations at specific points. These fluctuations may be due to SMOTE’s tendency to lose authenticity when handling long time-series data, which in turn affects the performance of the LSTM model.
For geometric height, when the data percentage increases from 4.7% to 13%, the RMSE decreases rapidly from 1665.52 to 1314.68. As the data percentage rises to 16.7%, the RMSE slightly increases to 1326.72, and when the data percentage increases to 20%, the RMSE significantly rises to 1489.81. This indicates that in the early stages of growing data volume, the model’s prediction accuracy improves significantly, but after reaching a particular data volume, the prediction accuracy decreases. This may be caused by SMOTE’s tendency to generate data that converges locally.
For ground speed, the RMSE trend is similar to that of latitude, showing a trend of first increasing, then decreasing, and slightly increasing. Specifically, at 4.7%, 13.0%, and 20% data percentages, the RMSE is very close, being 0.00552, 0.00552 and 0.00553, respectively. When the data percentage is 9.1%, the RMSE increases to 0.00591. At 16.7%, the RMSE decreases to the lowest value of 0.00493. It can be seen that SMOTE augmented data did not significantly improve the LSTM model’s prediction performance for GS, especially when the data percentage is 9.1%, the RMSE increases. This indicates that increasing the data volume and using SMOTE have limited effects on the prediction of ground speed and may even cause performance fluctuations and deterioration in some cases.
For track angle (TA), the RMSE trend is the same as that of ground speed. It can be seen that SMOTE augmented data did not significantly improve the LSTM model’s prediction performance for track angle.
To visually compare the difference between the improved CTGAN and SMOTE for data augmentation, we plotted the RMSE data from Table 4 and Table 9 for latitude, longitude, geometric height, ground speed and track angle as line graphs, as shown in Fig. 11. It can be observed that, in most cases, the improved CTGAN performs significantly better than SMOTE.
RMSE values of different parameters for various data percentages using improved CTGAN and SMOTE data augmentation techniques.

In summary, for minority-class sample trajectory data under severe weather conditions, using the SMOTE data augmentation technique and increasing the data percentage can improve the prediction accuracy of LSTM models for some variables. However, there is inevitable fluctuation in the RMSE changes for certain variables, and increasing the data volume leads to performance degradation at specific data percentages. SMOTE-enhanced data did not significantly improve model performance and even showed performance degradation at some data percentages, particularly for ground speed and track angle. Compared to the improved CTGAN, although SMOTE has higher precision in generating trajectories, it is not a suitable data augmentation model for minority-class sample trajectory data under severe weather conditions. The root cause may be that SMOTE performs data augmentation based on the uniform distribution assumption rather than the actual distribution. At the same time, the improved CTGAN generates synthetic data using the distribution learned from samples.
5.0 Discussions
5.1 Methodological innovations
Our approach utilises an improved CTGAN for data augmentation alongside LSTM models for predictive verification. This hybrid CTGAN-LSTM model effectively modulates the reduced accuracy commonly associated with data imbalance by enabling four-dimensional aircraft TP that accounts for severe weather impacts. The framework is adaptable, allowing for substitution of CTGAN and LSTM with other augmentation and prediction networks tailored to specific application scenarios, offering a foundation for addressing similar data imbalance issues in aircraft TP.
5.2 Limitations
Despite our innovations, some limitations remain:
-
(1) The accuracy of TP is highly dependent on the quality of synthetic data generated during augmentation. Our experiments highlight this dependency, yet there is a lack of established methodologies for accurately assessing the quality of synthetic trajectory data. This represents an area for future research.
-
(2) Our study focuses on short-term predictions using LSTM-based models, leaving medium to long-term trajectory predictions under severe weather conditions unexplored. Future research should investigate integrating suitable models for medium to long-term predictions within the proposed framework, replacing LSTM for more comprehensive analysis.
These limitations provide avenues for future research and improvement in aircraft trajectory prediction under severe weather conditions.
6.0 Conclusions and Future Work
Trajectory data under severe weather conditions occupies a small proportion in aircraft trajectory sample data, leading to data imbalance. Current deep neural networks are usually trained using multiple rounds of small-batch random sampling of sample data, which cannot effectively solve the data imbalance problem, and aircraft TP under severe weather conditions is challenging. The proposed aircraft TP framework, which includes a minority-class sample data enhancement network and a prediction network, achieves significant improvements in short-term aircraft TP accuracy under severe weather conditions, demonstrating the effectiveness of the improved CTGAN-LSTMs model. Experimental results show that when the proportion of minority-class sample data increases from 4.7% to 13%, the average RMSE of the CTGAN-LSTM model for 5-minute short-term prediction decreases by 20.46%. Based on this architecture, other data augmentation and prediction networks can be selected according to specific application characteristics to replace CTGAN and LSTM-based models, forming new hybrid models. The idea and method proposed in this paper to solve the problem of sample data imbalance through data enhancement can provide a reference for solving other data imbalance problems in aircraft TP tasks. Given the significant impact of severe weather on ATMs, this study is helpful to enhance ATM capabilities.
We compared four commonly used LSTM-based prediction models (LSTM, CNN-LSTM, CNN-LSTM-Attention and CNN-BiLSTM) to evaluate the performance of the proposed improved CTGAN-LSTM hybrid model. Experimental results show that the improved CTGAN-LSTM hybrid model can significantly improve the accuracy of TP under severe weather conditions. Under this architecture, using an LSTM model as the prediction model demonstrates the best performance for minority-class sample data, with significantly higher TP accuracy compared to other benchmark models. Before the proportion of minority-class sample data, the prediction accuracy is 13%. The accuracy indicators increase rapidly with the proportion, and after gaining 16.7%, the prediction accuracy stabilises.
Comparing CTGAN with SMOTE revealed that CTGAN supports better TP of minority-class data under severe weather. Though SMOTE achieves higher synthetic trajectory accuracy, its assumption of uniform data distribution mismatches actual conditions. Thus CTGAN is more suitable. This suggests that the distribution characteristics of synthetic data are more critical than mere accuracy for trajectory augmentation.
In summary, minority-class sample augmentation enhances aircraft TP accuracy under severe weather without requiring adjustments to validated models. Different augmentation models significantly influence TP model training and prediction based on generated and original trajectories. Evaluating generated trajectory quality and augmentation models merits further exploration. Future research will focus on medium to long-term trajectory prediction to address current limitations.
Acknowledgments
The grant supports from the Hong Kong Research Grants Council (RGC) General Research Fund (GRF) (project code: PolyU 15212622/B-Q94L) and from the Otto Poon Research Institute For Climate-Resilient Infrastructure (RICRI) (project code: ZH8Y) are greatly acknowledged.


 Open access