INTRODUCTION
Big data is everywhere. One of its major promises is providing us with information and ways of seeing reality to which we never had access before. Legal and judicial practices are by no means excluded. We are by now used to seeing charts, graphs, and visualizations of trends in judicial decisions. Several decades ago, making sense of such representations, let alone producing them, was the domain of esoteric expertise. Today, ever more sophisticated analyses are common not only in academic and policy circles but also in popular and social media. Judges and judicial practices—not unlike policing, personal information, commercial activity, academic writing, or truck driving—are being everywhere and always digitized, quantified, and represented (Cohen Reference Cohen2000; Introna Reference Introna2016; Ferguson Reference Ferguson2017; Zuboff Reference Zuboff2019; Brayne Reference Brayne2020). Yet big data not only enhances our vision, it also affects what it observes (Hacking Reference Hacking1983). The term “datafication” refers to the transformative process whereby something is made into data (Ulises and Couldry Reference Ulises and Nick2019). Generally speaking, datafication involves the process of translating action, which is always layered and dynamic, into fixed categories or quantities and embedding it in digital networks so that it can be tabulated, scaled, and analyzed in real time (compare Mayer-Schönberger and Cukier Reference Mayer-Schönberger and Kenneth2013). This process, ostensibly intended to merely represent what judges do, also intervenes upon and transforms judging. It is thus important to elaborate ways to consider datafication as a social historical phenomenon in its own right—namely, not only as a method for empirical inquiry but also as its object. How, then, does datafication affect judicial practice?
To explore this question, I elaborate a performative understanding of datafication.Footnote 1 This approach draws from science and technology studies, critical race theory, and critical data studies to suspend two commonplace presumptions about data analysis. First, instead of presuming the given or objective nature of data, I elaborate ways to interrogate their ideological underpinnings (Gitelman Reference Gitelman2013; Muhammad 2014). Specifically, I explore how the technical procedures by which judicial decisions are reformatted as data derive from a carceral-colorblind imaginary that seeks to maintain past patterns into the future. Second, instead of presuming that data analyses occur passively while people do what they normally do anyway, I wish to explore the performative effects of datafication or how it indeed influences judicial decisions. A performative approach thus allows us to explore how datafication constitutes a form of power by (1) encoding a certain ideology and (2) enacting it in multiple locales.
The case of US federal sentencing is well suited to explore the pervasive process of the datafication of law. Since the mid-1980s, the field of federal sentencing underwent two dramatic transformations in formal law. First, in 1987, the US Federal Sentencing Guidelines imposed uniform protocols on sentencing decisions that were previously based on substantive, individual considerations (USSC 1987a). Then, in 2005, the Booker decision relegated the Guidelines from mandatory to advisory status, granting judges more discretion.Footnote 2 Literature on these transformations, like sociolegal research more broadly, is largely divided by “levels of analysis.” While one tradition targets large-scale shifts, such as from “progressive” to “managerial” punishment (Feeley and Simon Reference Feeley and Simon1992; Savelsberg Reference Savelsberg1992), another explores local responses by judges and judicial communities (Dixon Reference Dixon1995; Ulmer Reference Ulmer2005; Lynch and Omori Reference Lynch and Marisa2014). Considering these developments through a performative perspective, however, reveals that the Guidelines were not merely a sudden “tectonic shift” in the legal environment to which judges variably responded (compare Edelman Reference Edelman2016; Goodman, Page, and Phelps Reference Goodman, Joshua and Michelle2017). Instead, the Guidelines also precipitated the creation of a new digital network or “data environment” (Brayne Reference Brayne2017) that extends connective media between sites and continuously scales up “local” practices so as to render them legible for long-distance governance (J. Scott Reference Scott1998).
To closely interrogate this process, I draw from the method of discourse tracing, suited to explore over time the interaction of texts and practices from different levels of analysis (LeGreco and Tracy Reference LeGreco and Tracy2009). The inquiry reveals that the datafication of sentencing proceeds through four iterative mechanisms. The first mechanism (field assembly) illuminates the ideological underpinning of datafication, namely, how datafication encodes a certain “sociotechnical imaginary” (Jasanoff Reference Jasanoff, Jasanoff and Kim2015) in the process of transforming decisions into data and assembling a “field panorama.” The second and third mechanisms (symbolic projection, material inscription) focus on datafication’s performative effects or the media through which it continuously affects local decisions. The fourth mechanism (boundaries spanning) is unique in that it reveals the dialectic dimensions of datafication. By opening up datafication to new actors and expanding the “ecosystem of connective media” wherein judges operate (van Dijck Reference van Dijck2014), this mechanism enhances digital surveillance, yet it simultaneously decentralizes datafication and makes its ideological underpinnings susceptible to contestation and change (Eyal Reference Eyal2013b). The stepwise consideration of these mechanisms therefore provides analytic purchase to engage a long-standing question in sociolegal research: how do “local” practices relate to “large-scale” processes? While established accounts employ relatively reified distinctions between “levels of analysis” (for example, macro/meso/micro) and focus primarily on one or the other (Rubin Reference Rubin2019), a performative approach asks how datafication mediates action in between sites. Thus, this approach helps explain judges’ continued reliance on the Guidelines post-Booker not only by reference to the stickiness of “local” organizational norms (Ulmer and Johnson Reference Ulmer and Johnson2017) but also by illuminating external pressures that continued to affect judicial practices, via datafication, long after the Guidelines’ formal relegation.
Substantively, the analysis shows how the datafication of sentencing derived from a “sociotechnical imaginary” that is effectively carceral in that it strives to fix an oppressive present in place. This imaginary informed foundational, yet technical, decisions, such as what variables to include in the data form and how to specify them, which encoded legacies of discrimination into colorblind schemes. Consequently, technical devices such as manuals, data collection forms, and visualizations delegated racist and classist dynamics onto nonhuman intermediaries. Datafication thus de facto assumed a logic of containment and partook in locking oppressed people into a dystopic present (Benjamin Reference Benjamin2016, Reference Benjamin2019a). In this respect, the study contributes to discussions about legal practice and racism, which generally target different “levels of analysis” (Ray Reference Ray2019, 28), from biased decision makers (for example, Goff et al. Reference Goff, Eberhardt, Williams and Matthew2008; Eberhardt Reference Eberhardt2019), to organizational and institutional processes (for example, Haney-López Reference Haney-López2000, Jones et al., n.d.), to systemic and structural arrangements (for example, Bonilla-Silva Reference Bonilla-Silva1997). Complementing the productive analytic division between “levels,” a performative approach foregrounds the mediating technologies between sites. In this view, any attempt to redress persistent inequities must target not only structural arrangements, institutions, and situated decision makers but also the manifold media that connect them and the networks in which legal practice is increasingly enmeshed.
The following part describes two established perspectives in socio-legal research and suggests how a performative approach bridges the two. After describing my methodology, I explore datafication in two stages. First, I examine datafication’s early days and elaborate the mechanisms through which it unfolds. Then, I examine datafication’s continuous progression alongside judicial responses and adaptations. Finally, I consider implications and suggest that a performative approach calls social scientists into account and encourages us to consider the politics of our methodological practices. While it remains important to resist overt attempts to utilize data analyses for partisan oppressive purposes, a simple return to “objectivity” or “neutrality” may obscure the more foundational task of interrogating the covert, and often bipartisan, ideologies that undergird datafication. A performative conception of the nexus between social science, law, and persistent inequities encourages us to orient datafication not only to neutrality and objectivity but also toward accountability and justice.
BETWEEN IDEAL TYPES AND LEGAL FIELDS
Two complementary perspectives have long informed socio-legal research. The first perspective sees law in “ideal types” and traces shifts over extended periods of time. The second perspective situates law in “a field” and centers semi-autonomous translation processes that foreground local contexts and the plurality of legal forms. As a recent Law & Social Inquiry symposium shows, the generative tension between these perspectives—which harkens to early debates about the relationship between “law on the books” and “law in action”—is far from being settled (Koehler Reference Koehler2019; McNeill Reference McNeill2019; Page, Phelps, and Goodman Reference Page, Michelle and Philip2019; Rubin Reference Rubin2019; Ward Reference Ward2019). In this part, I consider how each perspective views the recent history of federal sentencing. Against this background, I then propose a performative perspective that traverses “levels of analysis” by focusing on the connective media that link “local” and “dislocal” action.
Law as Ideal Types
Ideal-typical analyses tend to accentuate law’s internal coherence at any point in time. Through such strategic simplification or “one-sided accentuation,” this perspective produces “a unified analytical construct” (Coser Reference Coser2003, 223) that renders complex realities legible for identifying how “legal modes” vary in relation to phenomena such as the economy, religion, or political power (for example, Weber Reference Weber, Rheinstein and Edward1954; Nonet and Selznick Reference Nonet and Philip1978; Kagan Reference Kagan2001). Ideal-typical perspectives have also defined orienting works in punishment and society research from its inception (Durkheim Reference Durkheim1973; Rusche and Kirchheimer Reference Rusche and Otto2004) to the present (Beckett Reference Beckett1997; Simon Reference Simon2007; Wacquant Reference Wacquant2009; Alexander Reference Alexander2010). In general terms, such accounts trace large-scale shifts in “modes” of penal power and their ideological underpinnings. Thus, Malcolm Feeley and Jonathan Simon (Reference Feeley and Simon1992) have characterized a “new penology” in contrast with the old, and David Garland (Reference Garland2001) has explored a shift from the “penal-welfarist” model to a “culture of control.” Ideal-typical perspectives similarly portray the Sentencing Guidelines as a critical intervention point that initiated a “revolutionary new system for punishment of federal crimes” (Stith and Cabarnes Reference Stith and Cabarnes1998, xi; see also Bowman Reference Bowman1996; Espeland and Vannebo Reference Espeland and Vannebo2007). Such explanations cast the 1980s sentencing reforms in terms of a paradigm shift from an “indeterminate” to a “determinate model” (Nagel Reference Nagel1990; Reitz Reference Reitz, Petersilia and Kevin2012), part of a “strategic turn” toward managing aggregates (Feeley and Simon Reference Feeley and Simon1992, 461) or the imposition of a rigid, “neoclassical logic” on a field infused with substantive justice concerns (Savelsberg Reference Savelsberg1992). To be sure, ideal-typical perspectives do not necessarily ignore local variation. Instead, they situate it within “a broader picture” that, by and large, assumes a coherent form (Feeley and Simon Reference Feeley and Simon1992, 449, n1).
Law as a Field
Over the past four decades, socio-legal work increasingly has employed the metaphor of fields to make sense of law and legal action. Drawing from various traditions—notably, organizational theory and Pierre Bourdieu’s work—field perspectives typically critique ideal-typical accounts for being more descriptive than explanatory. As a corrective, field perspectives focus inward and downward: away from the macro/global and toward the meso/local (R. Scott Reference Scott2013; compare Fligstein and McAdam Reference Fligstein and Doug2012). As John Martin notes, “a field replaces the idea of action at a distance, in which X somehow directly affects some Y that it does not touch, with a purely local explanation” (Reference Martin2003, 7; emphasis in the original). Demonstrating the “loose coupling” between institutional design and implementation (Meyer and Rowan Reference Meyer and Brian1977), field perspectives focus on field-level rules, norms, and regularities: the semi-autonomous vernaculars that translate large-scale shifts into actual outcomes. Like in magnetic fields, exogenous vectors get warped by a field’s endogenous forces upon entering its perimeter (Bourdieu and Wacquant Reference Bourdieu and Loïc1992, 17). The methodological orientation of field studies therefore leans toward smaller scales and shorter time frames.
This emphasis on intra-field “translation” entails several implications. First, field studies typically conceive of change as occurring in analytically distinct stages: an external change occurs; internal field processes translate; local outcomes follow (Garland Reference Garland2013, 483). In this vein, Philip Goodman, Joshua Page, and Michelle Phelps (Reference Goodman, Joshua and Michelle2017, 13) offer the metaphor of “tectonic plates” to explain how macro-level “trends” shift under the field and present opportunities on which field actors variably act. According to field perspectives, if “extra-field” processes are to affect legal action they have to “work through” (Heimer Reference Heimer1999), be “refracted by” (Garland Reference Garland2001), become “endogenized” (Edelman Reference Edelman2016), or be “translated” into (Page Reference Page, Simon and Sparks2013) locally established practices. Second, the focus on local translation opens space to consider how the same “exogenous” phenomenon (for example, new legislation) variably manifests in different locales (Merry Reference Merry1988; Morrill and Musheno Reference Morrill and Michael2018). This view therefore critiques the “pyramid” metaphor of for dispute resolution and adjudication (Miller and Sarat Reference Miller and Sarat1980) for ignoring “the potential for legal pluralism in which disputes proceed simultaneously along many coexisting paths with multiple normative systems for resolving conflict” (Albiston, Edelman, and Milligan Reference Albiston, Edelman and Joy2014, 106). What once appeared as a centralized-hierarchical structure, with a judge at the top, transmogrifies into a “dispute tree” nestled within a decentralized “legal forest.”
Field perspectives have increasingly gained conceptual currency in punishment and society research (Sudnow Reference Sudnow1965; Blumberg Reference Blumberg1967; Feeley Reference Feeley1979; Hagan, Hewitt, and Alwin Reference Hagan, Hewitt and Alwin1979; Kohler-Hausmann Reference Kohler-Hausmann2018; Rubin Reference Rubin2021), and much literature has similarly explored local variance under the homogenizing regime of the Sentencing Guidelines. This work traces intra-field variation to “localized” understandings of “going rates” (Ulmer Reference Ulmer1997), “court communities” with “localized legal cultures” (Eisenstein and Jacob Reference Eisenstein and Herbert1977; Church Reference Church1985; Dixon Reference Dixon1995; Kautt Reference Kautt2002), courts as “organizational domains” (Johnson, Ulmer, and Kramer Reference Johnson, Ulmer and Kramer2008; Ulmer and Johnson Reference Ulmer and Johnson2017), or the Guidelines’ incorporation into “local narrative forms” (Lynch Reference Lynch2019). Thus, Mona Lynch and Marisa Omori (Reference Lynch and Marisa2014) demonstrate how federal sentencing practice not only diverged across place but also became variably entrenched over time such that top-down reform was reappropriated in local practices. Revealingly, they “view the federal district court system not as a singular national legal structure with hierarchically arranged and geographically dispersed subunits” (pyramid-like system), “but rather as a semi-autonomous set of systems governed by the same formal rules, statutes, and procedural policies, while also embedded in localized legal cultures that are themselves shaped by regionally specific historical contingencies and norms” (412; emphasis added).
DATAFICATION: TOWARD A PERFORMATIVE PERSPECTIVE
We have, then, two complementary accounts about the Sentencing Guidelines: one is told from the unifying perspective of “large-scale” shifts in policy and ideology; the other narrates manifold “local” responses. This analytic division maps onto literature on the question of how racism impacts sentencing, wherein different accounts emphasize distinct “levels of analysis”—from facially neutral laws and policies (Tonry and Melewski Reference Tonry and Matthew2008), to local norms and organizational cultures (Clair and Winter Reference Clair and Winter2016; Van Cleve Reference Van Cleve2016), to differential treatment by individual judges that results from implicit biases, stereotypes, or “patterned responses” (Albonetti Reference Albonetti1991; Steffensmeier, Ulmer, and Kramer Reference Steffensmeier, Jeffery and John1998; Rachlinski et al. Reference Rachlinski, Sheri Lynn, Wistrich and Chris2009). Lastly, a similar division exists also in research on data and algorithms: whereas one perspective centers the instruments themselves and examines their logic and biases (O’Neil Reference O’Neil2016; Eubanks Reference Eubanks2018; Noble Reference Noble2018; Benjamin Reference Benjamin2019a), a second perspective foregrounds the “loose coupling” between technologies and on-the-ground implementations (Willis, Mastrofski, and Weisburd Reference Willis, Mastrofski and David2007; Couldry and Powell Reference Couldry and Alison2014; Christin Reference Christin2017; Brayne and Christin, forthcoming). Yet, alongside their differences, these various perspectives share a presumption of separability between “levels” and put primary focus on one or the other. This bifurcation helpfully exposes a persistent gap between policy and practice, yet it typically views this gap as an empty space and leaves it under-explored. A performative perspective fills in this gap by illuminating the links or media that extend in between levels. My conceptualization of datafication accordingly builds on its foundational definition—the ubiquitous transformation of action into data—and foregrounds two further aspects thereof: its ideological underpinnings, which link to the “level of policy,” and its performative effects, which link to the “level of practice.” By focusing less on “levels” and more on the connective media between sites, this framework helps trace how shifts in policy and ideology continuously relate to situated practices.Footnote 3 In other words, a performative perspective situates both “large-scale” and “field-level” processes in an expansive network and explores the ties therebetween.
A foundational definition of datafication considers it as the comprehensive and continuous transformation of action into quantified data so that it can be tracked and analyzed in real time (Mayer-Schönberger and Cukier Reference Mayer-Schönberger and Kenneth2013). This definition casts datafication as a form of translation of complex, situated phenomena into a “universal” (that is, standardized) language. Two important characteristics that emerge from this definition are the continuous nature of datafication and its panoramic ambition—indeed, its voracious desire to see everything (n = all) by taking “information about all things under the sun … and transforming it into a data format to make it quantified” (Mayer-Schönberger and Cukier Reference Mayer-Schönberger and Kenneth2013, 15). Building on this definition, I draw on science and technology studies, critical race theory, and critical data studies to suspend two prominent presumptions about data analysis: that of objectivity and that of passivity. Suspending these presumptions is necessary for studying datafication as a social historical phenomenon.
First, considering datafication as translation helps suspend the presumption of objectivity and instead illuminate its ideological underpinnings. While the word “data” means “given” in Latin, a long-standing tradition insists that we should not consider data as simply given but, rather, as “achievements” (Latour Reference Latour1999, 42; Muhammad Reference Muhammad2010; Kitchin Reference Kitchin2014; Simone Reference Simone2018). This perspective directs attention to the technical procedures by which immensely complex and dynamic occurrences are reformatted as data (Espeland and Stevens Reference Espeland and Stevens1998; J. Scott Reference Scott1998) and, thus, to the enabling assumptions that prefigure decisions such as which limited aspects of reality to quantify and how (Merry Reference Merry2016). Far from being given, these assumptions derive from a certain language whose syntax is socially and historically situated and, in this sense, is inextricably ideological (boyd and Crawford Reference boyd and Crawford2012; van Dijck Reference van Dijck2014; Benjamin Reference Benjamin2019a). This syntax parallels what Sheila Jasanoff (Reference Jasanoff, Jasanoff and Kim2015, 6) calls a “sociotechnical imaginary”: a “collectively held, institutionally stabilized, and publicly performed vision … of desirable futures, animated by shared understandings of forms of social life and social order attainable through, and supportive of, advances in science and technology.” The implication is that the laborious affair of datafying practice inevitably proceeds from certain epistemic/normative assumptions, which then become encoded in the data. Accordingly, this perspective shifts analytic focus from the semi-autonomous “field” and toward a field panorama: an assembled representation that draws from a certain imaginary. Put simply, a field panorama is an assembled view of an “entire field” as it appears from a certain perspective that, despite being partial, presents itself as universal.Footnote 4 The situated character of field panoramas foregrounds “the embodied nature of all vision” and trains attention to the politics of representation, which in turn helps consider datafied fields in relation to “large-scale” imaginaries (Haraway Reference Haraway1988, 581). Field panoramas do not “rest” on imaginaries as elements on tectonic plates; rather, they derive from these imaginaries and encode their epistemic/normative assumptions.
Second, while a common view considers data collection as occurring “passively while people do what they normally do anyway” (Mayer-Schönberger and Cukier Reference Mayer-Schönberger and Kenneth2013, 30), a performative approach asks how translating something into data transforms that very thing and enrolls it in particular courses of action (Merton Reference Merton1948; Callon Reference Callon and Law1986; Law Reference Law1986; Espeland and Sauder Reference Espeland and Sauder2007; Kellogg et al., Reference Kellogg, Valentine and Angele2020; compare Smith Reference Smith2020). This approach sidesteps the goal of arriving at the most “accurate” representation and instead encourages us to explore the performative effects of datafication. Focusing on this aspect of datafication means exploring its capacity to enact a field panorama into being—namely, to proceed from representation to intervention by performing a “data environment” that alters the building blocks of practice and opens it up to new avenues of interventions (Healy Reference Healy2015; Brayne Reference Brayne2017). At the same time, a performative approach does not presume that datafication spontaneously squashes “heterogeneous multiplicities” into “isomorphic slots” (Haraway Reference Haraway1988, 586). Instead, it calls attention to mediators and intermediaries that exert ongoing pressures on practice and that also “transform, translate, distort, and modify the meaning or the elements they are supposed to carry” (Latour Reference Latour2005, 39). This perspective thus necessitates a temporal component for investigating the continuous dialectics between homogenization and fragmentation.
METHODOLOGICAL ACCOUNTING
Case studies are particularly well suited for theory generation of the sort exercised in this article because they involve in-depth, multifaceted analysis of social phenomena, which facilitates the elaboration of complex processes (Steinmetz Reference Steinmetz2004). The federal sentencing field is well suited for this inquiry, first, because it underwent datafication early on, which makes it an early case of big data analysis and allows us to interrogate datafication over time. Second, as we shall see, the central role of the US Sentencing Commission (USSC) in datafying practice accentuates the homogenizing dynamics of the process while providing rich evidence of its enabling assumptions and technical procedures. At the same time, judges were by no means oblivious to datafication’s performative effects. As empowered actors, their variable responses help explore the continuous dynamic between “local” and “dislocal” action.
In general terms, I investigate datafication as a set of humble and mundane mechanisms that mediate between dominant imaginaries and local practices (P. Miller Reference Miller, Amin and Thrift2004). To do so, I draw from the method of discourse tracing that centers the importance of power yet is suited to explore over time the interaction of texts and practices from different levels of analysis, particularly in the wake of a field-level “rupture point” such as the enactment of the Sentencing Guidelines (LeGreco and Tracy Reference LeGreco and Tracy2009). Accordingly, I have collected and organized my sources into three subsets: one for each “level of analysis” (ideal-typical versus field), and one for mediating spaces in between (see Table 1). After ordering my sources chronologically, I performed a close reading of each subset in view of tracing shifts and processes therein and, importantly, identifying how these processes connect to processes in other sites. The temporal dimension of the inquiry—spanning approximately two decades from the enactment of the Guidelines to the Booker decision—allowed me to consider the relational dynamic between levels. After conducting the analysis, I conjoined these multi-layered processes into one relational diagram (see Figure 1 below).
Sources and analysis

The first subset or “cluster” of sources pertains to national-level dynamics of the kind typically centered in ideal-typical perspectives. These sources include the commission’s annual reports (found in its online archive), several supplementary and issue-specific reports, and several articles that recount the commission’s efforts to collect, analyze, and circulate sentencing data. I performed a close reading of these sources that was geared to trace the enabling assumptions, and, thus, the ideological underpinning, of the process of translating sentencing decisions into data. I paid particular attention to the syntax of the translation process, its prosaic procedures, and its relation to sociotechnical imaginaries. This part of the analysis yielded the mechanism that I call “field assembly.”
The second subset or “cluster” of sources pertains to judicial responses of the kind typically centered in field-level accounts. To construct this subset, I drew a purposive sample of published materials—including articles, reprinted lectures, and judicial decisions—wherein judges communicated their shifting understandings of sentencing. Drawing on the ample research on the subject conducted over the years, I included secondary analyses of local/field-level judicial responses to the Guidelines. I performed a close reading of these sources geared to trace shifts in judicial “problematizations” (Rose and Valverde Reference Rose and Mariana1998) and practice in relation to the changing landscape of sentencing. The notion of “problematizations” is helpful here because it simultaneously (1) focuses attention inward on how judges locally conceived the task of sentencing and (2) turns attention outward to trace these local understandings to their removed “surfaces of emergence.” This part of the analysis contributed to the part of this article entitled “Judicial Action and Datafication over Time,” wherein I consider how fragmentation and homogenization occur relationally and continuously.
The third subset of sources includes mediators and intermediaries that connect the two aforementioned processes. These instruments, which are typically overlooked in both ideal-typical and field studies, are fashioned in one place (for example, the commission’s offices) and made to act in numerous others (for example, judicial chambers). In so doing, they may mediate or even “freeze social relations” and exert pressure far outside their loci of production (Jasanoff Reference Jasanoff, Jasanoff and Kim2015, 15). In this sense, this subset of sources does not form an independent “cluster” but, rather, the “ties” that connect the first two clusters. These ties include objects, data-collection instruments, data visualizations, and data analyses, all of which not only describe but also influence practice. I performed a close reading of these sources that served to trace their performative effects. This part of the analysis yielded the mechanisms I call “symbolic projection,” “material inscription,” and “boundaries spanning.”
THE DECLINE OF PROGRESSIVE TIME
Before closely examining datafication, let us briefly consider the large-scale transformation that the Sentencing Guidelines reflect. The “indeterminate sentencing model” that governed federal sentencing for most of the twentieth century entrusted judges with broad discretionary powers (Nagel Reference Nagel1990; Reitz Reference Reitz, Petersilia and Kevin2012). Under these arrangements, district judges were responsible for admitting subjects through the system’s “front-end,” while correctional officials were responsible for “back-end” sentencing by controlling early release. From an ideal-typical perspective, these arrangements expressed the “rehabilitative” or “penal welfarist” paradigm, which was itself linked to a progressive imaginary that provided the syntax for assembling a coherent panorama from what was effectively a fragmented, internally contested field. The fact that on-the-ground practice diverged from this unifying vision is precisely the point. As David Garland (Reference Garland2001, 35) suggests, the rehabilitative ideal “provided an all-embracing conceptual net that could be cast over each and every activity in the penal field, allowing practitioners to render their world coherent and meaningful, and to give otherwise unpleasant, troublesome practices something of a benign, scientific gloss.” This imaginary included a certain vision of a damaged-yet-corrigible subject, an expert judge, and a general progressive understanding of punishment. Penal adjudication thus linked to “progressive time” and an imaginary that emphasized law’s capacity to make society better (Nonet and Selznick Reference Nonet and Philip1978).
In this imaginary, the sentencing judge figured as an expert adjudicator sitting atop “a pyramid of violence,” engaged in the “Herculean” task of individuating punishment in incommensurate cases (Cover Reference Cover1986, 1609). Nancy Gertner (Reference Gertner2007, 527), a retired judge for the District of Massachusetts, described this state of affairs as though the “criminal justice system was, for the most part, left to the sentencing experts, the judges.” From their singular seat at the top of the pyramid, judges could “see” unique characteristics and exercise expert judgment. Some observers likened the sentencer’s role to that of a physician and described it as clinical, therapeutic, or diagnostic (Nagel Reference Nagel1990; Gertner Reference Gertner2010). As Jasanoff (Reference Jasanoff2002, 52) notes, in this vision “[t]he judge’s eye remains … very much ‘the eye of power.’” The incommensurability of judgments was thus foundational to judicial expertise and defined what it meant to be a sentencing judge (Espeland and Stevens Reference Espeland and Stevens1998). Even more generally, the pyramid imaginary reflects an old-age vision of adjudication (Miller and Sarat Reference Miller and Sarat1980) and its place within the “broader context” of legal-bureaucratic authority (Weber Reference Weber, Rheinstein and Edward1954; Kelsen Reference Kelsen and Knight1967). While each judicial chamber comprises a pyramid’s tip onto its own, it is also nested within the larger court system, which is itself understood as a cohesive structure with hierarchically arranged, geographically dispersed subunits. Judges are not only singularly authoritative actors but also part of a collective—“the judicial branch”—responsible for the development of common law.
During the 1970s and 1980s, the adhesive capacity of the progressive imaginary and the pyramid panorama gradually lost efficacy. Judge Marvin Frankel (Reference Frankel Marvin1973, 7–8), a prominent figure in the sentencing movement, described “the reality” under indeterminate sentencing as a “‘non-system’ of extravagant powers confided to variable and essentially unregulated judges,” which in turn bred “a wild array of sentencing judgments without any semblance of consistency.” As others added, this made sentencing particularly susceptible to racial and other invidious biases (American Friends Service Committee 1971). Notably, Frankel did not announce this chaos as a recent development; rather, he saw himself exposing an underlying disarray that had long lurked beneath the surface. His assessment attested to the diminishing capacity of an established panorama to impose a sense of order on what was all along a far more complex, fragmented field. While these assessments were initially fueled by liberal sentiments, conservatives soon followed suit and decried the unregulated power of judges to mete out lenient sentences. The sentencing reforms ultimately expressed a bipartisan effort to impose a new vision of order on a disorderly field. Concurrently, a new sociotechnical imaginary was becoming increasingly salient (Aas Reference Aas2005). In general terms, this imaginary replaced “progressive time” and the lofty ideal to make society better with a “homeostatic” logic of managing anxieties about the future by fixing the present in place (Foucault Reference Foucault and Burchell2008).
THE DATAFICATION OF SENTENCING
In 1984, the Sentencing Reform Act (SRA) established the USSC.Footnote 5 The first commission comprised of seven members instructed to write, by April 1987, guidelines for federal sentencing. In 1987, the commission promulgated the Sentencing Guidelines, which determined sentences based on two quantities: “offense level” and “criminal history category,” while precluding consideration of individual characteristics and most of the surrounding circumstances including age, educational history, vocational skills, mental and physical condition, employment record, family responsibilities, and community ties. The Guidelines replaced the incommensurate subject—previously, the sentencer’s well-defined object—with a standardized defendant. Instead of adjudicating subjects based on “nominal judgments” (oriented to essence) from the top of a pyramid, individualization now implied “cardinal judgments” (oriented to quantities) wherein judges identified the applicable slot in a prefabricated grid (Fourcade 2016).
Similar to other cases wherein managerial paradigms were imposed on reluctant institutional actors (Lynch Reference Lynch1998; O’Malley Reference O’Malley1999; Maurutto and Hannah-Moffat Reference Maurutto and Kelly2006; Rothschild-Elyassi, Koehler, and Simon Reference Rothschild-Elyassi, Johann, Jonathan and Deflem2019), the relationship between the Guidelines’ logic and on-the-ground practice has been far from linear. The Guidelines, however, were not only an abrupt change in the “legal environment” to which local/organizational actors variably responded. As noted, accounts in this vein presume relatively reified divisions between “levels of analysis” and thereby leave unexplored a crucial dimension of the Guidelines’s operation. A performative perspective, by contrast, views the Guidelines not only as part of the “legal environment” but also as establishing mechanisms that extend between locales and elaborate a whole new “data environment” that affects all levels of activity (Brayne Reference Brayne2017). Figure 1 represents the iterative relationships between these mechanisms. First, field assembly draws on a certain imaginary to translate heterogeneous decisions into data and arrange them into a coherent panorama. While this process is ongoing, interrogating the preliminary undertaking of defining its parameters helps illuminate datafication’s ideological underpinnings. Symbolic projection and material inscription then exert performative pressures on judicial practice and enact the assembled panorama within the very field it represents. Finally, boundaries spanning opens up the data environment in ways that may augment the performative effects of datafication, yet simultaneously make its foundational vision susceptible to contestation and change.
Datafication.

Field Assembly
Field assembly involves the process of specifying the data format and creating a field panorama in which practices can be located. This foundational process entails material decisions that derive from a certain imaginary. Since these decisions set datafication in motion, the ensuing process will encode the underlying imaginary into all future data, whose supposed neutrality will then bestow objectivity on future analyses such that the emergent data and field panorama appear given and universal. The ideological underpinnings of datafication are particularly visible during this foundational stage. Once field assembly is complete, the passage of time and accumulated investment in already-existing formats make the contrived aspects of datafication less visible and harder to alter (Thévenot Reference Thévenot1984). As Wendy Espeland and Michael Sauder (Reference Espeland and Sauder2007, 19, n21) note, “commensuration is most jarring and seems less like measurement and more like artifice when it encompasses things to do not already seem alike.” Tracing datafication’s early stages helps foreground the context and people involved in synthesizing a digital ontology by which different things will become alike. Accordingly, I now turn to the work of the commission between October 29, 1985, and April 13, 1987 “to create a set of guidelines” (Breyer Reference Breyer1988, 6). I pay particular attention to how each stage assumes inheritances from antecedent action and anticipates subsequent action (Introna Reference Introna2016), emphasizing the links that extend from contingent historical circumstances, to a certain imaginary, to specific instruments, to the assembly of a particular panorama.
The co-productive relationship between the Sentencing Guidelines and carcerality began with a foundational decision, described by Justice Stephen Breyer (Reference Breyer1988, 18)—then a Circuit judge and member of the first commission—as the “past practice compromise.” In essence, since the commission failed to reach a normative agreement about the Guidelines’ “philosophical premises” (15), it decided to side-step moral and political dispute by resorting to simplified empirical analysis, indeed to “base the Guidelines upon typical, or average, actual past practice” (17). In the commission’s words, it “sought to resolve the practical problems of developing a coherent sentencing system by taking an empirical approach that starts from existing sentences” (USSC 1987b, 16; emphasis added). Instead of positively articulating a vision for a “better future,” the commission thus decided to tether the future onto the past by “replicating the average pre-Guidelines sentences handed down to particular categories of criminals” (Breyer Reference Breyer1988, 17; emphasis added). The goal was to deploy this “empirical approach” to identify aggregate patterns and “limit the otherwise broad range of sentences that may be (and currently are) imposed” (USSC 1987b, 17). Far from being a mere technical compromise, this procedural escape hatch from normativity drew legitimacy from an increasingly pervasive imaginary that views technology as an instrument for maintaining homeostatic time instead of for advancing progressive time. This approach embodied “an internal regulation of governmental rationality” (Foucault Reference Foucault and Burchell2008, 10), one arrived at through studying the target population and “letting the data speak for itself” (Mayer-Schönberger and Cukier Reference Mayer-Schönberger and Kenneth2013, 6–12). The Guidelines were thus premised on the ambition to “establish a sort of homeostasis, and compensate for variations within this general population and its aleatory field” (Foucault Reference Foucault and Macey2003, 246). This signaled a foundational shift—not searching for the “why” but only the “what” or shifting from justification to pattern recognition.
Importantly, it was no historical accident that the commission decided to base its guidelines on this homeostatic imaginary. Given a pervasive racialized “tough-on-crime” agenda, on the one hand, and the commission’s mandate to redress “unwarranted sentencing disparities,” on the other hand, the “past practice compromise” offered a colorblind harbor (Murakawa and Beckett Reference Murakawa and Katherine2010). This was so given the immanent duality of homeostasis: whereas, for some, it promised stability and safety, for others, it meant continued oppression that could now be justified by the simple fact that it had become the norm. The commission’s logic could thus ensure the colorblind enactment of a “kind of temporal penitentiary in which oppressed people are locked into a dystopic present” (Benjamin Reference Benjamin2016, 150). This imaginary was politically effective precisely because it involved this duality by which neutrality (in the sense of deferring normative accountability) becomes indeed carceral. Thus, typical past practice became a normative compass instead of that which needs to be thwarted.
Having reached this decision, the commission now turned to creating a lens by which to see the past. How, then, did the commission operationalize its “empirical approach”? How precisely did it transform “existing sentences” into data? As noted, the starting point for determining “offense levels” and corresponding “ranges” emerged from a statistical analysis of “recent sentencing practices” (USSC 1987b, 21–26). This meant, first, amassing information about past practices and, second, contriving methods by which to make this information into analyzable data. As for the first task, the commission accumulated information from several different sources. First, the Administrative Office of the US Courts provided the commission with a “computer file of all defendant records in [the] Federal Probation Sentencing and Supervision Information System” (21). This database included almost one hundred thousand felony and serious misdemeanor cases leading to convictions since mid-1983. Since this database was incomplete, the commission collected an additional sample of 10,500 case histories about which it received further information and complete presentence investigation reports from the Probation Division and the Bureau of Prisons. The commission thus gained “ready access to quantitative and qualitative information in the form of 10,500 computer records and even more detailed information in the form of 10,500 presentence reports” (21). In so doing, it gathered information that was originally created by different institutions for a variety of reasons, for the purpose of identifying patterns within the target population.
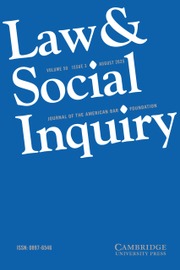
The next step was to develop a method by which to tabulate or remake divergent objects (“records,” “case histories,” “presentence reports”) into data and, as it were, to let the data speak. As Justice Breyer (Reference Breyer1988, 7) has summarized, the information that the commission gathered was “entered into the Commission’s computers and used to determine what factors typically account for more, or for less, time actually served.” To enter divergent objects into its computers, however, the commission first needed to make consequential decisions, such as specifying what factors to include in the data form and, importantly, which to exclude from the frame. Though the precise coding scheme is not delineated in the report, the commission recounted that its central goal was to identify “typical” sentences by “baseline offenses” and certain “aggravating and/or mitigating factors.” To this end, “the Commission relied on standard statistical techniques (multivariate maximum likelihood estimation) to infer how [first-time] defendants typically would be treated given prevailing sentencing and parole tactics” (USSC 1987b, 23; emphasis added). Conceding that “no statistical model could replicate judicial decision making,” the commission nonetheless stated that such a model could provide “a meaningful synopsis of current sentencing practices” (emphasis added). The results were summarized in a form known as the “Levels Tables.” Figure 2 summarizes the estimated time served for baseline offenses, while Figure 3 summarizes estimated levels adjustments by offense circumstances.
Estimated Time Served for Baseline Offenses: 1st Time Offenders, Convicted at Trial, Sentenced to Prison, Adjusted for Good Time.
Credit: USSC 1987b, 27.
Estimated Level Adjustments: 1st Time Offenders, Convicted at Trial, Sentenced to Prison, Adjusted for Good Time.
Credit: USSC 1987b, 36.

To provide a “synopsis of current sentencing practices,” then, trained officials collected information from a variety of sources; read through it with a targeted eye, coding for certain features only and ignoring the rest; tabulated the output into one database; and analyzed the emergent data so as to trace aggregate patterns. This undertaking involved “a system for discarding information and organizing what remains into new forms” (Espeland and Stevens Reference Espeland and Stevens1998, 317; Espeland and Vannebo Reference Espeland and Vannebo2007, 28). A crucial point in this respect is that the format into which past practice was translated was not itself part of empirical reality; rather, it derived from a colorblind-carceral imaginary, itself fashioned under contingent historical circumstances. Accordingly, it seems more adequate to speak of the emergent data not as “given” but, rather, as “achievements” (Latour Reference Latour1999, 42). In this way, a particular ideology prefigured the assembly of a technical instrument for translating past practices, which had much to do with identity and context, into a digital syntax that sees only baseline offenses and certain factors. This instrument was effective in creating a colorblind-carceral panorama. If under indeterminate sentencing factors such as race, socioeconomic status, disability, or pre-conviction information influenced officials (American Friends Service Committee 1971), then the commission’s “empirical approach” reconfigured discriminatory practices through a colorblind lens. In deciding, for instance, to make “baseline offense” an independent variable, without disaggregating it from factors such as race or socioeconomic status, the commission de facto prioritized consistency (which includes maintaining past discriminatory patterns) over equity (redressing them). Datafication thus absorbed legacies of oppression and effectively reconfigured them into a colorblind scheme (Barocas and Selbst Reference Barocas and Selbst2016).
Once a panorama of the past had been assembled, the commission could utilize it for constructing a view of the present. In this sense, the commensuration of past decisions proceeded with an eye toward classifying present decisions as legitimate or illegitimate. Already in its 1988 report, the commission relied on a random sample to analyze the frequency of judicial “departures” from the Guidelines, defined as cases wherein judges sentenced outside the calculated range, regardless of the reasons given. The commission reported that, of the 2,258 cases in a random sample, 82.3 percent of sentences were “compliant” in that they fell within the applicable range, 2.9 percent were above the range, 5.7 percent were below the range because the defendants assisted the government, and 9.1 percent were below the range for other reasons (Tonry Reference Tonry1989). In this way, commensuration simultaneously made sentencing decisions alike, by translating them into a standardized format, and distinguishable, in that they could take on such qualities as “compliant” or “noncompliant” (Freed Reference Freed1992, 1720–21). From then on, every decision could fit into one of two categories, and this classification would enable numerous subclassifications, analyses, and interventions.
If commensuration was done with an eye toward classification, classification was done with an eye toward regulation. Thus, the SRA expressly charged the commission with a duty to periodically “review and revise [the Sentencing Guidelines] in consideration of comments and data coming to its attention.”Footnote 6 As Breyer (Reference Breyer1988) attested, “the system is ‘evolutionary’—the commission issues Guidelines, gathers data from actual practice, analyzes the data, and revises the Guidelines over time.” Initially, this “evolution” proceeded through formal law: the commission issued formal amendments that designated off-limits factors, which the courts had declared, through judicial interpretation, as valid grounds for departures (M. Miller Reference Miller1992, 445, n132). This traditional dynamic of overt contestation over the formal meaning of law by two sovereign entities still occurred at the level of justification. The commission’s work, however, soon devolved into the less conspicuous level of pattern recognition. This shift was exemplified in the commission’s 1993 establishment of a working group tasked with studying departures from the Guidelines to “determine whether current departure practice is consistent with statutory authority and congressional intent” (USSC 1994, 8). For this purpose, the group undertook “an empirical analysis of district court departure practices, reviewing in detail 1,400 departure case files” in an effort to “promote better understanding of the role of departures in Guidelines sentencing.” In this way, the data format that the commission created for rendering “past practice” visible, which itself derived from a carceral-colorblind imaginary, was now utilized to view and regulate the present. In this vision, judges’ interpretations and precedents mattered less than aggregate patterns, and judicial practices were made into regulatable phenomena. In effect, this vision meant fastening the future of sentencing onto its past in ways that absorbed historical inequities, legitimated their cumulative effect, and assembled an apparatus that no longer depended on present human prejudice for enacting disparate impacts (Benjamin Reference Benjamin2019a).
Having created a view of sentencing decisions in terms of classifiable, regulatable objects, the commission could gradually assemble a more intricate and gapless panorama. As early as 1990, the commission began to disaggregate judicial departure rates by “jurisdiction,” “reasons for departure,” and “primary offense category.” With time and technological advancement, these operations grew more elaborate and comprehensive. In 1990, the commission still relied on a statistical sample (25 percent) from a pool of only ten districts to produce departure estimates. As Figure 4 demonstrates, this sample-based analysis provided only a partial representation of the field, not yet a holistic panorama. A year later, however, “submission rates” were sufficiently high (92.4 percent) to report departure rates not based on samples but, rather, for all cases received (USSC 1991, 133). These developments, conjoined with the subsequent employment of geo-visualization, signaled a gradual shift toward big data logics (n = all) that allowed the commission to assemble a gapless panorama (Figure 5).
GUIDELINE DEPARTURE RATES FOR SELECTED DISTRICTS’ (October 1, 1989 through September 30, 1990).
Credit: USSC 1990, 81.

Downward Departure Rates by Judicial District, Fiscal Years 1991 versus 2001.
Credit: USSC 2003, 33.

Here again, a concern for governing undergirded classification. The commission demarcated judicial subpopulations as objects of analysis and relied on the knowledge thus produced to govern practice in varying degrees of aggregation. The maps in Figure 5 demonstrate this point. In geo-visualizing district-level increases in departure rates over time, the commission datafied growing trends and made them legible and actionable for long-distance governing. The sub-setting of departure rates by district gradually institutionalized “districts” as units of comparative analysis, and thereby justified variable degrees of analytic attention and regulative interventions. Furthermore, the commission soon employed yet another layer of classification, sorting districts into two distinct categories of either “high” or “low” departure rates. Judicial districts were effectively assigned a “risk-level” based on aggregate compliance rates. Not unlike longitudinal studies of offenders’ risk levels (Wolfgang, Figlio, and Sellin Reference Wolfgang, Figlio and Thorsten1972; Greenwood and Abrahamse Reference Greenwood and Abrahamse1982), this classification proved stable over time as “districts classified as having relatively high downward departure rates, and districts having relatively low downward departure rates, generally remain in those categories from year to year” (USSC 2003, 34).
My intention in detailing these operations is not to “reveal” unknown facts or impugn the commission’s integrity. Rather, I aim to foreground “backdoor procedures” through which ideology prefigures datafication. With the resulting apparatus in place, commissioners and judges need not harbor racist or classist sentiments (whether explicit or implicit) to continue to enact past inequities. They simply need to do their job. As Benjamin (Reference Benjamin2019a) notes, “[t]he power of the New Jim Code is that it allows racist habits and logics to enter through the backdoor of tech design, in which the humans who create the algorithms are hidden from view.” Nevertheless, the process of field assembly still targets primarily the level of representation—namely, of assembling a coherent image out of disparate practices. This mechanism does not explain how datafication influences on-the-ground practice or enacts a data environment into being. For a field panorama to “make a difference” in practice, it must become effectively linked to its object. Datafication extends such performative links through the mechanisms of symbolic projection and material inscription.
Symbolic Projection
Symbolic projection involves the process of mediating a field panorama from one site to removed actors’ ways of seeing. This mechanism works by affecting cognition, changing the locus and form of attention, and creating new connections while obscuring others (Espeland and Sauder Reference Espeland and Sauder2007, 16). By producing a “synopsis of sentencing practices,” the commission has also rearranged the meaning of sentencing around the syntax by which this very synopsis was fashioned. Creating the Guidelines therefore meant not only their imposition as formal law but also the rearticulation of the task of sentencing in ways that (1) diverted attention from vast amounts of information and (2) arranged what remains within a standardized form. While this new form was immediately authoritative in the legal sense, its cognitive authority accrued with time as it rendered less visible and more “unreal” anything that was hard to express in its language (Simmel Reference Simmel, Bottomore and Frisby1978, 443–45).
Symbolic projection takes effect through various media, including objects such as manuals and data collection forms (more on this below), language, the circulation of data analyses, and people. A good example is the classification of judicial decisions in terms of “compliant” or “non-compliant.” The outrage evoked by this nomenclature attests to its symbolic efficacy (Weinstein Reference Weinstein1992). Yet even after this evocative language was changed, the definition of “departure” remained contested. As Daniel Freed (Reference Freed1992, 1721; emphasis added) notes, “[t]he distinction between compliance and departure was a false dichotomy, manufactured by the Commission to deter judges from sentencing outside the prescribed ranges. It understated the considerable opportunities for discretion available to participants in the sentencing process.” While the “manufactured” nature of this distinction was more conspicuous at first, the notion of “departures” as defined by the commission gradually settled and became an obvious part of sentencing (Berman Reference Berman2000). Another example of symbolic projection is training sessions that instructed new judges on the administration of the Guidelines. As two instructors reported, these sessions affected new judges such that they were often more concerned by how to manage the little discretion the Guidelines left them than by considerations of fairness and justice (Mihm and Gertner Reference Mihm and Gertner1998).
Another important medium of symbolic projection involves data analyses and visualizations. Figures 4 and 5 provide helpful examples. While, on one level, these figures simply describe practice from a bird’s-eye view, on another level, they may affect judicial perceptions. A judge who makes sense of these figures must concede, however temporarily, the ontology of its composite elements: sentencing decisions as binary variables, judges as data points, and judicial populations as entities that can take on such values as high or low departure rates. And given that “seeing bestows on objects an accent of truth,” these visualizations confer upon their classificatory operations a sense of objective reality (Amann and Knorr Cetina Reference Amann and Knorr Cetina1988, 134). To interpret these data, in other words, means seeing like the commission. With time and repeated exposure, judges were able to locate themselves within a growing data environment and become increasingly concerned with converging toward the mean.
Material Inscription
Material inscription is the process by which a field panorama palpably inserts itself into the very field it assembles through delegating action onto objects and rearranging the internal composition and external environment of practice. The USSC’s (1987a) Federal Guidelines Manual provides a key example. If, in the process of fashioning the Guidelines, human actors laboriously reformatted past decisions into data, the resulting manual seamlessly crystalized the entirety of this labor in a material object with the capacity to order future decisions. Thus, an innocent table freezes an entire imaginary and the social relations from which it derives (Figure 6). Any future utilization of this immutable object will mobilize all the labor and translations inscribed therein, regardless of the individual judge’s subjective orientations (Latour Reference Latour1999).
1987 Federal Guidelines Manual.
Credit: USSC 1987a.

Unlike symbolic projection, material inscription does not require actors to alter their deliberative frames (Espeland and Stevens Reference Espeland and Stevens1998, 322). All they need to do is follow routinized procedures. The Federal Guidelines Manual holds an undeniable material presence: the first manual was 329 pages long and comprised seven chapters and two appendices. More recent manuals are almost double the size of the original. In all versions, a previously moralized task was fragmented and delegated to technical devices that prescribe action to numerous actors and objects (Riles Reference Riles2005). These instruments required judges, probation officers, and other practitioners to reorganize sentencing as a set of routinized and compartmentalized knowledge practices. Significantly, if these routines derive from histories of racist and classist dynamics, they could continuously enact these dynamics even without the involvement of actors’ beliefs.
Furthermore, the Federal Guidelines Manual ensured that all sentences emerged in prespecified data form, ready-made for collection and analysis. In this way, the internal composition of any future decision was guaranteed to conform to the commission’s specifications. With time, this immediate fit between decisions and data form became a property of the decisions themselves, and the labor invested in manufacturing this fit could fade into the background (Thévenot Reference Thévenot1984). When this occurred, commissioners, judges, and social scientists could simply “observe and measure” sentencing practices rather than actively commensurate them (Espeland and Stevens Reference Espeland and Stevens1998, 317). Finally, such instruments rearranged the external environment of sentencing by materially up-linking judges and decisions to an expansive data environment (Brayne Reference Brayne2017). A single decision thereby linked to every other decision in the country—past, present, and future—through a digital web of connective media. This was indeed a crucial phase in effectively performing the commission’s field panorama (Healy Reference Healy2015). The emergent data environment could now filter heterogeneous decisions through instruments already inscribed with a digital ontology that ordered them as data even before they were issued.
Boundaries Spanning
Lastly, boundaries spanning involves the enrollment of new groups of actors who could now plug into, and possibly affect, the continuous process of datafication. An important development in this regard was the public release of sentencing data by the USSC (1990, 28), which allowed numerous actors, including research agencies and academics, to utilize these data for various purposes (compare Lageson and Maruna Reference Lageson and Shadd2018).Footnote 7 As Jeffery Ulmer (Reference Ulmer2012) notes, when it comes to sentencing research, “[b]y far the biggest development in the late 1980s and 1990s was the availability of data collected by sentencing commissions in guideline states and the federal system.” This signaled a partial decentralization of sentencing practice and its redistribution among numerous actors “equipped with technical tools, who forge new types of expertise and plug into pre-existing ports in the body of the leviathan” (Eyal Reference Eyal2013b, 21).
By linking out to new actors and institutions, boundaries spanning expands the “data environment” or the “ecosystem of connective media” enacted by datafication (van Dijck Reference van Dijck2014). What allows for this expansion is the fact that datafication has already decontextualized and reformatted local practices into standardized forms. Importantly, while boundaries spanning may certainly augment the performative effects of datafication through enhancing digital or “dragnet surveillance” (Brayne Reference Brayne2018), it simultaneously makes its ideological underpinnings susceptible to contestation and change (Baack Reference Baack2015; Hannah-Moffat Reference Hannah-Moffat2019). At this stage, however, boundaries spanning had defined limits and directionality, largely due to the commission’s monopoly over collecting data and specifying its form (Ulmer Reference Ulmer2012). Even as data releases arguably made sentencing expertise less monopolized and more “generous” and “co-productive” (Eyal Reference Eyal2013a), all future analyses began with data whose structure and specifications were conditioned by an already fixed imaginary. As more actors utilized these data, they assumed the risk of further enacting the colorblind-carceral imaginary from which they derive.
Even agencies that utilized original data and were critical of the Guidelines could reproduce the commission’s panorama, as exemplified in a 1992 survey conducted by the Federal Judicial Center (1994). While the survey’s findings revealed judicial dissatisfaction with the Guidelines, its format enacted a vision of sentencing, judges, and the federal sentencing field that was not far removed from that of the commission. By envisioning judges as individual respondents with decontextualized opinions about the law, the survey embraced a perception of judges as separable data objects instead of law-making collectives; it cast judges’ “opinions” as discrete and measurable occurrences as opposed to what brings law into being; and it rendered the federal sentencing field as an aggregation of datafiable individuals as opposed to local organizations comprised of experts operating relationally. Though, in and of itself, the effects of a single survey are negligible, it joined a growing network of knowledge practices that imagine and enact judicial practice through a new panorama (Law Reference Law2009). While partially decentralizing datafication, boundaries spanning also diffused the new panorama—and, therefore, a certain vision of the judge, of sentencing practice, and of its temporal horizons—through space and time.
JUDICIAL ACTION AND DATAFICATION OVER TIME
The Judge’s Eye in a New Panorama
That datafication enacted a new field panorama does not mean that it immediately homogenized judicial practice. In 1992, Circuit Judge Roger Miner (Reference Miner1992, 511; emphasis added) expressed the profound disjuncture between the new panorama and judges’ established ways of seeing:
Disregard family responsibilities? Disregard family ties? Disregard employment record? These are the very elements that enable judges to tailor individual sentences. … I just cannot see how any sentencing process worthy of the name can be put in a place that disallows consideration of these individual characteristics. I cannot see why we have abandoned the rehabilitative model. … I do not see why the human factor in sentencing should be replaced by a chart.
Judge Miner simply could not “see” with this new set of optics. As another judge attested, this visual-cognitive failure also reflected a normative impasse: “It is simply not possible for judges to rigidly apply a general, two-dimensional set of sentencing standards to each individual case in a just and beneficial manner” (Weinstein Reference Weinstein1988, 11; see also Trott Reference Trott1995, 199; Wald Reference Wald, Sarat and Thomas1995, 84–86). As Jasanoff (Reference Jasanoff, Jasanoff and Kim2015, 32) notes, “imaginaries not only help reconfigure actors’ sense of possible spaces of action, but also their sense of rightness of action.”
This impasse inspired variable judicial responses, which we can broadly divide into three categories: collective-strategic resistance, individual tactics, and local differentiation by court communities. Initially, many judges invoked their established identity as a law-making collective or “the judicial branch.” By the end of 1989, two hundred judges had declared the Sentencing Guidelines unconstitutional, as compared to the 120 judges who upheld their constitutionality (Stith and Cabarnes Reference Stith and Cabarnes1998, 196).Footnote 8 Many also openly criticized the Guidelines in their decisions and other public forums (Cooper Reference Cooper1995). With time, however, judges relinquished the open strategic struggle to develop a new “common law of sentencing” (Berman Reference Berman2000) and employed covert tactics that straddled the old outlook and the new panorama (compare Ewick and Silbey Reference Ewick and Susan2003). Like other frontline actors with diminished capacity to shape formal law, judges found ingenious ways to circumvent the rules and manipulate the numbers (Brayne and Christin, forthcoming). What unites these tactics is an emphasis on the individual judge who experiences “an ethical dilemma” that inspires “creative sentencing” (Mihm Reference Mihm1997; Hillier Reference Hillier1991). Like other occasions wherein individuals avoid data surveillance, judges exercised agency by circumventing the Guidelines while creating the appearance of formal compliance (Nagel and Schulhofer Reference Nagel and Schulhofer1992). This, however, was not without its costs. As one judge expressed in an anonymous survey, “the guidelines … have made charlatans and dissemblers of us all. We spend our time plotting and scheming, bending and twisting, distorting and ignoring the law in an effort to achieve a just result” (Weinstein Reference Weinstein1992, 365).
A third response type involves variable absorption of the Guidelines by “court communities” (Dixon Reference Dixon1995; Ulmer Reference Ulmer2005; Wu and Spohn 2010; Lynch and Omori Reference Lynch and Marisa2014). While individual tactics remain isolated, court communities develop local “legal cultures,” which provide normative-cognitive cover (Church Reference Church1985). As studies have shown, local cultures partially account for the variable rates of “judge-initiated downward departures” from the Guidelines across districts (Kautt Reference Kautt2002; Lynch and Omori Reference Lynch and Marisa2014; Ulmer and Johnson Reference Ulmer and Johnson2017). To a significant degree, the gradual institutionalization of local norms accounts for the steady increase in national downward departure rates, as illustrated in Figure 7.
Trends in departure status, fiscal year 1991 – fiscal year 2001.
Credit: USSC 2003, 32.

This brief overview of judicial responses demonstrates that datafication, even when pursued with vigor, cannot simply homogenize practice. Datafication is a continuous, dialectic achievement that is always in the making. To the extent that datafication assembles and enacts a coherent field, it operates alongside various local forces as a homogenizing lens that inserts itself into practice and relentlessly reformats recurring attempts to exit its scope. Thus, while creative sentencing and court communities reflect agency and creativity, such action is relentlessly rendered legible—indeed, captured—through the very vision to which it responds. While nothing can prevent judges from issuing sentences based on subjective considerations that have little to do with the Guidelines, these decisions will be continuously datafied, measured, and rendered governable. In this way, individual agency is partly prefigured through the very panorama to which it is ostensibly the antithesis (Tata Reference Tata2007). Similarly, “court communities” that variably adapt the Guidelines are made legible through the kind of large n analyses that the Guidelines themselves enabled. These communities can be seen as “local” by virtue of the capacity to statistically locate them against a “global” environment, itself enabled by datafication.
Continuous Datafication
From the perspective of the new panorama and the growing war on crime, however, the growing rates of “downward departures” became a burning political issue (M. Miller Reference Miller, Amin and Thrift2004). Congress responded by enacting the Feeney Amendment in April 2003, as part of the PROTECT Act, which instructed the commission to review the grounds of downward departures and take appropriate means.Footnote 9 The commission responded with alacrity. Following another extensive study of frequently cited departure reasons, it issued within months emergency Sentencing Guidelines amendments that reduced departure rates the following year (USSC 2003). Yet these formal amendments must be considered alongside humble and mundane adjustments in the daily flow of practice. The more profound and long-lasting effect of the Feeney Amendment was to further extend technologies of datafication and the data environment it assembles.
An important development in this respect involved the extension and elaboration of the commission’s data collection network. One amendment to the Guidelines, for example, pertained to an already-existing requirement from district judges to state the grounds for each downward departure “with specificity” in a written judgment and crucially in a data-collection instrument titled the statement of reasons (SOR) form (Figure 8).Footnote 10 Previously, such documentation was not mandatory and, importantly, was provided by probation officers and not the sentencing judge (USSC 2002, 39). The amendment shifted this responsibility to judges and thus embedded a digital trace in each and every decision. The broader significance of this mundane adjustment comes to view when considered alongside still other new requirements.
SOR form (page 2/4).

Another provision required the chief judge of each district “to ensure that, within 30 days … the sentencing court submits to the Commission a written report of the sentence” and of various sentencing documents, including “the statement of reasons for the sentence imposed.”Footnote 11 The Feeney Amendment further ensured that the commission “shall make available to the Attorney General, upon request, such data files as the Commission may assemble … including the identity of the sentencing judge.”Footnote 12 Still other provisions instructed the commission to provide the amassed data to either Congress or the Department of Justice, thus establishing digital data collection conduits that linked every decision, as it was being written, to numerous actors in an expanding network.Footnote 13 These prosaic adjustments embedded a form of “dragnet surveillance” in the flow of practice (Brayne Reference Brayne2018), providing fast information, already in digital form, on every sentencing decision in an expanding network of knowledge practices. This effectively linked up “local” judges and practices to a “data environment” through which a host of “extra-field” influences could travel.
It is helpful to consider these changes in light of the four mechanisms of datafication. First, expanded dragnet surveillance increases the network’s density and its real-time capacity to translate heterogeneous decisions into a prespecified data form, thus relentlessly assembling local practices into a certain panorama. Second, the SOR form symbolically conveys the imaginary from which it derives by focusing attention on certain aspects of the task of sentencing and by being a persistent reminder to judges of their position within a data environment designed to measure and regulate their decisions. The SOR form thus connects each judicial chamber to other actors (the commission, Congress, social scientists, the public) within an expansive network. Furthermore, by making judges’ identifiers available in some instances, the judge-as-datum has become all the more visible and scalable. Figure 9, reproduced from the USSC’s (2012) Report on the Continuing Impact of United States v. Booker on Federal Sentencing, underscores this point. Each graph visualizes varying rates, by judge, of “non-government sponsored below range sentences” within a single district and all but invites observers (judges included) to measure each circle in relation to the norm.
Reproduced from USSC’s 2012 Report on the Continuing Impact of United States v. Booker on Federal Sentencing: Part D (4 districts chosen at random).

Third, the SOR form also materially predisposes judicial practice—or “nudges” it, as Cass Sunstein and Richard Thaler (Reference Sunstein and Thaler2008) would have it—to conform with prespecified goals. Consonant to section 5K2.0(e), the Criminal Law Committee of the Judicial Conference designed the form to reflect the information that the commission needed to monitor sentencing practices (Gertner Reference Gertner2012). Yet the form’s design could enact the reality it purported to neutrally survey (Law Reference Law2009). First, the form requires the judge to report findings on the pre-sentence report and specify reasons for their modification as well as to elaborate findings on applicable mandatory minimum provisions. It then tracks the Guidelines’ categories: after instructing judges to report the applicable range calculation, it asks whether their decision falls within or departs from that range. In the latter case, the departure categories that the judge has to check are clearly enumerated. Thus, through embedded defaults and formulaic procedures, the form naturalizes a certain sentencing syntax and disposes practice regardless of judges’ orientations. In other words, the form can generate effects independent of the human agents who fill it out (Werth Reference Werth2019). As Steven Chanenson (Reference Chanenson2006; emphasis added) notes, “[i]ronically described as a ‘Statement of Reasons,’ … the form almost seems designed to encourage the kind of mechanical—and arguably unreasoned—approach to sentencing Booker tried to extinguish.” A judge who tries to exit this vision by using the open-ended space to “explain the facts justifying the sentencing outside the range” must realize that her idiosyncratic reading would collapse back into available categories and be consequently plotted in a graph. The cumulative effects of these operations allow us to appreciate the impact of the mechanisms considered thus far. Through the SOR form and related operations, sentencing decisions could be reformatted into data and, in this form, uploaded to an expansive network in ways that can be grafted onto how others are seeing, thus linking them to the network and eliciting their cooperation.
Lastly, this elaborate and digitally embedded reformatting process leads us to boundaries spanning. The Transactional Records Access Clearinghouse (TRAC) offers a helpful illustration. TRAC operates as part of Syracuse University with the mission to obtain case-by-case records of all federal criminal cases and make their analyses accessible to the public.Footnote 14 The purpose of TRAC, according to its directors, is to study “how well sentencing practices were working and to … develop detailed data as well as web-based tools that would allow the public as well as the courts to examine these sentencing practices and monitor it over time.”Footnote 15 Some of the tools available on TRAC’s website allow users to investigate the sentencing averages of federal judges, by name, and measure them against other judges, their district, and the entire federal judiciary (Figure 10).
Cropped image from an average prison sentence report for a presiding judge for the Middle District of Florida.
Credit: TRAC website, https://trac.syr.edu/judges/aboutData.html.

Judges, in turn, are well aware of the capacity of dragnet surveillance and have become mindful of the analyses that TRAC and TRAC users undertake (Gertner Reference Gertner2012). As the New York Times reported, “[t]he trove of data subjects individual district court judges to a level of scrutiny unprecedented in the history of the judiciary. … In the Eastern District of New York, for example, the 28 judges in the study delivered a median sentence of 24 months for drug cases in the past five years. But there were disparities: Judges Jack B. Weinstein and Kiyo A. Matsumoto gave median drug sentences of 12 months, while the median drug sentence for Judge Arthur D. Spatt was 64 months” (Secret Reference Secret2012). In the reality enacted pursuant to the Feeney Amendment, the pathways between data analyses and judicial practice have become well established. A judge reaches a sentencing decision, already encoded in a data form prescribed by the commission through the SOR form; the decision is then uploaded onto established data trails and travels to the commission; the commission compiles the data and makes them available, if modified, to the Attorney General, Congress, and researchers; the commission and increasingly other actors analyze the data and circulate their findings within and without the very field they describe; when needed, the commission issues modifications in the SOR form and/or amends the data-collection network on which its work depends; gradually, numerous other actors rely upon these data to monitor and analyze sentencing practice.
CONCLUSIONS AND IMPLICATIONS
Datafication has become pervasive, affecting various aspects of life including health (Ruckenstein and Dow Schüll Reference Ruckenstein and Natasha2017), education (Espeland and Sauder Reference Espeland and Sauder2016; Williamson Reference Williamson2017), cultural consumption (Prey Reference Prey, Nowak and Whelan2016), business (Lycett Reference Lycett2013), personal information (Jens-Erik Reference Jens-Erik2016), and legal institutions (Brayne Reference Brayne2020; Christin Reference Christin2017; Joh Reference Joh2016). This article offers a performative approach for studying datafication as a social and historical phenomenon and for exploring how it relates to legal practice and power. Specifically, the analysis elaborates mechanisms for investigating datafication over time and in relation to processes at different sites, including its ideological underpinnings (field assembly), how it affects practice (symbolic projection, material inscription), and how it alters and expands the field that forms its object (boundaries spanning). This performative approach bridges two prominent perspectives by illuminating analytical and empirical gaps in research that employs relatively reified distinctions between “level of analysis” (macro/meso/micro, national/state/local, law-on-the-books/law-in-action, settled/unsettled). Instead of treating “levels” primarily as separable analytic constructs, a performative approach targets mediation between sites. In so doing, this approach avoids both the risk of glossing over local variation as well as the risk of under-theorizing ideology and power. If we are prone to think of law and policy as settled and shifting in tectonic intervals, and of local practice as contested and dynamic, a performative approach provides analytic and methodological purchase for exploring homogenization as a continuous accomplishment that occurs alongside fragmentation (Levi and Valverde Reference Levi and Mariana2008, 822).
This approach offers several contributions to socio-legal research concerning the relations between legal practice and power. First, it sheds new light on existing phenomena. Thus, recent studies have shown that a majority of US federal sentences continued to conform to the Guidelines even after the Booker decision relegated their coercive power (Ulmer, Light, and Kramer Reference Ulmer, Light and John2011). Field perspectives explain this puzzling fact by foregrounding local/organizational dynamics. As Ulmer and Johnson (Reference Ulmer and Johnson2017, 260; emphasis added) suggest, “[o]nce the Guidelines become embedded in organizational sentencing practices … they are likely to continue to shape punishment even when their formal regulative power is curtailed.” In viewing “local organizational practices” as carrying explanatory weight over and against “formal regulative power,” this account presumes a productive analytic distinction between levels. A performative approach adds an important dimension by illuminating how “external” dynamics continuously exert homogenizing pressures upon “local practice” even after formal regulative power has been curtailed. Thus, in an e-mail exchange among the federal judiciary initiated soon after Booker, numerous judges opined that they should continue to sentence within the Guidelines to avoid a harsh reaction from Congress. One judge revealingly stressed: “[T]his is the approach I will urge my judicial colleagues … to adopt so as to avoid intra-district disparity and harsh Congressional overreaction.”Footnote 16 This reveals that (1) judges’ understandings of organizational/intra-field dynamics do not emerge merely from “inside” but also take shape in relation to “external” oversight; (2) in addition to “cognitively anchoring” their decisions to “local norms” (Gertner Reference Gertner2007), judges actively deliberated their established ways, and at least some decided to uphold them due to continuous pressures made palpable through datafication; and (3) while judges maintain local agency throughout, datafication alters the building blocks of judging such that “intra-district disparity” becomes a meaningful category.
A second important contribution of a performative perspective lies in its approach to the question of how racism affects legal practice in general, and sentencing practice in particular (Spohn Reference Spohn and Horney2000, Reference Spohn, M. Bucerius and Tonry2013). Prominent accounts on this question can be schematically divided into three categories, each focuses on a different “level of analysis”: macro-level accounts typically focus on facially neutral laws and policies (for example, Tonry and Melewski Reference Tonry and Matthew2008); micro/individual-level accounts emphasize differential treatment by judges (for example, Albonetti Reference Albonetti1991; Steffensmeier, Ulmer, and Kramer Reference Steffensmeier, Jeffery and John1998; Rachlinski et al. Reference Rachlinski, Sheri Lynn, Wistrich and Chris2009); and meso/organizational-level accounts foreground local norms and organizational cultures (for example, Clair and Winter Reference Clair and Winter2016; Van Cleve Reference Van Cleve2016). This division largely corresponds to theoretical outlooks that consider racism as working through mechanisms at different “levels,” including structural arrangements (Blauner Reference Blauner1972; Omi and Winant Reference Omi and Howard1994; Bobo, Kluegel, and Smith Reference Bobo, Kluegel, Smith, Steven and Jack1997; Bonilla-Silva Reference Bonilla-Silva1997), unconscious and other cognitive processes (Lawrence Reference Lawrence1987; Eberhardt Reference Eberhardt2019), or institutions and organizations (Haney-López Reference Haney-López2000; Ray Reference Ray2019). A performative approach adds to these accounts by turning attention to mediating technologies between sites. This approach illuminates a kind of technological racism that enables the continuous, non-subjective enactment of persistent inequities through techno-legal devices that delegate punitive, racist, and classist dynamics onto nonhuman intermediaries (Benjamin Reference Benjamin2019a).
Third, and relatedly, a performative perspective encourages us to carefully consider prominent approaches that advocate for using more legal regulation and data analytics as instruments for redressing persistent inequities. As for the law, a performative approach joins a growing body of work that foregrounds the challenge of proving persistent inequities with conventional legal tools. Indeed, in the same year that the Sentencing Guidelines were enacted, the US Supreme Court issued the McCleskey decision, which denied the use of statistical evidence to demonstrate racially disproportionate “impact.”Footnote 17 Instead, the court held, a discriminatory “purpose” must be shown. The constellation of the McCleskey decision with technological racism results in a “perfect storm” (Van Cleve and Mayes Reference Van Cleve and Mayes2015): At the same time that persistent inequities could metastasize through mechanisms that do not depend on conscious beliefs, the judicial lens for seeing racism was honed to detect nothing but such conscious beliefs. In this reality, more law does not immediately mean less inequity.
As for datafication, a prominent approach considers data-driven and algorithmic decision making as a means to reduce biases and further equitable decisions. This approach presumes (1) that discrimination proceeds primarily from human cognition, which (2) datafication can cabin and equalize. The current inquiry joins a growing body of work that suggests that these presumptions should be carefully examined in context (Barocas and Selbst Reference Barocas and Selbst2016). First, if ideology gets seamlessly encoded in technical instruments, such instruments can hardly be a blanket solution to inequities that result from this very ideology. Second, not unlike formal law, technology does not eliminate discretion but, rather, displaces it to less visible sites (Brayne and Christin, forthcoming). Consequently, if datafication is to become a useful means for furthering accountability and justice, we may need to rethink the ambition to singly direct it toward neutrality and objectivity. While it remains important to resist overt attempts to harness datafication for partisan oppressive politics, a simple return to objectivity may obscure its inextricable relation to ideology and power.
In this respect, a performative approach points to an important direction. By delineating the iterative relationship between ideology and practice, this approach reveals not only the homogenizing thrust of datafication but also its continuous, dialectical nature. Specifically, the mechanism of boundaries spanning exposes the loose ends of what may otherwise appear as an “iron cage” assembled by legal, bureaucratic, and computational processes. Simply put, it is becoming increasingly possible for far-removed actors to plug into the field-turned-network and influence its workings. This development has already enabled analyses that assemble “counter-narratives” to the commission’s colorbind vision, for instance by disaggregating existing data in new ways, resituating practice in context, and providing compelling accounts of sentencing disparities across and within districts.Footnote 18 Such analyses repurpose existing data, and the ecosystem of connective media that was originally assembled by the commission, to support the agency of datafied judges (Baack Reference Baack2015). At the same time, the commission’s continued centrality in producing sentencing data significantly limits the capacity of such analyses to articulate and enact alternative visions, and specifically visions that foreground and decidedely redress legacies of oppression. This means that attempts to further accountability and justice through datafication need, first, to articulate visions for alternative futures and, second, to assemble collectives that could act and perform these visions together (Milan and van der Velden Reference Milan and Lonneke2016; Benjamin Reference Benjamin2019b; Hannah-Moffat Reference Hannah-Moffat2019). In this view, social scientists should not only strive to get the story right; indeed, we also need to contend with how we are becoming part of the story or, as Donna Haraway (Reference Haraway1988) notes, how we are called into account. As datafication increasingly opens up the networks in which sentencing occurs, our expertise positions us well to partake in this effort.


 Open access