


Introduction
In recent decades, U.S. cropping systems continued a long-term trend toward shorter and less diverse rotations with increased importance placed on corn, often combined with soybeans (Lark et al., Reference Lark, Meghan Salmon and Gibbs2015; Mortensen and Smith, Reference Mortensen and Smith2020; Socolar et al., Reference Socolar, Goldstein, de Valpine and Bowles2021). Between 2002 and 2020, U.S. corn and soybean acreage plantings increased by 12 and 18%, respectively (Vaiknoras and Hubbs, Reference Vaiknoras and Hubbs2023). The U.S. Corn Belt region has seen similarly dramatic shifts over the last 20 years (Fausti, Reference Fausti2015; Johnston, Reference Johnston2014). In parts of the United States, corn and soybean acreages increased at the expense of cotton plantings and hay land during the first decade of the twenty-first century (Wallander et al., Reference Wallander, Claassen and Nickerson2011). Susanto et al. (Reference Susanto, Rosson and Hudson2008) found that corn acreage expansion in the southern United States after 2006 occurred at the expense of other crops such as soybeans, wheat, and cotton, as well as cropland enrolled in the Conservation Reserve Program (CRP), but as noted by Coppess (Reference Coppess2024), over more than a century of soybean planting in the United States, its acreage experienced a near continuous absolute and relative increase. Lin and Henry (Reference Lin and Henry2016) also observed that corn and soybean acreages increased while other crop plantings and grasslands decreased in nine Corn Belt states from 2006 to 2013, and O’Brien et al. (Reference O’Brien, Hatfield, Dold, Kistner-Thomas and Wacha2020) documented similar trends for North and South Dakota.
The increase in U.S. corn acres planted as a proportion of principal crop area planted – referred to here as the increase in corn acreage intensity – has been associated with ethanol production expansion tied to corn price increases (Elobeid et al., Reference Elobeid, Tokgoz, Hayes, Babcock and Hart2007; Lark et al., Reference Lark, Meghan Salmon and Gibbs2015; Lin and Henry, Reference Lin and Henry2016; Smith and Moschini, Reference Smith and Moschini2023; Westcott, Reference Westcott2010). Occurring parallel with the expansion of soybean plantings, additional factors may have contributed to corn acreage intensification, including changes in agronomic and management practices, cost concerns, and socioeconomic aspects (Vaiknoras and Hubbs, Reference Vaiknoras and Hubbs2023).
Corn acreage intensification potentially comprises two components: reduced acres planted to other crops and an increase in total cropland acres devoted to growing crops (Lark et al., Reference Lark, Hendricks, Smith, Pates, Spawn-Lee, Bougie, Booth, Kucharik and Gibbs2022). In the early 2000s, Elobeid et al. (Reference Elobeid, Tokgoz, Hayes, Babcock and Hart2007) predicted an expansion of crops in marginally productive areas and an increase in continuous corn production facilitated by transgenic varieties linked to corn-based ethanol production increases. This was confirmed by Fausti (Reference Fausti2015), who linked ethanol production increases to genetically modified (GM) corn acreage plantings and overall corn acreage plantings across 11 Corn Belt states, but to varying degrees across states. Annan et al. (Reference Annan, Van der Sluis, Fausti and Kolady2022) also tied increased corn acreage plantings to ethanol policies and the use of GM crop varieties in Corn Belt states in two decades since 2000.
This research further explores concomitant factors of corn acreage intensification across Corn Belt states from 2000 to 2021. The study’s main objective is to assess the degree to which corn acreage intensification over the past two decades was affected by external factors, including GM crop adoption, market forces, CRP releases, corn production efficiency improvements, ethanol demand and production infrastructure changes, and scale aspects.
Numerous studies have shown that diverse cropping systems can sustain higher levels of productivity that rely on limited external inputs and give rise to fewer externalities than do simplified systems (Archer et al., Reference Archer, Liebig, Tanaka and Pokharel2020; Bullock, Reference Bullock1992; Davis et al., Reference Davis, Hill, Chase, Johanns, Liebman and Hart2012; Howieson et al., Reference Howieson, O’Hara and Carr2000; Karlen et al., Reference Karlen, Hurley, Andrews, Cambardella, Meek, Duffy and Mallarino2006; Smith et al., Reference Smith, Neil Harker, O’Donovan, Kelly Turkington, Blackshaw, Lupwayi, Johnson, Pageau, Shirtliffe, Gulden, Hall, Willenborg and Beres2008, Reference Smith, Gross and Robertson2018; Weisberger et al., Reference Weisberger, Nichols and Liebman2019). Complex cropping systems also provide better buffers against weather extremes linked to climate change than simple ones (Bommarco et al., Reference Bommarco, Kleijn and Potts2013; Bowles et al., Reference Bowles, Mooshammer, Socolar, Calderón, Cavigelli, Culman, Deen, Drury, Garcia y Garcia, Gaudin, Harkcom, Lehman, Osborne, Robertson, Salerno, Schmer, Strock and Grandy2020; Gaudin et al., Reference Gaudin, Tolhurst, Ker, Janovicek, Tortora, Martin and Deen2015; Liu et al., Reference Liu, Plaza-Bonilla, Coulter, Kutcher, Beckie, Wang, Floc’h, Hamel, Siddique, Li, Gan, Liu, Plaza-Bonilla, Coulter, Kutcher, Beckie, Wang, Floc’h, Hamel, Siddique, Li and Gan2022; Williams et al., Reference Williams, Hunter, Kammerer, Kane, Jordan, Mortensen, Smith, Snapp and Davis2016). Thus, findings of this research are expected to be of interest to both agricultural producers and policymakers as they consider economic, environmental, and sustainability implications of the national trend toward simplified cropping systems.
Possible sources of corn acreage intensification
Between 2000 and 2020, the area planted to corn and soybeans in the United States increased from 79.6 million acres and 74.3 million acres to 90.8 million and 83.1 million acres, respectively, while the acreage of other crops traditionally included in rotation strategies decreased from 174.9 million to 136.2 million acres (Fig. 1). This corresponds with increases of 14.2% and 11.9% of corn and soybean acres, respectively, while other crop acres declined by 22.1% in the United States over the same period (National Agricultural Statistics Service, 2021).
U.S. Cropping pattern changes from 2000 to 2020.
Source: Authors compiled using data from NASS. https://quickstats.nass.usda.gov/.

GMO seed adoption
GM crop varieties have become widely adopted in the United States since their introduction for use in agricultural production in the 1990s. For each of the three most important GM crop varieties in the United States (corn, soybeans, and cotton) GM acres planted account for well over 90% of total crop area in 2023 (Dodson, Reference Dodson2023). Agricultural producers rely on GM crop varieties to maintain pest control, reduce their labor input, and increase overall output, thus reducing input and output uncertainty and increasing net economic benefits (Benbrook, Reference Benbrook2012; Brester et al., Reference Brester, Atwood, Watts and Kawalski2019; Brookes and Barfoot, Reference Brookes and Barfoot2018; Cattaneo et al., Reference Cattaneo, Yafuso, Schmidt, Huang, Rahman, Olson, Ellers-Kirk, Orr, Marsh, Antilla, Dutilleul and Carrière2006; Fernandez-Cornejo et al., Reference Fernandez-Cornejo, Wechsler, Livingston and Mitchell2014). The process of adopting GM crops is largely irreversible because the benefits flow from the investments in the technology (for example, in the form of time savings resulting in managerial and farm family adjustments), while the costs are sunk (for example, in the form of learning and experimentation, transactions, machinery, and technological investments) (Beckmann et al., Reference Beckmann, Soregaroli and Wesseler2010; Scandizzo and Savastano, Reference Scandizzo and Savastano2010; Wesseler and Zhao, Reference Wesseler and Zhao2019). Due to broadly overlapping adoption patterns since the 1990s, we include the spread of GM soybeans – as a proxy for GM corn – as a possible factor contributing to corn acreage intensification in the 11 Corn Belt states analyzed over more than two decades. Due to their relatively rapid adoption following their introduction, any observable relationship between the spread of GM crops and corn acreage intensification was likely more pronounced in the first decade of the period of analysis than in subsequent years.
Corn and soybean markets
In addition to the spread of GM crops, Claassen et al. (Reference Claassen, Carriazo and Ueda2010) documented that agricultural producers have increasingly responded directly to market signals, policy incentives, and technological changes following agricultural policy changes of the late 1990s. Figure 2 shows U.S. commodity price changes from 2000 to 2020 for three common crops in the Corn Belt: corn, soybeans, and wheat. Between 2000 and 2012, prices of all three commodities rose to then-historically high levels, but subsequently fell. Even in the face of large annual and seasonal variations, U.S. corn prices rose from $1.85 to $4.30 per bushel (132%), while soybean prices increased from $4.54 to $11.15 per bushel (146%) between 2000 and 2020 (National Agricultural Statistics Service, 2021). Thus, any analysis of factors tied to cropping pattern changes over time must include commodity price changes. Because our focus is on corn acreage intensification, we consider the average price of corn and soybeans. Considering that the previous year’s crop prices reflect expectations about future market conditions (including the stocks-to-use ratio, a widely used used price predictor), they influence crop planting decisions (Westcott and Hoffman, Reference Westcott and Hoffman1999). We utilize a one-year lag of the average of the corn and soybean price (the sum of annual corn price plus the annual soybean price divided by two) to capture market forces, which we expect to influence corn acreage intensity positively.Footnote 1
U.S. commodity prices movement from 2000 to 2020.
Source: Authors compiled using data from NASS. https://quickstats.nass.usda.gov/.

Corn ethanol industry
Following the ban on methyl tertiary butyl ether as a fuel additive in the early 2000s, ethanol was used in its place as an oxygenate, leading to a large increase in the demand for corn as its fuel stock (Solomon et al., Reference Solomon, Barnes and Halvorsen2007). Two subsequent energy policy changes that directly boosted the demand for ethanol and the derived demand for corn were the 2005 Energy Policy Act (EPA) and the 2007 Energy Independence and Security Act (EISA), which established Renewable Fuel Standards (RFS) that mandated blending ethanol into transportation fuel. The 2005 EPA mandate was to blend ethanol with gasoline annually through 2012, while the 2007 EISA extended it through 2022 (Renewable Fuels Association, 2023). Consequently, corn-based ethanol became a major fuel source in the United States over past decades, with an annual maximum usage of 15 billion gallons through 2022 (Bracmort, Reference Bracmort2022).Footnote 2 Overall, between 2000 and 2020, the share of corn produced and used for ethanol fuel production in the United States increased from about 6% to nearly 34%, with much of the increase occurring prior to 2013 (Williams, Reference Williams2023).
The RFS policy changed the supply of ethanol-blended gasoline and influenced production costs, commodity prices, and cropland usage (Austin et al., Reference Austin, Jones and Clark2022, Reference Austin, Jones and Clark2023; Hanon, Reference Hanon2014; Lark et al., Reference Lark, Hendricks, Smith, Pates, Spawn-Lee, Bougie, Booth, Kucharik and Gibbs2022; Roberts and Schlenker, Reference Roberts and Schlenker2009; Vo, Reference Vo2020). Changes in cropland usage were particularly pronounced near ethanol refineries (Li et al., Reference Li, Miao and Khanna2019; Motamed et al., Reference Motamed, McPhail and Williams2016; Stevens, Reference Stevens2015, Reference Stevens2021). Ceteris paribus, the additional demand for corn due to biofuel policy changes of the early 2000s would increase corn prices and be expected to contribute to corn acreage intensification.
CRP adoption practices
Cropland conservation acreage reductions are also expected to affect cropping patterns. The most important U.S. conservation program is the CRP, which enables farmers to retire environmentally sensitive cropland using 10 to 15 year contracts in exchange for annual rental payments and taking steps to improve the land’s health (Farm Service Agency, 2024). During times of high commodity prices, CRP acreage releases can have a significant role in land use shifts (Hendricks and Er, Reference Hendricks and Er2018; Ifft et al., Reference Ifft, Rajagopal and Weldzuis2019; Janssen et al., Reference Janssen, Klein, Taylor and Opoku2008; Secchi and Babcock, Reference Secchi and Babcock2015). While previous studies have linked CRP and grassland losses to row crop acreage increases and environmental quality reductions (Alemu et al., Reference Alemu, Henebry and Melesse2020; Bigelow et al., Reference Bigelow, Claassen, Hellerstein, Breneman, Williams and You2020; Chen and Khanna, Reference Chen and Khanna2018; Morefield et al., Reference Morefield, LeDuc, Clark and Iovanna2016; Zhang et al., Reference Zhang, Lark, Clark, Yuan and LeDuc2021), the emphasis of this research is on identifying factors contributing to cropping pattern changes. While Arora and Wolter (Reference Arora and Wolter2018) argued that the origins of cropland conversions and cropping pattern changes are unclear, other authors ascribe the increase in corn and soybean acreage to converting CRP land toward crop production (Johnston, Reference Johnston2014; Wimberly et al., Reference Wimberly, Janssen, Hennessy, Luri, Chowdhury and Feng2017). Yet others attribute it to the conversion of marginal grasslands (Lark et al., Reference Lark, Meghan Salmon and Gibbs2015; Wright and Wimberly, Reference Wright and Wimberly2013), and the development of biofuels (Lark et al., Reference Lark, Hendricks, Smith, Pates, Spawn-Lee, Bougie, Booth, Kucharik and Gibbs2022; Wang and Khanna, Reference Wang and Khanna2023). As cropland is released from the CRP and turned into crop production, an expected disproportionate share may be used for corn production, thus increasing corn acreage intensity.
Farm size and productivity
Between 2000 and 2020, average U.S. farm size increased from 436 acres to 448 acres (National Agricultural Statistics Service, 2023). While the increase is modest, MacDonald and Hoppe (Reference MacDonald and Hoppe2017) show large shifts of cropland being farmed by large operations over the past two decades, based on Census data.Footnote 3 Also, various studies have found significant scale and scope economies in U.S. agriculture during different time periods (Halloran and Archer, Reference Halloran and Archer2008; Langemeier and Boehlje, Reference Langemeier and Boehlje2017; Paul et al., Reference Paul, Nehring, Banker and Somwaru2004). Furthermore, farm program payments tend to be concentrated among the largest farms and may have contributed to scale enlargement and consolidation among farm operations and in turn affects cropping systems (Bekkerman et al., Reference Bekkerman, Belasco, Smith and McIntosh2019; Just and Schmitz, Reference Just and Schmitz1988; MacDonald and Hoppe, Reference MacDonald and Hoppe2017; MacDonald et al., Reference MacDonald, Korb and Hoppe2013). To capture scale factors in crop production we consider acres farmed per operation, expected to be positively associated with corn acreage intensification.
Lastly, to account for productivity increases over the two decades of analysis, we include a variable that seeks to approximate total factor productivity (TFP), which provides an indicator of how efficiently agricultural inputs are used to produce outputs (Wang et al., Reference Wang, Heisey, Schimmelpfennig and Ball2015). Because no state-level TFP data for years after 2014 exist, we utilize a productivity variable, expressed in bushels per dollar of production expenses. Accordingly, we predict that productivity is positively associated with corn acreage intensity.Footnote 4
Data
Annual data pertaining to 11 Corn Belt states – Iowa, Illinois, Indiana, Nebraska, Kansas, Michigan, Minnesota, Missouri, Ohio, South Dakota, and Wisconsin – were collected for the period from 2000 through 2021, yielding a total of 242 observations.Footnote 5 , Footnote 6 Similar to preceding years, the 11 Corn Belt states accounted for 80% of corn planted acres in 2022.Footnote 7 These contiguous states comprised the 11 largest corn-producing states and partially overlap with the Corn Belt region over the past two decades.Footnote 8 Table 1 provides a description of the variables used and their data sources. All data were obtained from National Agricultural Statistics Service (2023), except for GM crop varieties, CRP and ethanol production data, which were obtained from the Economic Research Service (2023a), Farm Service Agency (2023), and U.S. Energy Information Administration (2023), respectively. For the productivity variable, corn yield data were taken from National Agricultural Statistics Service (2023) and production cost data from the Economic Research Service (2023b) commodity cost and returns schedule. In accordance with the literature, nominal crop prices and nominal production costs data used in this study are deflated by the 2017 U.S. implicit GDP deflator from the U.S. Bureau of Economic Analysis (2023).Footnote 9
Variable definitions and data sources, state-level observations

Table 2 lists descriptive statistics of the variables used in the analysis. The mean of corn acreage intensity (CAI) suggests that the average corn acres planted as a proportion of total acreage of principal crops was approximately 39% in the 11 Corn Belt states over the 22 years of analysis, varying from about 13 to 58%. Average GM soybean acres planted as a share of total soybean acres planted was 88% and varied between 44 and 98%. Ethanol production varied from zero to 104 thousand barrels per year. The CRP variable had a mean of 1.04 million CRP acres and varied between 0.11 and 3.26 million acres. Assuming the CRP enrollment decision involves long-term strategic planning, it may not be affected by other potential confounders. In considering farm size for explaining corn acreage intensity, we define the farm size variable as simply the number of acres per farm operation (in hundreds), with a mean of 480 acres, and varying between 175 acres and 1,469 acres. Finally, to account for productivity increases over the two decades, the productivity measure averaged 0.26 bushels per dollar of expenditure with a range of 0.11 to 0.38 over the analysis period.
Descriptive statistics of the main variables (2000 to 2021)

Note: all variables indicated with an asterisk (*) are directly included in the model specifications section. The highest planted acres of 14.2 million acres corresponds to Iowa in 2007. All prices and expenditures are converted to real dollars using the 2017 U.S. implicit GDP deflator.
Table 3 lists the Pearson correlation matrix, which shows the bivariate correlations between the predictors. To determine the influence of multicollinearity on the estimated standard errors, we estimated variance inflation factors (VIF) for all covariates. All covariate VIF estimates are less than 0.5, except in two instances. Even without satisfying this condition, multicollinearity can be safely disregarded if the colinear variables are control variables (Allison, Reference Allison2012). Initial information based on the correlation coefficients suggests that the ethanol production, CRP, and size variables may serve as possible predictors of corn acreage intensification.
Correlation matrix of main variables in this study (2000 to 2021)

Methodology
Because corn production is made up of both GM and non-GM varieties, using GM corn as a covariate could cause endogeneity problems. Therefore, we applied a fixed effects instrumental variable (FE-IV) approach to estimate the fixed effects, using GM soy as instrument for GM corn. This provides a better method for identification than the usual fixed effects or mixed models, although the latter two approaches are also preferred when their model assumptions are met.Footnote 10
The FE-IV model specification is given in equation (1) below.
 $$CAI_{it}=\beta _{0}+\beta _{1}CRP_{it}+\beta _{2}\textit{GMCor}n_{it}+\beta _{3}X_{it}+\beta _{4}Trend_{it}+\mu _{i}+\varepsilon _{it},$$
where β s are parameters to be estimated and CAI it is corn acreage intensity (defined as the ratio of corn acres planted to principal crop area planted) in state i at time t. The terms CRP it and GMCorn it (with the GM soy as an instrument) are the main variables of interest, which are CRP acres released and GM corn acres in state i at time t, respectively. Vector X it denotes additional variables including ethanol production, the average of the corn and soybean price, productivity, and farm size in each state over the period of the analysis. Except for farm size, the additional predictors are all expressed as their first lags. The terms Trend it , μ i and ε it are the state time trends, and the state fixed effect and idiosyncratic error terms, respectively. The fixed effect error term captures unobserved state-level and time-invariant heterogeneity affecting corn acreage intensity, such as climate, weather, and soil conditions. We used state time trends to capture the overall trend and the yearly variation (potential long-term changes) in the model, because the outcome variable grows linearly over time.Footnote 11 We also used a similar specification that included year-fixed effects terms to account for unobserved heterogeneity across years while controlling for time-specific factors that could influence corn acreage intensity to ensure the robustness of our findings. Our empirical approach contributes to the existing literature on explaining the increasingly dominant role of corn in crop rotations by analyzing previously unexplored variables and using the panel FE-IV model with GM soy as an instrument for GM corn. Aside from running a just identified model with only GM soybean as an instrument, we also ran a similar model with overidentified models that used more than one IV to ensure the robustness of our findings. This procedure provides a formal approach for testing the instruments’ exogeneity (via the Sargan-Hansen test of overidentified instruments) as well as determining their strength.
Equation (1) is the two-stage specification where the predicted values from the first-stage regression in equation (2) are used to estimate the FE-IV model. We used the xtivreg2 package and its command in Stata, which enables estimating both first and second-stage regressions at the same time (rather than manually regressing the two stages separately). The variables in the first-stage regressions are the same as those in equation (1), except for GM corn as the outcome and GM soy as a covariate. Therefore, we do not repeat the explanation of the variables in specification of equation (2).
 $$\textit{GMCorn}_{it}=\beta _{0}+\beta _{1}CRP_{it}+\beta _{2}GMSoy_{it}+\beta _{3}X_{it}+\beta _{4}Trend_{it}+\mu _{i}+\varepsilon _{it}$$
For GM soy to be a good instrument, it must be relevant and exogenous. We tested for the relevance condition by using the results of the first-stage regression and the first-stage F-statistic values. To determine if the instrument is exogenous, we performed a weak exogeneity test by running regressions in equation (1) with GM soy as the response for the first-stage regression. We then used its residuals for GM corn to determine the significance of the residuals in the second-stage regression with corn acreage intensity as the response. Following Wooldridge (Reference Wooldridge2020), if the residuals from the second stage are not significant, then the instrument is exogenous. These conditions are satisfied, suggesting that the GM soy can be used as an instrument for GM corn (see Table 4 and Appendix Table 1A).
Panel fixed effects instrumental variable regressions with genetically modified (GM) soy as an instrument for GM corn (first stage)

Notes: controls included in Models 2 and 4 are average crop price, ethanol production, productivity, and farm size per operation; all the controls are used as their first lags except for the size variable; robust standard errors (in parentheses) are at the state level to account for serial correlation and state-level heterogeneity; and ***, **, and * indicate significance at 0.01, 0.05, and 0.10 levels, respectively. The models use similar assessment criteria to those in Table 5 because we estimated the two steps simultaneously. Although the AIC and BIC measures do not differ much, they all indicate that the models must account for year effects.
Panel fixed effects instrumental variable regressions with genetically modified (GM) soy as an instrument for GM corn (second stage)

Notes: controls added to Models 2 and 4 are average crop price, ethanol production (in 100,000 barrels), productivity, and farm size per operation. All controls are in their first lags except for the farm size variable. All F-statistic values show that the instrument passed the weak identification test, indicating that the instrument has excellent power. Robust standard errors in parentheses; and ***, and ** indicate significance at 0.01 and 0.05 levels, respectively.
We estimated four alternative models to capture differences by state using the panel FE-IV models. The baseline models (Models 1 and 3) without any controls include the specification of equation (1) with and without the year trend. Models 2 and 4 include the additional predictors (ethanol production, the corn and soybean price average, productivity, and farm size). The GM crop variables capture the supply-side effect of biotechnology on corn production, and the ethanol variable reflects the ethanol demand and its production infrastructure, encouraged through renewable fuels policies. While the spatial measurement error or heterogeneity in our estimation technique could be a possible source of concern, our panel FE-IV models provide a preferred identification strategy with the data at hand. The state fixed effects and the robust standard errors at the state level help mitigate potential biases caused by possible spatial heterogeneity.Footnote 12 Another possible concern is that some of the controls, such as ethanol production, could have a bi-directional relationship with corn acreage intensity, but we consider these effects of relatively minor importance because we used the first lags of the controls. Tests for the endogeneity of lagged ethanol production indicate that the variable is exogenous (see Appendix Table 1B).
Empirical results and discussion
Table 4 reports the first-stage regressions where GM corn is regressed on the instrument and the other covariates as specified in equation (2). The strongly positive relationship between GM corn and the instrument (the GM soy variable) suggests that the instrument is highly relevant, as further confirmed by the first-stage F-statistic values (P-value <0.01) in all models (see Tables 4 and 5). Also, when using GM soy as the response in the first-stage regressions, the residuals from the second-stage regressions showed that the residuals are not statistically significant in any of the models at the 5% significance level. This suggests that the instrument passed the weakly exogenous test as well (see Appendix Table 1A).Footnote 13 ln Table 4, the statistically significant relationship between GM corn and the instrument (GM soy) in all models indicates that GM soybean adoption is positively associated with GM corn. Also, in line with expectations, the results of Models 3-4 indicate that CRP acreage releases are positively associated with GM crop acreage. Model 1 has the reverse sign and is statistically significant because we did not control for year variations and did not include any additional variables in the model.Footnote 14
Table 5 lists the second-stage results of the four models using the FE-IV method. Given that the results in Table 4 suggest a specification bias associated with the other models (1-3), we focus on Model 4 reported in Table 5. The panel FE-IV parameter estimates for the CRP, lagged average of the corn and soybean prices, lagged ethanol production, lagged productivity, farm size, and GM corn variables have the expected signs and are statistically significant at the 5% level or lower. Empirical results suggest that an increase in cropland enrolled in CRP reduced corn acreage intensity, while an increase in the GM corn adoption increased corn acreage intensity, holding other factors constant.Footnote 15 For the controls, an increase in the lagged average corn-soybean price, ethanol production, farm size, and corn productivity each had a positive effect on corn acreage intensity relative to its state-specific trend in the Corn Belt region over the period of analysis.
The positive coefficients of the lagged price variable suggest that market forces provided strong incentives for farmers to increase their corn plantings. Because farm size serves as a proxy for economies of scale effects on corn acreage intensity, we hypothesize that market signals disproportionately increase economic incentives for large operations to focus on corn production, given capital-intensive input investments. Also, the positive coefficient of the lagged ethanol production variable suggests that growing ethanol demand incentivized ethanol firms to increase production. The results suggest that increased ethanol production is empirically associated with increased corn acreage intensity. Furthermore, the positive coefficient of the GM corn variable suggests that the nearly complete adoption of genetically modified varieties contributed to corn acreage intensification over time in the region.
Drawing a direct connection between expiring CRP acres and corn acreage intensification is novel to the literature. The negative CRP coefficient indicates that as cropland was converted from CRP to crop production, corn acreage intensified in the 11 Corn Belt states. In particular, the empirical results show that for every million acres released from the CRP and turned into cropland, there is a corresponding 5.1% increase in corn acreage intensity. This result remains robust after accounting for other time-specific factors that may affect the model using year-fixed effects (see Appendix Table 1C). Furthermore, the results are robust for the overidentified models with more than one IV (see Appendix Table 1D). This suggests that a disproportionate share of the released of CRP acres was planted to corn, relative to other grain and oil seed crops. The literature has discussed the decline in CRP enrollments, with broad trends documented by Johnston (Reference Johnston2014), Wimberly et al. (Reference Wimberly, Janssen, Hennessy, Luri, Chowdhury and Feng2017), and O’Brien et al. (Reference O’Brien, Hatfield, Dold, Kistner-Thomas and Wacha2020). A key contribution to the literature of the current study is presenting empirical evidence that quantifies the relationship between the release of CRP acres and corn acreage intensification.
While the panel FE-IV parameter estimates for Model 4 reported in Table 5 are statistically significant and the estimated coefficients are consistent with hypothesized relationships, additional insight on the relevance of the covariates to CAI is now addressed. Model 4A provides estimated standardized beta coefficients for each of the covariates in Model 4. Standardized beta coefficients provide insights on the influence of each covariate on CAI variability (Bring, Reference Bring1994).Footnote 16
The interpretation of the GM corn standardized beta coefficient of 0.167 suggests a one standard deviation change in GM corn is associated with a 0.167 standard deviation increase in the predicted value of CAI. In a more intuitive sense, we can now estimate the increase in CAI variability effects by multiplying the standardized beta coefficients by the CAI standard deviation. Using the standard deviation from the summary statistics estimates of Table 2 (with a 0.112 standard deviation for CAI), a one standard deviation increase in GM corn is linked to a 1.9% increase in CAI. Similarly, using the CRP estimate of -0.326 suggests that one standard deviation increase in CRP releases to cropland is associated with a CAI increase of 3.7%. For the other control variables, the lagged ethanol production standardized beta coefficient of 0.085 indicates that increasing ethanol production by one standard deviation was associated with a 1.0% increase in corn acreage intensity in the Corn Belt region. Analogously, based on the standardized beta estimate of 0.071 for the first lag of the average crop price, a one standard deviation increase in the average corn price per bushel is linked to 0.8% increase in corn acreage intensification. Following the same logic, based on the standardized beta coefficient estimate of 0.064 of corn productivity, a one standard deviation increase in corn productivity is linked to a 0.7% increase in corn acreage intensity relative to its state-specific trend. Finally, using the standardized beta coefficient of 1.254 for the farm size covariate suggests that an increase in the standard deviation of average farm size acres is associated with a 1.254 standard deviation increase in the predicted value of corn acreage intensification. This change results in a 14% increase in corn acreage intensity, holding other factors constant. This exceptionally large scale effect may be the result of large operations further specializing in corn production in response to market signals, but this result warrants the need for additional study.
The literature suggests that rapid increases in ethanol production and GM technology adoption since the turn of the 21st century were the primary drivers of the increase in the dominance of corn relative to other grain and oil seed crops in the United States (e.g., Fausti (Reference Fausti2015); and Mumm et al. (Reference Mumm, Goldsmith, Rausch and Stein2014)). The empirical evidence presented here suggests that while ethanol and GM seed technology made significant contributions to corn acreage intensification during this time period, other economic factors – in particular, changes in CRP enrollment, productivity improvements, and scale effects – also played a significant role but have not been highlighted in the literature.
Summary and conclusions
This study addresses factors affecting cropping pattern changes at the state level in the Corn Belt region by exploring the influence of cropland released from CRP, changes in the average corn-soybean price, the rapid increase in ethanol production resulting from the enactment of the renewable fuel laws in the early 2000s, the spread of GM Corn adoption, productivity increases, and farm size as economic factors that affect corn acreage intensification. Using state-level data of 11 Corn Belt states from 2000 to 2021, we applied a panel FE-IV approach to investigate these linkages. Results indicate that state-level corn acreage intensities are positively impacted by CRP cropland releases, the one-year lag of the average of corn and soybean prices, the increase in ethanol production, productivity, average farm size, and the spread of GM crops.
Our empirical evidence suggests that while ethanol and GM seed technology contributed significantly to the increase in acreage intensity during this period, other economic factors not discussed in the literature also played a significant role – including changes in CRP enrollment, productivity gains, and economies of scale. Thus, this study makes an important contribution to the existing literature by demonstrating that changes in cropland usage are not solely, and not necessarily directly, attributable to increases in biofuel production and GM seed adoption. Our study sheds light on a mix of factors linked to corn acreage intensification within the Corn Belt region. The findings elucidate the well-documented changes in cropping patterns involving loss of acreage of small grains and marginal areas in favor of corn and soybeans. The findings of the study are expected to raise awareness among policymakers and agricultural producers about changing cropping patterns and their implications for long-term sustainability, enabling them to make more informed policy decisions.
A caveat of this study is that state-level analyses mask disparities in land use within one state and thus for the Corn Belt region overall. While a county-level analysis could solve some of the bias due to spatial measurement errors, impediments to conducting county-level analysis include lack of meaningful and reliable estimates of prices, genetically modified corn and soybean adoption rates, and ethanol production. Nevertheless, a consideration for further research is to investigate whether elements of our analysis can be disaggregated to the county level. One useful line of research at the county level is to obtain spatial data and use spatial fixed effects models to directly address spatial spillover issues. Another area worth exploring is the use of nonlinear models to further investigate the factors contributing to changes in cropland usage.
Data availability
The data that support the findings of this study are available from the corresponding author, Evert Van der Sluis, upon reasonable request.
Acknowledgements
This research was made possible by the South Dakota Experiment Station, Project SD00H674-19.
Competing interests
Kenneth Annan, Evert Van der Sluis, Scott W. Fausti, and Deepthi E. Kolady declare none.
Appendix
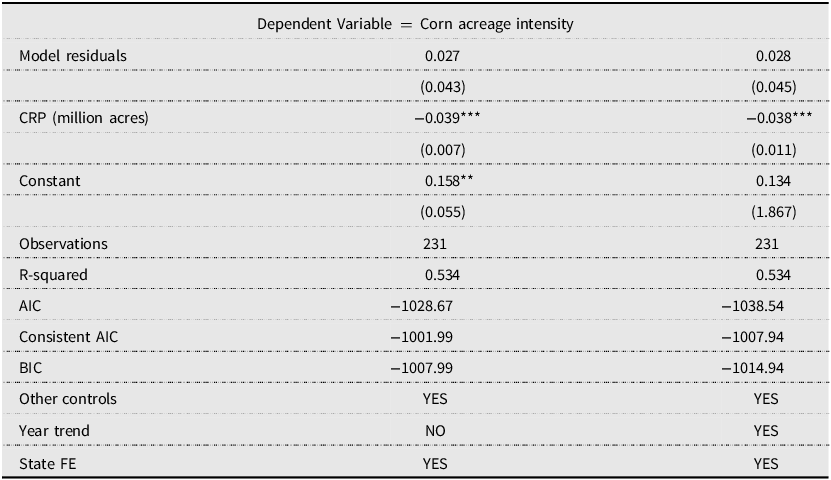
Panel fixed effects endogeneity test of the instrument (second-stage results)

Notes: We regress the instrument on all covariates including genetically modified (GM) corn in the first-stage regression, and then use its residuals for GM soy in the second-stage regression (including the instrument) – see (Wooldridge, Reference Wooldridge2020) although we use panel data. The other controls added to Models 2 and 4 are average crop price, ethanol production (100,000 barrels), productivity, and average farm size. All controls are in their first lags except for the average farm size variable. Robust standard errors in parentheses; and ***, **, and * indicate significance at 0.01, 0.05, and 0.10 levels, respectively. Model 3 outperforms model 1 based on the consistent AIC, as does Model 4 over Model 2.
Panel fixed effects endogeneity test of the lag ethanol (second-stage results)
Notes: We regress lagged ethanol on all the covariates including ethanol in the first-stage regression, and then use the residuals from the first stage for lag ethanol in the second-stage regression (including the lagged ethanol) – see (Wooldridge, Reference Wooldridge2020) although we use panel data. The other controls added in Models are average crop price, ethanol production (100,000 barrels), productivity, genetically modified soy, and farm acres per operation. All the controls are in their first lags except the scale variable. Robust standard errors in parentheses; and ***, **, and * indicate significance at 0.01, 0.05, and 0.10 levels, respectively.
Panel fixed effects instrumental variable regressions with genetically modified (GM) soy as an instrument for GM corn

Notes: Because we included year-fixed effects, GM soy is used as an instrument instead of its lag. The instrument for the year trend models is stronger than the year-fixed effects model, so the latter model reduces the significance of GM corn. Despite this, our primary variable of interest (the CRP) remains robust. The regression used all covariates in Model 4. Robust standard errors in parentheses; and *** indicates significance at the 0.01 level.
Panel fixed effects instrumental variable regressions with more than one instrument for genetically modified (GM) corn (second stage)

Notes: Models 5 and 5A employ the GM soybean and the first lag of December corn stock as instrumental variables (IVs) for GM corn. Similarly, Models 6 and 6A use the GM soybean and the first lag of corn yield as IVs for GM corn, while Models 7 and 7A use all three variables as IVs. The Sargan - Hansen test for overidentified instruments shows that we fail to reject the joint null hypothesis that the instruments are exogenous in all models, implying that the instruments are extremely exogenous. The F-statistic values indicate that the instruments are not weak, but rather very strong. Model 5A (with GM corn and the first lag of corn stock as IVs) has the lowest AICs and BICs, indicating that the model fits the data better than the other models (though the AICs are fairly similar). The results are very consistent with those in Model 4, with only one IV. Robust standard errors in parentheses; and ***, **, and * indicate significance at 0.01, 0.05, and 0.10 levels, respectively.
Overall summary statistics aggregated by mean across the 11 states (2000–2021)

Notes: The values corresponding to each state represent the average value of each state. Over the study time - period, the 11 Corn Belt states accounted for about 80% of corn planted acres in the U.S. (which is consistent with those in 2022 and other years). Iowa has the highest proportion of corn acreage coverage of about 15% and followed by Illinois.


 Open access