


INTRODUCTION
Radiocarbon (14C) analysis of sequential tree-ring segments (wiggle-matching) provides a precise method for dating archaeological material in situations where low sample depth, growth complacency, or the lack of temporally overlapping master-dating series limits the application of ring-width based dendrochronological methods. Wiggle-matching refers to a Bayesian calibration procedure that fits a sequence of 14C dates separated by absolutely known time gaps to the shape of the 14C calibration curve (Bronk Ramsey et al. Reference Bronk Ramsey, van der Plicht and Weninger2001). When applied to tree-ring series, this technique takes advantage of the fact that many temperate tree species grow in annual increments and thus their wood is an archive of historic interannual variability in atmospheric 14C. Unlike a dendrochronological date, which is a single calendar year, the date determined by a wiggle-match model will be in the form of a posterior density distribution. Nonetheless, a wiggle-matched date can be interpreted in a similar manner to a dendrochronologically determined date. For example, if the bark or waney edge is present, the date of the outermost ring will represent the final year of growth—often referred to as a cutting date. If outer rings are missing, however, the dated ring represents a terminus post quem (TPQ) for the final year of growth—or a non-cutting date.
Wiggle-matching will likely continue to grow in importance in archaeological science as researchers increasingly turn to historical questions that resolve to temporal scales of a human generation or less (Bayliss Reference Bayliss2009; Bayliss et al. Reference Bayliss, Marshall, Dee, Friedrich, Heaton and Wacker2020; Whittle et al. Reference Whittle, Bayliss and Healy2010). Recently, increases in data availability and statistical methods enable higher resolution dates based on annual sequences and create new opportunities for chronometric insight (van der Plicht et al. Reference van der Plicht, Bronk Ramsey, Heaton, Scott and Talamo2020). However, if the full potential of the method is to be realized, certain problematic aspects of dating archaeological wood must be dealt with. Charcoal samples from archaeological structures are often recovered as fragments and lack outermost rings. As discussed in more detail below, solutions to these problems require an indication of the sapwood-heartwood boundary which is problematic in charcoal. While normally avoided for single age determinations, charcoal fragments with many rings are valuable specimens for wiggle-matching. Dates on such material generally only provide a TPQ and the time gap, or disparity, between tree death and the age of the outermost dated ring must be assumed or inferred by other means, often subjectively.
The potential for age disparities between a wood sample and its archaeological context—sample in-built age or the “old wood problem”—is well described in archaeological chronometry, but methods to objectively correct for it are lacking. The use of dead wood is the classic source of sample in-built age, and current chronometric hygiene approaches for addressing sample in-built age in archaeological 14C studies have mostly focused on avoiding charcoal and detecting large age disparities in datasets. This is despite the fact that charcoal is by far the largest source of datable material directly linked to construction events at most archaeological structures, and material lacking outer rings is often the best or only available material for dendrochronological or 14C dating.
This study analyzes age disparities caused by ring loss and other factors in a dendroarchaeological dataset by calculating the difference between the tree-ring date of charcoal samples lacking a terminal growth ring (non-cutting dates) and the estimated age of their context determined from cutting date clusters. The study provides an objective method to correct non-cutting dates based on the empirical distribution of age disparities in a sample of tree-ring dated, short duration, contexts. Dendroarchaeological theory developed to deal explicitly with date disparities and interpret the large number of tree-ring dates obtained in the southwestern U.S. is adopted to identify the most likely age of contexts aggregated in this study. The interaction of sample characteristics such as tree taxon, tree age, taphonomy, and the cutting cluster itself are explored to determine if these factors are associated with different levels of age disparities. The characteristic age disparity of different sample groups is modeled with a log-normal distribution to produce a hypothetical ring-loss correction for wiggle-matched 14C dates. The age correction model is then evaluated with published data from a chronological study of monumental construction in Mexico. Finally, a simulated sequence with events at intervals of < 20 years dated by wiggle-matches with random age disparities are corrected with the age offset developed in this study. The results suggest that, if the probabilistic age disparity of samples can be modeled, wiggle-matched segments from charcoal lacking outer rings can still accurately date sequences with intervals at the scale of a human generation depending on the particularities of the samples and position on the calibration curve. This is important as archaeologists strive to reconstruct archaeological events—or ruptures in historical sequences—by reconstructing abrupt changes in structured practice (Beck et al. Reference Beck, Bolender, Brown and Earle2007; Bolender Reference Bolender2010). Theoretically, this could improve the vitality and realism of archaeological narratives, but theoretical assumptions about the temporality of the archaeological record has often outpaced the empirical reality (Bailey Reference Bailey1983; Clarke Reference Clarke1973; Lucas Reference Lucas2008; see also comments by Whittle in Beck et al. Reference Beck, Bolender, Brown and Earle2007: 853). In this sense, tools that can broaden the application of high-precision 14C dating techniques have great importance.
Age disparities in 14C and dendrochronological dating
Wood and charcoal from standing buildings, buried structures, and geologic deposits can be dated several ways including tree-ring width pattern matching and isotopic methods. However, wood and charcoal frequently induce significant biases in chronometric analyses that result in age overestimation due to a disassociation between the last year of preserved xylem formation (the dated event) and the time at which the wood was incorporated into an archaeological or natural deposit (Haury Reference Haury1935; Bannister Reference Bannister1962; Waterbolk Reference Waterbolk1971; Schiffer Reference Schiffer1972; Pettitt et al. Reference Pettitt, Davies, Gamble and Richards2003; Blockley and Pinhasi Reference Blockley and Pinhasi2011). A disparity between the dated event for a particular sample and the incorporation of the sample into systemic and archaeological contexts (sensu Schiffer Reference Schiffer1972) emerge from three sources. (1) The procurement and use of dead wood, (2) the recycling of building material from older structures for fuel or construction purposes, and (3) the removal of the terminal growth layer by human tooling or taphonomic processes (Dean Reference Dean1978). The scale of dating anomalies from the first two processes—in-built age from the use/reuse of relict wood—can be on the order of decades to centuries, or even millennia in exceptional cases (Schiffer Reference Schiffer1986; Smiley Reference Smiley1998; Ahlstrom et al. Reference Ahlstrom, Dean and Robinson1991; Kennett et al. Reference Kennett, Ingram, Southon and Wise2002; Allen and Huebert Reference Allen and Huebert2014; Cook and Comstock Reference Cook and Comstock2014). The third process—an age disparity resulting from outermost ring loss—generally results in anomalies on the order of years to decades (Graves Reference Graves1991; Dean and Ravesloot Reference Dean and Ravesloot1993; Nash Reference Nash1997). Stockpiling of timber has been recorded in some pre-industrial contexts and can be thought of as a special case of in-built age with the resulting age disparity being typically less than a decade (Dean Reference Dean1981).
Significant dating anomalies have been attributed to in-built age across the globe, resulting in widespread rejection of legacy 14C dates based on wood charcoal particularly when samples are of uncertain species, tree-age, taphonomic status, and provenience (Spriggs Reference Spriggs1989; Ashmore Reference Ashmore1999; Pettitt et al. Reference Pettitt, Davies, Gamble and Richards2003; Blockey and Fitzpatrick Reference Fitzpatrick2006; David Reference David2008; Nolan Reference Nolan2012; Hart and Nolan Reference Hart and Nolan2015). Some have argued that in-built age errors are less widespread and/or overestimated in the literature (Cook and Comstock Reference Cook and Comstock2014), and some data exist to support this for temperate regions (Kim et al. Reference Kim, Wright, Hwang, Kim and Oh2019). However, the overwhelming evidence for age disparities caused by in-built age has led to the avoidance of wood charcoal for 14C dating as standard practice for archaeologists in the 21st century (for example Price Reference Price2007:228; Renfrew and Bahn Reference Renfrew and Bahn2004:147). Instead, short-lived organisms or residues are strongly favored when matching a 14C dated event to a particular context or human activity (see Hart and Brumbach Reference Hart and Brumbach2005; Taché and Hart Reference Taché and Hart2013; Higham et al. Reference Higham, Douka, Wood, Ramsey, Brock and Basell2014; Gilmore Reference Gilmore2015). However, despite a preference for direct dates on short lived organisms, the prevalence of wood charcoal in both legacy datasets and new collections means that charcoal dates must be incorporated into 14C chronologies at some level. One can only date the material that is available, so whatever is selected should as closely as possible correspond to the archaeological event targeted for analysis (Hamilton and Krus Reference Hamilton and Krus2018; Thompson and Krus Reference Thompson and Krus2018). To this end, Bayesian calibration tools allow analysts to objectively model the effects of in-built age on the timing and duration of past activities given all relevant information (for example Krus et al. Reference Krus, Cook and Hamilton2015), and studies that have applied outlier detection models show that not all (or even a majority of) the charcoal samples are anomalous in stratified sequences (Martin et al. Reference Martin, Coltrain and Codding2017). Even researchers with contrasting conclusions on the validity and reliability of wood charcoal dates agree that direct assays on wooden building material (e.g., support posts or ceiling beams) should provide a reliable estimate for wood procurement and construction (Cook and Comstock Reference Cook and Comstock2014; Hart and Nolan Reference Hart and Nolan2015). Therefore, dates on wooden and charred structural elements remain central evidence for archaeological chronologies.
While in-built age has occupied the literature on archaeological 14C dating, date anomalies caused by outermost ring loss has concerned dendrochronologists to a greater degree. This is because in some cases it is possible to correct for ring loss by various means. In dendrochronology, outer ring loss is inferred by the absence of features characteristic of a terminal growth layer such as: bark, beetle galleries, a contoured waney edge of the living trunk, or an outermost ring preserved around the complete circumference of a cross-section. The loss of outer rings was identified as a problem for associating the dated event with the event of human interest since the beginning of dendroarchaeology (Douglass Reference Douglass1935, Reference Douglass1939; Haury Reference Haury1935). Most attempts to correct for ring loss focus on statistical methods for estimating the number of sapwood rings originally present. For example, oaks (Quercus spp.), and some conifer species have a predictable sapwood width that varies proportionally to the age of tree or the width of heartwood rings (Dean and Holstein Reference Holstein1980; Robinson and Ahlstrom Reference Robinson and Ahlstrom1980; Dean and Ravesloot Reference Dean and Ravesloot1993; Nash Reference Nash1997; Haneca and Debonne Reference Haneca and Debonne2012; Sohar et al. Reference Sohar, Adomas and Läänelaid2012; Bleicher et al. Reference Bleicher, Walder, Gut and Bolliger2020). Sapwood estimation requires the presence of a regular and clearly identifiable heartwood-sapwood transition. Not all tree species have regular heart-sapwood transitions, and many times sapwood is not preserved at all. Data from the Laboratory of Tree-Ring Research at the University of Arizona, Tucson show that tree-ring samples from archaeological contexts are usually preserved in a charred state if not subjected to an arid or anoxic environment (Towner Reference Towner2015). In conifers and many hardwoods, the sapwood-heartwood boundary is identified by a change in color of the xylem which pyrolysis completely obscures (Kabukcu Reference Kabukcu2018). Additionally, many buried archaeological samples lack all their original heartwood rings. For oaks these caveats are less limiting. Recent research suggests that the number of sapwood rings can be estimated from the mean width of only the outermost heartwood rings (Bleicher et al. Reference Bleicher, Walder, Gut and Bolliger2020), and the presence of sapwood in oak charcoal can be inferred by the quantification of tyloses abundance (Dufraisse et al. Reference Dufraisse, Coubray, Girardclos, Dupin and Lemoine2018). These advances however, do not address the problem of missing rings in conifers which is the focus of the present study.
MATERIAL AND METHODS
This study proposes that: (1) date disparities for conifer wood types subjected to deterioration in archaeological context have characteristic distributions, and that (2) statistical functions describing the expected age disparity for a sample, referred to here as an age offset function, can be used to correct TPQ dates from tree-ring specimens. The tree-ring date database used in the study consists of charred wood and charcoal recovered from buried proveniences at similar archaeological contexts from the southwestern U.S. A data summary from all archaeological contexts assembled in this study is available in Supplementary Materials (Supplement 1), as is the complete dataset of all non-cutting dates (Supplement 2). The age disparity between samples lacking the terminal growth ring and their dated context is calculated based on dendroarchaeological theory informing the interpretation of tree-ring date clusters. The significance of various factors on the calculated age disparity including tree species, tree age, sample condition, and the duration of tree procurement represented in the cutting date cluster, were assessed in a stepwise manner to partition subgroups of samples with distinct age offset distributions. Statistical functions were then fit to the distribution of age disparities from each sample subgroup. Key aspects of this analysis including stepwise partitioning, fitting of probability density functions, goodness-of-fit-tests, and figure plotting can be replicated using the R script provided in Supplementary Materials (Supplement 3). The advantage of using a parametric function to describe expected age disparity by sample groups is that it allows the easy correction of 14C dates in the calibration program OxCal. Practical examples of the application of the taphonomic age offset functions to wiggle-match calibration models are discussed below and are also provided in Supplementary Materials (Supplement 4 and Supplement 5A and Supplement 5B).
Tree-Ring Data
A dataset of 703 cutting dates and 729 non-cutting dates from 85 contexts at 50 archaeological sites (see Supplement 1 for complete summary of dataset) from the Mesa Verde region of the southwestern U.S. was assembled from a database of tree-ring dates on file at the Laboratory of Tree-Ring Research at the University of Arizona (Figure 1). Archaeological sites well-known in the regional literature contribute tree-ring dates for the analysis including; 5LP2164 (Morris 25), 5MT23 (Grass Mesa), 5MT2108 (Lowry-Ackman Group), 5MT2831 (Morris 33), 5MT3868 (Duckfoot Site), 5MT4725 (McPhee Village), and MV1626 (Badger House Group) (see Adams Reference Adams1983; Adler and Wilshusen Reference Adler and Wilshusen1990; Kohler and Higgins Reference Kohler and Higgins2016; Kohler and Mathews Reference Kohler and Matthews1988; Pierce Reference Pierce2005; Martin Reference Martin1938; Morris Reference Morris1937; Schachner Reference Schachner2010; Wilshusen Reference Wilshusen1986; Wilshusen and Blinman Reference Wilshusen and Blinman1992; Wilshusen and Ortman Reference Wilshusen and Ortman1999; Wilshusen and Van Dyke Reference Wilshusen and Van Dyke2006; Wilshusen et al. Reference Wilshusen, Schachner and Allison2012). As detailed in later sections, tree-ring specimens come from four conifer species, and the samples range in size from charcoal fragments to portions of large beams with intact cross-sections, and specimens contain from 28 to 383 growth rings with an average of 115. Dated timbers providing dates for this study were excavated from pit structures, jacal (wattle and daub), and masonry rooms dating from ca. AD 500—1200 and are culturally affiliated with the Basketmaker III (BMIII) though Pueblo III (PII) periods in regional history. The appearance of substantial pit structures—or subterranean dwellings, communal buildings, and ritual structures (Cameron Reference Cameron1990; Kohler and Higgins Reference Kohler and Higgins2016)—marks the onset of the BMIII period around AD 500 in the Mesa Verde area. Toward the end of the BMIII period, and into the Pueblo I (PI) period, pit architecture is supplemented by surface rooms made from jacal, and later by more permanent masonry structures, around ca. 1000 AD with pit structures assuming more ritual uses (McGuire and Schiffer Reference McGuire and Schiffer1983; Wilshusen Reference Wilshusen1989). At many PI sites in the region, all three types of architecture are present with evidence that each was in use simultaneously (Lightfoot Reference Lightfoot1992). The majority of contexts in this analysis—82 of 85 (96.4 %)—date to the BMIII and PI periods, with only three (all probable kivas) dating to the PII or PIII periods. As a result of relatively short use lives of these structures and the unique destruction patterns favoring widespread preservation of wood charcoal, this sample presents an ideal scenario to interpret building events and age offsets from those events. 724 of the 729 (99.3%) non-cutting dates are from specimens preserved in a charred state. Because of their size and provenience, tree-ring specimens in this dataset are interpreted as structural remains (e.g., support posts and roof beams). However, there remains the possibility that some portion of the sample is derived from non-structural wooden artifacts introduced after construction, or rubbish accumulating after destruction. This could complicate the identification of cutting date clusters and adds noise to the empirical distribution of age offsets. To minimize these effects, steps are described below to both identify ideal contexts from cutting date clusters, and to accommodate the expected noise emerging from small quantities of slightly younger wood in the sample.
Location of the archaeological sites in the greater Mesa Verde region contributing dendrochronological dates to this study.

Calculating Age Disparity
To calculate the time gap between a sample lacking a terminal growth ring and its predicted cutting date, an individual non-cutting date is subtracted from the estimated procurement year inferred from the modal value of a cluster of cutting dates from the same context. It has long been understood that clusters of tree-ring cutting dates represent building events, and that dates that diverge from these clusters represent cases of ring loss, beam re-use, or structure repair (Bannister Reference Bannister1962; Dean Reference Dean1978; Haury Reference Haury1935). Ahlstrom (Reference Ahlstrom1985; Ahlstrom et al. Reference Ahlstrom, Dean and Robinson1991) elaborated this concept and explained the importance of examining the shape of cutting date distributions. He and colleagues proposed that tight, well replicated, cutting date clusters—unimodal distributions, spanning only 1–2 years, with many dates—represent discreet tree procurement episodes uncomplicated by the various processes that could cause dating discrepancies (Ahlstrom et al. Reference Ahlstrom, Dean and Robinson1991: 637). Conversely, loose clusters—multi-modal distributions or distributions dispersed over decades—suggest sequential rebuilding and remodeling often associated with extended use or reoccupation of a dwelling (Ahlstrom Reference Ahlstrom1985).
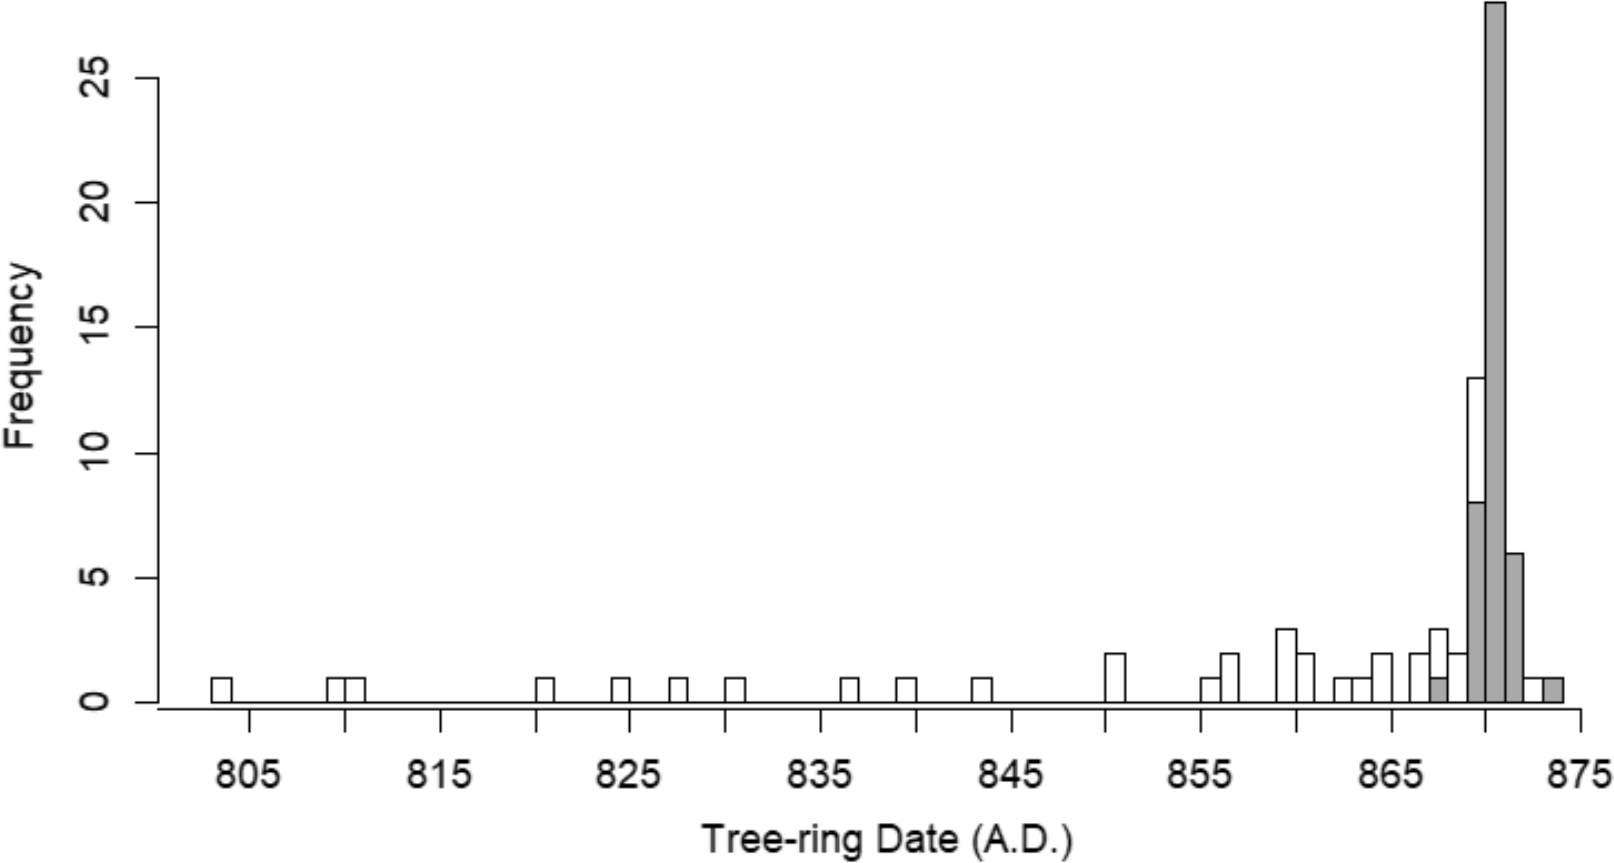
The distribution of cutting and non-cutting dates from Pit structure 4 at the Duckfoot site (5MT3868) is an exemplar of this concept. Duckfoot is a PI hamlet that was nearly completely excavated in the 1980s providing archaeologists a high-quality dataset for interpreting construction sequences and depositional processes (Cameron Reference Cameron1990; Lightfoot Reference Lightfoot1992; Varien and Potter Reference Varien and Potter1997). At Pit structure 4, all cutting dates are within 6 years of one another with a strong mode indicating construction in the year 872 or 873 AD with a short occupation and a modest amount of remodeling prior to 875 AD When plotted by the date of the outermost ring, the rapidly declining and flat left tail of non-cutting dates suggests that ring loss accounts for most of the discrepancies from the mode of cutting dates (Figure 2). An extremely early outlier non-cutting date (about 180 years earlier than the mode) is observed in this distribution and could be caused by a combination of dead wood use, recycling, and significant ring loss (Lightfoot Reference Lightfoot1992). Pit structure 4 at Duckfoot then, provides an archetypal model for interpreting age disparities in assemblages of charcoal non-cutting dates. Non-cutting dates randomly grouped within decades prior to a cutting date cluster probably represent ring loss, and to a lesser extent beam stockpiling and recycling, while larger time gaps represent in-built age occurring due to other processes such as intergenerational beam recycling, dead wood use, and/or severe taphonomic degradation of the outer rings.
Distribution of tree-ring dates from Pit structure 4 at the Duckfoot site. The tight symmetrical distribution of cutting dates (gray bars) around AD 872 suggest construction of the site in 872 or before the growing season of 873 with modest additions of wood construction material in the structure in the few years after. The long, rapidly declining tail of non-cutting dates (white-bars) is a predictable outcome of random taphonomic ring-loss in an assemblage of cutting dates from a single short-term construction event. A single non-cutting date was recorded at AD 689 but was truncated from the distribution for the sake of clarity.
In the date cluster concept, the single most likely year for a construction date corresponds to the peak density or mode of a distribution of cutting dates assuming that the distribution of dates is unimodal. To calculate this value in the study, a gaussian kernel was fitted to cutting dates from all individual contexts to locate short-term building events with a single well-defined mode like the example from Duckfoot in Figure 2. Contexts with cutting dates ranges > 30 years and multiple modes were eliminated from the sample, and the true construction date (dc) for each context was assigned based on the maximum kernel density of the cutting date distribution. The age offset between the construction date and samples missing their outermost rings (dn) is simply: dc—dn. Where the larger the value, the greater the number of years that a non-cutting date is older than the modal construction date of its context. Negative age offsets (e.g., non-cutting dates younger than cutting date cluster) are possible due to remodeling after construction or the introduction of furniture and other non-structural artifacts that post-date construction. Based on the theory for cutting date cluster interpretation presented above, and the fact that this analysis excludes diffuse cutting date clusters from the sample, the working hypothesis for this study is that negative age offsets will be a rare occurrence. Regardless of this, the application of a probabilistic ring-loss correction does not depend heavily on the complete absence of negative age offsets in the empirical distribution (see “Statistical Methods and Date Calibration” section).
Sample Partitioning
Sub-setting the dataset into different groups and performing significance tests across categories helps this study understand which factors affect the distribution of age disparities. The goal of this process is to objectively isolate discreet age offset functions based on readily characterized specimen attributes that can be tested in different contexts. This section discusses the factors upon which the sample was partitioned, and expectations for how such factors affect the data.
Taxonomy and taphonomy could interact to produce variability in age disparities. While interspecific wood properties impact the character of charcoal fragmentation (Chrzazvez et al. Reference Chrzazvez, Théry-Parisot, Fiorucci, Terral and Thibaut2014), the coarse fraction (>2–4 mm) of charcoal assemblages tend to vary independently from species and reflect underlying species abundances (Chabal Reference Chabal1992; Théry-Parisot et al. Reference Théry-Parisot, Chabal and Chrzavzez2010). This suggests that outer rings of dendrochronological samples should fragment independently of taxon—and therefore taxon should not influence the abundance of cutting dates or the distribution of non-cutting dates in the sample. As a check on this assumption the assemblage was partitioned into two sub-groups: pines/fir and juniper. The sample is composed mainly of junipers (Juniperus spp. Probably J. scopulorum) (67%) with Douglass fir (Ptseudostuga menenzeis) comprising a minority of the sample (7%). The remainder of the sample are pines, with pinyon pine (Pinus edulis or monophyla) most numerous (20%) compared to ponderosa pine (Pinus ponderosa) (6%).
The taphonomic status of samples was classified based on recorded attributes. For example, the outer rings of fragmented specimens might be less likely to be recovered compared to intact cross-sections. If so, the shape of the distribution of age disparities in these two groups might vary significantly with fragments having a longer tail or larger central values. Typically, specimens in the database are classified as either cores, cross-sections, partial cross-sections, or fragments with wood, charred wood, and charcoal usually distinguished. For this study, specimens in the data set were partitioned into two groups, fragments and cross-sections, the latter group including samples marked as either cross-sections or partial cross-sections.
The age of specimens could also produce different age disparities independent of other factors. Ring widths of southwestern conifers often exhibit a characteristic negative growth trend, where average ring widths decrease to an asymptotic value as the tree ages. The expectation is that when the outside portions of ring segments are eroded, combusted, or biologically degraded, specimens from older trees—with narrower ring widths on their outer portions—are likely to lose more years from their ring record compared to younger trees. A pronounced nonlinear trend is not always evident, but visual examination of ring width plots from Rocky Mountain juniper (Dean Reference Dean1995), ponderosa pine (Dean Reference Dean1994), and two needle pinyon pine (Woodhouse et al. Reference Woodhouse, Losleben and Chowanski2006) from the northern Colorado Plateau show that when it does occur, the growth phase characterized by large ring width increments occurs during the first 25 to 50 years. For segregating the data, ring segments longer than 50 years are considered “old” trees while segments shorter than 50 years are classified as “young” trees. Tree age was approximated by subtracting the outermost and innermost ring dates of each segment. For samples with pith or near pith rings, this age will be close to the true age of the tree, whereas for samples lacking pith or rings characteristic of being near pith this age represents the minimum tree age. A total of 102 tree-ring dates in the dataset had fewer than 50 rings and so were classified into the young tree group (14%) while 627 tree-ring segments had more than 50 years and so were classified into the older tree group (86%). Growth trends are affected by climate, stem height, competition, and site productivity (Fritts Reference Fritts1976), and a single value describing a tree’s growth status cannot capture the true variability in the sample. While a global method for age categorization based on an approximate age cutoff is admittedly simplistic, a method of age categorization must be adopted to initiate an exploration of the role of tree age on ring loss patterns in archaeological charcoal specimens. Because of the size of the data set, this analysis cannot retroactively measure each ring series and judge tree growth status from the actual ring width patterns. If the results motivate additional questions about the role of tree age on ring loss, then studies can more thoroughly investigate the topic. It is also noted that severe ring loss potentially complicates this (or any conceivable) age classification system. For example, a specimen originally containing hundreds of rings that is now observed to have less than fifty rings in its archaeological context will be mis classified. Such a specimen will rightly have a large age offset, but contrary to the expectation outlined above. If this is a widespread issue, then it would be expected that tree-age would be eliminated as a significant factor for predicting age disparities in charcoal.
Finally, the span of the date cluster (e.g., the range of cutting dates from a single context) was also evaluated for its effect on the distribution of age offsets. Intuitively, one would suspect that the distribution of non-cutting date age disparities would be more difficult to model with a parametric function in contexts were possible construction dates span many years as opposed to one or two years. This is simply because if there are multiple likely construction years there is less correspondence between the maximum kernel density (a single year) of the cutting date distribution and the offsets from the timing of the different construction episodes. It seems reasonable that spans of five years or less constitute a short duration building event and that the mode of such a cutting date distribution would be a reasonable approximation of the true timing of construction, especially for 14C dated contexts. It was already mentioned that the sample excluded all contexts with cutting date spans more than a human generation or about 30 years. However, it is not clear if narrower—but still somewhat diffuse—cutting date spans would significantly impact the distribution of age offsets in the tree-ring dates. To evaluate this, the sample was partitioned into two groups: contexts spanning 0–5 years and 6–30 years, where the span is simply the difference between the maximum and minimum cutting date, and so a span of zero years indicates that all cutting dates are the same year.
Statistical Methods and Date Calibration
The empirical distributions of age disparities compiled in this study were modeled with a variety of probability density functions with the best fitting function selected to represent the age offset for that class of specimens. Candidate functions were fit to empirical distributions of age disparities with the fitdistr()function of the R package “fitdistrplus” (Delignette-Muller et al. Reference Delignette-Muller and Dutang2015). Multiple functions including the exponential, log-normal, gamma, and Weibull distributions were examined as candidates for describing the empirical data generating functions. Parameter fitting was accomplished by maximum likelihood estimation, or in some cases, by minimizing the Anderson-Darling distance to maximize the goodness-of-fit of the tails (Delignette-Muller et al. Reference Delignette-Muller and Dutang2015: Table 2). The fit of candidate models was compared using the Akaike Information Criterion (AIC) and one-sample Kolmogorov-Smirnov (K-S) tests. AIC is a tool for model selection that estimates the discrepancy between data and fitted models penalized for the number of parameters (Akaike Reference Akaike1974). When comparing models fitted to the same data, the most parsimonious model with the highest mean log-likelihood will have a lower AIC score and will be favored as a description of the data (Sakamoto et al. Reference Sakamoto, Ishiguro and Kitagawa1986). The K-S test is a widely used non-parametric test comparing continuous distributions (Conover Reference Conover1998). In the one sample K-S test, the null hypothesis is that the function generating the observed data is described by a candidate distribution (Venables and Ripley Reference Venables and Ripley2009). The K-S test is used in this paper not for direct model comparison but rather to verify that the probability of the null hypothesis (p 0) is above the minimum level for acceptance/rejection (α = 0.05). AIC was calculated with the AIC() function and the K-S test was performed using the ks.test() function in R.
Mann-Whitney tests were applied to the distribution of age offsets in the partitioned Groups in step-wise fashion to test the null hypothesis that the age offsets in a particular pair of subgroups were identical. Partitions showing insignificant differences (null hypothesis with > 0.05 probability) were eliminated and the combined dataset with remaining partitions were subjected to the next test until only significant partitions remained. The Mann-Whitney test was performed by a two sample Wilcoxon test with the R function wilcox.test().
To evaluate the accuracy of the hypothetical age offset functions, 14C wiggle matches calibrated against IntCal20 (Reimer et al. Reference Reimer, Austin, Bard, Bayliss, Blackwell and Bronk Ramsey2020) in OxCal 4.4 (Bronk Ramsey Reference Bronk Ramsey2009) were corrected for age disparity by adding the age offset to the modeled outermost ring date (see Supplement 4):
wm + offset—range_shift
where wm is a D_Sequence() model and offset denotes a generalized distribution function (Bronk Ramsey et al. Reference Bronk Ramsey, van der Plicht and Weninger2001; Bronk Ramsey Reference Bronk Ramsey2020). The term range_shift denotes a small negative value added back to the age offset to correct for the probability of negative (or younger than the modal cutting date) age disparities in the distribution. Due to the presence of a smaller number of negative values in the empirical distribution of age disparities, a positive range shift had to be applied to the distribution prior to fitting density functions such as the log-normal. The range shift was accomplished by adding the absolute value of the minimum age offset plus one. Reversing the sign of the range shift and adding it back to the predicted values of the age offset function produces correctly scaled age offsets. The goal of the study was to describe typical age offsets due to ring loss and other factors and the presence of negative values—and the necessity of a range shift to correct for this—adds noise to the resulting age offset functions. The simple fix for this would be to eliminate contexts with negative age disparities. However, this would have consequences for the size of the dataset and resulting statistical power of the analysis. The approach of this study—allowing negative age disparities—trades some noise in the function for robustness. It is predicted that with a more perfect dataset the resulting age offset functions would have tighter modal values but would be substantially similar in terms of the range and shape of the functions produced with the noisier data.
In addition to applying the age offset to a single wiggle-matched date, this study undertook a simulation to evaluate whether existing tools in OxCal—specifically the Outlier_Model() function—could be utilized to correct for expected age disparities caused by outer ring loss. For this, an age offset function determined in this study was used in place of the exponential function typically recommended to model age disparities caused by in-built age for old charcoal samples (see Dee and Bronk Ramsey Reference Dee and Bronk Ramsey2014). For example:
Outlier_Model (“ring loss”,U(0,10)-LnN(1,0.1),U(0,1),“t”);
Note that “U(0,10)” in the above CQL2 code for the outlier model describes the range shift function detailed above, and the parameters of the log normal function LnN()given above are for illustration only, and in actual usage depend on the fitted parameters of the appropriate density function.
A sequence of five building events each separated by 18 years (an 18-year tempo) is simulated in this study with three non-cutting dates in each of the sequential phases for a total of 15 dates. Eighteen years was chosen as the interval between simulated events because it corresponds to hypothetical intervals proposed for monumental additions in the Cahokia area (Pauketat et al. Reference Pauketat, Alt and Kruchten2017) and is also on the shorter end of a human generation length. In this way, the simulation explores how taphonomic ring-loss and ring-loss correction might affect archaeological reconstructions of historically relevant question at human scale. Each event in the hypothetical sequence is modeled from three simulated D_Sequence() models in a single phase. The sequence is modeled with no cutting dates and the test evaluates whether the outlier tool with an appropriate model and parameters can reconstruct the true dates and tempo of the simulated events. Each D_Sequence() consisted of five R_Simulate() dates in a 40 year long sequence with a Gap() of nine years (see Supplement 5A). The simulated target date for the outermost ring in all the D_Sequence() models for the first phase is AD 1050, with the next four following in sequence at 1068, 1086, 1104, and 1122 (Supplement 5A). To produce age disparities, a random number of years was subtracted from each wiggle-match model with the number drawn from the appropriate age offset subgroup. The simulated sequence was calibrated with and without an outlier model to evaluate how an appropriately parameterized outlier function corrects for age disparities expected from ring loss (see Supplement 5B). The simulation was repeated for five iterations, and results are summarized as the pooled mean and standard deviations of the three D_Sequence() models in each phase.
RESULTS AND DISCUSSION
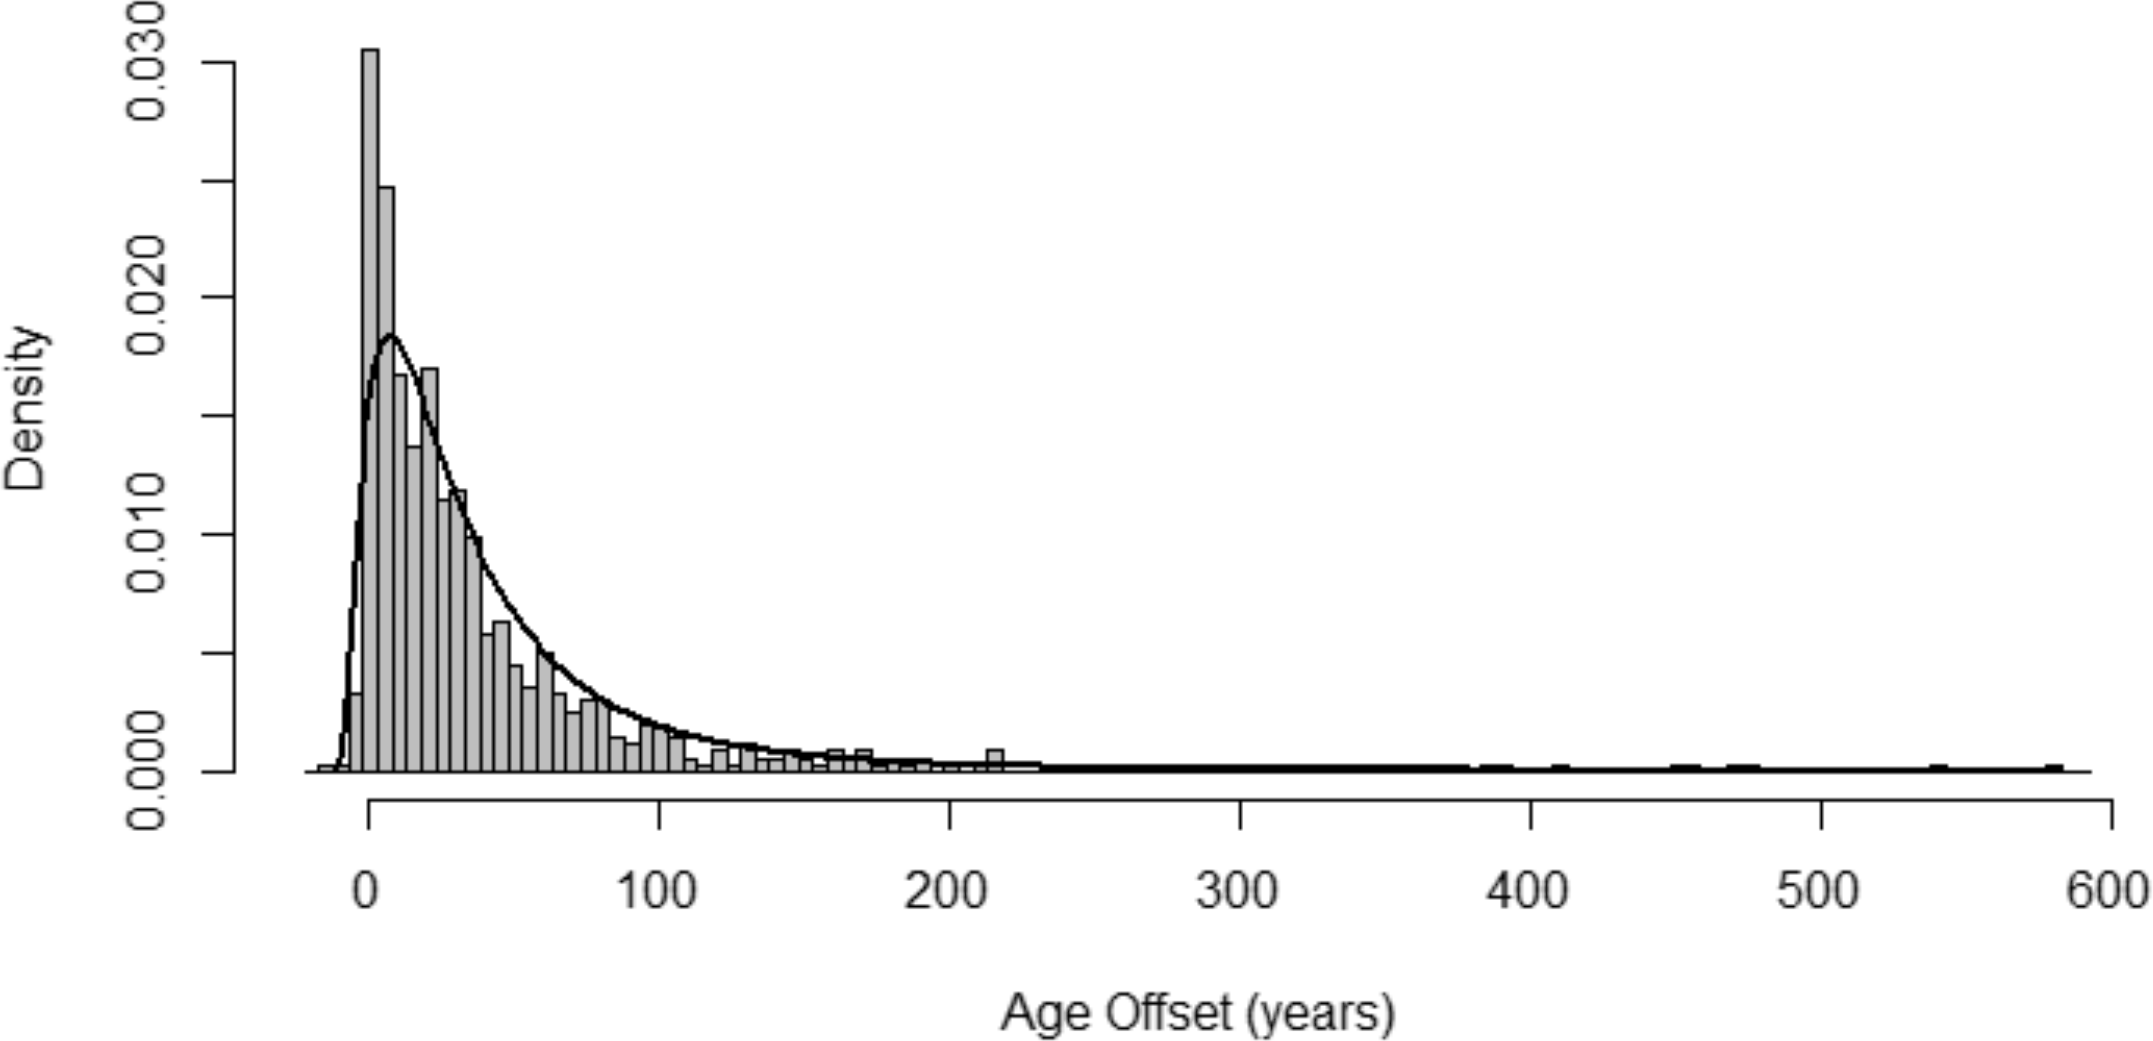
Age offsets for all non-cutting dates (n = 729) are distributed from -12 to 583 years with modal age disparity between 0-5 years (Figure 3). Based on the AIC test, a log-normal function is the most informative model for the empirical distribution of the total un-partitioned dataset, but the fitted function (μ = 3.54, σ2 = 0.72) is nonetheless an unlikely candidate for the data generating function of the un-partitioned data based on the K-S test (D = 0.08, p 0 = 0.003). Examining Figure 3 it appears that the candidate function underestimates the density of very high age disparities and underestimates the density of very small age disparities. This supports the assumption that additional factors influence the distribution of age offsets in the sample.
Histogram of the distribution of all age disparities in the sample. The black line shows the density distribution of a log-normal function (log(µ) = 3.54, log(σ) = 0.72) fit to the distribution. The probability from the K-S test that the two distributions are identical is small enough to reject this model as an acceptable estimate for the data generating function (p 0 = 0.003).
Significance of sample characteristics on age disparity
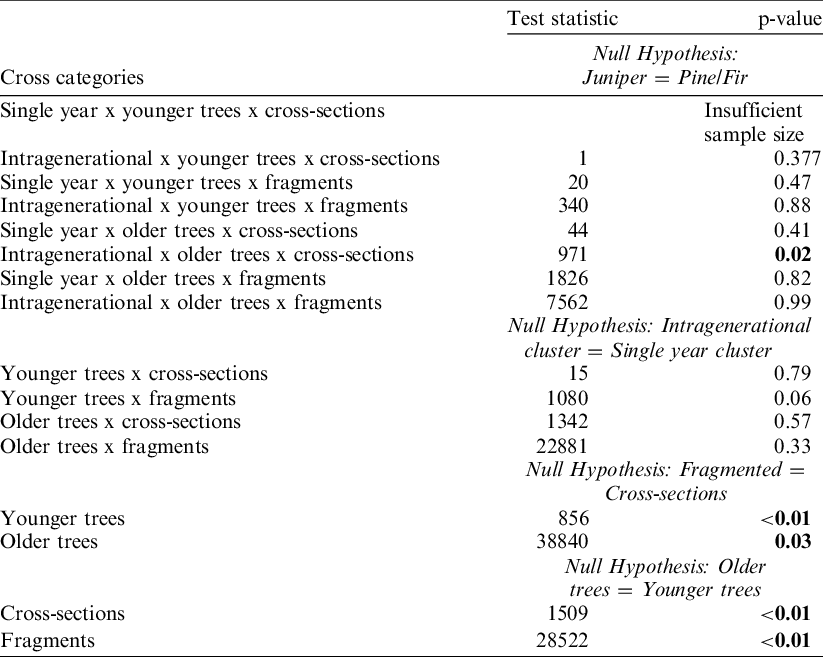
Tree taxa and the span of cutting dates are insignificant factors in the analysis of age offsets. The null hypothesis that age offsets in juniper (n = 488) and pine/fir (n = 241) are equivalent is supported by Mann-Whitney tests in seven of the eight possible groups (Table 1). This does not suggest that other taxonomic divisions (for example conifers vs hardwoods) would not result in significant differences in age offsets in other cases, only that dividing the all-conifer sample in this study yielded no consistent benefit compared to other categorical divisions. Age offset is also not consistently related to the span of the date cluster either. The null hypothesis, that the distribution of non-cutting dates from contexts with diffuse cutting date clusters (cutting date spans of 6-30 years) (n = 545) is identical to tight clusters (≤ 5 years) (n = 184) cannot be rejected in any pairing when taxa is disregarded.
Effects of event duration, specimen fragmentation, and tree age on the distribution of age disparities in different sample partitions determined by Mann-Whitney (two-sample Wilcoxon) tests.
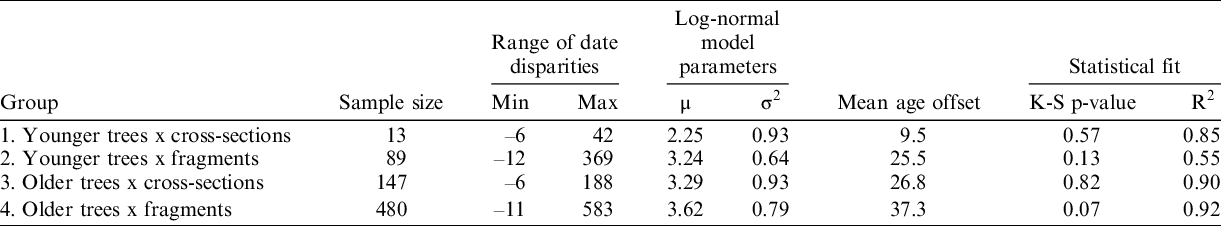
Summary of the continuous probability functions describing the age offsets of each Group. Statistical fit is p-value of the K-S test used to estimate the probability that the candidate function is representative of the empirical data generating function.
Dropping date cluster span and taxa as significant factors focuses the analysis on the state of preservation and tree age. Both factors appear to have significant effects on the distribution of age disparities of non-cutting dates. The null hypothesis that age offsets of fragmented specimens (n = 569) are identical to cross-sections (n = 160) is rejected in groups of both older (> 50 rings) and younger (≤50 rings) tree specimens. Likewise, the null hypothesis that age offsets of older tree specimens (n = 627) are identical to younger trees (n = 102) is rejected for both fragmented and intact specimens (Table 1). The simple classification of taphonomic state and tree age captures significant variability in the predicted age disparity. Specimens with fewer remnant rings are associated with probabilistically smaller age disparities, just as fragmented specimens are associated with probabilistically larger age disparities. A 73 percent increase in modeled mean age disparity is observed with fragmentation and an 83 percent increase in mean age disparity is associated with tree age. These effects work in concert to produce increasing levels of age disparity as predicted at the outset.
The results of subdividing the dataset support the intuitive assumption that greater levels of mechanical destruction correlate to increased ring loss, and that the characteristic growth trend of conifers causes a loss of more rings from the outsides of older trees compared to younger trees. This translates to ranked predicted age offset ordered from lowest to highest: intact specimens from younger trees (Group 1, n = 13), fragmented specimens from younger trees (Group 2, n = 89), intact specimens from older trees (Group 3, n = 147), and fragmented specimens from older trees (Group 4, n = 480).
Box plots of the distribution of age offsets in each group (Figure 4) and the parameters of the fitted probability density functions also support the predicted ranks for age offset associated with each Group (Table 2). In all cases there is a rapid non-linear decline in the frequency of age offsets from low values (0–5 years) (Figure 5), and a log-normal distribution is the best fitting model to describe the distribution of age offsets in all Groups. The goodness-of-fit between the empirical distribution of age disparities and the fitted log-normal functions for all groups is above the level of rejection. However, it is interesting to note that the goodness-of-fit for Group 4 (p 0 = 0.07), though still above the threshold of rejection, is low. Group 4 is the largest sample size of the partitions, and like the unpartitioned data there may be latent factors affecting the distribution. Visual examination of the empirical distribution of Group 4 age disparities and the fitted function (Figure 5) suggests that the candidate function is still an adequate approximation for the purpose of this study. These results suggest that multiple factors can affect the probability of age disparity caused ring loss or in-built age of charcoal samples, and if analysts seek more accurate statistical representations of outlier 14C dates of wood or charcoal then consideration of these factors is necessary.
Box plot showing the change in the distribution of age disparities with each sample Group discussed in the text. As predicted, age disparity increases from Group 1 (cross-sections from younger trees) to Group 4 (fragmented specimens from older trees). The reasons for this relationship are discussed in the text. Large outlier values in Group 2 and 4 are omitted for clarity.

Distribution of age disparities in the four sample groups. Lines show the log-normal function fit to each group with parameters and goodness-of-fit given in Table 2.

The Accuracy of Age Offset Functions
Adding an age offset function from this study to a degraded wiggle-matched ring series from a real archaeological context helps validate the results of model fitting with independent data. The study of Turkon et al. (Reference Turkon, Manning, Griggs, Ramírez, Nelson, Padilla and Wild2018) provides such an example, where wiggle-matched cutting dates provided a chronology of monumental construction at La Quemada Cuartel and Los Pillarios archaeological sites in Zacatecas, Mexico. These sites were important local monumental and political centers in the Malapaso Valley on the northern frontier of Classical Mesoamerican civilization during the first Millennium AD (Turkon et al. Reference Turkon, Manning, Griggs, Ramírez, Nelson, Padilla and Wild2018:105–106). In their study, tree-ring series were cross-matched into a relative chronology and then anchored in time with sequential 14C dates. One context dated by the investigators consisted of roof fall in a temple complex at Los Pillarios that, based on two wiggle-matched cutting dates and its relationship to La Quemada Cuartel, they interpret as dating to ca. AD 770 (p. 117). However, one sample from this context (PIL 15) lacked the terminal growth ring or any indication of the waney edge and predated the other cutting dates from Los Pilarillos by more than 60 years. According to the authors, this date is still congruent with the AD 770 hypothesis based on archaeological context. For this test case, an estimated cutting date was obtained by adding the age offset function for the appropriate group—parameterized according to Table 2—to the TPQ date of a hypothetical wiggle-matched ring series in OxCal (see Supplement 4).
Sample PIL 15 from Los Pilarillos is a fragmented specimen containing more than 70 rings (Turkon et al. Reference Turkon, Manning, Griggs, Ramírez, Nelson, Padilla and Wild2018: 111) which places the sample into Group 4. Seven sequential 14C dates from PIL 15 (Turkon et al. Reference Turkon, Manning, Griggs, Ramírez, Nelson, Padilla and Wild2018: Table 3) were recalibrated against IntCal20 (Reimer et al. Reference Reimer, Austin, Bard, Bayliss, Blackwell and Bronk Ramsey2020) and yielded a modeled date of 706 AD (μ) ± 5 (σ), an age which is virtually identical to the original report. Applying the age offset function derived from Group 4 specimens yields a cutting date corrected for ring loss between 702 and 850 AD (95.4% posterior density), and probably 711–764 AD (68.2% posterior density) (Figure 6). The mean cutting date estimate corrected for ring loss is 756 AD ± 47 (1σ), and agrees with the authors’ interpretation based on the archaeological evidence and other high-precision 14C ages that PIL15 dates a context that was built around 770 AD This supports the conclusion that the modeling process in this study yielded a realistic estimate of age offset in non-cutting dates from fragmented and charred tree-ring specimens.
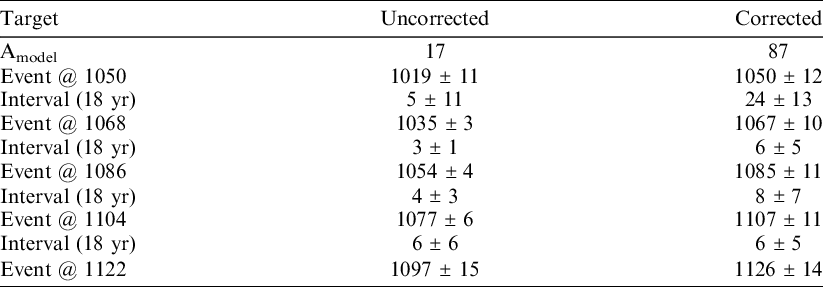
Comparison of simulated age disparities in wiggle-match dated phases calibrated as is and with an outlier model to correct for predicted age offset.
Schematic for the age-offset correction for Group 4 samples applied to a single non-cutting wiggle-matched date from the Los Pillarios archaeological site (data from Turkon et al. Reference Turkon, Manning, Griggs, Ramírez, Nelson, Padilla and Wild2018). The TPQ distribution (Panel A) is the posterior distribution of the outermost ring from the wiggle-match model. Panel B shows the age-offset correction which consists of the function derived from the distribution of age disparities in Group 4 samples with the range shift to account for negative values in the log-normal function (see “Methods and Materials” section for explanation). The estimated posterior density for the true cutting date for the sample is shown in Panel C.

Age Offset Functions in Archaeological Sequences
As can be seen from the empirical distributions of dating disparities (Figures 3 and 5), ring loss can span decades to centuries in some samples. This means that stratigraphic date inversions can be generated by ring loss alone in short duration sequences and is a potential problem for archaeologists seeking to answer questions about the tempo of historical events, particularly if the recurrence interval is on the order of years. For example, an archaeological debate about the nature of recurring construction events could involve tempos ranging from annual to generational spans and can only be resolved with high-resolution dates in a reliable sequence. The Mississippian region of North America provides such a case where the evolving rearrangement of space within sacred precincts, punctuated by repetitive additions, is commonly observed in the archaeological record (Lindauer and Blitz Reference Lindauer and Blitz1997:176). Researchers have proposed various scenarios for monumental additions and renewal activity with tempos ranging from annual to multi decadal (Anderson Reference Anderson1994:127; Hally Reference Hally1996; Pauketat Reference Pauketat2002; Alt and Pauketat Reference Alt and Pauketat2017).
In a simulation, introducing random age disparities into wiggle-match models (based on Group 2 specimens) in hypothetical sequences produced date inversions that would be problematic in the absence of an appropriate outlier model (Figure 7). This is observed in the low agreement index for the uncorrected sequence averaged for the five iterations (Amodel = 17) compared to the sequence corrected for age offset (Amodel = 87). Dates from the sequence corrected using the age offset parameters for Group 2 specimens (Table 2) are less precise but more accurate than dates from the uncorrected simulated sequences (Table 3). Reconstructed event dates in the uncorrected sequence are inaccurate in three of the four phases while the corrected sequences accurately reconstruct the “true” event date for each phase. The uncorrected sequence underestimates the true time span between phases in two of the four intervals averaged across the five iterations, whereas the corrected sequence accurately reconstructs the true interval between each phase. Importantly, the corrected age model reconstructs the true interval between phases with enough precision in three of the four cases to distinguish events occurring on a generational or sub-generational tempo (approximately 25 years) from events occurring at a longer tempo.
Simulation of two identical sequences composed of five phases of simulated dates in wiggle-match models. All of the simulated wiggle-matches are non-cutting dates with age disparities randomly drawn from the distribution of Group 2 samples. The uncorrected sequence (left) has poor agreement due to multiple stratigraphic inversions caused by ring loss. The sequence on the right was corrected by the application of an outlier model parameterized with the log-normal function shown in Table 2. The corrected sequence has acceptable agreement and accurately reproduces both the true age of each simulated phase as well as the tempo of the events represented by each hypothetical phase.

Experimentation with this simulation revealed that three D_Sequence() ages per phase is near the limit of accuracy and precision demonstrated above. While removing one date from up to two phases does not markedly impact the results, using only two dates for all five phases does erode the degree to which event dates and the tempo of events can be accurately reconstructed in the simulation. Because the precision of wiggle-matches should vary with series length and position on the calibration curve (Bayliss et al. Reference Bayliss, Marshall, Dee, Friedrich, Heaton and Wacker2020), studies seeking to apply this method for correcting TPQ dates for ring loss are advised to simulate effects in their situation.
CONCLUSIONS
The purpose of modeling age disparities of non-cutting tree-ring dates was to develop a correction for wiggle-matched 14C sequences from charcoal lacking terminal growth rings and any indication regarding the original width of sapwood. Two significant factors for predicting the span of age offset between inferred construction events and non-cutting dates were isolated. Both fragmentation of ring segments and tree age increase the probabilistic age offset, with tree age having a slightly greater effect. The statistical functions fit to the distribution of age disparities are characterized by a rapidly decreasing probability from modal values around 0 to 5 years, with a mean age offset ranging from 10 to 40 years depending on the type of specimen. Age offset corrected cutting dates necessarily have more uncertainty than wiggle-matched non-cutting TPQ dates. However, because age disparities of non-cutting dates can span multiple decades or centuries, a correct estimation of age offset in samples lacking outer rings enables a more accurate modeled date when the precision of wiggle-matches are only a fraction of the potential disparity. By accounting for age disparities, an analyst can estimate the true target of tree-ring dating in a wiggle-match calibration model, the year of tree death, within a margin of error. The applied case study supports the accuracy of the age offset function. In this example, the age offset correction yielded a realistic cutting date for the archaeological context in question, a date that is supported with independent archaeological and chronometric evidence. The simulation presented in this paper suggests that in cases where no cutting dates are available, outlier models with an appropriate age offset function can accurately reconstruct events at generational tempos. These results show that accurate and precise 14C dated events can be reconstructed from sequences of non-cutting dates when a realistic model of age disparities can be estimated.
ACKNOWLEDGMENTS
The dataset used for this analysis was originally compiled and digitized by Steven Nash for Crow Canyon Institute. The author wishes to thank Ron Towner and Jeff Dean for archive access and many discussions that stimulated ideas in this paper. Three anonymous reviewers contributed suggestions and critiques that significantly improved the manuscript and for that they are heartily thanked.
Supplementary material
To view supplementary material for this article, please visit https://doi.org/10.1017/RDC.2021.109


 Open access