Polycrystalline glacier ice at the melting point is often considered as a two-phase mixture, with the water phase located in veins and small channels at triple grain boundaries (Reference Raymond and HarrisonRaymond and Harrison, 1975; Reference NyeNye, 1989). These micro-scale water bodies strongly influence the deformation rate of ice (Reference DuvalDuval, 1977). Correct knowledge of the amount of liquid water in temperate glacier ice is therefore required for predictive modelling of ice mass flow (Reference Hubbard, Hubbard, Mader, Tison, Grust and NienowHubbard and others, 2003) and for characterization of the hydrothermal structure of polythermal glaciers (Reference Pettersson, Jansson, Huwald and BlatterPettersson and others, 2007).
Since the velocity of electromagnetic waves travelling through ice is known to decrease with increasing water content while attenuation increases, ground-penetrating radar (GPR) velocity and amplitude analysis is a potential remote method to characterize and model the hydrothermal structure of temperate (Reference Murray, Stuart, Fry, Gamble and CrabtreeMurray and others, 2000a; Reference Benjumea, Macheret, Navarro and TeixidóBenjumea and others, 2003) and polythermal glaciers (Reference Macheret, Moskalevsky and VasilenkoMacheret and others, 1993; Reference MurrayMurray and others, 2000b; Reference Pettersson, Jansson and BlatterPettersson and others, 2004). Microscale water-content estimates using GPR are, however, overestimated since the velocity of a radar wave travelling through glacier ice is conditioned not only by intra-crystalline water but also by larger (cm to dm) water bodies.
Borehole vertical radar profiling (VRP) is a commonly used geophysical technique for characterizing the shallow subsurface (Reference Tronicke and KnollTronicke and Knoll, 2005; Reference Clement and KnollClement and Knoll, 2006). Water-content estimates using radar wave velocity (rwv) from VRP data need to consider the presence of multiple travel paths that, if incorrectly interpreted, can provide erroneous estimates (Reference Gusmeroli, Murray, Barrett, Clark and BoothGusmeroli and others, 2008).
In this correspondence, we present a modified interpretation of a previously published (Reference Murray, Stuart, Fry, Gamble and CrabtreeMurray and others, 2000a) vertical radar profile (VRP) collected in a borehole located in the ablation zone of Falljökull, a temperate glacier in southeast Iceland (for details on the survey see Reference Murray, Stuart, Fry, Gamble and CrabtreeMurray and others, 2000a). Published results from Falljökull suggest that the water distribution in the upper 25 m changes vertically and, assuming horizontal hydraulic layering, is composed of an alternation of wet ice layers (maximum estimated water content ∼2–3%) and solid ice layers (dry ice with air inclusions, rwv > 0.168 m ns−1).
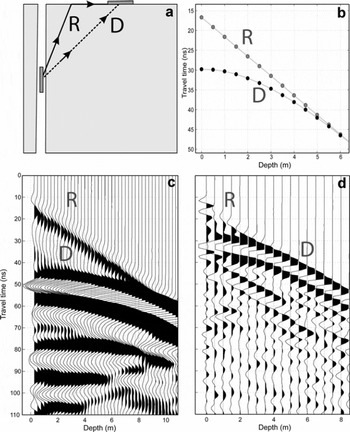
The VRP analysis by Reference Murray, Stuart, Fry, Gamble and CrabtreeMurray and others (2000a) was done by automatically picking the first arrivals at 5% above the noise level, and assumed a straight-line propagation path between transmitter and receiver at each depth. However, this assumption is violated at shallow depths in two ways: first by the airborne critical refraction (Reference Tronicke and KnollTronicke and Knoll, 2005), and second because of refraction at subsurface interfaces. The former is more serious, due to the high refractive-index contrast between air and ice, and at shallow depths in our datasets the first arrivals are in fact the airborne critically refracted ray paths. When the transmitter is fixed on the surface and the receiver is in the borehole, the critically refracted ray paths travel at the velocity of air (0.3 m ns−1, nearly twice the solid ice velocity of 0.168 m ns−1 along the the ice–air interface and then refract into the ice following Snell’s law (Fig. 1a), arriving at the receiver before the direct ray path (the same ray path occurs in the reverse direction if the transmitter is in the hole and the receiver is fixed at the surface). The interpretation of the shallow direct arrivals is therefore complicated by the presence of these travel paths (Fig. 1). When critically refracted waves interfere with the direct waves, the first break of the radiation propagating directly between the two antennae is not clearly recognizable.
(a) Generalized sketch illustrating VRP geometry and the travel paths of the critically refracted (R, solid line) and the direct arrivals (D, dashed line). (b) Modelled travel-time curves using geometrical optics as an approximation of electromagnetic radiation for a 5 m offset VRP, trace interval 0.5 m and radar wave velocity of 0.168 m ns−1. (c, d) Two different VRP surveys from Falljökull used to study critical refraction (c) and to infer the hydraulic structure of the glacier (d) respectively: (c) 100 MHz survey, 15 m borehole-receiver offset, trace interval 0.25 m down-hole; (d) 250 MHz survey, 5.5 m borehole-receiver offset, trace interval 0.5 m down-hole. The critically refracted arrivals (R) are clearly observable in both surveys. These ray paths interfere with the direct arrivals (D) in the shallowest part of the survey (until ∼9 m depth in (c); 6 m in (d)). This interference makes it unclear where to pick the direct arrivals for velocity reconstruction.

The portion of the survey affected by critical refraction is limited to the upper parts of the VRP (5 m in our case; ∼18% of the survey); the maximum depth at which critical refraction occurs is a function of the rwv contrast between the surface layer and the air, and of the offset from borehole to surface antenna (Reference Tronicke and KnollTronicke and Knoll, 2005). Correct interpretation of the direct arrivals is required since the rwv is calculated at each depth using the difference in time between consecutive direct arrivals and the difference in direct path length between antenna depths.
The source of error in the rwv estimates introduced by the interference caused by the critically refracted arrivals must be avoided by picking the correctly interpreted direct arrivals. Ideally we would pick the first break, but this has zero amplitude and can be obscured by interference in the earlier arrival of the critically refracted wave. Therefore, in order to represent the first break of the direct arrivals where this interference occurs, we considered the first positive amplitude peak of the direct wavelet, back-shifted by a quarter of a period. The period of the direct wavelet was measured by considering the time between its first break and the subsequent zero crossing in the portion of the survey where critically refracted arrivals do not interfere with direct arrivals.
In the previous interpretation (Reference Murray, Stuart, Fry, Gamble and CrabtreeMurray and others, 2000a), the direct arrivals were not correctly represented since the interference that occurs just before the direct arrivals was used for velocity estimates. This event is represented between 30 and 40 ns in Figure 1c and between 20 and 25 ns in Figure 1d.
Results show that the rwv was underestimated by ∼20–30% when the critically refracted path was not taken into account, giving water-content estimates that are more than 4 vol.% greater than the estimate obtained when the direct ray path was correctly interpreted. Figure 2 shows the modified interpretation of the rwv velocity structure and the water content versus depth calculated with the Reference LooyengaLooyenga (1965) model. Velocities in Figure 2 are seven-point interval velocities estimated using a linear regression on travel time versus path length. This analysis confirms that accurate quality control is required while conducting travel-time inversion of VRP; more sophisticated inversion schemes (e.g. Reference Clement and KnollClement and Knoll, 2006), which can indicate whether the correct travel time has been picked, are hence recommended in glaciological VRP analysis.
Modified interpretation of (a) the velocity and (b) the water-content models in the portion of the VRP contaminated by the critically refracted waves. Dashed lines indicate values published by Reference Murray, Stuart, Fry, Gamble and CrabtreeMurray and others (2000a); solid lines indicate the new interpretation. Water content is calculated using the Looyenga mixture equation. The solid grey line in (a) indicates the solid ice rwv (0.168 m ns−1). Glacier ice with rwv higher than 0.168 m ns−1 must contain a significant amount of air.
Since the deviation from a theoretical vertical geometry of the borehole is relatively small for a 26 m deep borehole, we calculated the error in the velocity measurements considering the standard error of the linear regression alone. The error in velocity estimates was then used to calculate the error in the water-content estimates using standard error analysis of the Looyenga equation (Reference Barrett, Murray and ClarkBarrett and others, 2007).
Our new interpretation of the 5 m thick top layer shows velocities considerably higher than those commonly accepted for the cold-ice (or solid-ice with no water inclusions) velocity, which is 0.168 m ns−1. The highest value is ∼0.19 m ns−1 at 2 m depth; the value gradually decreases with depth until reaching the solid ice velocity at 3.5 m. It is possible to conclude that all the ice with rwv higher than 0.168 m ns −1 must contain air inclusions, and all the ice with slower velocity must have some water inclusions. Furthermore, while the fall in velocity with depth shows that air content decreases with depth and the water content gradually increases, it is not possible to conclude that ice with velocities >0.168 m ns −1 does not contain water, or, conversely, that ice with velocities <0.168 m ns−1 does not contain air. The interpretation of glacier-ice properties using rwv is therefore ambiguous, since the ice with rwv higher than the solid ice velocity can still contain rheologically significant water content; all the water- and air-content estimates herein must therefore be considered as minimum values.
Additional information about air content is therefore required to characterize the three-phase mixture (air–water–ice) within glacier ice. However, we tried to quantify air inclusions by applying a modified Looyenga mixture formula and considering ice with rwv higher than 0.168 m ns−1 as a two-phase material (air and ice). The air content a is therefore given by:

where v is the measured interval velocity, c is rwv in air, and ε i and ε a are the dielectric constants of ice and air respectively. Since the contrast in dielectric properties between air and ice is much smaller than for ice and water, the sensitivity of Equation (1) to air content is very high, and small changes in velocity cause large changes in the air-content estimates.
Figure 3 shows the ice-properties model estimated using our new interpretation of the VRP survey, including our estimated minimum air content and the error associated with these estimates. Surface ice properties (depth = 0 m) were estimated using the ground wave velocity (0.167 m ns −1) of a common-midpoint survey that was also acquired at the time (Reference Murray, Stuart, Fry, Gamble and CrabtreeMurray and others, 2000a).
Ice-properties-with-depth model from a VRP in the ablation area of Falljökull considering the new interpretation in the shallowest ice. The error associated with the air and water volume estimates from the mixing equation (Reference LooyengaLooyenga, 1965) is calculated in terms of the measured interval velocity and its standard error. The scale of the right part of the figure (water content) is ten times the left scale (air content). Light grey colour indicates ice that contains air; dark grey indicates wet ice.

The interpretation of the glacier ice properties in the upper 5 m of the ablation zone at Falljökull is therefore changed from a wet, water-saturated ice (Reference Murray, Stuart, Fry, Gamble and CrabtreeMurray and others 2000a) to an air-rich ice. However, since glacier ice should be considered as a three-phase mixture, we further conclude that GPR by itself is not sufficient to produce water-content estimates.
Acknowledgements
A.G. is funded by a Swansea University Postgraduate Research Studentship. We thank B. Kulessa, B. Reinardy and all the Swansea Glaciology Group for invaluable guidance during this study. The School of the Environment and Society in Swansea, the School of Earth and Environment in Leeds and the University Centre in Svalbard were excellent and stimulating workplaces. Reviews by two anonymous reviewers led to improvements in the manuscript.
25 October 2008