

INTRODUCTION
Agronomy research builds on a long-established tradition. It has delivered major increases in yields of all major food crops and other commodities, for example raising yields of the major cereals ten-fold from 1 t ha−1 in the early 19th Century to over 10 t ha−1 currently on some farms. The first experimental trials established by Lawes and Gilbert at Rothamsted in the 1840s, several of which still continue today, consisted of a single plot of each treatment (Poulton, Reference Poulton2006). It was only in the 1920s that research methods for experimentation were revolutionised through the work of Ronald Fisher. Fisher first introduced ‘Analysis of Variance’ (ANOVA) in 1925 in his book ‘Statistical Methods for Research Workers’ (Fisher, Reference Fisher1925). The design principles that Fisher introduced in his book ‘The Design of Experiments’ provided methods to ensure efficiency, eliminate bias in comparison of treatments and provide a measure of precision of results including blocking to minimise effects of unexplained variation (Fisher, Reference Fisher1935) . Fisher's ANOVA and comparison of means rapidly became the standard method for analysis of agronomic experiments designed to examine the effects of single or multiple factors and their interactions. The methods of design and analysis are based on the assumption that there is a single ‘true’ treatment effect to estimate. Such designs aimed at minimizing unexplained variation, or the variation not explained by applied treatments. Experiments were commonly implemented on a single or very few locations, mostly under well-managed, ‘on-station’ conditions.
The methods of Fisher became the basis for agricultural experimentation, and no doubt contributed enormously to the research programmes that led to the Green Revolution in Latin America and Asia. During colonial times in Africa, agricultural research stations had been located on the better soils, primarily to provide good locations for breeding of particular commodities aimed at plantation and large scale farming. For example in Tanzania the coffee research station was located at Lyamungu on the slopes of Kilimanjaro, the cotton research station at Ukiriguru to the south of Lake Victoria, and the horticulture research station at Tengeru, Arusha. These research stations were fit for purpose when it came to breeding of these commodities for large scale, high input farming, providing close to ideal conditions for the specific commodities for which they were established. A few research stations were less than ideally located, for instance, Peter Le Mare discovered that the Namulonge station in Uganda was situated above a seam of manganese-bearing rock, with peculiar soil properties in terms of phosphorus availability (Le Mare, Reference Le Mare1968). The focus was largely on genetic improvement (e.g., for yield, disease resistance, dwarf varieties that could respond to N, or drought stress). Agronomic experimentation played a major supporting role to optimise the performance of the new dwarf cereal genotypes through intensifying plant density, fertilization rates, etc. The statistical designs based on the original approach of Fischer, with many elegant extensions and additions to these methods (e.g. Cochran and Cox, Reference Cochran and Cox1957) proved to be powerful tools for elucidating the roles of specific factors or their interactions. The model of agricultural development was one of research and demonstration. Experimentation was the dominion of researchers and demonstrations that of the department of extension, whose role was simply to spread the findings from experimental research to convince a large body of farmers to adopt them (Maat and Glover, Reference Maat, Glover, Sumberg and Thompson2012). Some early agronomic research recognised the need to target recommendations to different agroecological zones, such as the pioneering research to differentiate fertilizer response curves (Scaife, Reference Scaife1968). In Kenya, the Fertilizer Use Recommendations Project (FURP, 1994) attempted to disaggregate fertilizer responses, but did this by administrative district rather than basing the recommendations on factors that might interact with fertilizer response. Others recognized early on the need for on-farm research, to identify the factors limiting productivity on smallholder farms, such as K deficiencies (Anderson, Reference Anderson1974).
The poor performance of technologies, when they escaped the safety of experimental stations, and the limited adoption on smallholder farms, led to the advent of farming systems research (Collinson, Reference Collinson2000) and participatory varietal selection (Sperling and Ashby, Reference Sperling, Ashby and Collinson2000). These approaches sought to understand the context within which crop production takes place and to involve farmers early in the research process. The need for this was two-fold: first, the varieties or options for agronomic management were often not well-matched to the preferences or interests of the farmers and second, the options often performed more poorly on farmers’ fields than under the closely controlled conditions on research stations. Principal reasons for failure of technologies were the inherently poor soil fertility on smallholder farms (Waddington et al., Reference Waddington, Murwira, Kumwenda, Hikwa and Tagwira1998) and the excessive labour demands and other social constraints of many of the technologies proposed. The case of alley cropping was documented by Carter (Reference Carter1995).
Kofi Anan highlighted the need to increase agricultural productivity in Africa though ‘a uniquely African Green Revolution’ recognising the diversity of peoples, soils and farming practices (Tittonell et al., Reference Tittonell, Vanlauwe, Misiko, Giller, Bationo, Waswa, Okeyo, Maina and Kihara2011). The situation in Africa is very different from the conditions that supported the Green Revolution in Asia, in terms of the diversity of agroecological conditions, the lack of opportunities for widespread irrigation and in terms of policy support from governments (Djurveldt et al., Reference Djurfeldt, Holmén, Jirström and Larsson2005). Thus, agronomic research must also grapple with the diversity of conditions under which smallholder agriculture takes place (Buerkert et al., Reference Buerkert, Bationo and Piepho2001), just as agricultural advisory services need to deliver ‘best fit’ options suited to the local capacities and broader policy environment (Birner et al., Reference Birner, Davis, Pender, Nkonya, Anandajayasekeram, Ekboir, Mbabu, Spielman, Horna, Benin and Cohen2009).
It may be argued that most of the basics of agronomy and crop management are well established. As the focus of research has shifted increasingly to understanding the performance of crop varieties or agronomic management under farmers’ conditions, the research questions have evolved. Essentially, there is increasing realization that the questions faced by agronomic research have also changed. Moving from understanding the impacts of single factors, we need to understand the interactions among a wide range of factors that interact to determine crop performance. This requires widespread testing of technologies as biased site selection and ‘standardized’ management tend to over-ride or control the factors that determine crop response. Even incomplete designs can only include a small number of factors before experiments become unmanageable if conducted on many sites. This has led to the distinction between experiments and demonstrations becoming increasingly blurred. Whereas agricultural research has tended towards very general recommendations, which can readily be rolled out over large areas, there is increasing recognition that the heterogeneity of agro-ecologies and of farms and farmers requires locally adapted solutions and nuanced, tailored ‘best fit’ approaches (Giller et al., Reference Giller, Tittonell, Rufino, van Wijk, Zingore, Mapfumo, Adjei-Nsiah, Herrero, Chikowo, Corbeels, Rowe, Baijukya, Mwijage, Smith, Yeboah, van der Burg, Sanogo, Misiko, de Ridder, Karanja, Kaizzi, K'ungu, Mwale, Nwaga, Pacini and Vanlauwe2011). Research on integrated soil fertility management (ISFM) has embraced this by focusing on local adaptation of technologies to improve soil fertility (Vanlauwe et al., Reference Vanlauwe, Descheemaeker, Giller, Huising, Merckx, Nziguheba, Wendt and Zingore2015). Before arriving at ‘recommendations’ there is a need to understand the frequency of response and the frequency of the magnitude of response to different interventions. Relatively little effort has been devoted to formulating precise hypotheses or questions concerned with agronomic treatment effects on farm, or to developing methods to analyse experimental treatment effects over large data sets. Taking this a stage further, it is essential to understand the major factors governing the response to a given treatment, to provide farmers with information on the likelihood of a substantial or economic benefit if they invest in a given technology.
In this paper, we: (i) describe the challenges faced in addressing heterogeneous smallholder environments and the diverse smallholder farming systems; (ii) highlight the importance of variation in evaluating the performance of soil management recommendations; (iii) integrate aspects of production risk management within the formulation of recommendations and (iv) describe the consequences of the above for implementing agronomic research at scale.
THE REALITIES OF SMALLHOLDER FARMING IN SUB-SAHARAN AFRICA
‘Traditional’ agronomy research designs focused on controlling and minimizing variation caused by factors not included in the treatment structure. When evaluating the impact of treatments under farmer management, on-farm factors interact with the priority treatments, either agronomically (e.g. the timing and intensity of agronomic practices such as planting or weeding) or economically (e.g. input and output prices for the produced commodity) such that they can easily mask or reduce the potential performance of these treatments. Smallholder farming environments in sub-Saharan Africa are characterized by (i) variable soil fertility conditions at short distances, including within-farm, often referred to as soil fertility gradients (Buerkert et al., Reference Buerkert, Bationo and Piepho2001; Tittonell et al., Reference Tittonell, Vanlauwe, Leffelaar, Shepherd and Giller2005; Zingore et al., Reference Zingore, Murwira, Delve and Giller2007), (ii) variable access to resources for farming families within the same communities (Giller et al., Reference Giller, Tittonell, Rufino, van Wijk, Zingore, Mapfumo, Adjei-Nsiah, Herrero, Chikowo, Corbeels, Rowe, Baijukya, Mwijage, Smith, Yeboah, van der Burg, Sanogo, Misiko, de Ridder, Karanja, Kaizzi, K'ungu, Mwale, Nwaga, Pacini and Vanlauwe2011; Tittonell et al., Reference Tittonell, Muriuki, Shepherd, Mugendi, Kaizzi, Okeyo, Verchot, Coe and Vanlauwe2010) and (iii) variable enabling conditions for agricultural intensification, including access to agro-inputs, markets and extension services (Sumberg, Reference Sumberg2005).
Within farms, the interplay of soil forming processes and preferential management have resulted in fields with different soil fertility conditions. Some fields are degraded to the extent that application of standard fertilizer does not result in substantial increases in crop growth, often referred to as non-responsive soils. Application of ‘bestbet’ management options within such heterogeneous soil fertility conditions commonly results in a wide range of responses, from virtually no effect to increases approaching the potential yield for a specific environment (Vanlauwe et al., Reference Vanlauwe, Tittonell and Mukalama2006). We define ‘bestbet’ options as those that, given current understanding of the smallholder objectives and production environment, are predicted to have a good chance of meeting these objectives. The ‘smallholder objectives’ component of this definition embeds aspects of riskiness, short-term versus long-term returns, and multiple options (e.g. different options for different types of farmers).
Within communities, farmers have (i) varying access to production resources including land, labour, and cash, (ii) different production objectives including food for subsistence and products for the market, (iii) varying capacities to absorb risk inherent to alternative management practices, with poorer households being more risk-averse and (iv) diverse attitudes to farming and the role farming plays within their overall livelihood. These farm-level conditions affect choices of agronomic management practices and the anticipated effects of ‘bestbet’ treatments. It is widely recognised that crop performance is the product of the interactions between the crop genotype (G), the environment (E) within which it is grown and agronomic management (M), giving the G × E × M framework. Within farming environments, at sub-national, national or regional level, enabling conditions vary substantially, including access to agro-inputs and produce markets, rural infrastructure and policy conditions. In turn, institutions affect the profitability of farming and the potential interest of farming communities in new technologies. Institutions in this context refer to the social, economic, political and infrastructural factors, amongst others, that influence the performance of specific technologies. Ojiem et al. (Reference Ojiem, de Ridder, Vanlauwe and Giller2006) referred to the interaction among these factors as the ‘socio-ecological niche’ for technologies. Nelson and Coe (Reference Nelson and Coe2014) describe it more generally as the ‘option by context interaction’.
Following the above and the recognition that a multitude of farming dimensions interact with ‘bestbet’ treatments, it is clear that traditional approaches provide an indication of potential treatment effects at best and that multifactorial designs encompassing all possible influencing factors become practically impossible to design and establish. This calls for new approaches to implement agronomic trials and analyse the data obtained from such trials.
CASE STUDIES
New approaches and analytical tools are illustrated using two case studies based on multi-locational, on-farm trials implemented with maize in Western Kenya and beans in Eastern Rwanda. Table 1 describes the specific target areas, environmental conditions and experimental details of the trials.
Selected details of the case studies, including treatment structure and geographical scope, and agro-ecological conditions. Both cases studies had a two-treatment (control and treatment) multi-locational design with the control not receiving any mineral or organic inputs.
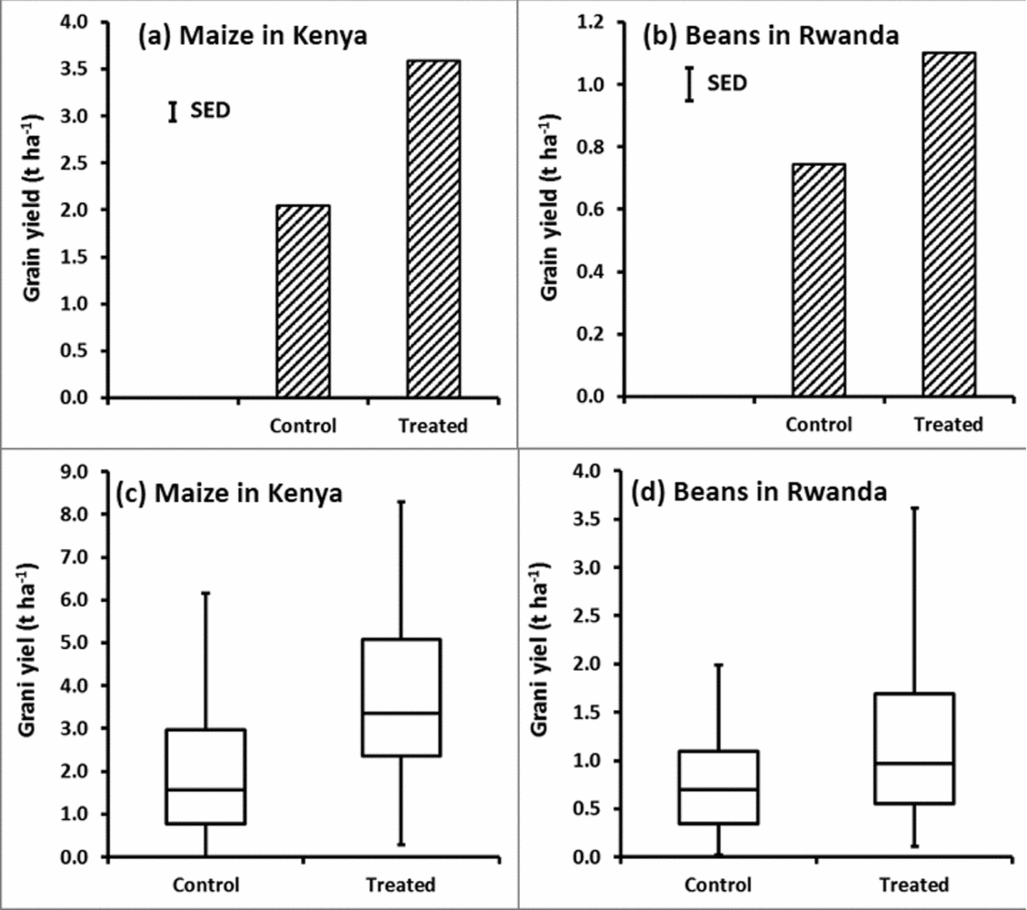
Using standard statistical approaches, results from the Kenya study showed an increase in average maize yield after application of NPKS fertilizer from 2.0 t ha−1 to 3.6 t ha−1 (Figure 1a), a mean increment of 1.6 t ha−1, with a standard error of this difference of means of 0.3 t ha−1. Such a difference would usually be reported as ‘highly significant, p < 0.001’. Similarly the Rwanda study showed a significant increase in bean yield after application of DAP fertilizer from 0.7 t ha−1 in the control to 1.1 t ha−1 in the treatment with fertilizer application (Figure 1b), a difference of 0.4 t ha−1 with an standard error of the difference of means of 0.1 t ha−1 (p < 0.001). Box-whisker plots indicate the ranges of yield data observed (Figure 1c and Figure 1d).
Average yields (1a, 1b) and yields presented in a box-whisker format (1c, 1d) for the Kenyan maize (1a, 1c) and the Rwandan bean (1b, 1d) data. ‘SED’ in 1a and 1b refers to ‘Standard Error of the Difference’.
The ‘significant’ treatment effects described in this section, through the standard way of reporting results, hide much information. Each farm has two plots with one replicate of each treatment randomly allocated to each plot. The usual analysis considers farms as blocks and uses a two-way analysis of variance (ANOVA) to look at the relative importance of treatment effects and to estimate the mean effect and its standard error. This corresponds to using the model
 $$\begin{equation}
{y_{ij\ }} = m + \ {f_i} + {t_j} + {\varepsilon _{ij}},
\end{equation}$$
$$\begin{equation}
{y_{ij\ }} = m + \ {f_i} + {t_j} + {\varepsilon _{ij}},
\end{equation}$$
with yij being the response (such as yield) of treatment j on farm i, m the overall mean yield, fi are farm effects, tj are treatment coefficients, and εij residual terms, assumed to have constant variance σ2. Interest focuses on the mean treatment effect
 $$\begin{equation}
t = \ {t_2} - {t_1}\ ,
\end{equation}$$
$$\begin{equation}
t = \ {t_2} - {t_1}\ ,
\end{equation}$$
with t being the difference between the expected values of the two treatments, t 2 being the expected value of the effect of treatment 2 and t 1 that of treatment 1. The assumption is that t is constant.
ALTERNATIVE ANALYSES OF THE SAME DATA
The same dataset can also be examined using alternative methods and revealing additional information embedded therein.
Cumulative frequency curves and confidence limits
The first method focuses on the variability of treatment effects across farms. Model (1) is replaced by
 $$\begin{equation}
{y_{ij\ }} = m + \ {f_i} + {t'_{ij}}\ + {\varepsilon _{ij}}.
\end{equation}$$
$$\begin{equation}
{y_{ij\ }} = m + \ {f_i} + {t'_{ij}}\ + {\varepsilon _{ij}}.
\end{equation}$$
Here t'ij is the parameter for treatment j on farm i. The treatment effect on farm i is
 $$\begin{equation}
{t'_i} = {t'_{i2}} - {t'_{i1}}\ .
\end{equation}$$
$$\begin{equation}
{t'_i} = {t'_{i2}} - {t'_{i1}}\ .
\end{equation}$$
The best estimate we have of these farm-level treatment effects is the difference in yield on each farm
 $$\begin{equation}
{d_i}\ = {\rm{\ }}{y_{i2}} - {y_{i1}} = \ {t'_i} + \ {\varepsilon '_i},
\end{equation}$$
$$\begin{equation}
{d_i}\ = {\rm{\ }}{y_{i2}} - {y_{i1}} = \ {t'_i} + \ {\varepsilon '_i},
\end{equation}$$
where
 $$\begin{equation}
{\varepsilon '_i} = {\varepsilon _{i2}} - \ {\varepsilon _{i1}}.
\end{equation}$$
$$\begin{equation}
{\varepsilon '_i} = {\varepsilon _{i2}} - \ {\varepsilon _{i1}}.
\end{equation}$$
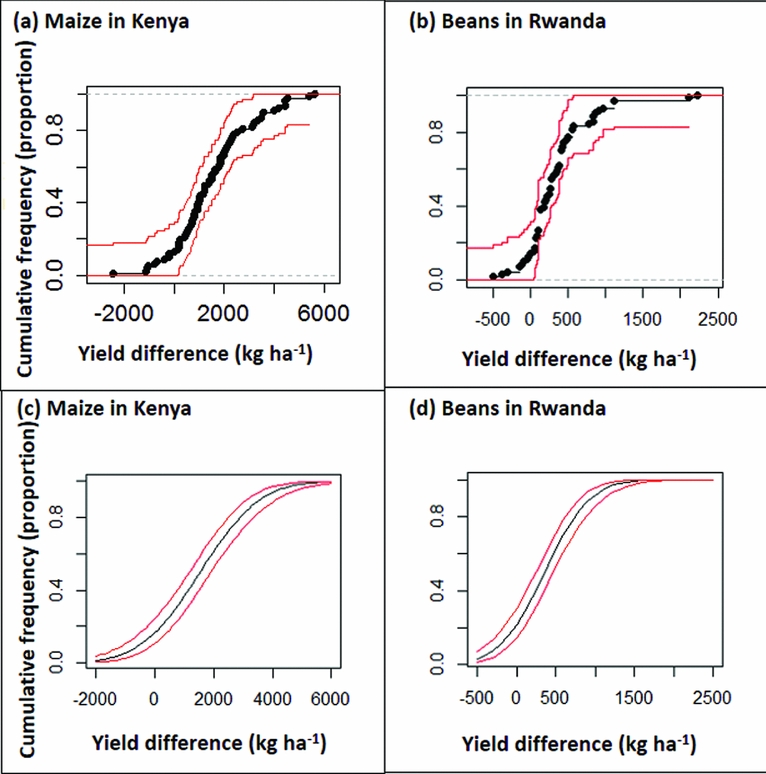
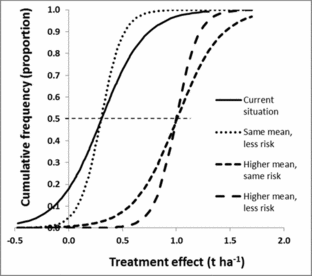
The quality of di as an estimate of t'i depends the size of the plot to plot variation represented by εij, as discussed below. Plotting the empirical cumulative distribution function by sorting the values of di into increasing order then plotting them against i/n shows the proportion (vertical axis) of the n farms that achieve a treatment effect of x or less (horizontal axis) (Figure 2a, Figure 2b). Confidence intervals can be drawn around this curve using the Kolmogorov-Smirnov D statistic, as implemented in the R package ‘SFSMISC’ (Figure 2a, Figure 2b) (Maechler, Reference Maechler2014).
Confidence intervals drawn around cumulative frequency curves using the Kolmogorov–Smirnov D statistic (2a, 2b) and normal distribution model (2c, 2d) for the maize study in Kenya (2a, 2c) and for the bean study in Rwanda (2b, 2d).
An alternative approach to estimating and drawing the cumulative distribution function is to assume a specific model (Figure 2c, Figure 2d). If di values are assumed to have a Normal distribution then the curve is
 $$\begin{equation}
p\left( x \right) = \Phi \left( {\frac{{x - t}}{{{s_t}}}} \right),
\end{equation}$$
$$\begin{equation}
p\left( x \right) = \Phi \left( {\frac{{x - t}}{{{s_t}}}} \right),
\end{equation}$$
where Φ is the cumulative density function for the standard normal distribution, t the mean of the di values and st their standard deviation. A confidence interval can be drawn around this curve by noting that if:
 $$\begin{equation}
z = \frac{{x - t}}{{{s_t}}}.
\end{equation}$$
$$\begin{equation}
z = \frac{{x - t}}{{{s_t}}}.
\end{equation}$$
Then
 $$\begin{equation}
se\left( z \right) \approx \sqrt {\frac{1}{n} + \frac{{{{\left( {x - t} \right)}^2}}}{{2{s_t}^2\left( {n - 1} \right)}}{\rm{\ \ \ }}} ,
\end{equation}$$
$$\begin{equation}
se\left( z \right) \approx \sqrt {\frac{1}{n} + \frac{{{{\left( {x - t} \right)}^2}}}{{2{s_t}^2\left( {n - 1} \right)}}{\rm{\ \ \ }}} ,
\end{equation}$$
with the approximate 95% confidence limits being Φ (z ± 2se(z)) (Figure 2c, Figure 2d).
There are advantages and disadvantages of either the empirical or model-based cumulative distribution curve. The empirical curve has wider confidence limits, particularly at the extremes; if you want to estimate risks at the lower or upper end of the scale you need large n and a lot of farms. On the other hand, the model-based estimates and their confidence limits are conditional on the model being appropriate, and will be biased if not. The Normal distribution model used here has the characteristic of being symmetrical, whereas the distribution of treatment effects across farms is often skewed, with a few farms showing large positive effects. If the distribution is skewed then the normal model would not be appropriate. Drawing confidence intervals around frequency curves emphasises that these are estimates and there is necessarily uncertainty associated with them (Figure 2). It also shows that with the sample sizes in these experiments (77 and 71 farms for the maize and beans trials respectively), good estimates are obtained for risks in the middle of the range, but the confidence interval is wide in the upper and lower tail. A lot of observations are needed to estimate the more extreme risks, with implications for the design of such experiments, as discussed below. The model-based estimates give good precision in the extremes, but are biased unless the model assumptions are realistic. If the used model is a poor fit then an option would be to find an alternative model that better describes the distribution of the data.
Variation and risk
The cumulative frequency curves for data from the maize and bean datasets show that while the mean increments are clear and positive, there is large variation between farms in yields and the size of the treatment effects. Presenting the information this way highlights the risk to farmers. The treatment effect in an experiment on a given farm is the best estimate we have of what would happen to yields if that farmer changed practice from the control to the new treatment. For the maize database, only 6/77 (or 8%) of the farms had an increment within 10% of the mean increase of 1.5 t ha−1. On 10% of the farms, an increase of over 4 t ha−1 was observed, while on 10% of the farms a reduction in yield was observed with the new treatment. For the bean database, the figures were similar (6% of the farms fell within 10% of the mean, on 14% a decrease was observed while on 5% there was an increase of >1 t ha−1). A farmer's decision to switch to the new treatment would be based on many criteria, but a main purpose for trials such as these is to generate recommendations. If the mean increment were reported and used as the basis for a recommendation then most farmers would see very different results. The variation in treatment effect across farms represents risk or opportunity and should not be ignored.
Relevance of within plot variation
The experimental designs used (and recommended – see below) have one replicate per farm. Thus in equation (3), t′ij cannot be distinguished from εij. We interpret di as representing the effect of the treatment as experienced on farm i. However, if εij is large then di would mainly be due to variation within the field. Traditional experimental designs are replicated within one field so that the within field, between plot variance σ2 of ε, can be estimated. If an experiment with two treatments is to be able to generate an estimate of σ2 then at least 9 reps are needed, giving 8 degrees of freedom for estimating the within-field variance σ2, the absolute minimum of a useful estimate (Mead, Reference Mead1988). This would not be realistic for farmers and actually does not make scientific sense for two reasons. First, the resources spent on replication within one field would generate more information if used to sample more of the variation among fields so as to learn more about variation in ti and the factors that influence it. We consider 1 replicate in each of 70 farms far more informative than 7 reps on just 10 farms. Second, these fields are often small and the experimental plots relatively large. Even if the fields are large, researchers and farmers can take steps to make sure the experimental plots are relatively homogeneous before treatments are applied, as farmers usually understand patterns of within-field variation. Hence, the variation between plots of the same treatment within one field would often not be large. There could be exceptions, for instance under slash-and-burn agriculture (Ortiz, Reference Ortiz1995), or in the Sahel (Voortman et al., Reference Voortman, Brouwer and Albersen2004), where substantial variability over short distances can be observed, thus necessitating the use of relatively large plots.
If the variation in treatment effects across farms (t′i) is σt 2 then the best estimate of t′i is t'si, the BLUP, Robinson (Reference Robinson1991):
 $$\begin{equation}
{t'_{si}} = \frac{{\sigma _t^2}}{{\sigma _t^2 + {\sigma ^2}}}{d_i}.
\end{equation}$$
$$\begin{equation}
{t'_{si}} = \frac{{\sigma _t^2}}{{\sigma _t^2 + {\sigma ^2}}}{d_i}.
\end{equation}$$
The estimates in equation (10) are the estimates we use shrunk by a factor which depends on the size of the within-field variation. As an example, in our maize trial the factor is 0.97, 0.89 and 0.78 for within-field coefficients of variation (CV) of 10, 20 and 30% respectively. Thus even with higher CV values, the treatment variation is still substantial and our interpretation realistic. If the plot to plot variation within a field becomes much larger than that, then the estimates di does not give a good estimate of t'i and the design is not suitable for looking at farm to farm variation in treatment effect.
Explaining variation
With such strong variation from farm to farm in treatment effect, an aim of data analysis should be to explain the variation. If we had measured relevant characteristics of each farm then exploring those that are related to ti would be possible. Hence deciding what characteristics should be measured, and choosing the design to make the approach as useful as possible, should be a priority, as discussed below. In the two data sets, we have limited information that can be used to explain variation. One variable that is an indicator of differences between farms is the yield on the control plots. The data can be divided into groups of low, moderate and high control yield and the risk curve estimated for each group (Figure 3) (Bielders and Gérard, Reference Bielders and Gérard2015; Ronner et al., Reference Ronner, Franke, Vanlauwe, Dianda, Edeh, Ukem, Bala, van Heerwaarden and Giller2016). Both the mean or median treatment effect and the variance differ among these groups.
Cumulative frequency curves for all data and for three groups of control yields for the maize dataset in Kenya (a) and the bean dataset in Rwanda (b).

Rather than an arbitrary division into groups, the relationship between the performances of the two treatments can be examined graphically by, plotting y i2 against y i1. This is easiest to interpret when t 1 is a control or baseline treatment. Using equation (3):
 $$\begin{equation}
{y_{i2}} = {y_{i1}} + {t'_i} + \ {\varepsilon '_i},
\end{equation}$$
$$\begin{equation}
{y_{i2}} = {y_{i1}} + {t'_i} + \ {\varepsilon '_i},
\end{equation}$$
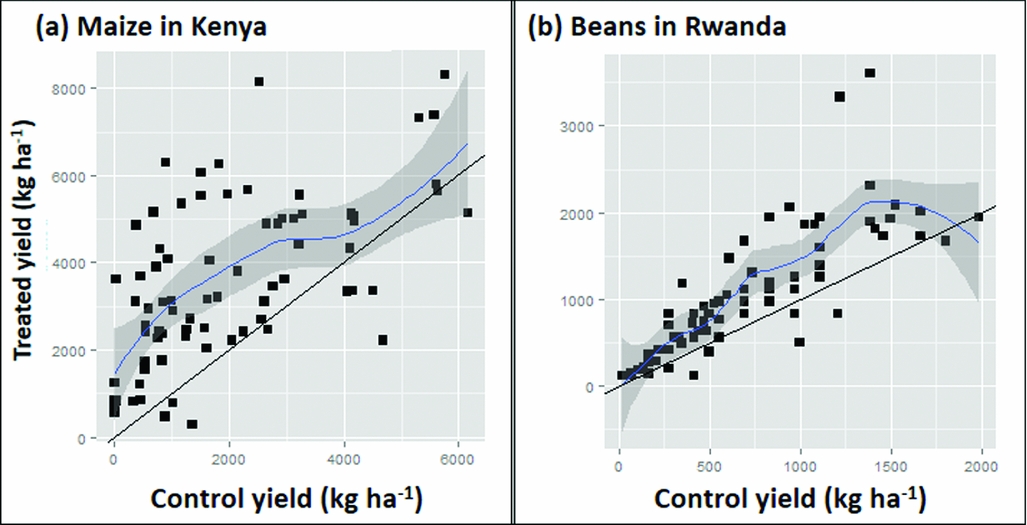
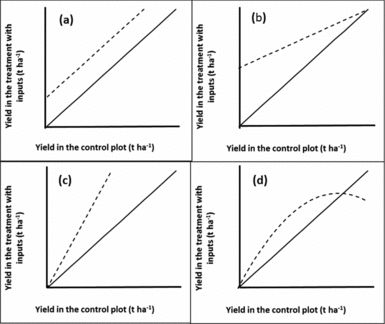
where ε i = εi2-εi1 is an error term. Hence, if there was no treatment effect the graph would be a scatter around the 1:1 line. If there was a constant treatment effect t the graph would show a scatter around the line with slope 1 and intercept t (Figure 4a). A common departure from a constant treatment effect is for the size of the treatment effect to depend on the yield of the control treatment as this represents ‘plot quality’. Hence, we could group observations by the control yield, and find the mean effect for each group, or, less arbitrarily, put a smooth curve through the scatter plot. Other possible shapes of curves are illustrated in Figure 4. Figure 4d seems to be most typical for soil fertility treatments although Figure 4b is what one might hope for to have impact on the plots in need of the most nutrients. In Figure 5 we drew a smooth curve using local polynomial regression as implemented in R (R Core team, 2014). The responses in our data (Figure 5) are most similar to Figure 4d. For maize, the mean treatment effect is small and positive at the lower end, roughly constant until control yields of about 3 t ha−1, then decreases to zero. For beans, there is no treatment effect on the least productive plots. It increases gradually until control yields are about 2 t ha−1 and then decreases to zero. In both cases, a low or non-existent treatment effect is seen on the poorer plots as is commonly observed. Soils in such fields are often referred to as ‘non-responsive soils’ (Vanlauwe et al., Reference Vanlauwe, Bationo, Chianu, Giller, Merckx, Mokwunye, Ohiokpehai, Pypers, Tabo, Shepherd, Smaling, Woomer and Sanginga2010). On the best performing fields yields are reaching those attainable with the technology and yield increases with addition of extra nutrients are not to be expected.
Possible responses (dashed lines) when observations on a treated plot (vertical axis) are plotted against the control or baseline on the same farm (horizontal axis). (a): constant treatment effect; (b): positive treatment effect on the poorest plots that decreases with plot quality; (c): positive treatment effect that increases with plot quality and (d): treatment effect is zero on the poorest plots, then positive, then negative on the best plots. The solid line indicates the 1:1 line.

Scatter graphs plotting yield in the treatments with fertilizer application against control yields with addition of modelled response curves and confidence intervals for the Kenya maize (a) and the Rwanda bean (b) datasets.
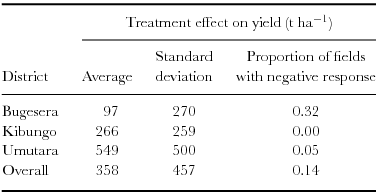
The bean yield data set from Rwanda has one more source of information that can be used to give insights into the variation in treatment effect across farms since the study took place in three different zones. Both mean and variation in treatment effect and the chance of observing a negative effect differ between zones (Table 2).
Treatment effects (yield with di-ammonium phosphate minus control yield) by district for beans in Rwanda.
FROM MEASURING VARIATION TO GENERATING NUANCED RECOMMENDATIONS
Modifying cumulative frequency curves
Best bet recommendations to farmers on crop management options are typically based on results of trials analysed and reported in the classical way, using means. While other information, such as farmer and economic assessments may get used, the basic quantitative assessments of the value of new practices are usually determined with such information. But with the large variation between farms these mean-based recommendations are misleading. Few farmers experience changes close to the mean, with some realising much more benefit and others much less. An aim of research should be to change the situation so that recommendations and predicted outcomes are more reliable for more people and/or land. This requires explaining or understanding sources of the variation displayed in the risk curve – factors that contribute to a specific farm being towards the lower or upper end of the curve. If a farmer would consider switching management from that represented by the control to that represented by the treatment with a known likelihood on where its effect might fall on the cumulative frequency curve, then he or she can use that information in at least two ways. First, if the factor is within the farmer's control (e.g. a management factor such as planting time relative to other crops), he or she can choose to use appropriate levels; and second, if the factor is out of the farmer's control (e.g. soil type) then he or she can choose not to make the switch.
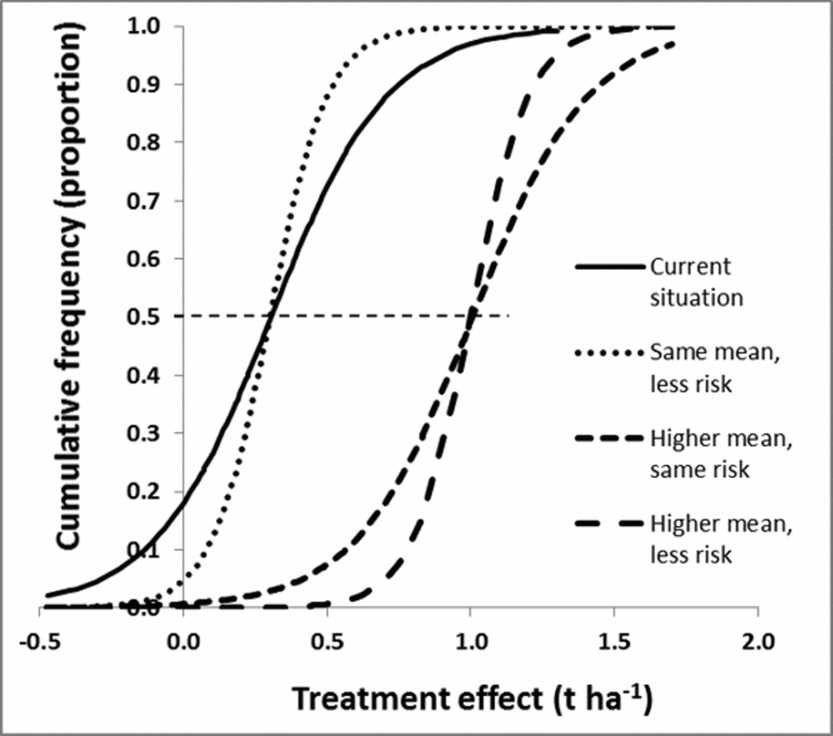
A refined understanding of what the main causes for the observed variation results in modified cumulative frequency curves. The risk of a poor result (e.g. negative effect on production) can be reduced by shifting the cumulative frequency curve to the right, making it straighter, or both (Figure 6). Shifting the curve horizontally corresponds to changing the mean while making it straighter is a reduction in variance. It would also be possible to change the shape, for example reducing the chance of an extremely low response, corresponding to pulling in the lower tail of the curve. In practice, the refined information about the practice will replace the single risk curve with several curves, each conditional on either ecological or management factors. Results from both case studies provide examples (Figure 3). Since these curves generate different information and recommendations for fields with current low, medium and high productivity, a uniform recommendation would be replaced by field type-specific recommendations.
Improved recommendations could include moving the cumulative frequency curve to the right (resulting in higher treatment effects for similar proportions, creating a more vertical curve (resulting in a more predictive recommendations, or a combination of both). The horizontal dashed line intersects the cumulative frequency curves at mean x-values.
Towards a framework for increasing the robustness of recommendations
A strategy for investigating the generic problem described so far is presented in this section and Figure 7. The process is iterative, with evolving research questions and multiple rounds of experimentation. Researchers hypothesize that some new options, e.g., soil fertility management practices, will be of use to farmers and proceed to design and set out trials to investigate and demonstrate their effect. In most agronomic experiments the options being considered define the treatments of the experiment. As we see below, other factors might also determine treatments, so we use the term ‘options’ here to describe the alternative or new practices being studied. The starting point is to define the target area and population for which results are needed. We know that the options being investigated will interact with the biophysical, social and economic context which we refer to collectively here as the ‘context’. The limits to those contexts being considered by the research have to be defined; otherwise the problem of design is intractable since there is always another context to investigate. The target can be defined both geographically (e.g. land between 1,000 and 1,800 masl in Kenya) or by reference to a population (e.g. farmers with less than 2 ha of land who grow maize as a staple crop) within a geographically defined area. The trial objectives are set in the usual way but will include exploring, understanding or testing hypotheses about the nature of the interactions between the options and contexts (O × C interactions). The hypotheses might refer to biophysical responses (such as crop yield), farmers’ current management, farmers’ available resources and their preferences. The experimental design problems are much the same whichever is measured. If no O × C interactions were hypothesized then the trial could go ahead with a simple design of each farmer having one replicate of each treatment. Lack of hypothesized (or prior knowledge of) interactions means it makes no difference which farms or farmers are included. They can be a random sample or, more practical and more common, volunteers from groups of farmers with whom extension organizations work.
A proposed model for integrating heterogeneity into initiatives aiming at developing site-specific soil fertility management recommendations for smallholder farmers. ‘O × C’ stands for Option × Context interactions.
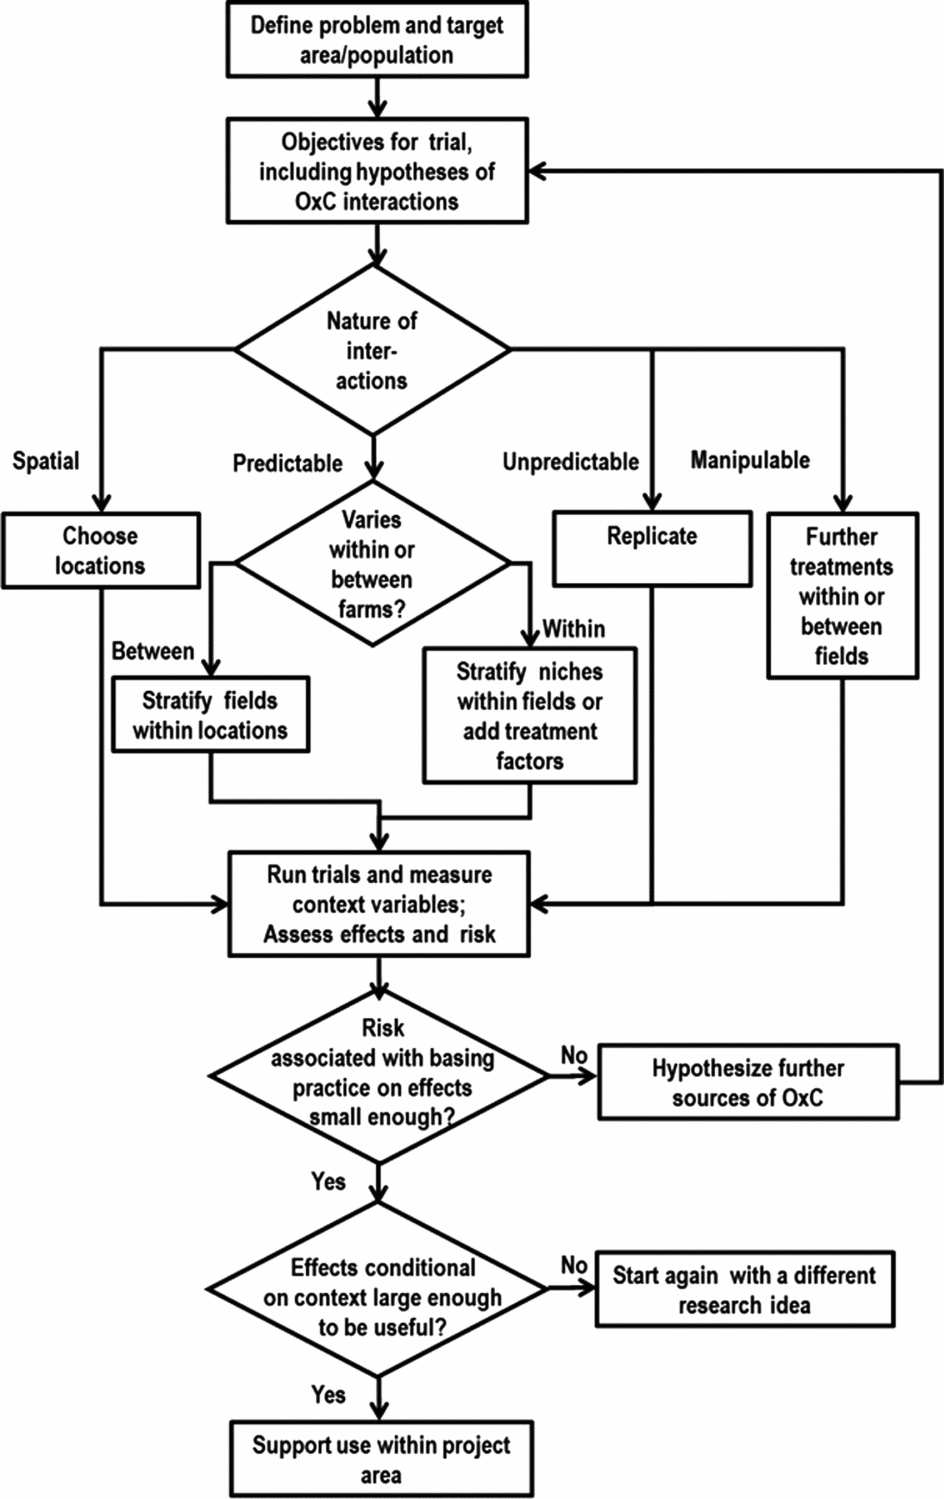
If O × C interactions are expected to be important, the experimental design possibilities depend on the nature of the factors hypothesized to interact with those options. These are of three main types with different design possibilities (Figure 7). First, mappable factors are those defined by geographical position so that it is possible to point to a location on a map and predict what the value of the factor is at that location with high precision. An example is agro-ecological zone. These factors are used to define locations for the trial. A factor such as soil P status may in principle be mappable, and high resolution maps of soil properties are being produced (www.africasoils.net). But these are unlikely to be sufficiently precise to use them for choosing locations at fine scale (van Apeldoorn et al., Reference van Apeldoorn, Kempen, Bartholomeus, Rusinamhodzi, Zingore, Sonneveld, Kok and Giller2014). Second, predictable but not mappable factors are those that are predictable in the sense that they do not change (at least during the timescale of a typical experiment) but cannot be predicted from a map. The experimental design uses stratification to cope with these. Predictable factors may vary between farms or farmers, such as farmer gender and resource level. The design might then deliberately include low, medium and high resourced farmers or each gender. But they may also include factors that vary within a farm, e.g., fields close and far from the homestead or those classed by farmers as poor and better soil fertility. The trial design could then include comparisons of strata within farms, which will generally be more precise than among farms. It might also be easier to organize, as the researchers do not have to negotiate with so many farmers. Third, unpredictable factors are those for which their level is not known until after the experiment is done. Examples include the weather, pest outbreaks or quality of plot management. The only design option here is to replicate in space and time so that there are enough farms to sample the variation.
There are also context factors hypothesized to influence results that could become treatment factors because they can be manipulated and randomly assigned to plots (Figure 7). An example is planting date. If some farmers plant early and some late for a growing season with normal rainfall then this could be included as a ‘predictable’ factor, with some farmers agreeing to plant early and others late. But it would be more efficient to include it as a randomized treatment on at least some of the farms. If a factor such as planting date is not considered during the design and left for farmers to choose it will be an ‘unpredictable’ factor. If the factor does interact with treatment effects (i.e., the difference in performance of two treatments depends on planting date) then variable planting dates will contribute to the uncertainty of the results. If the influence of the factor is anticipated to be important, it can then be shifted to another category. The best precision will be obtained when the factor is included as a treatment factor, so that plots are deliberately planted early or late (with the planting dates suitably defined). Such a factor could be included in the treatment set within one farm or field (with the benefits of precision and a richer set of results from each farm), or across different farms (with the benefits of keeping trials simpler and smaller for an individual farmer). Note that the same decision does not have to be made for all farms – if some farmers would be interested in a larger treatment set then they could include different planting dates while others use a single planting date.
The overall number of farms needed for a trial will depend on the number of categories in the list of context factors to be investigated. A rule of thumb might be to include at least 20 farms of each category, this sample size giving good information on the remaining farm to farm variability within each context category. The principal way in which running such trials differs from the norm is that the context factors that are hypothesized to interact in determining the outcomes have to be measured and recorded (Figure 7). These include all those factors hypothesized at the design stage and built into the design of the three above types. It is tempting to measure more variables that ‘might be interesting’, but this is a flawed approach. If you have a strong hunch that there are further context variables that could be important in interactions, then include them in the design process above or you will probably not end up with an efficient design for understanding their effect. If there really is no basis for these interacting with options then measuring them is a wasted effort. There may be other factors that become apparent during the season. If inspection of field plots during the season suggests variation in treatment effects between farms that are expected to be similar then researchers need to (a) hypothesize the reasons for this and (b) add variables to the planned measurements that will allow the hypothesis to be examined at analysis time. Principles of treatment design can be used to improve the effectiveness of designs. Examples include the use of factorial combinations of context factors and suitable chosen fractions of these, and guidelines for choosing experimental levels of continuous factors. There will inevitably be complexities and questions of design that are hard to resolve, such as how to deal with context factors that are highly correlated, such as different soil properties. But awareness of the principles of design and the approaches to context factors of different types described here can lead to experimental designs that are much more efficient and effective than arbitrary or random selection of farms and plots to include.
The analysis of results should include estimating the size of treatment effects for each combination of context factors hypothesized and confirmed to be important, along with the unexplained variation across field or farms (Figure 7). With either approach, the risk or uncertainly is the residual or unexplained variation between fields or farms in treatment effect. There are two outcomes to the calculation of this risk, phrased as answers to the question ‘Is the risk or unexplained field to field or farm to farm variation in treatment effect sufficiently small?’ If the answer is ‘yes’, then knowing the context gives a good prediction of the treatment effect. In this case, interpretation can be along the usual lines. That means we decide if those treatment effects, conditional on context, are large enough to be ‘useful’, i.e. make a difference to farmers, be economically viable, override other constraints, etc., and then we can make these available for dissemination. If the answer is ‘no’, then the variation between fields or farms in treatment effect is still large, so that information on the effect of any treatment on an individual field or farm is too uncertain to make recommendations and decisions. In this case, it is necessary to hypothesize further factors responsible for the variation and start a further round of experimentation.
Ideas on what the factors could be may come from scientific knowledge and researchers’ observations during the season, or from farmers’ knowledge. For instance, a soil fertility management project in Malawi found large farm-to-farm variation in the effects of legume intercropping on maize yields. Scientists hypothesized soil factors were responsible, particularly SOC and P. The project also used a ‘participatory analysis of variance’ (PANOVA) method and farmers suggested the main source of variation was quality of plot management (land preparation, planting time, weeding time and thoroughness). These factors were then included in the following season, the soil variables as ‘predictable’ and the plot management quality as an unpredictable factor that was measured with a standard, simple questionnaire (W Mhango, personal communication). In our example with beans, farmers, technicians or researchers might have insights into reasons behind the two outliers in Figure 5b that have unusually strong responses to the treatment.
Exploring data often reveals location effects, such as in our bean dataset (Table 2). Understanding the source of location effects should be another route to generating O × C hypotheses. In our case the mean response in Bugesera was weak, but the response on some farms in that location was strong. So information on the factors that lead to weak and strong response in Bugesera is needed as well as explanations for the differences between places. Conclusions that in ‘place x the effect is different from place y’ is unsatisfactory as it gives no hint as to what might happen at other places. Hypotheses of the mechanisms behind place effects need to be developed and tested with suitable designs. If the hypothesized factors only vary between ‘places’ – such as length of growing period – then additional places will need to be included in the design.
Path-dependence in soil management is common: responses in one season depend on management and responses to it in previous seasons. If previous management is believed to be a major source of variation then hypotheses have to be formulated and tested. These might be in terms of past management practices (e.g. distinguishing whether the crop last system was the same of different from this season, or the length of time since the farm was converted from forest), measurable soil conditions (e.g. the soil organic carbon content), historical production levels, or perhaps farmers’ soil classification. The principles of designing the trial to test such hypotheses are the same in each case.
One way to analyse such highly variable responses to experimental treatments to gain insights for generating hypotheses is to use boundary lines fitted to the maximum response values across the range of yields for a range of yield-determining factors (e.g. Fermont et al., Reference Fermont, van Asten, Tittonell, van Wijk and Giller2009; van Asten et al., Reference Van Asten, Wopereis, Haefele, Isselmou and Kropff2003). The boundary line represents the largest response expected for a given value of a yield determining factor, such as availability of a given nutrient, and points falling below the boundary line are assumed to be limited by one of the other measured factors, for example, availability of another nutrient or the incidence of an important pest or disease. By comparing the boundary lines drawn when yields are plotted against a range of factors, the relative contribution of these factors to the yield gap can be estimated. Appropriate data analysis methods depend on the details of the design, the context variables measured and the hypotheses of interactions. In the simplest case, with two treatments and all context variables measured at farm level, the analysis is easiest if based on differences (equation 4). The aim of the statistical methods is to relate differences the di to measured context variables. Regression models – linear or non-linear as appropriate – are the principal tool. If large datasets (numbers of farms) are available then pattern discovery methods such as random forests (Breiman, Reference Breiman2001) may be used. Compared to the more traditional regression methods, these have the advantages of identifying and describing complex interactions and the disadvantages of not being based on process understanding or hypotheses and requiring large samples.
Practical considerations
The large number of trial sites or farmer plots needed to conduct the above experiments means that experimental procedures have to be simple with farmers taking a larger role in some of the bottleneck-points in running the trial, including trial management and data collection. Related to trial management, since specific management components may require a minimal level of standardization, aligned to the treatment structure of the trials, training and data collection structures operating between the researcher and a participating farming family may be required. Such structures are often facilitated through (non)governmental organizations ((N)GOs) working with farmer groups, cooperatives, saving clubs or other social organizations who are self-selected or formed around a particular goal. Having NGOs facilitating the capture of scientific data of sufficient quality often poses a major practical hurdle in implementing the strategy in Figure 7. That said, such multi-locational trials with a large number of replicates have been previously implemented (Giller et al., Reference Giller, Franke, Abaidoo, Baijukya, Bala, Boahen, Dashiell, Kantengwa, Sanginga, Sanginga, Simmons, Turner, de Wolf, Woomer, Vanlauwe, Vanlauwe, Van Asten and Blomme2013; Ronner et al., Reference Ronner, Franke, Vanlauwe, Dianda, Edeh, Ukem, Bala, van Heerwaarden and Giller2016) and Figure 7 aims to increase the efficiency of such future trails.
While we may have the analytical tools, ensuring the collection of quality data is a major problem of multi-locational trials which are implemented by development partners. The logistical challenges of large numbers of trial sites spread across wide geographical areas, the number of operators involved and difficulties of standardising measurements, recording and entry should not be underestimated. A strategic choice must be taken to measure a limited number of variables based on clear questions and hypotheses rather than collecting data for data's sake.
The large number of trial sites also favours a model built around existing social organizations which are often formed around specific objectives precluding representation of the overall farming community. For instance in the study of Franke et al. (this volume), one group of farmers was supported by an NGO specifically focused on disadvantaged woman farmers. This resulted in a set of poor soil fertility fields representative of that farmer group, but probably not representative of the broader population of farms in that village as a whole. Since specific options as well as context likely interact with farmer's resource endowments and production objectives (Tittonell et al., Reference Tittonell, Muriuki, Shepherd, Mugendi, Kaizzi, Okeyo, Verchot, Coe and Vanlauwe2010) and attitudes towards farming (www.tnsglobal.com), considering the type of farming family with whom to engage is a critical component of defining the target population (see above). Limitations of existing social structures in terms of social inclusiveness may thus pose a practical limitation to the implementation of what would be a theoretically sound strategy. Nelson et al. (this volume) propose a ‘farmer research network’ approach to making large-scale experimentation feasible.
CONCLUSIONS
The dependence of researchers on a limited range of formal experimental designs has become a straightjacket when it comes to understanding responses in farmers’ fields. Despite our improved understanding of the complexity of smallholder farming systems and the fact that the Green Book (Patel et al., Reference Patel, Muir-Leresche, Coe and Hainsworth2004) has been around for a decade, the next generation of agricultural scientists is still trained in a classical mode to strive to reduce variability and focus on single factors. In this paper, we explored a range of approaches to allow agronomic research to explore the full range of factors that determine crop productivity in the real world.
Nowadays, it is generally acknowledged that farmers need to be integrated in the development and validation of improved agronomy options. It is also recognised that smallholder farming environments are notoriously heterogeneous as exemplified by a large variation in soil fertility conditions, and that farms and farmers all have different characteristics, so they cannot usefully be considered as ‘replicates’ of anything. Cumulative frequency curves based on trials carried out over a relatively large number of farms allow interpretation of the risk associated with a specific alternative agronomy option. Datasets from case studies showed that only a small proportion of fields generated results that are within 10% of the mean effects. A strategy based on anticipated interactions between alternative agronomy options and farming context is proposed with spatially ‘mappable’, predicable ‘un-mappable’ and unpredictable interactions driving a (multi-season) R4D process based on stratification, modified treatment structures and priority observations, ultimately resulting in recommendations with acceptable treatment effects and associated risk. Practical considerations will need to guide the implementation of this theoretical framework.
While we provide suggestions on how to move forward with understanding the complexity of crop responses to interventions on smallholder farms, we do not claim to have arrived at a perfect understanding of how to deal with all the issues. This leaves a rich set of new questions to guide future on-farm research. With the move to place agronomy research on-farm, the issue of variation and variability in responses takes centre stage. We should embrace rather than avoid the diversity of treatment responses to gain a fuller understanding of current context and its dependence on past management.
Acknowledgements
We thank the Rockefeller Foundation, and more specifically Dr John Lynam, who was one of the first investors in an initiative aiming at unravelling heterogeneity in smallholder production systems. We also acknowledge the Belgian Directorate General for Development and the Bill & Melinda Gates Foundation for their support to our work on adapting soil fertility management to smallholder farmers’ conditions.


 Open access