




Introduction
Soil fertility loss remains a significant constraint to agricultural productivity in most of sub-Saharan Africa, where smallholder farmers face declining yields due to limited access to inputs (Wilfred, Reference Wilfred1996). Low soil fertility is aggravated by continuous cultivation, inadequate soil fertility management, and the improper application of organic and inorganic fertilizers (Amare and Melkamu, Reference Amare and Melkamu2020; Berhane et al., Reference Berhane, Fassil, Shimbahri, Ibrahim, Zenebe and Lindsey2017). As a result, smallholder farmers are affected in a cycle of declining productivity and soil degradation, which hinders food security and rural livelihoods (Gebeyanesh et al., Reference Gebeyanesh, Debela, Dong-Gill and Bettina2021). The principle of 4R nutrient stewardship – that is, applying the right source of fertilizer at the right rate, at the right time, and in the right place is crucial for enhancing crop productivity and maintaining soil fertility (Gete et al., Reference Gete, Getachew, Dejene and Shahid2010). This approach enhances nutrient use efficiency by ensuring that nutrients are matched to crop needs and soil characteristics, thereby minimizing nutrient losses and reducing environmental impacts. In Ethiopia, the blanket fertilizer recommendations have been in place for decades as part of agricultural intensification strategies (IFDC, 2018). However, the generalized blanket recommendations have been criticized for overlooking heterogeneity factors, such as landscape position, crop type, and soil fertility across different agroecological conditions (Alemu et al., Reference Alemu, Wassie and Mesfin2022; Girma et al., Reference Girma, Sofia, Tsadik, Kefyalew, Hailemariam, Getachew, Wuletawu, Degife, Gudeta and Teklu2022; Wuletawu et al., Reference Wuletawu, Lulseged, Kindie, Daniel, Hugo, Teklu, Job, Jemal, Tilahun and Julian2022). This limitation has become more pressing due to the recent fertilizer supply shortages and rising prices, which need efficient, site-specific, and economically feasible fertilizer recommendations to optimize both productivity and resource use (Ekero et al., Reference Ekero, Wassie, Alemu and Mesfin2021).
Recent initiatives, such as the Ethiopian Soil Information System (EthioSIS) and decision-support tools promoted by ATI, IFDC, and ICRISAT, have advanced the efforts to develop more location-specific fertilizer recommendations. However, research evidence indicates considerable variability in crop response to fertilizer across different soils and landscape positions, particularly for cereal crops such as teff (Eragrostis tef [Zucc.] Trotter) and sorghum (Sorghum bicolor [L.] Moench) (IFDC, 2018; Magen, Reference Magen2008). Nutrient omission trials are an effective tool for estimating site-specific nutrient limitations and refining fertilizer recommendations under varying agroecological conditions (Abebe et al., Reference Abebe, Demsew, Getachew, Wubayehu and Tesema2025).
These experiments build on these efforts by conducting nutrient omission trials for teff and sorghum across diverse landscape positions in selected districts of the Amhara Region. This study accounted for context-specific fertilizer options for dryland farming systems within the 4R framework and the current national fertilizer recommendations. Therefore, this study aims to evaluate the economic feasibility of nutrient omission-based fertilizer recommendations for major cereal crops (teff and sorghum) across different landscape positions in Northeastern Amhara, Ethiopia, to identify economically optimal nutrient management options for dryland farming systems.
Materials and methods
Description of the study areas
The research was conducted in the northeastern part of the Amhara Region, specifically in Sekota, Tehuledere, and West Belesa districts. In all three districts, more than 85% of the population relies primarily on mixed crop–livestock farming systems for their livelihoods.
Sekota district, located in the Wag-Himra Zone, lies approximately 720 km from Addis Ababa and 420 km from Bahir Dar. The district is situated at an altitude ranging from 1,500 to 2,200 m above sea level (m.a.s.l.) and receives an annual rainfall of 350–650 mm. Geographically, it extends between 12°23′ and 13°16′ N latitude and 38°44′ and 39°21′ E longitude (Kalayu et al., Reference Lawrence and Kate2017). The mean annual minimum and maximum temperatures are 12.7°C and 27.4°C, respectively (Melak et al., Reference Melak, Sebnie, Esubalew, Lamesgn, Abera and Asmelie2024).
Tehuledere district, found in the South Wollo Zone of the Amhara Region, is located about 255.9 km from Addis Ababa and 276.3 km from Bahir Dar. The district has an altitude range of 1,488 to 2,900 m.a.s.l. and receives a mean annual rainfall of approximately 1,030 mm (Mohammed, Reference Mohammed2013). Geographically, it is situated at 11°17′ N latitude and 39°42′ E longitude (Wassie et al., Reference Wassie, Pauline, Workneh, King, Kloos, Aragie, Ahmed, Tesfye, Ahmed and Pauline2018). The mean annual temperature is 18.9°C (Worku and Yalew, Reference Worku and Yalew2024).
West Belesa district, part of the Central Gondar Zone, is located about 784 km northwest of Addis Ababa and 207 km from Bahir Dar (Tsegaye et al., Reference Tsegaye, Mengistu and Shimeka2018). The district’s altitude ranges from 1,100 to 2,350 m.a.s.l., with annual rainfall between 800 and 1,200 mm. Geographically, it lies between 12°13′ and 12°41′ N latitude and 37°37′ and 38°03′ E longitude (Beyadegie et al., Reference Beyadegie, Semachew, Atikilt, Solomon, Eshetu, Mesfin, Yohans and Aynalem2024). The mean annual temperature ranges from 13°C to 35°C (Ahmed et al., Reference Ahmed, Tesfye and Mohammed2022).
Experimental designs
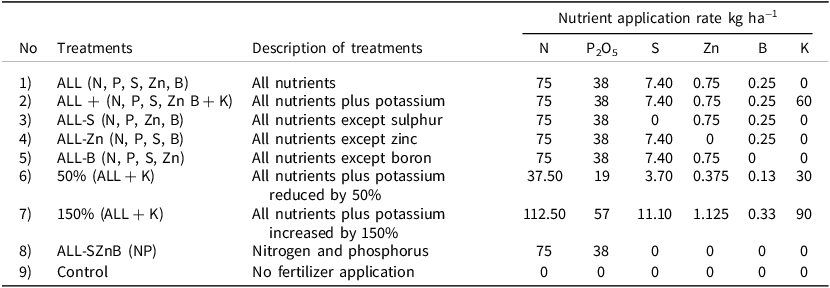
The experiments were conducted under three landscape positions (hill slope: >15%, mid slope: 5–15%, and foot slope: <5%) (Samuel et al., Reference Samuel, Kassa, Habtemariam and Getachew2023), for both crop types (teff and sorghum), across all treatments and districts. Experiments were conducted in the same season on 24 farmer fields per district, with 12 for teff and 12 for sorghum. The experiments were arranged in a randomized complete block design (RCBD) with three replications across all landscape positions. The experiment included nine treatments, including a control (Table 1). The omitted nutrients were S, Zn, and B, whereas the ‘ALL’ treatment included N, P, S, Zn, and B, and potassium (K) was evaluated as an addition (ALL + K) treatment rather than as an omission treatment.
Treatment types and description

Table 1. Long description
The table presents a comparison of nutrient application rates for various treatments in agricultural experiments. It includes nine different treatments, each with a specific combination of nutrients applied at different rates. The treatments are described in terms of the nutrients included or omitted, such as nitrogen (N), phosphorus (P), sulfur (S), zinc (Zn), boron (B), and potassium (K). The table has nine rows and seven columns. The columns are labeled as follows: No, Treatments, Description of treatments, and Nutrient application rate per hectare for N, P2O5, S, Zn, B, and K. Each row provides details on the specific treatment, its description, and the corresponding nutrient application rates in kilograms per hectare. For example, the first treatment includes all nutrients with specific rates for each nutrient, while the second treatment adds potassium to the mix. The table also includes a control treatment with no fertilizer application. Notable trends include variations in nutrient application rates across different treatments, with some treatments omitting specific nutrients and others adding potassium. The data provides insights into the experimental design and nutrient management strategies for teff and sorghum crops across different landscape positions.
Note: N = nitrogen; P = phosphors; S= sulphur; Zn= zinc; B = boron; K = potassium.
The land was selected, prepared, and levelled carefully before planting. The plot size for sorghum was 4.5 m x 3 m, and the spacing between plants, rows, and blocks was 0.15, 0.75, and 1 m, respectively. The plot size for teff was 4 m x 3 m, and the spacing between rows, plots, and blocks was 0.20, 0.50, and 1.0 m, respectively. Teff was planted during the first week of July, whereas sorghum was planted at the end of June. The agronomic practices and plant population within each plot were managed according to crop-specific agronomic recommendations.
The source of nutrients was urea for nitrogen, TSP for phosphorus, KCl for potassium, MgSO4 for sulphur, Zn-EDTA (granular) for zinc, and borax (granular) for boron (Agegnehu, Reference Agegnehu2021; Workat et al., Reference Workat, Melak, Esubalew, Feyisa, Kendie, Agegnehu and Desta2025). Urea application was split into two: half at planting and half within 30–35 days after planting.
Data collection
All agronomic and economic data were recorded from site selection to harvesting. The collected data included above-ground biomass, grain yield, variable costs related to the experiment, and selling prices. The biomass/straw was weighed from the net plot, dried to a constant weight, and converted to kilograms per hectare. Fertilizer cost is the primary variable across treatments, as all plots were uniform in size and received comparable inputs regarding seed rates, land preparation, weeding, harvesting, and threshing labour. These constant costs were therefore excluded from the comparative analysis (Agegnehu, Reference Agegnehu2021; Bekele et al., Reference Bekele, Mekuria, Tiegist and Muhajer2024; Zewdu et al., Reference Zewdu, Mekoya, Diriba and Muhajer2023).
Methods of analysis
The data analysis involved the utilization of descriptive statistics, specifically mean and standard deviation, to provide a comprehensive summary of the data (Ruth, Reference Ruth2011). The study also employed partial budget analysis to organize experimental data and evaluate the costs and benefits associated with various alternative treatments (CIMMYT, 1988). Costs that were consistent across all treatments, such as plowing, planting, weeding, and seed costs, were assumed to be ceteris paribus for all experimental data. Variable costs and gains were derived from market prices of inputs (fertilizer) at planting time and the output price (CIMMYT, 1993). Costs and benefits were calculated on a per-hectare basis in ETB ha−1. The minimum acceptable marginal rate of return (MRR) is 100%; this means that for every one ETB invested in fertilizer, a return of at least 2 ETB (1 unit invested + 1-unit profit) is expected (Demis, Reference Demis2023; Jemal et al., 2025). To further evaluate the economic feasibility of each treatment, the MRR was calculated as:
 $$MRR={\Delta NB \over \Delta TVC}\times 100$$
where MRR is the marginal rate of return, ΔNB is the change in net benefit, and ΔTVC is the change in total variable cost.
Value-to-cost ratio (VCR) analysis
The local price of value-to-cost ratio (VCR) indicates the profitability of fertilizer application from the farmer’s point of view and is applied for this research (FAO, 1999). As a rule of thumb, a VCR greater than 2 is considered profitable. A VCR of 2 indicates a 100% return on the investment in fertilizer, while values below this threshold are not considered profitable (CIMMYT, 1988). VCR can be calculated using the following formula (Dilshad et al., Reference Dilshad, Lone, Jilani, Azim, Yousaf, Khalid and Shamim2010):
 $$ VCR={\textit{Yield}_{\textit{treatment}}-\textit{Yield}_{\textit{Control}}\times Crop\,\textit{price} \over Cost\,of\,\textit{added}\,\textit{inputs}\,\left(\textit{fertilizer}\right)}={Y_{t}-Y_{c}\left(P_{c}\right) \over F_{c}}$$
where VCR is the value-to-cost ratio, Yt is treatment yield, Yc is control yield, Pc is crop price, and Fc is fertilizer cost.
Sensitivity analysis was conducted using partial budgeting under input and output price change scenarios to assess the robustness of the results. This analysis was used to identify treatments that remain both profitable and resilient to price fluctuations (Shewatsehay et al., Reference Shewatsehay, Mulugeta and Atinafu2022). A positive VCR result of sensitivity analysis indicated that the investment remains profitable under reasonable price changes in inputs and outputs (Andrea et al., Reference Andrea, Stefano, Francesca and Marco2002).
Linear mixed-effect model
It is a statistical model that combines fixed effects (parameters associated with the entire population or experimental factors of interest) and random effects (related to individual experimental units drawn at random from a population) (Brady et al., Reference Brady, Kathleen and Andrezej2014). The linear mixed-effect model (LMEM) specifies a model for the conditional variance and covariances of ygi that can depend on observable variables (Cameron and Pravin, Reference Cameron and Pravin2022). The LMEM is a hierarchical linear model that is quite flexible and permits random parameter variation to depend on observable variables (Cameron and Pravin, Reference Cameron and Pravin2009). The random-coefficients model is a special case that specifies
 $$Y_{ijk}=\mu +\alpha _{i}+\beta _{j}+\gamma _{k}+(\alpha \beta )_{ij}+(\alpha \gamma )_{ik}+(\beta \gamma )_{jk}+(\alpha \beta \gamma )_{ijk}+u_{I}+\varepsilon _{ijk}$$
where Y ijK is the net benefit for treatment i, landscape position j, crop type k, in district I, μ is the overall intercept (grand mean), α i is the fixed effect of treatment i, β j is the fixed effect of landscape position j, γ k is the fixed effect of crop type k, and (αβ) ij , (αγ) ik , (βγ) jk , and (αβγ) ijk are interaction effects. u I = (u I ∼ N (O, σ2 u )) is the random intercept for district I, and ϵ ijk is residual errors (ϵ ijk ∼ N (O, σ 2)).
Results
Before conducting the LMEM, the assumptions of normality and homoskedasticity were checked to ensure data reliability. The histogram with an overlaid normal curve and the kernel density plot showed that the residuals were centred around zero and closely followed a normal distribution (Itamar, Reference Itamar2023). In addition, the Breusch–Pagan test for heteroscedasticity confirmed constant variance across residuals (Lawrence and Kate, Reference Lawrence and Kate2017). These results indicate that the assumptions support the validity of the LMEM.
Random-effect estimates
The random-effects estimate (Table 2) indicates meaningful variability across districts. The variance of the district-level intercept was 62379959 with SD = 7898, while the residual variance was 522456708 (SD = 22857). The intra-class correlation coefficient (ICC) was 9.8%, suggesting that nearly 10% of the variation in income was attributable to differences between districts.
Estimated variance results of the linear mixed-effects model

Table 2. Long description
The table presents the estimated variance results of a linear mixed-effects model. It includes two rows: one for the district intercept and one for the residual. The district intercept has a variance of 62,379,959 and a standard deviation of 7,898. The residual has a variance of 522,456,708 and a standard deviation of 22,857.
Note: ICC = 9.8%, representing the proportion of total variance attributable to district-level differences.
Main and interaction effects of landscape positions, crop types, and treatments
The ANOVA results (Table 3) showed that landscape position had a significant effect on income (F = 39.53, p < 0.001), indicating meaningful variation across slope categories. There is also a highly substantial income difference across crop types (F = 460.37, p < 0.001), with clear income differences between teff and sorghum. Furthermore, crop net income was significantly influenced by fertilizer treatments (F = 24.43, p < 0.001), indicating substantial differences in economic returns among the nutrient combinations.
ANOVA result of main and interaction effects

Table 3. Long description
The table presents ANOVA results for main and interaction effects on income, structured with six rows and seven columns. The columns are labeled Source of variation, SS, MS, df, F-value, and Pr(>F). The rows detail the sources of variation: Landscape position, Crop type, Treatment, Treatment vs landscape, Treatment vs crop type, and Treatment vs landscape vs crop type. Landscape position shows an SS of 41305.00, MS of 20652.00, df of 2800.17, F-value of 39.53, and a significant p-value of less than 0.001. Crop type has an SS of 240520.00, MS of 240520.00, df of 1799.16, F-value of 460.37, and a significant p-value of less than 0.001. Treatment shows an SS of 102100.00, MS of 12763.00, df of 8798.99, F-value of 24.43, and a significant p-value of less than 0.001. Treatment vs landscape has an SS of 6627.80, MS of 414.20, df of 16798.99, F-value of 0.80, and a non-significant p-value of 0.700. Treatment vs crop type has an SS of 26962.00, MS of 3370.20, df of 8798.99, F-value of 6.45, and a significant p-value of less than 0.001. Treatment vs landscape vs crop type has an SS of 2254.20, MS of 140.90, df of 16798.99, F-value of 0.27, and a non-significant p-value of 1.000.
Note: *** = p < 0.01 significance.
SS = sum of squares; MS = mean square; df = degree of freedom.
The interaction between landscape position and fertilizer treatment was not statistically significant (F = 0.80, p = 0.700), showing that treatment effects were consistent across slope positions. In contrast, the interaction between crop type and fertilizer treatment was significant (F = 6.45, p < 0.001), revealing that the magnitude of fertilizer response differed between sorghum and teff.
The effect of fertilizer treatments
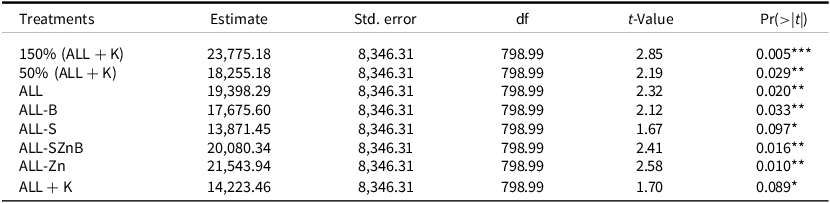
The model results (Table 4) indicate that most fertilizer treatments significantly increased net income compared with the control. In particular, the 150% (ALL + K), ALL–Zn, and ALL–SZnB treatments generated the highest economic returns, increasing net income by 23,775 ETB ha−1, 21,543.94 ETB ha−1, and 20,080.34 ETB ha−1, respectively (p = 0.005). These findings highlight substantial variation in economic performance across nutrient combinations, suggesting that balanced and enhanced nutrient applications can substantially improve farm income relative to the control treatment.
Effects of fertilizer treatments on income

Table 4. Long description
The table presents the effects of different fertilizer treatments on net income, with eight treatments compared against a control. Each treatment’s impact is measured by its estimate, standard error, degrees of freedom, t-value, and significance level. The 150% (ALL and K) treatment shows the highest increase in net income at 23,775.18 ETB per hectare, followed by ALL-Zn at 21,543.94 ETB per hectare and ALL-SZnB at 20,080.34 ETB per hectare. These treatments are statistically significant with p-values of 0.005, 0.010, and 0.016, respectively. Other treatments like 50% (ALL and K), ALL, ALL-B, and ALL-S also show positive impacts but to a lesser extent. The ALL and K treatment shows the least significant increase. The data highlights the economic benefits of balanced and enhanced nutrient applications in improving farm income.
Note: *** = p < 0.01; ** = p < 0.05; * = p < 0.1; significant.
The effect of landscape position on crop income
The results in Table 5 confirmed that landscape positions had a significant effect on the crop income. The intercept, representing the estimated net income at the foot slope, was 39,378 ETB ha−1 (p < 0.01). Relative to the foot slope, net income decreased significantly in higher landscape positions. Mid-slope plots exhibited a reduction of 11,976 ETB ha−1 (p < 0.05), while hill-slope plots showed an even larger reduction of 18,179 ETB ha−1 (p < 0.01). Generally, these results indicate a consistent decline in net income with increasing slope position.
Estimated effect of landscape position on crop income

Table 5. Long description
The table presents data on the estimated effect of landscape position on crop income, structured with four columns and three rows. The columns are labeled Landscape, Estimate, Std_error, df, t-Value, and Pr(>|t|). The rows represent different landscape positions: Hill slope, Mid slope, and Intercept. For the Hill slope, the estimate is negative eighteen thousand one hundred seventy-nine point thirteen, with a standard error of six thousand twelve point seventy-five, degrees of freedom of eight hundred twenty-five point sixteen, a t-value of negative three point zero two, and a p-value of zero zero zero two six, indicating a significant effect. The Mid slope shows an estimate of negative eleven thousand nine hundred seventy-five point ninety-two, a standard error of five thousand seven hundred twelve point thirty-four, degrees of freedom of eight hundred twenty-five point zero five, a t-value of negative two point one zero, and a p-value of zero zero three six three, also significant. The Intercept has an estimate of thirty-nine thousand three hundred seventy-seven point fifty-four, a standard error of six thousand eighty-eight point forty-seven, degrees of freedom of six point fifty-seven, a t-value of six point four seven, and a p-value of zero zero zero zero five, indicating a highly significant effect. The data suggests that net income decreases significantly with increasing slope position, with the largest reduction observed in the hill slope.
Note: *** = 0.01; ** = 0.05 significance.
Economic analysis of nutrient omission trials for teff and sorghum
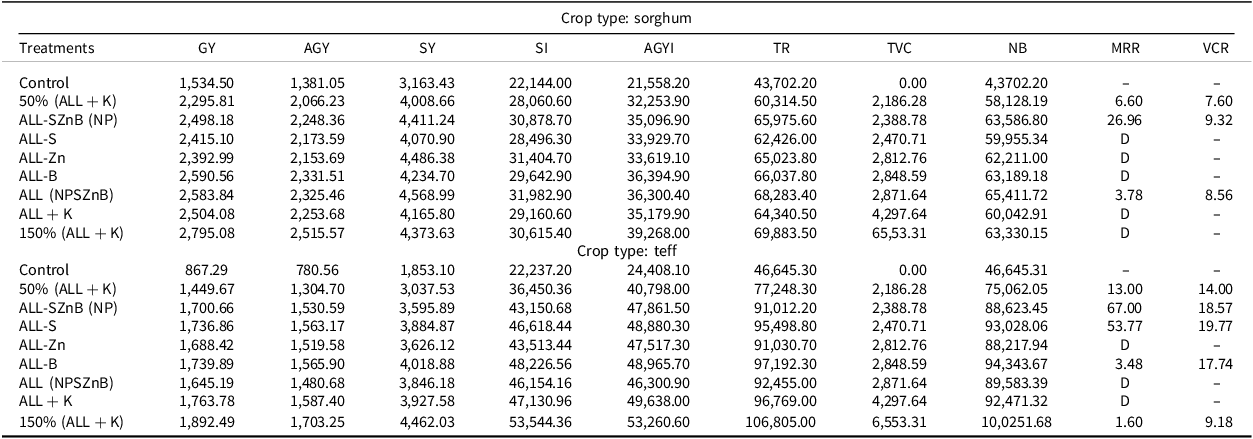
The partial budget, dominance, VCR, and sensitivity analyses were conducted to evaluate the economic performance of fertilizer treatments (Alemayehu et al., Reference Alemayehu, Keneni and Tadesse2024; CIMMYT, 1988; CIMMYT, 1993). The ALL-S, All-Zn, ALL-B, ALL + K, and 150% (ALL + K) treatments were cost-dominated for sorghum, whereas the ALL-Zn, ALL, and ALL + K treatments were cost-dominated for teff (Table 6). The dominated treatments were therefore excluded from further MRR and VCR analysis (Abrhaley et al., Reference Abrhaley, Getachew and Berhan2024; Alemayehu et al., Reference Alemayehu, Keneni and Tadesse2024). Among the undominated treatments, NP treatment provided the highest MRR, with 26.96% for sorghum and 67.00% for teff. The MRR result indicated that all other undominated treatments also give positive MRR values. The VCR analysis similarly showed favourable economic returns across all fertilizer treatments for both crops. The VCR analysis also indicated that NP fertilizer generated the highest economic return for both crops.
Partial budget, dominance analysis, and value-to-cost ratio for teff and sorghum

Table 6. Long description
The table presents a partial budget, dominance analysis, and value-to-cost ratio for sorghum and teff crops under various fertilizer treatments. It includes data on grain yield, above-ground yield, straw yield, straw index, above-ground yield index, total revenue, total variable cost, net benefit, marginal rate of return, and value-cost ratio. The table has 16 rows and 13 columns, with treatments listed in the first column and various yield and economic metrics in the subsequent columns. Notable trends include the dominance of certain treatments for each crop and the highest marginal rate of return provided by the NP treatment for both sorghum and teff.
AGY = adjested grain yield (Kg ha−1); SY = straw yield (Kg ha−1); SI = income from straw/stover ETBha−1; AGYI = income from adjusted grain yield ETBha−1; TR = total revenue (ETBha−1); TVC = total variable Cost (ETBha−1); NB = net benefit (ETBha−1); MRR = marginal rate of return (%); VCR = value-to-cost ratio; D = dominated.
Average field price of teff = 31.27ETB Kg−1 Average field price of teff straw = 12 ETB Kg−1.
Average field price of sorghum = 15.61 ETBKg−1 Average field price of sorghum stover = 7 ETBKg−1.
Sensitivity analysis under adjusted fertilizer and crop prices
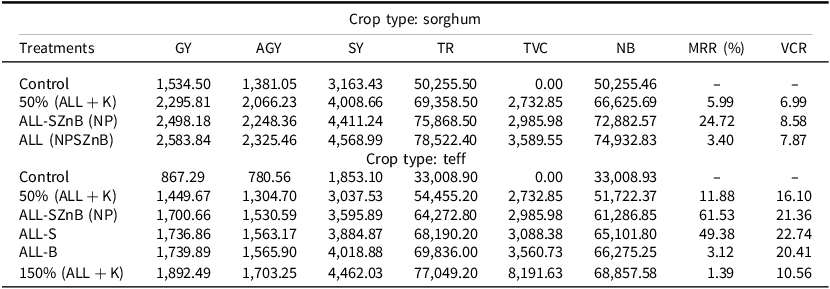
Sensitivity analysis was conducted by increasing fertilizer prices by 25% and crop prices by 15%, based on observed price trends over the past three years. Under these adjusted price conditions, all undominated fertilizer treatments remained economically viable for both sorghum and teff (Table 7). Under the increasing price scenario, the NP treatment generated the highest MRR values for both crops, followed by ALL-S, which exceeded the minimum acceptable threshold of 6, indicating continued profitability even under price fluctuations.
Sensitivity analysis under fertilizer and crop prices increments (25% & 15%, respectively)

Table 7. Long description
The table presents a sensitivity analysis of various fertilizer treatments on sorghum and teff crops under increased fertilizer and crop prices. It includes data for different treatments such as Control, 50% (ALL + K), ALL-SznB (NP), ALL (NPSZnB), ALL-S, ALL-B, and 150% (ALL + K). The table is divided into two sections: one for sorghum and one for teff. Each section lists values for GY, AGY, SY, TR, TVC, NB, MRR percentage, and VCR. For sorghum, the NP treatment shows the highest MRR value, followed by ALL-S. For teff, the NP treatment also generates the highest MRR values, with ALL-S exceeding the minimum acceptable threshold of 6, indicating continued profitability under price fluctuations.
Teff grain average price = 35.96 ETB Kg−1 teff straw average price = 13.80 ETBKg−1.
Sorghum grain average price = 17.95 ETBKg−1 sorghum stover average price = 8.05 ETBKg−1.
The abbreviations GY, AGY, SY, TR, TVC, NB, MRR, and VCR are defined in the previous caption (Table 7).
Discussion
The random-effects result (Table 2) revealed considerable variability between districts, indicating that contextual factors such as agroecology, management practices, and market access contribute to differences in farm profitability. Similar magnitudes of between-location variability have been reported in other empirical studies examining heterogeneity in fertilizer response and technology adoption (Belay et al., Reference Belay, Alemu and Worku2021). However, the much larger residual variance suggests that most unexplained variation arises at the household or plot level rather than at the district level. This result is consistent with previous findings (Gebru et al., Reference Gebru, Holden and Alfnes2021).
The significant influence of landscape position on crop net income reflects the well-established biophysical limitations associated with sloping landscapes (Table 3). Hill-slope and mid-slope farms are affected by greater soil erosion, lower moisture retention, and reduced fertility, leading to poor crop productivity and profitability. Similar slope-driven effects on yield and economic return have been documented across the Ethiopian highlands and drylands, where foot-slope positions consistently show higher responsiveness to fertilizer use (Agegnehu et al., Reference Agegnehu, Shewangizaw, Desta, Asefa, Legesse, Adissie and Stewart2024; Tilahun et al., Reference Tilahun, Gashaw, Legesse, Tamene, Mekonen, Thorne and Schultz2020). The strong and highly significant effect of crop type aligns with earlier findings that indicated teff typically generates higher net benefits than sorghum due to its higher market price and greater responsiveness to nutrient applications (Bekele et al., Reference Bekele, Mekuria, Tiegist and Muhajer2024; Samuel et al., Reference Samuel, Kassa, Habtemariam and Getachew2023).
The significant increases in crop income across multiple fertilizer treatments highlight the central role of balanced nutrient management in crop production (Table 4). The strong yield and economic response observed under the NP treatment are consistent with previous studies indicating that nitrogen (N) and phosphorus (P) are the primary yield-limiting nutrients in Ethiopian soils (Chala et al., Reference Chala, Kassa, Tadele, Assefa, Teshome, Agegnehu, Abera, Tibebe, Gudeta and Erkossa2022; Alemayehu et al., Reference Alemayehu, Bazie, Amare, Alemu, Yibabie and Tenagne2025). When these two nutrients are adequately supplied, crop productivity can be significantly improved without necessarily incurring additional costs for other macro- or micronutrients. Therefore, applying the recommended rate of NP fertilizer can provide economic benefits compared with more complex fertilizer blends that include additional nutrients. Similar findings have been reported in Ethiopia, where several nutrient omission and fertilizer response studies demonstrated that N and P are the most critical nutrients limiting crop yield, while the addition of S, Zn, and B often shows limited yield response in many locations (Abebe et al., Reference Abebe, Demsew, Yilma and Wubayehu2026).
The significant decline in crop income from foot slopes to mid and hill slopes reflects the strong influence of landscape-controlled biophysical conditions on farm profitability. Upper slope positions typically experience higher soil erosion, lower moisture retention, and reduced nutrient availability, all of which constrain crop performance (Table 5). This finding aligns with previous studies by Getahun et al. (Reference Getahun, China, Mulugeta and Getachew2024); Gizaw et al. (Reference Gizaw, Gizachew, Getachew, Abiro, Satish, Tadesse, Tulu, Baye, Ayalew, Tsegaye, Demis, Zerfu, Tamir, Abate, Abrham, Samuel, Workat, Tesfaye, Getahun, Tilahun, Andre, Mangi and Robbie2023); Tilahun et al. (Reference Tilahun, Gashaw, Legesse, Tamene, Mekonen, Thorne and Schultz2020), who reported that productivity and profitability increase downslope due to improved soil depth, fertility accumulation, and better water availability. These findings underscore the importance of landscape-specific nutrient and soil management strategies, especially in dryland areas where slope-induced degradation is more pronounced.
The strong interaction between crop type and fertilizer treatment indicates that the teff crop responds more positively to nutrient application than sorghum (Table 6). The notably high gains under the treatments reflect teff’s higher market value and its greater physiological efficiency of nutrient utilization. These results are consistent with the findings of Ewunetu et al. (Reference Ewunetu, Solomon, Eshetu, Asmamaw, Berhanu and Shinjiro2024), Gedamu et al. (Reference Gedamu, Aragaw, Abush and Agegnehu2023), and Gizachew et al. (Reference Gizachew, Eyasu, Gezahegn and Melkamu2026), who reported substantial economic benefits of fertilizers for teff production.
The high profitability of NP further underscores the responsiveness of major crops to limiting nutrients under the dryland areas (Table 6). This treatment gives high economic returns at lower input costs, making it particularly relevant for resource-constrained farmers. Overall, the findings confirm that cost-effective and micronutrient-inclusive fertilizer recommendations can significantly enhance farm profitability in dryland areas.
The sensitivity analysis indicates that the economic viability of NP fertilizer application remains robust under potential increases in both input and output market prices. The strong MRR and VCR values for NP further demonstrate its economic attractiveness, even when production costs rise (Table 7). These results align with recent findings (Ewunetie et al., Reference Ewunetie, Workat, Tilahun, Haymanot, Messay and Tesfa2024; Gebremedhin et al., Reference Gebremedhin, Birhane, Zenebe and Semethurst2025; Gebremeskel, Birhane, Haile, et al., Reference Gebremeskel, Birhane, Haile, Tadele, Habtu, Chanyalew and Assefa2025), who also reported high MRR values under similar fertilizer regimes in the price-increasing scenarios. The fact that some treatments exceeded the CIMMYT (1988) profitability benchmark (MRR > 6) underscores their suitability for smallholder farmers operating in risk-prone environments.
Conclusion and policy implications
In resource-constrained farming systems, optimizing soil nutrient dynamics is essential for enhancing the productivity and economic viability of smallholder agriculture. This experiment revealed that fertilizer treatments and landscape positions are important issues in farm profitability in the drylands of northeastern Ethiopia. There is consistently higher net income on foot slopes than mid and hill slopes, indicating the importance of landscape positions in farm planning. Moreover, the MRR analysis highlighted that NP generates superior economic return for both teff and sorghum crops. The sensitivity analysis of these treatments under price fluctuation scenarios further underscores their stability for resource-constrained farmers in dryland systems. Overall, given the high profitability and the robustness of the results under market fluctuations, the NP fertilizer is recommended as the most economical option for both teff and sorghum production. Farmers cultivating mid- and hill-slope lands implement soil management practices to minimize productivity losses due to soil fertility loss, in addition to NP fertilizer. Furthermore, the recommended fertilizer should be demonstrated on selected farmers’ fields using their agronomic practices, and the outcomes should be actively promoted to wider adoption among smallholder farmers.
Acknowledgements
We gratefully acknowledge the Sekota Dryland Agricultural Research Center (SDARC) and the International Fertilizer Development Center (IFDC) for their financial and logistical support. We also thank all individuals and farmers who generously participated in the study and contributed to this research.
Author contributions
Adane Wubet: Conceptualization, Methodology, Investigation, Software, Formal analysis, Data collection & curation, Validation & visualization, and Writing original draft. Solomon Bizuayehu: Supervision, Conceptualization, Methodology, Data curation, and Writing – Review & Editing. Mulugeta Demiss: Funding, Conceptualization, Supervision, and Data Curation. Latha Nagrangan: Funding, Conceptualization, Supervision, and Data Curation. All authors reviewed and approved the final manuscript for publication.
Funding statement
The authors acknowledge financial support for this research from the Sekota Dryland Agricultural Research Center and the International Fertilizer Development Center (IFDC) under Grant No. AI # 4-001-0720-ET/SOILS.
Competing interests
The authors declared none.
Declaration to artificial intelligence
We have used AI tools (specifically ChatGPT and QuillBot) solely for grammar editing, language polishing, and improving the readability of the manuscript. No AI tools were used to generate research content, interpret results, or conduct the analysis. All intellectual and scientific contributions are entirely our own.




 Open access

