


Coalition governments are strategic partnerships between parties for a limited time (Strøm and Nyblade Reference Strøm, Nyblade, Boix and Stokes2007). While government parties collaborate to implement a joint policy agenda, they also struggle for policy influence, and they anticipate upcoming elections and the end of the current coalition deal (Fortunato Reference Fortunato2019; Lupia and Strøm Reference Lupia and Strøm1995; Sagarzazu and Klüver Reference Sagarzazu and Klüver2017; Saijo Reference Saijo2021; Schleiter and Tavits Reference Schleiter and Tavits2018). Hence, coalition parties are always torn between behaving cooperatively and competitively. How well coalition governments work depends not least on how the government parties deal with this dilemma. The question is thus whether coalition partners behave cooperatively and are willing to invest in the partnership, or, conversely, whether they court controversy within the coalition, which threatens its success and longevity.
In this article, we develop an approach to measure the atmosphere among coalition partners. We define the ‘coalition mood’Footnote 1 as the level of conflict, both policy and non-policy based, between government parties. Similar to thermometer questions in mass surveys, the mood captures the feeling government parties have towards their coalition partner(s). It differs across coalitions and varies over time. Ideological divisiveness, mistrust and personal animosities between party leaders may dampen the mood in the coalition from the start. The coalition mood also reflects a myriad of behaviours in the daily interactions of the coalition and how they are decoded by the partners. For instance, the mood will suffer from coalition parties engaging in one-sided interpretations of the coalition deal, delaying negotiations, withdrawing from concessions already made, proposing policies that are clearly unacceptable to the partner(s), making indiscretions to the media targeted at coalition partner(s) and openly attacking their ideas and representatives. Conversely, the absence of such behaviours and fair play between the partners raise the mood. Yet, the mood might also vary over time, depending on public opinion polling, political scandals and the coalition's personnel and policy decisions.
Despite the rich literature on coalition politics, we still know relatively little about changes in the mood among coalition partners and its effect on the success of multiparty governments. While the atmosphere between coalition partners is sometimes hinted at in case studies on governing in coalitions (Fallend Reference Fallend2009; Norton Reference Norton, Heppell and Seawright2012), existing research often relies on proxy measures to assess the risk of conflict within coalition governments. For example, studies on coalition government termination mostly analyse government break-up as a stochastic process, where the risk (or hazard) of termination depends on structural attributes of the cabinet, the party system and the institutional environment (see, for example, Krauss Reference Krauss2018; Saalfeld Reference Saalfeld, Müller, Strøm and Bergman2008; Schleiter and Morgan-Jones Reference Schleiter and Morgan-Jones2009; Strøm and Swindle Reference Strøm and Swindle2002; Warwick Reference Warwick1994; but see Walther and Hellström Reference Walther and Hellström2019). However, the vast majority of these structural attributes are fixed at the time the cabinet enters office. While several studies (for example, Diermeier and Stevenson Reference Diermeier and Stevenson1999; Saalfeld Reference Saalfeld, Müller, Strøm and Bergman2008; Warwick Reference Warwick1992) suggest that hazard rates increase during the lifespan of cabinets, it is notoriously difficult to identify the reasons behind these changes (see, for example, Bergmann et al. Reference Bergmann2018).
In this article, we develop an approach to measuring coalition mood based on the applause patterns of coalition partners during speeches given by government parties' Members of Parliament (MPs) and cabinet members. The fundamental assumption underlying the coalition mood concept is that more applause for speeches by members of the other coalition partner(s) indicates a better atmosphere between these partners. Applause in the legislature has several attributes that make it suitable for the analysis of the coalition mood. Most importantly, applause among coalition partners varies across governments and over the electoral cycle, providing a time-variant measure of the coalition mood. As legislative debates are public, the measure is also applicable in different countries and thus suitable for comparative analyses. Compared to other types of political behaviour, such as political speech or voting behaviour, applause (or the lack thereof) is also a relatively non-consequential (and thus low-cost) way to express satisfaction with (or distance from) coalition partners. It is therefore less prone to bias due to under-reporting discontent than other forms of political behaviour.
Our empirical analysis is based on an automated analysis of over 105,000 plenary debates in Germany (1998–2017) and Austria (2003–18). Following Wratil and Hobolt (Reference Wratil and Hobolt2019), we use three types of validity test for our measurement approach: first, we demonstrate the face validity of the measure for coalition mood; secondly, we show that coalition mood correlates with public opinion on the government parties (concurrent validity); and, thirdly, we illustrate the predictive validity of the measure, testing whether bad coalition mood can forecast delays in the legislative process. In the concluding section, we discuss limitations of our measurement approach and show potential for future research on the coalition mood.
Analysing the Mood in Coalition Governments
For a long time, most studies on coalition research have primarily focused on two particular phases in the life cycle of multiparty governments: government formation and termination (see Müller, Bergman and Ilonszki Reference Müller, Bergman, Ilonszki, Bergman, Ilonszki and Müller2019). Analyses of government formation focus on the duration of coalition bargaining (see, for example, Diermeier and Roozendaal Reference Diermeier and Roozendaal1998; Ecker and Meyer Reference Ecker and Meyer2020; Golder Reference Golder2010; Martin and Vanberg Reference Martin and Vanberg2003), the party composition of coalition governments (see, for example, Döring and Hellström Reference Döring and Hellström2013; Martin and Stevenson Reference Martin and Stevenson2001) and the allocation of ministerial portfolios among coalition partners (see, for example, Bäck, Debus and Dumont Reference Bäck, Debus and Dumont2011; Browne and Franklin Reference Browne and Franklin1973; Ecker, Meyer and Müller Reference Ecker, Meyer and Müller2015; Warwick and Druckman Reference Warwick and Druckman2001; Warwick and Druckman Reference Warwick and Druckman2006). There is an equally rich tradition of research analysing the determinants of government stability and survival (see, for example, Conrad and Golder Reference Conrad and Golder2010; Krauss Reference Krauss2018; Laver Reference Laver2003; Schleiter and Morgan-Jones Reference Schleiter and Morgan-Jones2009).
In more recent years, there has been a growing interest in ‘the process of governance once a cabinet coalition has been formed’ (Müller and Strøm Reference Müller, Strøm, Müller and Strøm2000: 16). Some studies on coalition governance focus on the instruments parties use to make coalition government work. For example, multiparty governments draft coalition agreements (see, for example, Klüver and Bäck Reference Klüver and Bäck2019; Müller and Strøm Reference Müller, Strøm, Strøm, Müller and Bergman2008; Strøm and Müller Reference Strøm and Müller1999), use junior ministers as ‘watchdogs’ in departments headed by coalition parties (see, for example, Falcó-Gimeno Reference Falcó-Gimeno2014; Thies Reference Thies2001) and use parliamentary instruments to scrutinize government bills from their coalition partners (Carroll and Cox Reference Carroll and Cox2012; Kim and Loewenberg Reference Kim and Loewenberg2005; Krauss, Praprotnik and Thürk Reference Krauss, Praprotnik and Thürk2021; Martin and Vanberg Reference Martin and Vanberg2004). This literature relates back to the government formation process. It is then when junior ministers and committee chairs are allocated and the coalition agreement is drafted. Although partly driven by expectations about the future cooperation in the coalition, these actions cannot reveal how the partners actually interact once in office.
Other studies on coalition governance explicitly focus on how parties deal with their coalition partners throughout the course of government. Höhmann and Sieberer (Reference Höhmann and Sieberer2020) show that government party MPs use parliamentary questions to control ministries held by coalition partners. Martin and Vanberg (Reference Martin and Vanberg2008) focus on the duration of parliamentary debates and show that government parties spend more time debating divisive issues when elections are approaching. Proksch et al. (Reference Proksch2019) focus on speech content to analyse the level of conflict across bills and over time. A major advantage of this measurement approach is its ability to capture sentiment dynamics over time. They indeed find increasing levels of conflict among government party MPs for coalition governments that fail and result in early elections (Proksch et al. Reference Proksch2019: 116).
In line with this literature, we aim to develop a time-varying measure of the changing atmosphere between government parties. At least anecdotal evidence suggests that the mood within coalitions varies substantially across coalitions and over time. In April 2019, for example, the mood in the Italian coalition between Lega Nord and Cinque Stelle (2018–19) soured over mutual corruption allegations.Footnote 2 A cabinet member of the Lega Nord, Edoardo Rixi, gave an interview where he stated that ‘we are all fed up with them [Cinque Stelle]’.Footnote 3 Similarly, in December 2013, two months after its inauguration, the German government was hit by a scandal involving the minister of agriculture. The case ‘poisoned the atmosphere in Germany's new left–right coalition’,Footnote 4 though party leaders quickly aimed to ease the tensions between the government parties. Such attempts to (re-)establish a good coalition mood are common as well. For example, after Austrian Chancellor Werner Faymann stepped down in May 2016, his successor, Christian Kern, made a call to ‘overcome persistent squabbling in the coalition government’.Footnote 5 His call for a ‘restart’ of the coalition failed, however, and early elections were called one year later.
Measuring Coalition Mood Using Non-verbal Communication in the Legislature
Analysing the mood among government parties requires overcoming several challenges. First, political actors are likely to be strategic in their public communication about the coalition mood. It is almost a cliché to see politicians underlining the ‘very good, collegial atmosphere’ between the coalition partners.Footnote 6 As most forms of public discontent with coalition partners entail costs, officials of the coalition parties are likely to downplay conflict so as not to feed into criticism from outside the coalition. Secondly, to analyse the coalition mood over time, we need data sources that reveal the coalition mood continuously and over long time periods. This excludes measurement approaches with substantial preparation efforts (for example, expert surveys) and those measuring the mood after the fact (for example, after government termination). Thirdly, we seek a measure that is applicable in many different countries. Hence, the data sources to measure the coalition mood should be comparable across countries.
To deal with these challenges, we turn to the non-verbal communication between government parties in the legislature. Regular parliamentary debates are crucial features of all parliamentary democracies and have increasingly received attention in the literature over recent years (Bäck and Debus Reference Bäck and Debus2016; Bergmann et al. Reference Bergmann2018; Proksch et al. Reference Proksch2019; Proksch and Slapin Reference Proksch and Slapin2015). We argue that a ‘side product’ of these speeches, that is, the reactions of the MPs listening to them, constitutes a valuable data source as well (Blätte et al. Reference Blätte2019). Even though these types of behaviour by MPs might be most frequent and lively in the Anglo-Saxon world (Proksch and Slapin Reference Proksch and Slapin2015: 62), data journalism projectsFootnote 7 have shown that applause, laughter and interjections are by no means rare occurrences in Continental Europe.
In the following, we focus on applause patterns in the legislature to analyse the coalition mood. In nearly all instances, applause can be regarded as a positive reaction to a speech: it shows agreement with what is said, support for the person speaking or both (Heritage and Greatbatch Reference Heritage and Greatbatch1986).Footnote 8 Applause in plenary meetings can be observed at relatively low cost cross-nationally and for long time periods.Footnote 9 The data can thus be used for a continuous measure of the coalition mood in comparative research. At the same time, we argue that withholding applause for speeches by coalition party MPs is a strong, deliberate, meaningful and collective form of distancing from the partner in government.
Applause during political speech ‘can be seen as a highly manifest expression of group identity, a means whereby audiences not only praise the ingroup (their own party), but also derogate outgroups (their political opponents)’ (Bull Reference Bull2006: 1). As a group activity, it requires high levels of coordination, both between the speech giver and the audience, and among the various members in the audience (Bull Reference Bull2006; Gillick and Bamman Reference Gillick and Bamman2018). Consequently, MPs in parliamentary debates skilfully employ various rhetorical techniques, such as rhetorical pauses and changes in pitch and gaze, to invite applause and signal at which point in their speech they welcome this ritualized form of approval by the audience (Atkinson Reference Atkinson1984; Heritage and Greatbatch Reference Heritage and Greatbatch1986). It is this convention-based institutional norm of expression of group identity in parliament in which the audience's so-called ‘literal silence’, that is, their deliberative decision not to applaud, is a strong indicator of disapproval (Billig and Marinho Reference Billig, Marinho, Murray and Durrheim2019: 23 ff.). Collective non-applause during and after speeches in parliament is hence not the mere absence of applause, but a deliberate and meaningful act that is actively performed.
Arguably, MPs voice their (dis)approval during parliamentary speeches by other means than (non-)applause, such as cheering, heckling/booing and other forms of disorderly parliamentary behaviour (see, for example, Ilie Reference Ilie2013). Hence, these mostly verbal reactions are potential additional data sources to capture the atmosphere among coalition partners.Footnote 10 We argue, however, that there are both substantial and pragmatic reasons to exploit solely non-verbal reactions. First and foremost, most of the mentioned verbal reactions are individual behaviour that lacks the collective dimension of a coordinated manifestation of partisan identity by MPs. In fact, most unparliamentary behaviour follows largely idiosyncratic patterns, which makes it unsuitable to systematically capture the relationship between political parties as collective actors. An analysis of interruptive comments in the Austrian parliament between 2005 and 2006, for instance, indicates that such behaviour results largely from the dynamic, spontaneous and opportunistic interpersonal engagement between discourse participants but does not generally reflect stable partisan patterns (Zima, Brône and Feyaerts Reference Zima, Brône, Feyaerts and Ilie2010). Secondly, such unparliamentary behaviour is, though often implicitly tolerated, explicitly prohibited and potentially sanctionable in most national parliaments. As such, it is (at least potentially) costly behaviour that is likely to be confounded by the common behaviour pattern of the speaker of the house and the risk aversion of individual MPs. Finally, stenographic protocols in the various parliamentary democracies record these interrupting comments less systematically than applause patterns; therefore, relying on unparliamentary behaviour would exacerbate problems of compatibility (see also later).
We use stenographic protocols to extract party-to-party interactions (that is, applause by MPs of one PPG for members of any other, or their own, PPG) during parliamentary debates in Germany (1998–2017) and Austria (2003–18). We focus on these two countries because the parliamentary protocols contain precise information on party-to-party interactions during debates. Extracting the same information for most other countries requires more preprocessing and cross-validation with additional sources (for example, based on video recordings).Footnote 11
Both in Germany and Austria, more than 15 stenographers are present during every sitting of parliament to provide exact records of parliamentary speeches, interjections and non-verbal communication like applause, laughter and a plurality of other types of behaviour.Footnote 12 Stenographers are required to have strong political knowledge and receive extensive training by the parliaments before starting their work. Two stenographers keep the minutes at the same time in each country – with one of them being responsible specifically for applause, interjections and other non-verbal forms of behaviour in Austria – changing shifts with other colleagues every five and twenty minutes in Germany and Austria, respectively.Footnote 13 While outlining some forms of non-verbal communication in the protocols sometimes poses a challenge, applause is described as ‘easy to notate’.Footnote 14
A data set with all speeches from the German Bundestag was constructed using Extensible Markup Language (XML) files from its open-data repository.Footnote 15 Data from the Austrian Nationalrat were scraped from a website providing machine-readable versions of the stenographic protocols of the debates as a data source. Information on interactions (for example, applause, laughter and interjections) during a speech are recorded in parentheses in the protocols of both countries.Footnote 16 After separating the protocols into separate speeches, the contents of all parentheses occurring in the transcripts during the speeches were extracted using regular expressions, and applause events were assigned to parties using a combination of the German word for applause (Beifall) and different terms for all parties in the legislature. We checked the data on party affiliations on accuracy. Finally, speakers of parliament were excluded from the analysis because of their impartial role during debates, and speeches by opposition MPs were discarded, as we are interested in applause for members of government parties only.
Overall, we observe 349,315 party-to-party interactions during 106,802 (76,541 in Germany and 30,261 in Austria) parliamentary speeches of members of government parties. MPs from multiple parties applauding at the same time are treated as separate party-to-party interactions. We excluded applause if no details were given about who applauded (for example, ‘general applause’, ‘applause in the whole parliament’ and so on) and ignored more detailed descriptions (for example, ‘thunderous applause’, ‘long lasting applause’ and so on), as such descriptions are only given infrequently and are more prone to be subjective judgements of the recording clerks. The protocols also differentiate whether entire PPGs, a (not precisely defined) share of these groups or single MPs applauded. We do not differentiate whether several members or the whole PPG applauded. Yet, applause by single MPs (not recorded in Germany and less than 5 per cent of all applause events in Austria) was excluded from the data, as we regard this as individual action not representative of the party as a whole.
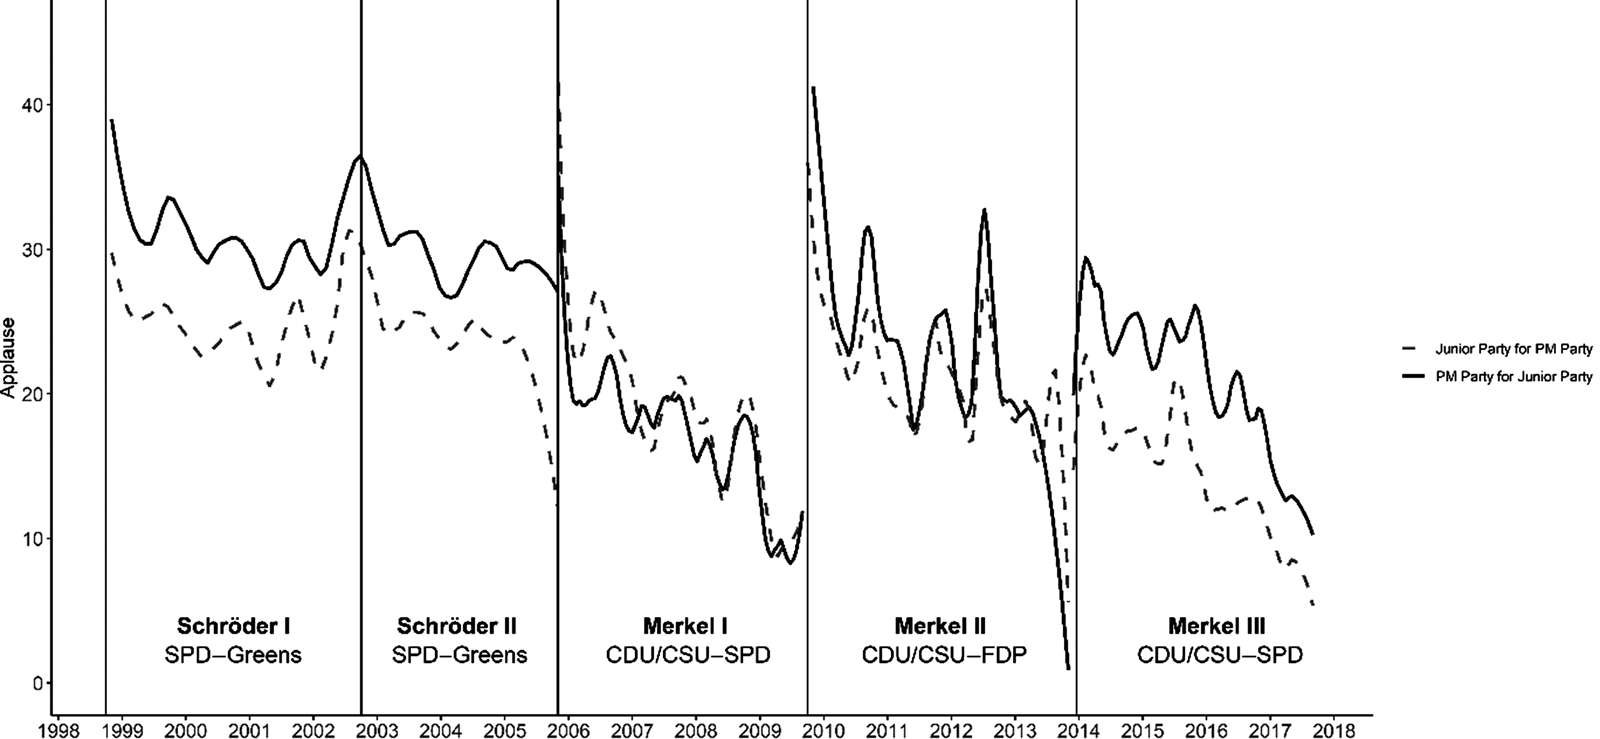
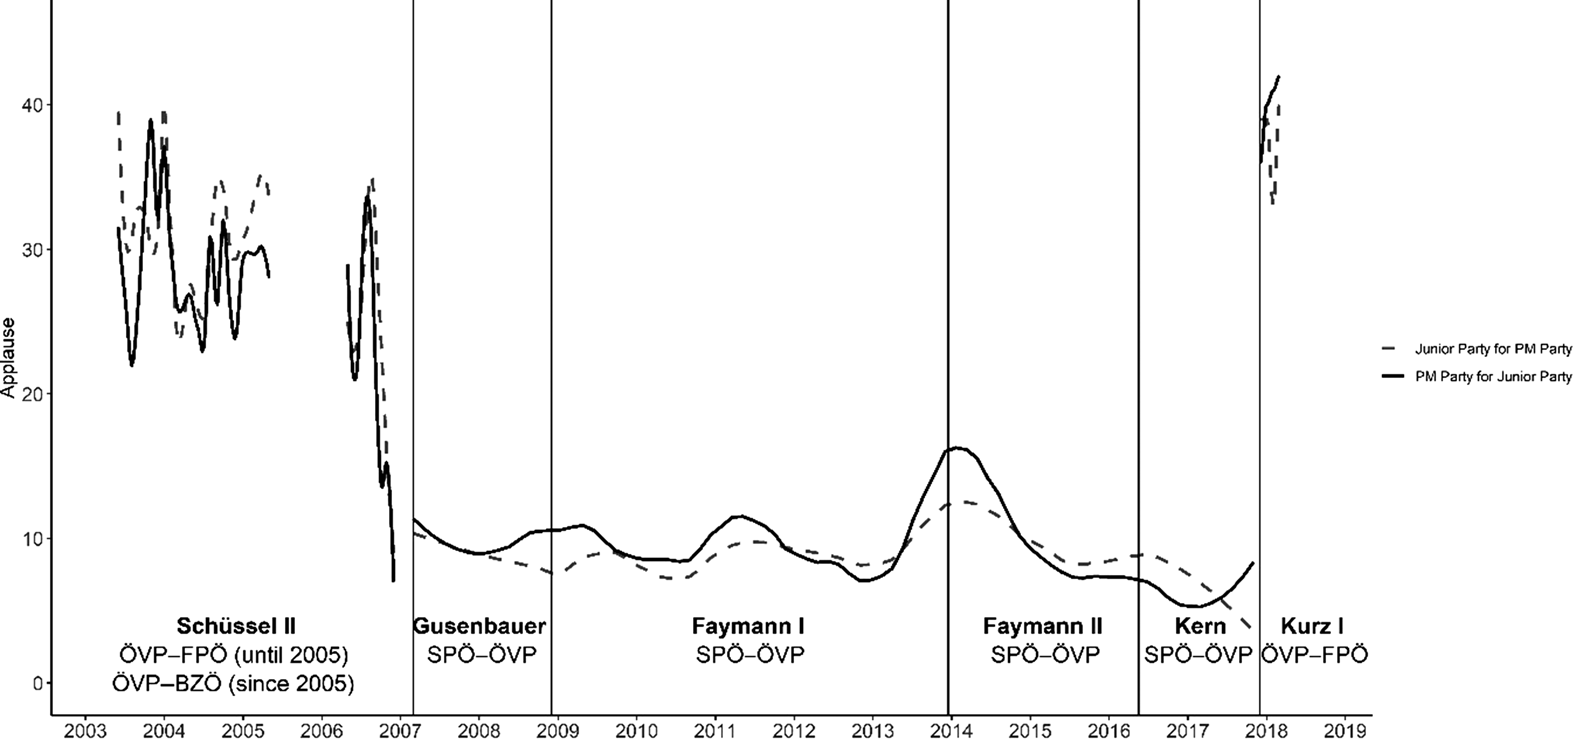
Figures 1 and 2 show the frequency of applause among coalition partners in Germany and Austria, respectively.Footnote 17 The y-axes show the average number of times government parties applauded for their coalition partner per 10,000 words spoken by the party receiving applause. A common pattern in both countries is that applause by the government parties move in tandem: government parties seem to ‘return the favour’ if their speakers get more (or less) applause from MPs of their coalition partner. Reciprocity is important, as we aim to use these data to get a general estimate of the coalition mood.
Applause between government parties in Germany, 1998–2017.
Notes: Occurrence of one coalition party's applause per 10,000 words spoken by another partner's cabinet members or MPs. Vertical lines denote the formation of a government. Smoothed estimates based on a LOESS regression. CDU/CSU: Christian Democratic Union/Christian Social Union; FDP: Free Democratic Party; SPD: Social Democratic Party.
Applause between government parties in Austria, 2003–18.
Notes: Occurrence of one coalition party's applause per 10,000 words spoken by another partner's cabinet members or MPs. Vertical lines denote the formation of a government. In 2005, the FPÖ split and the splinter party BZÖ remained in the Schüssel II government on 17 April 2005 while the FPÖ left the coalition. As the MPs deserted to the BZÖ and those remaining loyal to the FPÖ remained in one parliamentary party until the end of the legislative term, the protocols do not differentiate between MPs of these two parties. We therefore do not consider the period between April 2005 and October 2006. Smoothed estimates based on a LOESS regression. BZÖ: Alliance for the Future of Austria; FPÖ: Freedom Party; ÖVP: People's Party; SPÖ: Social Democratic Party.
To measure the coalition mood, we model applause for government parties in the legislature as a negative binomial process.Footnote 18 The data set has a dyadic structure, each observation representing the total times a PPG applauded for a government party in a month.Footnote 19 Specifically, we model the applause frequency y ijtk of party i for party j in month t in country k as:
 $$\Pr ( {Y_{ijtk} = y_{ijtk}\;\vert \;\mu_{ijtk}} ) = \displaystyle{{e^{-\mu _{ijtk}}\mu _{ijtk}^{y_{ijtk}} } \over {y_{ijtk}!}}$$
and:
 $$\mu _{ijtk} = {\rm exp}( {\beta_{rel, t, k} + \gamma {\boldsymbol Z}_{{\boldsymbol ijtk}}} ) {\rm \;, \;}$$
where β rel,t,k indicates fixed effects for the relationship between party i of the speaker and the reacting party j in the legislature in country k. Here, we distinguish between three possible speaker–audience relationships: government MPs applauding members of their own party (that is, i = j; β own,t,k); MPs of government party i applauding a member of their coalition partner j (β coal,t,k); and MPs of an opposition party i applauding government party j (β opp,t,k). Applause from opposition parties in the first month of our observation period ( $\beta _{opp, t_0, k}$) is used as a reference category to anchor the coalition mood.Footnote 20 It accounts for general differences in applause patterns over time that might indicate not changes in mood, but, for instance, how consensual opinions generally are on the topics on the parliamentary agenda in any given month. Accordingly, the model estimates for β coal,t,k provide a time-variant contextual measure of the coalition mood, which we rescale between 0 (lowest observed mood) and 10 (highest observed mood) to ease its interpretation.Footnote 21
We control for the number of spoken words by party j in month t (Z ijtk) as a proxy for floor time. Floor time of party j in month t depends on different factors: the total time parliament spent on sessions in that month and PPG size (as floor time is allocated according to PPG size). On average, parties with more speeches also receive more applause. As these factors are not connected to coalition mood, we control for floor time in parliament.
Face Validity
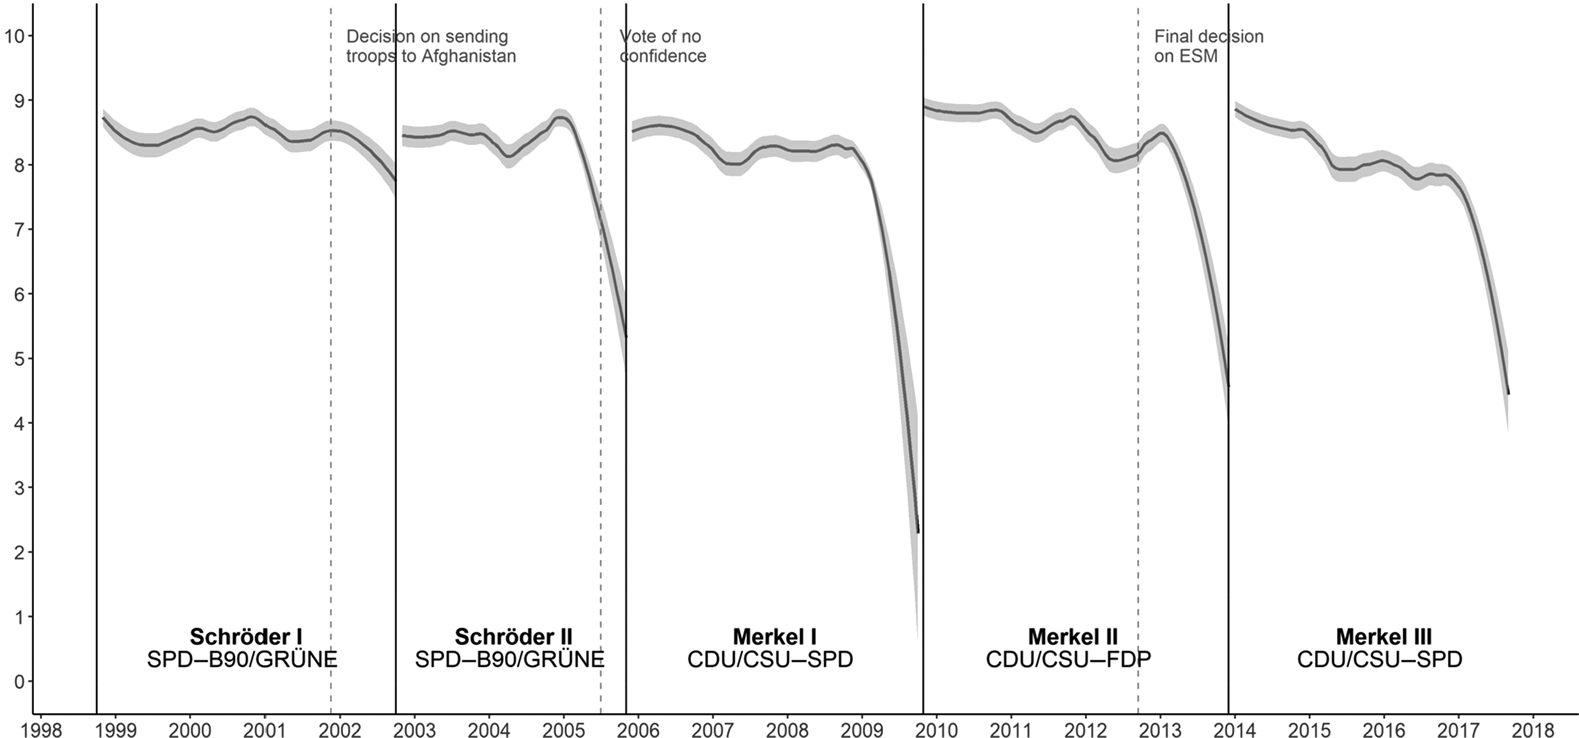
To illustrate the face validity of our measurement approach, we show the coalition mood estimates for governments in Germany (see Figure 3) and Austria (see Figure 4). The solid vertical lines indicate a new government taking office; the vertical lines dashed in grey indicate important events during the tenure of a government. Confidence intervals were estimated by bootstrapping.Footnote 22
Coalition mood in Germany, 1998–2017.
Notes: Smoothed estimates based on a LOESS regression. The shaded area depicts the 95 per cent confidence interval.
Coalition mood in Austria, 2003–18.
Notes: Reasons for the missing data in 2005 and 2006 are provided in the Notes to Figure 2. Smoothed estimates based on a LOESS regression. The shaded area depicts the 95 per cent confidence interval.
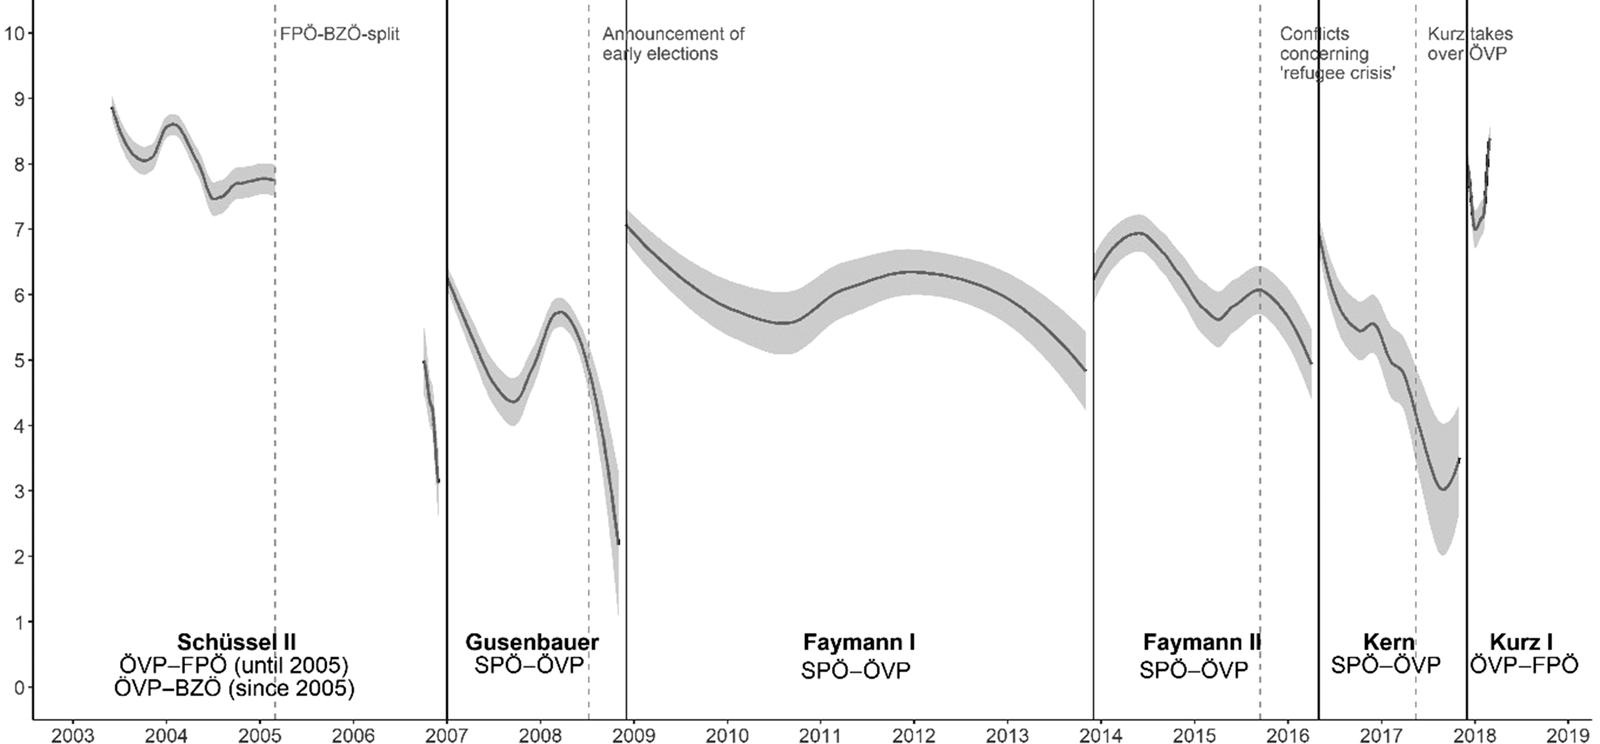
Several features are apparent from the patterns in Figures 3 and 4. First, the trends differ somewhat from the raw applause patterns in Figures 1 and 2, respectively. This is in part because the negative binomial model uses applause by opposition parties as a yardstick to estimate the coalition mood. Doing so accounts for the overall frequency of applause in the legislature, which might also depend on other contextual factors. Furthermore, the negative binomial model is based on the log-transformed applause patterns (rather than raw frequencies) to account for the fact that additional applause should have a higher impact on the mood if the overall frequency of applause is rather low. This leads to lower volatility compared to the raw data in Germany, where the mood is generally higher than in Austria.
Secondly, for most cabinets, there is a negative time trend in the coalition mood; this suggests a decline in the working atmosphere among coalition partners. Thirdly, many coalition governments witnessed a sharp decline in the coalition mood during the final weeks of a coalition's lifetime. This is the case when regular elections are approaching (for example, in Germany in 2009) or when early elections are called (for example, in Austria in 2008). Fourthly, if the decline at the end of the term is modest, the party composition tends to prevail after the next election (for example, Germany in 2002 and Austria in 2013). This seems to suggest that MPs anticipate that the current partnership might potentially continue after election day. Finally, changes in the coalition mood in both countries resemble important external events and episodes of intra-coalition life during a government's tenure. For example, the declining mood in the SPÖ–ÖVP coalition in 2015 coincides with the so-called European refugee crisis that had a large impact on Austria. Similarly, the data show Chancellor Kern's (ultimately failed) attempt to ‘restart’ the SPÖ-ÖVP coalition in Austria (Jenny Reference Jenny2017): while this attempt caused the mini-bump in the coalition mood in 2016, the mood declined quickly and went to a further low after Sebastian Kurz took over as ÖVP chairman in May 2017.
Concurrent Validity
To assess the concurrent validity, we test whether coalition mood correlates with measures of other concepts related to it. We focus on the popularity of the government parties. Specifically, we expect that the coalition mood declines if the government parties become unpopular and if the government parties' relative strengths change.
First, we expect that MPs are more satisfied with the coalition if the government parties are more popular. Even when politicians do not closely follow or care about opinion polls, we would still expect the coalition mood to correlate with them, as different external factors (like scandals or policy shocks) can be expected to influence both measures in a similar way. We use monthly opinion polls from both countries to test this argument.Footnote 23 We measure changes in government popularity by calculating the joint gains or losses of all government parties in opinion polls since the last national election in percentage points.
We also expect a negative relationship between changes in the relative strength of the coalition parties and the coalition mood. Each government party's influence on the allocation of portfolios and the coalition policy agenda depends not least on the resources it contributes to the coalition (see, for example, Gamson Reference Gamson1961). The key decisions concerning the distribution of government portfolios and government policy are made when the government takes office. Yet, changes in public support for the individual coalition parties affect their bargaining power within the coalition (Lupia and Strøm Reference Lupia and Strøm1995). This may increase the pressure to deviate from the coalition deal and may destabilize the current government (Kayser and Rehmert Reference Kayser and Rehmert2021; Lupia and Strøm Reference Lupia and Strøm1995). Vice versa, a bad coalition mood might affect the relative strengths of the government parties in the polls, as the voters' responsibility attribution in coalition governments often differs across coalition partners (see, for example, Klüver and Spoon Reference Klüver and Spoon2020). Thus, we expect a negative correlation between changes in the relative strengths of the parties in government and the coalition mood.
We measure changes in the relative strength of the coalition parties by analysing deviations in their contributions to the coalition's popular support base since the last election. We use opinion polls as a proxy for how much parties could expect their vote share to change relative to their coalition partner if elections were held in the current month t. As changes in bargaining power are zero-sum and all cabinets in our data are two-party coalitions, it is sufficient to focus on changes in the strength of one of the government parties according to opinion polls. Specifically, we calculate
 $${\boldsymbol change}\;{\boldsymbol in}\;{\boldsymbol relative}\;{\boldsymbol popularity} = \left\vert {\displaystyle{{\,p1_t} \over {\,p1_t + p2_t}}-\displaystyle{{\,p1_e} \over {\,p1_e + p2_e}}} \right\vert $$
with p1 and p2 being the predicted vote share according to voting intention polls of both coalition parties in month t and the real vote share at the last national elections e, respectively.
We include several control variables in the models. First, we use fixed effects for the combination of parties that each government consists of to account for unobserved government-specific variation in the coalition mood. Secondly, we include an indicator variable for whether the coalition was still in its ‘honeymoon period’, defined here as the month of formation and the three following months, during which we would generally expect a better mood. Thirdly, we employ a binary variable indicating whether the current government only acted in a caretaker role while its replacement was already imminent. It takes a value of 1 if early elections have been announced but the government remains in office or if a government is still in office after an election before a new government is formed. Finally, we include the mood in the previous month as a control variable to account for autocorrelation.
In Table 1, we report the results of a linear regression model predicting the coalition mood in Germany and Austria. The results mostly confirm our expectations: change in relative popularity has a significant negative effect. If the balance of strength between the parties changes by 0.06 (one standard deviation), the coalition mood decreases by 0.42 points. The variable on the aggregate gains or losses in government popularity expectedly has a positive coefficient; however, it clearly misses significance. This could be interpreted as the coalition partners regarding these instances as joint achievements or failures, which neither enable them to negotiate a better deal with their partner nor are as dangerous for the survival of the coalition as relative power shifts between parties. Therefore, they are not affecting the coalition mood.Footnote 24 The coefficients of the control variables also have the expected signs.
Coalition mood depending on government party popularity
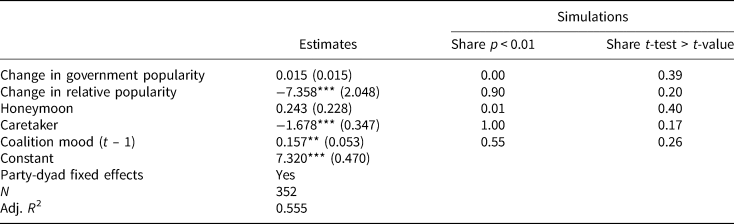
Notes: Linear regression; standard errors in parentheses. * p < 0.05; ** p < 0.01; *** p < 0.001.
An important caveat for assessing its concurrent validity is the uncertainty that surrounds the monthly estimates of the coalition mood. This raises the question of whether the negative relationship between the change in relative popularity and the coalition mood is sufficiently robust to account for measurement error in the dependent variable. We address this issue by simulating the data-generating process and model fitting based on the model estimates and bootstrapped standard errors obtained from the negative binomial model. Specifically, we generate 1,000 samples of the monthly coalition mood by randomly sampling from a normal distribution with mean and standard deviation given by the model estimate and bootstrapped standard error, respectively, and re-estimate the model in Table 1 predicting coalition mood 1,000 times. This process provides us with 1,000 simulated regression coefficients, along with standard errors.
The third and fourth column in Table 1 report the distribution of the retrieved p-values and test statistics, that is, the ratios of the regression coefficients and their standard errors, respectively. We are particularly interested in the simulation results for the effect of the change in relative popularity. Here, we observe that approximately 90 per cent of the simulated regression coefficients provide model estimates that are negative and significant at the 1 per cent level. At the same time, however, the fourth column in Table 1 indicates that approximately 20 per cent of the simulations return test statistics that are larger (in absolute terms) than the one obtained from the standard parametric t-test. Overall, by simulating the data-generating process, the uncertainty analysis suggests that the effect on the coalition mood is generally robust. Taking the uncertainty estimates into account, however, indicates that the parametric analysis via the linear regression model likely overestimates the substantive effect of predicted changes in vote share.
Predictive Validity
The third type of validity we want to demonstrate is predictive validity. The goal for this section is to show that the coalition mood can be used to predict the time legislative bills proposed by the government take to pass. Government bills are the centre of legislative activity in almost all European parliamentary democracies (Andeweg and Nijzink Reference Andeweg and Nijzink1995). While such bills formally need approval by the whole government, they are drafted not by the cabinet as a collective body, but usually by individual ministers and their departments (Laver and Shepsle Reference Laver and Shepsle1994). As these ministers usually have high autonomy in drafting the bills, ministers have to be monitored – especially in coalition governments. This task often involves the legislative arena (Bäck et al. Reference Bäck2022; Martin and Vanberg Reference Martin and Vanberg2004; Martin and Vanberg Reference Martin and Vanberg2011). As Martin and Vanberg show, ideological differences within the government indeed cause delays in the legislative process, as MPs have to ‘keep tabs’ on their coalition partner more thoroughly. We argue that the coalition mood might play a role here as well: if things are going well between coalition partners, MPs might be more trusting that ministers of the other party adhere to the coalition agreement, while they might be especially cautious if the mood is bad.
To test this proposition, we scrape information on government bills in Germany and Austria from the respective websites of the parliaments. In total, 2,345 government bills were introduced in Germany and 1,222 were introduced in Austria in the respective time frames. The dependent variable is the time it took from introducing a bill to its acceptance. Bills that were still in the legislative process at the end of the term are treated as right-censored data.Footnote 25 We apply a Cox regression model with coalition mood, measured one month prior to the dependent variable, as a time-varying covariate. The model also contains several control variables. First, we measure the issue divisiveness of government and opposition parties to test whether the legislative process takes longer for more divisive bills (Martin and Vanberg Reference Martin and Vanberg2004; Martin and Vanberg Reference Martin and Vanberg2011). Data for the parties' policy positions are drawn from the Manifesto Project Dataset (Volkens et al. Reference Volkens2020), using issue scales defined by Greene and Jensen (Reference Greene and Jensen2018). The model includes variables on the number and squared number of months that have passed since the inauguration of the government to account for a potential curvilinear time trend in the delay of government bills. Finally, the models include fixed effects for party dyads and policy areas. The latter are classified based on keywords provided for each bill by the parliaments.
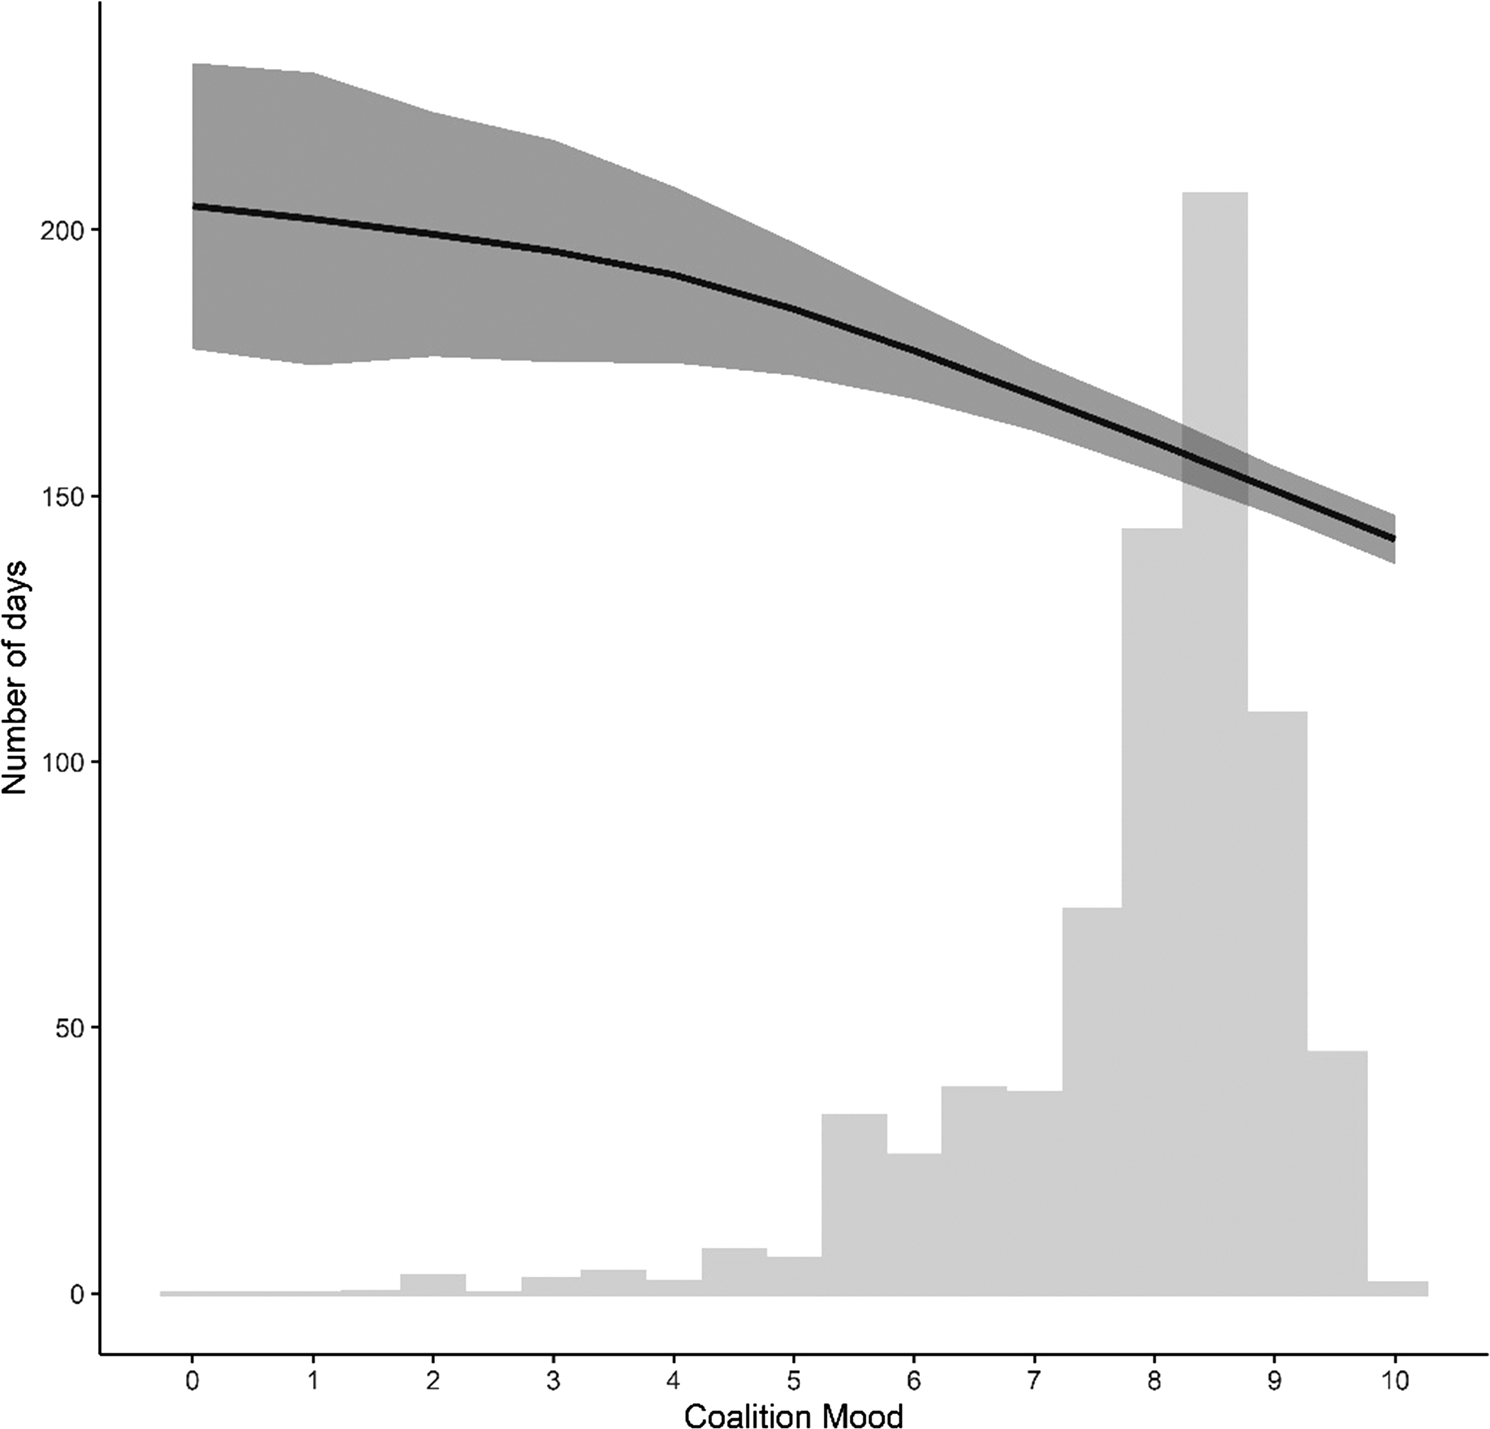
Table 2 presents the results of the Cox regression model. Coalition mood, as expected, has a significantly positive effect on the hazard rate, that is, the ‘risk’ of a government bill being accepted in month t given that it had already been in parliament without being accepted until month t. Figure 5 visualizes the magnitude of this effect, setting all other continuous and categorical variables at their means and modes, respectively.Footnote 26 The y-axis shows the expected duration of the legislative process, while the x-axis denotes the coalition mood. Increasing the coalition mood from its first (7.44) to its third (8.71) quartile reduces the time it takes for a bill to be accepted by eleven days (from 165 to 154 days).
The length of the legislative process depending on the coalition mood
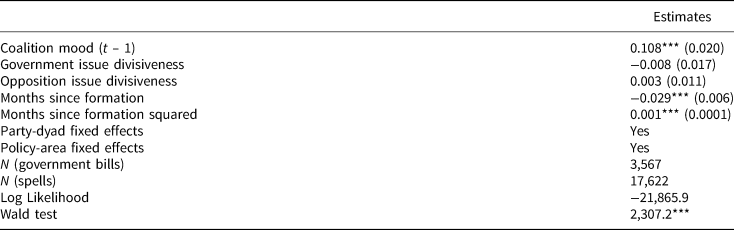
Notes: Cox proportional hazards regression; standard errors in parentheses. *p < 0.05; **p < 0.01; ***p < 0.001.
Predicted effect of coalition mood on the of length of the legislative process.
Notes: The shaded area around the solid line depicts the 95 per cent confidence interval. The histogram shows the relative distribution of the coalition mood.
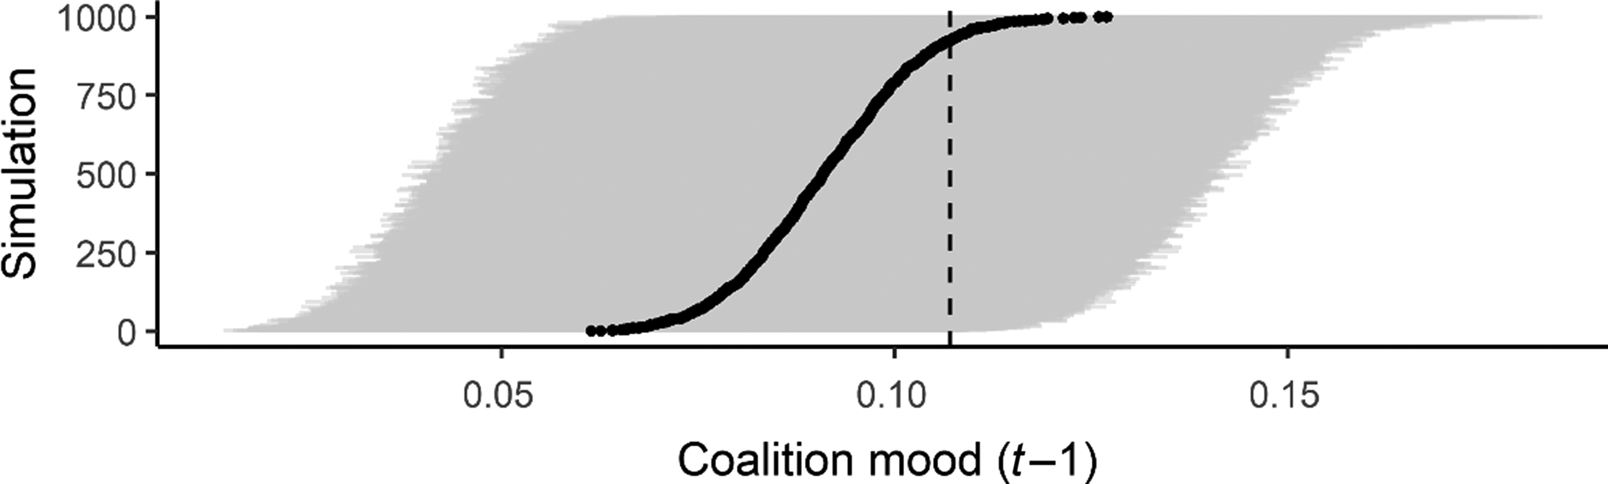
We also assess whether these findings are robust to the estimation uncertainty of the coalition mood. Randomly sampling from a normal distribution with mean and standard deviation given by the model estimates and bootstrapped standard errors provides us with 1,000 simulated regression coefficients and standard errors of the effect of (the lag) of the coalition mood based on the specified Cox proportional hazard model. Figure 6 plots the point estimates (small black dots, ordered by effect size) and the corresponding 99 per cent confidence intervals (light grey bars) for each of the 1,000 simulated random samples. As apparent from the scheme, coalition mood at time t – 1 has a highly significant and positive (that is, accelerating) effect on government bills across all simulated data sets. Hence, the results of the uncertainty analysis indicate that coalition mood is a robust determinant of government bill adoption, which further enhances our confidence in its predictive validity.
Simulations to assess the estimation uncertainty of the coalition mood effect.
Notes: Estimated effect of the coalition mood (t – 1) on the length of the legislative process in 1,000 simulations. The grey bars denote the 99 per cent confidence intervals. The dashed line denotes the effect identified in the Cox proportional hazard model in Table 2.
Conclusion
In this article, we introduce a new measure for the coalition mood in multiparty governments. We argue that the effectiveness of coalition governments is not just dependent on structural attributes, such as the ideological divisiveness known on the day the government takes office. Rather, the willingness to cooperate varies over a coalition's lifetime and affects how coalition governments work.
Based on applause in plenary debates, we derive estimates of the coalition mood in two European parliamentary democracies. Our measure has face validity as it concurs with qualitative descriptions of the conduct of coalition governance and the dynamics of inter-party relationships within government coalitions in both countries. Concurrent validity checks also yield positive results, as shifts in power between the coalition parties correlate with decreasing coalition mood. Finally, we showed that bad mood leads to additional delays of government bills in parliament, indicating that our measure also has predictive validity.
Measuring the mood in coalition governments may be useful to answering a variety of research questions in future research. First, as we have argued in this article, coalition mood can be used to study the policy output of coalition governments. Legislation is one of the most important ways for governments to initiate political and economic reforms (Angelova et al. Reference Angelova2018; Becher Reference Becher2010; Immergut and Abou-Chadi Reference Immergut and Abou-Chadi2014), and to fulfil their electoral pledges (Thomson et al. Reference Thomson2017). Yet, legislative activity varies across cabinets, institutional contexts and the proximity to legislative elections. In addition to structural attributes of governments, such as the presence and preferences of partisan veto players (see, for example, Angelova et al. Reference Angelova2018; Becher Reference Becher2010), the coalition mood affects legislative policy making. We have shown in this article that the mood causes delays in the legislative process. One could extend this analysis to study whether the mood affects, for example, the timing of the government's policy agenda (Martin Reference Martin2004) and major economic reforms (Hübscher and Sattler Reference Hübscher and Sattler2017; Strobl et al. Reference Strobl2021).
Secondly, the coalition mood could be used in research on government stability and termination. The long tradition of research on government termination suggests a wide range of cabinet-specific, party-system-specific and institutional factors that affect the ‘hazard’ of early government termination (see, for example, Krauss Reference Krauss2018; Laver Reference Laver2003; Saalfeld Reference Saalfeld, Müller, Strøm and Bergman2008; Schleiter and Morgan-Jones Reference Schleiter and Morgan-Jones2009; Strøm and Swindle Reference Strøm and Swindle2002; Warwick Reference Warwick1994). The coalition mood might add to this literature, providing a time-varying indicator for the likelihood of government termination. Recent research suggests that the hazard of early cabinet termination (in particular, the hazard of parliamentary dissolution) increases over time (see, for example, Diermeier and Stevenson Reference Diermeier and Stevenson1999; Saalfeld Reference Saalfeld, Müller, Strøm and Bergman2008). While there are very few attempts to identify explicit measures for such changes in the hazard of early government termination (Bergmann et al. Reference Bergmann2018), the coalition mood might fill that gap.
Thirdly, the coalition mood might also help to explain government formation. Past behaviour has likely consequences for government formation processes in the future (see, for example, Martin and Stevenson Reference Martin and Stevenson2010; Tavits Reference Tavits2008). The countries analysed in this article show a similar effect of the coalition mood: coalitions experiencing a steep mood decline in their final months in office are unlikely to be renewed after the next election. While the sample is too small to draw general conclusions, it would be worthwhile to analyse mood effects on government formation based on a broader comparative data set.
The coalition mood might also help to explain citizens' perceptions of partisan ideologies. There is substantial evidence that voters use government participation as a shortcut to understand what parties stand for (Fortunato and Stevenson Reference Fortunato and Stevenson2013). When two parties govern together, voters see them as more similar to each other ideologically (Falcó-Gimeno and Fernandez-Vazquez Reference Falcó-Gimeno and Fernandez-Vazquez2020; Fortunato and Adams Reference Fortunato and Adams2015; Fortunato and Stevenson Reference Fortunato and Stevenson2013). Yet, voter perceptions of the ideological proximity vary over time and are subject to mediated messages of party cooperation (Adams, Weschle and Wlezien Reference Adams, Weschle and Wlezien2021). Fourthly, following this line of research, future research could also analyse the role of the coalition mood for voter perceptions of party ideologies. The better the coalition mood, the closer the perceived ideological proximity between government parties should be.
Finally, applause patterns in parliament can be used to analyse intra- and inter-party levels of (latent) conflict more generally (that is, beyond the coalition mood). Applause for a party's own speakers, and particularly for party leadership, constitutes a way to measure the level of concord within parties. For single-party governments, this measure is the equivalent to the coalition mood in multiparty governments. Yet, applause data can also be used beyond government parties. For example, they provide for a measure of the ideological polarization in the party system (Blätte et al. Reference Blätte2019) that may complement analyses based on roll-call votes and parliamentary speech.
Despite these potential avenues for future research, there are at least two limitations of the coalition mood measure proposed in this article. First, not all legislatures provide applause data in an easy-to-use format. We focused on countries with detailed stenographic protocols, but extracting the same information for other legislatures (or longer time periods) requires considerable work to preprocess and validate the information given in protocols or videos of legislative debates.Footnote 27 Secondly, the proposed measure is deliberately agnostic about the reasons for (changes in) the coalition mood. Yet, this comes at a cost in terms of the explanatory power of the coalition mood. For example, we cannot safely assess whether changes in the coalition mood are caused by policy conflicts between coalition partners, disputes among coalition leaders or other potential explanatory factors. Therefore, the coalition mood can best be used as a general proxy measure for conflict in the coalition, rather than as a specific measure for policy- or non-policy-based conflict.
Supplementary Material
Online appendices are available at: https://doi.org/10.1017/S0007123421000739
Data Availability Statement
Replication data for this article can be found at: https://doi.org/10.7910/DVN/FEQSC7
Acknowledgements
Earlier versions of this article have been presented at: the Swiss Political Science Association Annual Conference & Dreiländertagung, Zurich, 14–16 February 2019; the EPSA Annual Conference, Belfast, 20–22 June 2019; the ECPR Summer School on Parliaments, Lisbon, 23 July–2 August 2019; and the ECPR Annual Conference, Wrocław, 4–7 September 2019. We thank all participants, in particular, Stefan Müller, Nolan McCarty, Kaare Strøm and Mariyana Angelova, for their valuable feedback and suggestions. We also thank Laurenz Ennser-Jedenastik for sharing his data with us.
Financial Support
Support for this research was provided by the German Research Foundation (DFG) (Project No. 418728321). Wolfgang C. Müller is grateful to the Austrian Science Fund (FWF) (Project No. I 1607-G11). Michael Imre was additionally supported by the University of Mannheim's Graduate School of Economic and Social Sciences.
Competing Interests
None.


 Open access

