


Introduction
Geological research has been part of nearly all archaeological excavations in the northern Netherlands during recent decades; this has been the case since the 1991–1993 excavations of the terp Wijnaldum-Tjitsma in the province of Friesland. Geology not only is indispensable for understanding the developing palaeo-landscape over time and the relationship between human inhabitants and the surrounding landscape. Geology also benefits from archaeology because it offers the opportunity to acquire detailed data and dates on palaeo-levels and on the development of the salt marsh and the coastal region in general. Archaeology has thus offered considerable information for reconstruction of the coastal evolution of this area (Vos & Gerrets, Reference Vos and Gerrets2005; Vos, Reference Vos2015). However, not all the coastal regions of the Netherlands have received equal attention. While the province of Friesland has been thoroughly investigated as part of large archaeological excavation programmes (Vos, Reference Vos, Besteman, Bos, Gerrets, Heidinga and De Koning1999; Nicolay, Reference Nicolay2010; Vos & de Lange, Reference Vos, de Lange and Nicolay2010; Nicolay & De Langen, Reference Nicolay and de Langen2015), the province of Groningen has received less archaeological attention, and therefore also less geological research. This paper will present and discuss the data on the start and development of salt marsh formation from two excavations in the northwestern part of the province of Groningen, the terps of Englum and Ezinge, and compare them to similar data from the excavation in the terp of Wijnaldum-Tjitsma in northwestern Friesland (Fig. 1). The new data enable a calculation of palaeo-sea levels and sea-level index points and of the rate of salt marsh formation along the coast of the present province of Groningen. The comparison between Ezinge, Englum and Wijnaldum reveals similarities and differences between these locations that must be related to (1) similar processes of salt marsh formation, and (2) differences in the palaeo-geography of different tidal basins and of the Wadden Sea and its barrier islands as a whole. Similar differences have been established for the German section of the Wadden Sea by Bungenstock & Weerts (Reference Bungenstock and Weerts2010, Reference Bungenstock and Weerts2012). We aim to establish sea-level index points for the Dutch Wadden Sea to increase our understanding of the relative sea-level rise (RSLR) during the late Holocene.
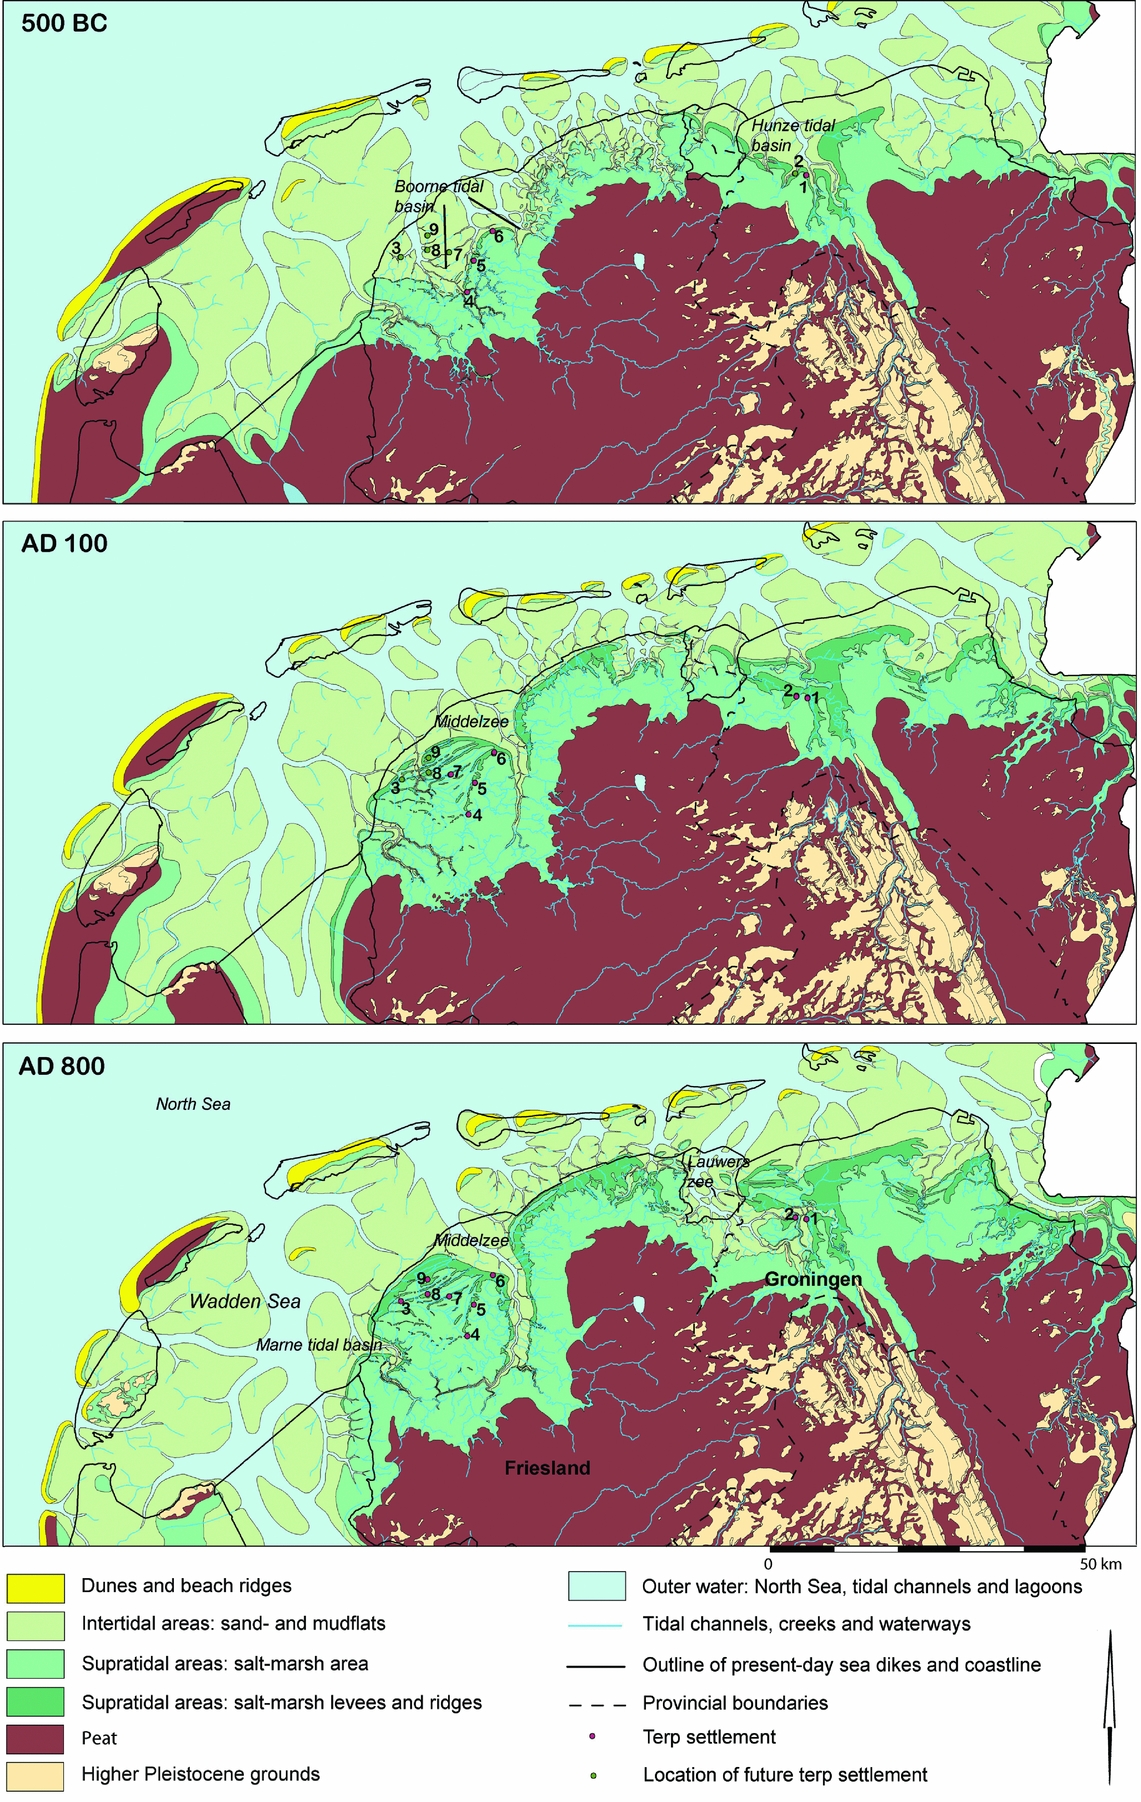
Palaeogeographical maps, 500 BC, AD 100 and AD 800, with place names and waterways mentioned in the text and in Figure 5. 1: Ezinge; 2: Englum; 3: Wijnaldum; 4: Winsum; 5: Dronrijp; 6: Beetgum; 7: Peins; 8: Dongjum; 9: Tzummarum. Maps: P.C. Vos and S. de Vries, Deltares.
The terp area of the northern Netherlands is a former salt marsh region situated along the southern coast of the Dutch Wadden Sea, which was open to the sea until endikement started in the 11th or 12th century AD (Vos & Knol, Reference Vos and Knol2015). The Wadden Sea came into existence around 5000 BC, when the rate of the post-glacial sea-level rise decreased up to a point that the net heightening by sedimentation surpassed the RSLR (Beets & Van der Spek, Reference Beets and van der Spek2000). The tidal basins were gradually filled in with tidal deposits, and extensive tidal mudflats and salt marshes came into being. Meanwhile, the North Sea coastline moved inland; as a result, tidal activity in the basins increased (Vos & Van Kesteren, Reference Vos and van Kesteren2000). Between 2000 and 1000 BC, deposits became sandier because of the increased tidal energy. Salt marsh ridges or levees, several hundreds of metres wide, formed along the seaward margins of the marshes in the tidal basins. The salt marsh area not only expanded, the marshes also increased in height; low salt marshes, inundated 50–200 days a year, turned into middle marshes, inundated up to 50 days a year, and finally into high marshes which were inundated only during high storm surges (Fig. 2). The rate of sedimentation decreased during expansion of the salt marsh since the frequency of inundations is inversely proportional to the elevation of the surface and the distance to the sea.
Schematic cross-section through different phases of a developing terp, usually starting on a salt marsh ridge at the level of a low middle marsh. Flooding and sedimentation continue during habitation, at a diminishing rate. As the terp increases in height, the subsoil under the terp subsides. Different shades of green: anthropogenic terp layers; a: salt marsh deposits; b: horizontal plane; c: level of Extreme High Water. Not to scale. Drawing A. Nieuwhof.

Habitation of the salt marsh region started around 650 BC (Taayke, Reference Taayke and Nieuwhof2016). Some of the early inhabitants may have lived directly on high marshes, but that soon changed. Geological and diatom research indicates that habitation usually started on a salt marsh ridge or levee that had reached the level of only a middle marsh (Vos Reference Vos, Besteman, Bos, Gerrets, Heidinga and De Koning1999, Reference Vos2015; Vos & Gerrets, Reference Vos and Gerrets2005). The great majority of settlements began as raised settlements: people built their houses on artificial dwelling mounds made of salt marsh sods, later also of animal dung. These dwelling mounds are defined as terps. The terps started as small house platforms with a height of 50–100 cm relative to the surrounding salt marsh. The extent of these artificial elevations was only slightly larger than the farmhouses constructed on top of them, and presumably they must have been sufficiently high to keep dry during storm surges. Over time, many of these platforms developed into mounds metres high and hundreds of metres in diameter, often much higher than necessary from the point of view of safety (Bazelmans et al., Reference Bazelmans, Meier, Nieuwhof, Spek and Vos2012; Nieuwhof & Schepers, Reference Nieuwhof and Schepers2016).
Inundations and sedimentation continued during habitation. The middle marsh gradually developed into a high marsh (Nieuwhof, Reference Nieuwhof2006). The salt marsh area also kept increasing in surface area, at a considerable rate; for instance, between 500 BC and AD 100 the salt marsh in the Hunze tidal basin in the northwestern part of the province of Groningen expanded around 5 km to the north (an average of over 8 m a−1) (Fig. 1). In the western part of the province of Friesland, a similar increase was established (Vos & Gerrets, Reference Vos and Gerrets2005: 73). Newly formed salt marsh ridges were inhabited by people from older settlements, a process that continued into the early Middle Ages.
Because of the ongoing sedimentation before endikement, the present surface surrounding terps is often considerably higher than the original surface under the terps. Under the deepest house platforms and datable anthropogenic layers, palaeo-surfaces are sometimes preserved. These make it possible to establish and date the elevation of these palaeo-surfaces in different periods.
Three excavations
Ezinge was excavated in the 1920s and 1930s, but analysis and full publication of the excavation results only started in 2011. The discovery in the excavation documentation of a set of notes that enable a reconstruction of the local landscape and that can be compared to the results of modern research was the incentive for writing this article. Both Ezinge and Englum are now situated on the western bank of the present river Reitdiep, but at the time of colonisation around 500 BC they were located on a salt marsh ridge on the southwestern bank of the Hunze tidal basin (Fig. 1). Ezinge and Englum are compared to Wijnaldum in the western part of Friesland, which was at the time of colonisation in the 2nd century AD located on the northwestern coast of a funnel-shaped tidal basin, the west branch of the Boorne system (Fig. 1). This tidal basin was already silted up to almost the present extent by then (Vos & Gerrets, Reference Vos and Gerrets2005; Vos & Knol, Reference Vos and Knol2015).
Ezinge was excavated between 1923 and 1934 by A.E. van Giffen, director of the Biological Archaeological Institute of the University of Groningen. Around 1.5 ha of a total of c. 16 ha, less than 10% of this large terp, was archaeologically excavated, while a major part was destroyed for the commercial extraction of fertile earth to be shipped inland to improve poor sandy and peaty soils. Despite the relatively limited size of the investigated area, the archaeological excavation resulted in a substantial dataset, including photographs, finds and hundreds of field drawings of the 22 levels that had been excavated in this terp. Van Giffen published the results only in some short, preliminary articles (Van Giffen, Reference van Giffen1926, Reference van Giffen1928, Reference van Giffen1931, Reference van Giffen1936). Full publication began in 2011, with the analysis of the finds (Nieuwhof, Reference Nieuwhof2014a). This is still underway, now aimed at the habitation history of Ezinge.
Van Giffen had an interest in sea-level change (Van Giffen, Reference van Giffen1910, Reference van Giffen1933) and made notes on the height of palaeo-surfaces in NAP (Dutch Ordnance Datum) on excavation drawings. Characteristics of the subsoil such as lamination were described only from 1932, and then only on a small number of drawings. Earlier, oxidised or reduced (‘yellow’ or ‘blue’) natural layers are sometimes described, often as sand, as an all-inclusive soil type. Some deep cores taken during the excavation reveal that peat, overlying the Pleistocene subsoil, is found between 9.30 and 9.80 m −NAP (including correction of −10 cm; see below). Archaeobotanical pioneer W. Beijerinck found leaf fragments of sedges (Carex) and grasses, a papilionaceous flower, pollen of grasses, birch (Betula), probably sorrel (Rumex), probably alder (Alnus), oak (Quercus), and reed (Phragmites), and 32 mostly marine diatom species in a sample from this peat layer (Van Giffen, Reference van Giffen1928: 45–48; find no. 1925/VIII/145). This basal peat layer was covered by calciferous, undoubtedly tidal deposits that were not specified any further. Excavation pictures show that laminated salt marsh sediments occur wherever sections reach into the subsoil (Fig. 3). A radiocarbon date, 2300 ± 65 BP, is available for the first phase of habitation at Ezinge. It is from a post from the earliest excavated house, sampled during a small, additional excavation campaign in 1964 (Van Giffen, Reference van Giffen and van Es1973). The calibrated date of 542–193 cal BC (GrN-4368, 94.0% probability; all radiocarbon dates are calibrated with Oxcal 4.2.4) is not precise enough to be of use, but pottery dates in combination with the stratigraphy date the beginning of habitation at Ezinge around 500 BC (Nieuwhof, Reference Nieuwhof and Nieuwhof2014b).
Excavation pictures from Ezinge (1933). Left: house remains from the late pre-Roman Iron Age. Under a level of c. 10 cm −NAP (indicated on the column of soil in white letters), alternating sandy and clayey salt marsh layers. They both form salt marsh deposits. The thick dark band in this layered sediment belongs to a shallow part of a creek that was still open during the first phase of habitation. Right: The same layers some metres away. The picture shows salt marsh layers, covered by the partly anthropogenic fill of the creek; this fill was covered by (partly trampled) salt marsh layers in the late pre-Roman Iron Age, before terp layers were applied here. Photos © University of Groningen, Groningen Intstitute of Archaeology.

The terp of Englum is situated 2 km west of Ezinge. A small excavation in a levelled part of the terp was carried out in 2000 by the Groningen Institute of Archaeology of the University of Groningen. Geological observations were published as part of the excavation report (Nieuwhof & Vos, Reference Nieuwhof, Vos and Nieuwhof2008). The assumed start of habitation at 450 BC is based on stratigraphy in combination with pottery dates (Nieuwhof, Reference Nieuwhof and Nieuwhof2008). The oldest radiocarbon date is of a dung sample from a house platform that still covered older anthropogenic features (GrN-25934: 2320 ± 20 BP; 406–374 cal BC, 2σ). Englum and Ezinge are thus comparable, not only because they are located near each other on the same salt marsh ridge, but also in age.
The terp of Wijnaldum-Tjitsma, excavated between 1991 and 1993, is located in the northwestern part of Friesland. This terp is of a considerably younger date than Ezinge and Englum; habitation started here in the middle of the 2nd century AD, as is clear from the stratigraphy, pottery dates and a radiocarbon date of an animal bone (GrN-21393: 1870 ± 30 BP, that is 73–226 cal AD, 2σ). This radiocarbon date belongs to the first phase of habitation (Gerrets & De Koning, Reference Gerrets, de Koning, Besteman, Bos, Gerrets, Heidinga and de Koning1999; Lanting & Van der Plicht, Reference Lanting and van der Plicht2012).
At Wijnaldum, palaeo-Extreme High Water levels were estimated on the basis of the heights of hearths on platforms belonging to consecutive habitation phases (Vos, Reference Vos, Besteman, Bos, Gerrets, Heidinga and De Koning1999; Vos & Gerrets, Reference Vos and Gerrets2005). The heights of platforms and hearths in Ezinge and Englum cannot be established with the same precision and therefore do not allow for similar calculations. There are reliable heights and dates for the boundary between the tidal flat and the overlying salt marsh deposit from all three excavations. These allow for a calculation of the level of MHW at the start of salt marsh formation.
Palaeo-sea-level data
Excavation data
The excavation data are summarised in Table 1. The top of the salt marsh deposits under the earliest house platforms at the central and highest part of the Ezinge terp was 0.20 m −NAP, as is noted on several field drawings. The height of the tidal-flat/salt-marsh boundary was noted on one of the excavation drawings from 1933, of the lower part of a profile near the centre of the terp, where it was around 4 m high (see Supplementary material available online at https://doi.org/10.1017/njg.2018.2). The elevation of the top of the tidal deposit under the earliest salt marsh deposit varies between 0.95 and 1.10 m −NAP over a distance of 23 m. The NAP heights measured in Ezinge, however, cannot be taken for granted but should be corrected with −10 cm (see below). The top of the tidal flat under the salt marsh deposit thus ranges between 1.05 and 1.20 m −NAP. That implies that the thickness of the salt marsh deposits here was 75–90 cm, since the measured 0.20 m −NAP of the surface under the oldest anthropogenic features should also be corrected with −10 cm. The measurements are corroborated by a boring in 1977 at the southwestern margin of the terp (www.dinoloket.nl, no. B07A0453), which shows that the boundary between sandy clays (probably salt marsh deposits) and underlying fine sand is found here at 1.00 m −NAP.
Salt marsh formation and palaeo-Mean High Water levels, and the rate of sedimentation, at Ezinge and Englum (both northwest Groningen) and at Wijnaldum (northwest Friesland). All radiocarbon dates are calibrated with Oxcal 4.2.4.

a Nieuwhof & Vos (Reference Nieuwhof, Vos and Nieuwhof2008).
b Vos (Reference Vos, Besteman, Bos, Gerrets, Heidinga and De Koning1999); Vos & Gerrets (Reference Vos and Gerrets2005).
c Measurements for Ezinge are corrected minus 5 cm for the height difference between NWP 1 and 2, and minus 5 cm extra for compaction due to subsidence in the period between this excavation and the excavations in Englum and Wijnaldum.
d In the pioneer zone, MHW is 20 ± 5 cm above the lowest level of the salt marsh deposits.
e See Fig. 5.
f 13C values are marine. Not corrected for 13C fractioning; by not correcting for fractionation, the marine reservoir effect is automatically taken into account because it has numerically the same value. Strictly speaking, these dates are not BP, since BP implies correction for fractioning (pers. comm. J. van der Plicht, Centre for Isotope Research, University of Groningen).
g This date was taken as point of departure by Vos (Reference Vos, Besteman, Bos, Gerrets, Heidinga and De Koning1999), but is replaced here by the slightly earlier date of Scrobicularia plana in the top of the tidal flat deposit, to make the dates of Englum and Wijnaldum comparable.
In Englum, the top of the tidal flat sloped down from 0.94 m −NAP in the margin of the terp to 1.02 m −NAP in the centre of the terp, where it was 4.2 m high. The top of the laminated salt marsh deposits under the earliest excavated features in the centre of the terp was measured at 0.34 m −NAP, but the laminated deposits were covered by a rather homogeneous layer of slightly sandy clay. The top of this layer, at 0.20 m −NAP, was probably the original surface, homogenised by trampling during the first years of habitation. It is therefore included in the salt marsh deposits. The salt marsh deposit on top of the tidal flat thus has a thickness of 82 cm. At Wijnaldum, the top of the salt marsh under the earliest platforms was found at 0.15 cm −NAP. The top of the tidal-flat deposits under the terp was at 1.00 m −NAP, and at 0.95 cm −NAP in the margin of the terp; salt marsh deposits thus have a thickness of 85 cm.
Radiocarbon dates of shells in live position in the top of the tidal flat under the salt marsh deposits are available from Englum and Wijnaldum. From Englum, two bivalves of Cerastoderma edule were dated, resulting in consistent outcomes of 2520 ± 50 BP and 2530 ± 50 BP (GrN-16794 and 16795). The consistency allows averaging to 2525 ± 35, that is 800–540 cal BC (2σ). At Wijnaldum, shells of Scrobicularia plana in life position were dated 2250 ± 45 BP, 400–200 cal BC (GrN-19581; 2σ). Here, additional dates come from shells in a storm surge layer at 85 cm −NAP. It was concluded that salt marsh formation started here between 200 and 175 BC (Vos, Reference Vos, Besteman, Bos, Gerrets, Heidinga and De Koning1999: 48).
Subsidence and NAP heights
The excavation data derive from research focused on various areas and periods; their comparability, especially of measured NAP heights, therefore needs to be discussed. Moreover, when calculating palaeo-levels, subsidence of the subsoil needs to be taken into account, even more so under heavy terp layers. Compaction of the terp layers does not play a role here, since only natural layers underneath the terp are dealt with here.
The northern Netherlands have been dealing with a RSLR since the last Ice Age. During recent millennia, this can be attributed mostly to glacio-isostatic and tectonic subsidence, which over this entire area has caused a RSLR of 5–10 cm per century over the last 2000 years (Vos & Van Kesteren, Reference Vos and van Kesteren2000), accelerating to 15–20 cm per century since 1850 (De Mulder et al., Reference de Mulder, Geluk, Ritsema, Westerhoff and Wong2003: 213). Autocompaction of tidal deposits and of the underlying peat beds is an additional cause of subsidence in the coastal area of the northern Netherlands. As was mentioned above, the basal peat bed at Ezinge is found between 9.30 and 9.80 m −NAP. At Englum, basal peat is found at around 10 m −NAP (www.dinoloket.nl, no. B07A0100). Both at Ezinge and Englum, the basal peat is covered by tidal sediments without peat layers. At Wijnaldum, Holocene sandy tidal channel deposits are found directly on the Pleistocene subsoil, at a depth of 12–15 m −NAP. The upper metres consist of very fine tidal flat sands, which hardly settle (Baardman in Vos, Reference Vos, Besteman, Bos, Gerrets, Heidinga and De Koning1999). Here, only the upper c. 1 m of this deposit is taken into account. It is assumed that the underlying tidal deposits were consolidated when salt marsh formation began.
The salt marsh was naturally drained during low tides before terps were built. Compaction due to drainage was included in the calculations of compaction of the salt marsh deposit for Wijnaldum (Baardman in Vos, Reference Vos, Besteman, Bos, Gerrets, Heidinga and De Koning1999). Underneath a terp, a freshwater lens will form over time, more or less as it will below dunes (Bakker, Reference Bakker1981). Despite impenetrable clay and dung layers in a terp, water can seep into the subsoil via ditches and ponds. Wells on terps are dug into these lenses. The highest level of a freshwater lens is higher than the surface surrounding a terp. The natural subsoil underneath is therefore relatively well protected against dehydration, even if the polder datum is kept at a low level. It may be assumed that compaction due to dehydration stopped once the natural surface became covered by terp layers.
Subsidence and settling of buildings and roads are included in the regular adjustments of the heights of NAP benchmarks. These heights are not related to the actual sea level but to the fundamental benchmark in Amsterdam that was established in 1683, via a network of underground benchmarks that are founded in relatively stable sand layers. The underground network also needs regular adjustment, the so-called Nauwkeurigheidswaterpassingen (NWP, ‘precision levellings’). Two of these NWPs, the second (1926–1940) and the fifth (2005), have resulted in considerable adjustments (Waalewijn, Reference Waalewijn1979; Brand et al., Reference Brand, van Brussel, ten Damme and Gerritsen2004). The second NWP is especially relevant when comparing Ezinge to the later excavations of Wijnaldum and Englum.
NAP heights used in Wijnaldum and Englum belong to the second NWP, while NAP heights of Ezinge are from the first NWP. The table in the Supplementary material (available online at https://doi.org/10.1017/njg.2018.2) shows the histories of the NAP benchmarks that are relevant here. These histories indicate subsidence in the northern Netherlands of 0.5–1 cm per century during the 20th century, relative to NAP (the actual RSLR is probably higher). Since 1996, when salt extraction started in the northwestern part of Friesland near Wijnaldum, the histories of NAP benchmarks show considerable adjustments, amounting to 13 cm between 1997 and 2013 near Wijnaldum. The excavation at Wijnaldum, however, ended before the beginning of salt extraction. NAP benchmarks near Englum and Ezinge do not seem to be strongly affected by the large-scale gas extraction in the northeastern part of the province of Groningen, which started in 1963. Between 1957 and 1997, the benchmark of Englum subsided at an average rate of 0.8 cm per decade; in and near Ezinge, subsidence amounted to 0.9 cm per decade between 1942 and 1997.
The NAP benchmarks used during these three excavations are known from the excavation archives. The NAP reference heights applied in Wijnaldum and Englum are from 1982 and 1991 respectively, in a period without conspicuous changes, which makes them easily comparable. Both benchmarks are within a short distance of the excavated areas. In Ezinge, the nearest benchmark was 3.8 km to the east, in the village of Garnwerd. Its published height (Rijkswaterstaat, 1925) was from the first NWP of 1875–1887; after the second NWP between 1926 and 1940 it was lowered considerably. Similar adjustments were necessary in the entire northern part of the Netherlands then, and can partly be ascribed to actual subsidence compared to NAP since the first NWP (Waalewijn Reference Waalewijn1979: 113ff.). The correctness of the measurements of the first NWP, however, is to be doubted, especially in the northern Netherlands (Waalewijn Reference Waalewijn1979: 126), so these numbers cannot be used to calculate subsidence back into the 19th century.
Considering the changes in the reference heights of NAP benchmarks, contemporaneous excavations are clearly preferred for comparisons over excavations that are far apart in time. If Ezinge had been excavated in the same period as Englum and Wijnaldum, its measured NAP heights would have been around 10 cm lower: −5 cm correction for NWP 2, and another −5 cm to allow for compaction between 1930 and 1990. A correction of −10 cm is therefore applied to all NAP heights measured during the excavation in Ezinge.
Subsidence of the top of the salt marsh and the top of the tidal-flat deposits under the terp has been calculated for Wijnaldum-Tjitsma. Subsidence of the top of the tidal-flat deposits there due to the weight of the overlying salt marsh deposit was established at 2–8 cm (Baardman in Vos, Reference Vos, Besteman, Bos, Gerrets, Heidinga and De Koning1999). The top of the salt marsh under this terp subsided, due to autocompaction and dehydration, between 5 and 15 cm (Baardman in Vos, Reference Vos, Besteman, Bos, Gerrets, Heidinga and De Koning1999). Since the composition of the subsoil, consisting of clastic sediments up to a depth of 6 m or more, is the same in Ezinge and Englum, these same numbers can be adopted for these terps as well. The amount of salt marsh subsidence here will be closer to 15 cm than to 5 cm, considering the heights of the terps of Englum and Ezinge (4.2 m and 5.7 m) compared to the terp of Wijnaldum-Tjitsma (2.6 m).
Results and discussion
Reconstructing palaeo-MHW
The height of the boundary between the top of the tidal flat deposits and the base of the laminated salt marsh deposits is closely related to the contemporaneous MHW level and can thus generate reliable sea-level index points for the Dutch Wadden Sea (Vos & Gerrets, Reference Vos and Gerrets2005; Vis et al., Reference Vis, Cohen, Westerhoff, ten Veen, Hijma, van der Spek, Vos, Shennan, Long and Horton2015). The boundary between the top of the tidal-flat deposits and the deepest crinkly lamination characteristic of salt marsh deposits, which represents the start of salt marsh formation, is 20 ± 5 cm below palaeo-MHW level (Roep & Van Regteren Altena, Reference Roep, van Regteren Altena, de Boer, van Gelder and Nio1988: 226). That it represents the start of salt marsh formation is supported by the occurrence of unbroken diatoms of the species Scoliopleura tumida, which belongs to the zone just below or around palaeo-MHW level, in the lower part of the salt marsh deposits at Wijnaldum (Vos, Reference Vos, Besteman, Bos, Gerrets, Heidinga and De Koning1999: 49). In Table 1, 20 ± 5 cm below palaeo-MHW is applied to the top tidal flat / base salt marsh boundary that has been established at Ezinge, Englum and Wijnaldum, to calculate palaeo-MHW levels.
Comparison of Ezinge and Englum with Wijnaldum (Table 1) shows strong similarities in NAP levels of the top of the salt marsh and the top of tidal-flat deposits under the salt marsh, and also in the corresponding palaeo-MHW levels, despite the period of 650 years between them. This similarity is remarkable because around 500 BC, when the first settlers arrived in Ezinge, the mean sea level in the northern Netherlands was considerably lower than it was 650 years later, when Wijnaldum became inhabited in the course of the 2nd century AD. The difference amounts to 33–65 cm, giving a rate of sea level rise of 5–10 cm per century over these years (Vos & Van Kesteren, Reference Vos and van Kesteren2000). The surface of the salt marsh at Ezinge compared to the mean sea level at the time of colonisation must have been considerably higher than it was at Wijnaldum (also 33–65 cm). What caused these similarities?
The start and rate of salt marsh formation are influenced by several interconnected factors: the relative sea-level rise, the supply of sediment, the fetch of waves, the storm frequency, and the location in a tidal basin. To start salt marsh formation on top of the tidal flats, sedimentation on the marsh must outreach the relative sea-level rise; a long fetch creates higher and stronger waves and thus larger sediment transport. In exposed parts of the salt marsh margins the deposited sediment fraction is coarser than in relatively sheltered parts. The salt marsh morphology is strongly determined by these effects.
Since both Wijnaldum and Englum/Ezinge were situated in the western part of a funnel-shaped basin, the influence of the geometry of the tidal basin can be ignored. However, it is clear that the prevailing winds and sufficient sediment supply together formed sandier salt marsh ridges and at an earlier stage in the eastern part of the Boorne tidal basin than in the western part (Vos & Gerrets, Reference Vos and Gerrets2005: 71). The salt marsh ridge of Wijnaldum only formed when the tidal basin was nearly filled in and the energy of wind and waves was directed differently. In the Hunze tidal basin, the entire southern coast of the basin seems to have been subjected to a relatively high tidal energy and sediment supply by which several broad salt marsh ridges were created over time. This difference between the Boorne and the Hunze tidal basins may be caused by their different positions in the Wadden Sea.
Rather than the mean sea level, it is the level of MHW that is related to salt marsh formation. MHW is not only determined by the mean sea level, but also by many other drivers such as the morphology of the tidal system and the size and location of the tidal inlets between the Wadden Sea Islands, factors which have changed over time. There are considerable local fluctuations, within tidal basins and in the Wadden Sea at large. The present situation is shown in Figure 4. MHW in the eastern part of the Wadden Sea, the Groningen region, is considerably higher nowadays than it is in the western part of the Wadden Sea, ranging from 0.54 +NAP near Den Helder in the extreme west to 1.31 +NAP near Delfzijl, at the northeast coast of the province of Groningen (also Kiden et al., Reference Kiden, Makaske and van de Plassche2008). The tidal range (between MHW and Mean Low Water, MLW) today ranges from 137 cm near Den Helder to 299 cm in Delfzijl. These differences are related to the geography of the North Sea coast and the location of the amphidromic points in the North Sea. MHW in the western part of the Wadden Sea was even lower before the Afsluitdijk (Enclosure Dike) closed off the Zuiderzee in 1932 (Misdorp et al., Reference Misdorp, Steyaert, De Ronde and Hallie1989). The higher tidal range and MHW indicate that the tidal energy in the eastern part of the Wadden Sea must be considerably higher than in the western part.
Differences in tidal ranges and the levels of high and low tide are related to the distance from the amphidromic point in the North Sea and to the morphology of the coastlines. The map shows the tidal wave of the North Sea and the tidal range difference as they are now along the present coastline. Inset: Mean High Water, Mean Low Water and tidal range of six locations along the Dutch coast. Rectangular: the study area of this paper. From Vos (Reference Vos2015).

The palaeo-MHW levels established for Englum and Ezinge can be compared to the range of MHW in the Wadden Sea that has been reconstructed by De Groot & De Gans (Reference de Groot, de Gans, Beets, Fischer and de Gans1996) on the basis of research on the Frisian Islands. This range was adapted and extended to earlier periods, first by Vos & Gerrets (Reference Vos and Gerrets2005) and then by Vos & Waldus (Reference Vos, Waldus and Waldus2012), on the basis of additional data from terp excavations in the western part of Friesland, including Wijnaldum (Fig. 5). These terps are from different periods and a variety of locations in the funnel-shaped Boorne tidal basin, at the east and the west of the basin (Fig. 1). Figure 5 shows that, while the MHW-level ranges that can be established for these Frisian terps all fall within a rather narrow range, even those from the eastern and sandier part of the Boorne tidal basin, Englum and Ezinge exceed the upper limit of the reconstructed range. This reconstructed range of MHW in the Wadden Sea, which is based on data from the western part of the Wadden Sea, does not seem to be applicable to the eastern part of the Wadden Sea. The reason might be that the differences in MHW and tidal range between the eastern and western parts of the Wadden Sea already existed in the 1st millennium BC. Of course, this hypothesis is based on data from only two terp locations only 2 km apart. Many more data are required to establish a reliable MHW curve for the Hunze tidal basin or the eastern part of the Dutch Wadden Sea as a whole.
The level of Mean High Water at the start of salt marsh formation in Ezinge, Englum and Wijnaldum, against the background of the range of MHW in the Wadden Sea that was first estimated by De Groot & De Gans (Reference de Groot, de Gans, Beets, Fischer and de Gans1996) on the basis of data from Wadden Sea Islands and that was later adapted on the basis of excavation data from Frisian terps by Vos & Waldus (Reference Vos, Waldus and Waldus2012). Englum and Ezinge are outliers, possibly because of a different tidal regime in the Hunze tidal basin or in the eastern part of the Dutch Wadden Sea area as a whole.

The rate of salt marsh formation
The thickness of the laminated salt marsh deposits, combined with established dates of the start of salt marsh formation and of habitation make it possible to calculate the rate of salt marsh formation in its early stages, from the pioneer zone up to the middle marsh, when habitation began (Table 1). The data from Ezinge make it possible to follow the rate of salt marsh formation also later, from the beginning of habitation to the start of endikement. The salt marsh developed from a middle marsh to a high marsh during this period. Van Giffen (Reference van Giffen1933) used these data to calculate a relative sea-level rise of 3–4 cm per century, since he assumed a one-to-one relationship between the elevation of the salt marsh over time and relative sea-level rise. However, more than to relative sea-level rise, the rate of salt marsh formation after the beginning of habitation is related to factors such as the stage of the salt marsh, developing from middle stage to high salt marsh; the amount and nature of the available sediment; the location near or further from the shore; and the local tidal energy.
At Wijnaldum, the 85 cm of salt marsh underneath the terp, the pioneer and lower salt marsh stages, took 325 years to form. The average rate of sedimentation thus amounts to 2.6 mm a−1 or 26 cm per century (Vos, Reference Vos, Besteman, Bos, Gerrets, Heidinga and De Koning1999: 65–66). This sedimentation rate lies between the lower sedimentation rate of less than 1.2 mm a−1 or 12 cm per century for salt marshes on the south side of the Wadden Sea coastal barrier islands and the much higher sedimentation rate of over 10 mm a−1 or 100 cm per century for salt marshes in estuaries along the North Sea coast of the Netherlands, Great Britain and Germany (De Leeuw et al., Reference de Leeuw, de Munck, Olff and Bakker1993; Olff et al., Reference Olff, de Leeuw, Bakker, Platerink and van Wijnen1997).
The thickness of the salt marsh deposits in Englum and Ezinge is nearly the same. The date of the start of salt marsh formation in Ezinge is unknown, but in Englum the start of salt marsh formation was dated, on the basis of radiocarbon dates of shells in life position, between 800 and 540 cal BC. Pottery research indicates that Englum was inhabited from around 450 BC. If salt marsh formation began in 800 BC, the average rate of salt marsh formation was 23 cm a−1; if it started in 540 BC, the average rate was 91 cm per century. The latter is improbable if it is compared to the average rate of 26 cm per century that was calculated for Wijnaldum, but not impossible. If MHW was higher and the tidal range was larger in the eastern part of the Wadden Sea, that may have caused a higher rate of sedimentation in this area, closer to the average sedimentation rate of marshes in estuaries.
At Ezinge, undisturbed surfaces under archaeologically dated layers were preserved not only under the earliest platforms, but also at several other locations. The archaeological dates of the overlying terp layers date these surfaces. Their elevation in combination with these dates give an indication of the developing salt marsh over time, from middle marsh at the beginning of habitation around 500 BC up to high marsh at the time of endikement, around AD 1200 (Fig. 6). The elevation around AD 1200 is estimated at 0.40 m +NAP here. The present surface elevation around the former terp varies between 0.35 and 0.95 m +NAP, but since 1200, inundations due to breaches in the Reitdiep dike and agricultural activity have changed the original surface height. The rate of sedimentation that can be inferred from the elevation data under terp layers was surprisingly constant, as Figure 6 shows. However, subsidence of old surfaces due to compaction should be taken into account. Between 500 BC and AD 600, around 5 cm of sediment was deposited every 100 years if the actual measurements are taken as a lead. Between the 6th and 12th centuries AD, the rate of sedimentation slightly decreased to 3–4 cm per century. Allowing for compaction under the terp, starting at 15–25 cm −NAP, the curve of Figure 6 is slightly less steep, and the rate of sedimentation is lower, respectively around 4 and 3 cm per century.
The elevation of the salt marsh surface as measured under platforms and terp layers, from the 5th century BC to the 12th century AD in Ezinge. NAP heights are corrected with −10 cm (see text). Data are available for the 5th and 3rd centuries BC and the 2nd, 6th and 9th centuries AD. The elevation in the 12th century is an estimate, based on the height of the present surface right outside the terp. The trend line suggests a constant rate of sedimentation for a large part of this period, though slightly diminishing from the 6th century AD. Due to compaction, the actual surface levels were slightly higher and the trend line correspondingly less steep.

These numbers are very low if they are compared to the rate of salt marsh formation of the pioneer and low salt marsh under the oldest terp layers as calculated for Englum, of 23–91 cm per century. As the salt marsh developed and became higher, the number of inundations and the rate of sedimentation strongly decreased. Moreover, the geography changed in this same period. At the beginning of habitation, Ezinge and Englum were coastal settlements (Fig. 1). Owing to the expanding salt marsh, they had become inland settlements at AD 100, though still situated in a salt marsh as botanical research has shown for Englum (Nieuwhof & Woldring, Reference Nieuwhof, Woldring and Nieuwhof2008). By AD 800, several new watercourses had come into existence near Ezinge and Englum, including the river Reitdiep directly north of these terps, owing to a new tidal basin, the Lauwerszee. Tidal influences must have regained importance in this period, but apparently caused less sedimentation than in earlier periods.
Conclusion
The terp excavations of Englum (excavated in 2000) and Ezinge (excavated 1923–1934 but analysed only recently) have produced new data on the start of salt marsh formation and the elevation of the salt marsh at the beginning of habitation in the 1st millennium BC in the western part of the province of Groningen. Although these are few data, they are consistent and offer the opportunity to compare this little-studied area with a geologically better-known region, that of the western part of the province of Friesland.
The comparison of Ezinge/Englum with the terp of Wijnaldum-Tjitsma in the western part of the province of Friesland shows remarkable similarities as well as a major difference. The similarities are in the levels of the tidal flat at the start of salt marsh formation (0.94–1.00 m −NAP), the thickness of the salt marsh deposits (75–90 cm), and the elevation of the salt marsh at the beginning of habitation (0.15–0.30 m −NAP). The similarity is striking in the light of the different dates: at Ezinge habitation began 500 BC and in Englum 450 BC, but at Wijnaldum around AD 150.
It is possible that the differences in the start of salt marsh formation and of habitation between these regions are related to differences in the tidal amplitude in different parts of the Wadden Sea. Today, MHW is considerably higher and the tidal range is much larger in the eastern part of the Wadden Sea than in the western part. The data suggest that this may already have been the case in the 1st millennium BC.
The elevation of the boundary between the top of the tidal flat and the base of the salt marsh under these terps provides sea-level index points: the level of MHW at the time of the start of salt marsh formation can be inferred from this boundary. If plotted in the reconstructed range of MHW levels in the Wadden Sea of the past 3000 years, the palaeo-MHW levels calculated for Ezinge and Englum are found at and over the upper limit of this range. This confirms earlier research in the German part of the Wadden Sea by Bungenstock and Weerts (Reference Bungenstock and Weerts2010, Reference Bungenstock and Weerts2012): it is not possible to establish one, general MHW sea-level curve for the entire Wadden Sea region. Regional differences need to be considered.
Regional circumstances also play an important role in the rate of salt marsh formation, since it is driven by interdependent factors such as the supply of sediment; the location near or further from the shore; and the local tidal and wave energy. In Wijnaldum, the rate of sedimentation before the beginning of habitation, at the stage of the pioneer and lower salt marsh, was established at 26 cm per century. In Englum and Ezinge, it was between 23 and 91 cm per century. After habitation began, inundations and sedimentation continued. The excavations in Ezinge provide data on the basis of which the rate of sedimentation during habitation, when the salt marsh developed from middle to high marsh, can be followed over the centuries. Sedimentation was considerably slower than during the formation of the pioneer and low salt marsh under the terp. Still, it continued steadily, despite changes in the regional geography. Between 500 BC and AD 600, the salt marsh gained 4–5 cm in height each century, developing from a low middle marsh to a high marsh; after AD 600 the rate of sedimentation slightly decreased to 3–4 cm per century.
Acknowledgements
The analysis of the excavation results of Ezinge began in 2011, owing to a grant from the Netherlands Organisation of Scientific Research (NWO). The project continues as part of the project Terpen- en Wierdenland. Een verhaal in ontwikkeling (‘The terp region. A developing story’), a project largely funded by the Dutch Waddenfonds. We want to thank Rijkswaterstaat for providing the histories of NAP benchmarks, and Prof. J. van der Plicht (Centre for Isotope Research, University of Groningen) for data on 13C fractioning and marine reservoir effects in shell samples.
We are very grateful to the reviewers for their valuable comments, and to Dr Gary Nobles for his English text correction.
Supplementary material
To view supplementary material for this article, please visit https://doi.org/10.1017/njg.2018.2


 Open access