


Introduction
Sorghum bicolor (L.) Moench, commonly referred to as sorghum (Ananda et al. Reference Ananda, Myrans, Norton, Gleadow, Furtado and Henry2020), is a drought-tolerant C4 cereal crop that belongs to the Poaceae family. The grain serves directly as a dietary staple for over 500 million people worldwide (Thakur et al. Reference Thakur, Gorthy, Vemula, Odeny, Ruperao, Sargar, Mehtre, Kalpande and Habyarimana2024). Its C4 photosynthetic pathway enables high water-use efficiency and tolerance to heat stress, making it well-suited to arid and semi-arid areas where water scarcity limits crop productivity (Way et al. Reference Way, Katul, Manzoni and Vico2014; Opoku et al. Reference Opoku, Sahu, Findurová, Holub, Urban and Klem2024). Given its inherent drought resilience, S. bicolor serves as an ideal system for uncovering the genetic and transcriptional mechanisms underlying drought adaptation, with potential applications in breeding more climate-resilient crops (Naoura et al. Reference Naoura, Sawadogo, Atchozou, Emendack, Hassan, Reoungal, Amos, Djirabaye, Tabo and Laza2019).
Mitigating water stress is a complex process involving multiple genes and stress response pathways (Yadava et al. Reference Yadava, Chaudhary, Yadav, Rizvi, Kumar, Srivastava, Soren, Bharadwaj, Srinivasan, Singh and Jain2023). Gene expression differences are dependent on factors such as the type of tissue, growth stage, and the type of stress the plant is experiencing. Several biochemical and physiological alterations take place due to gene expression changes upon stress (Abdel-Ghany et al. Reference Abdel-Ghany, Ullah, Ben-Hur and Reddy2020). Abscisic acid (ABA) is a key hormone involved in drought response. ABA receptors and ABA responsive element binding proteins (Aslam et al. Reference Aslam, Waseem, Jakada, Okal, Lei, Saqib, Yuan, Xu and Zhang2022) confer tolerance by regulating the ABA signal transduction pathway (Wang et al. Reference Wang, Li, Zhao, Hou and Dong2024). Differentially expressed genes due to drought stress are mainly involved in controlling stomatal closure and generating protectants against reactive-oxygen-species to stabilise cellular membranes (Guo et al. Reference Guo, Baum, Grando, Ceccarelli, Bai, Li, von Korff, Varshney, Graner and Valkoun2009). They also produce glycine-rich cell wall proteins, heat shock proteins, dehydrins, and enzymes involved in carbohydrate metabolism and nitrogen assimilation (Li et al. Reference Li, West, Hart, Wegrzyn, Smith, Domec, Loopstra and Casola2021; Zhao et al. Reference Zhao, Xiong, Yu, Wang, Zhang, Hao, Wang, Zhang and Zhang2024). The precise regulation of these metabolic pathways and gene networks is essential for determining the mechanisms that confer plant stress tolerance (Reis et al. Reference Reis, Mertz-Henning, Marcolino-Gomes, Rodrigues, Rockenbach-Marin, Fuganti-Pagliarini, Koltun, Gonçalves and Nepomuceno2020).
Although many physiological and morphological traits have been used to screen for drought resistance in sorghum (Yahaya et al. Reference Yahaya, Shimelis, Nebié, Mashilo and Pop2023; Myrans et al. Reference Myrans, McCausland, Johnson and Gleadow2024), the understanding of the genes and networks that are differentially expressed in response to drought stress is limited (Yahaya et al. Reference Yahaya, Shimelis, Nebié, Mashilo and Pop2023). Several studies have been conducted on differential gene expression in S. bicolor in response to water stress, yet key questions remain about tissue-specific responses (Johnson et al. Reference Johnson, Lim, Finkler, Fromm, Slabas and Knight2014; Abdel-Ghany et al. Reference Abdel-Ghany, Ullah, Ben-Hur and Reddy2020; Ananda et al. Reference Ananda, Norton, Blomstedt, Furtado, Møller, Gleadow and Henry2022). In particular, transcriptomic responses of the leaf sheath, a developmentally distinct tissue with relevance for biomass accumulation and forage quality, remain largely unexplored, and most studies have focused on seedlings rather than adult plants undergoing rapid vegetative growth (Zhang et al. Reference Zhang, Zeng, Liu, Gao, Li, Li, Song, Shi, Wang and Li2019; Abdel-Ghany et al. Reference Abdel-Ghany, Ullah, Ben-Hur and Reddy2020; Ma et al. Reference Ma, Liu, Guo, Wang, Zou and Zhang2025). A large number of up and down regulated genes have been found in these studies including membrane composition and signalling molecules, cryoprotectants, detoxification related genes, osmoprotectants, abscisic acid (ABA) responsive proteins, drought-responsive element binding proteins (DREB) and regulatory factors (Seki et al. Reference Seki, Narusaka, Ishida, Nanjo, Fujita, Oono, Kamiya, Nakajima, Enju, Sakurai, Satou, Akiyama, Taji, Yamaguchi-Shinozaki, Carninci, Kawai, Hayashizaki and Shinozaki2002; Gosal et al. Reference Gosal, Wani and Kang2009; Abdel-Ghany et al. Reference Abdel-Ghany, Ullah, Ben-Hur and Reddy2020; Azzouz-Olden et al. Reference Azzouz-Olden, Hunt and Dinkins2020). Identifying genes that change expression under water stress provides insight into the regulatory pathways plants use to cope with drought, informing the identification of candidate genes and pathways for future breeding and pre-breeding efforts.
In sorghum, drought stress not only reduces yield (Prasad et al. Reference Prasad, Govindaraj, Djanaguiraman, Djalovic, Shailani, Rawat, Singla-Pareek, Pareek and Prasad2021), but it can also increase the risk of livestock poisoning. This is because water stress alters metabolic pathways, often raising the concentration of dhurrin, a cyanogenic glucoside produced as a defence against herbivores (Gleadow and Møller Reference Gleadow and Møller2014). When plant tissues are damaged during grazing, dhurrin breaks down to release hydrogen cyanide (HCN), which at high levels can be lethal to cattle and other ruminants (Rosati et al. Reference Rosati, Blomstedt, Møller, Garnett and Gleadow2019; Ananda et al. Reference Ananda, Norton, Blomstedt, Furtado, Møller, Gleadow and Henry2022). Dhurrin is produced in all sorghum tissues except the seed (Gleadow et al. Reference Gleadow, Ottman, Kimball, Wall, Pinter, LaMorte and Leavitt2016; Nielsen et al. Reference Nielsen, Stuart, Pičmanová, Rasmussen, Olsen, Harholt, Møller and Bjarnholt2016) and its concentration is dependent on the genotype including substantial variation among cultivated sorghum lines and their wild relatives (Gleadow et al. Reference Gleadow, McKinley, Blomstedt, Lamb, Møller and Mullet2021; Cowan et al. Reference Cowan, Møller, Norton, Knudsen, Crocoll, Furtado, Henry, Blomstedt and Gleadow2022; Emendack et al. Reference Emendack, Sanchez and Laza2025), tissue type (Myrans and Gleadow Reference Myrans and Gleadow2022), plant age, stage of development, and growing conditions such as drought (Ananda et al. Reference Ananda, Norton, Blomstedt, Furtado, Møller, Gleadow and Henry2022). Dhurrin content in domesticated sorghum is significantly higher in the above-ground tissues than the roots (Cowan et al. Reference Cowan, Blomstedt, Møller, Henry, Gleadow and Norton2020). Understanding the genetic and environmental controls on dhurrin production is therefore critical for developing sorghum varieties and management practices that maintain productivity while reducing livestock toxicity risk. It is also essential for identifying useful regulatory variation in landraces and crop wild relatives for pre-breeding.
The key genes involved in dhurrin biosynthesis and bioactivation in S. bicolor are well characterised (Table 1) (Møller and Conn Reference Møller and Conn1979; Gleadow and Møller Reference Gleadow and Møller2014; Gleadow et al. Reference Gleadow, McKinley, Blomstedt, Lamb, Møller and Mullet2021; Quinn et al. Reference Quinn, Blomstedt and Gleadow2025), providing valuable targets for breeding programs aimed at reducing livestock toxicity risk. Dhurrin is synthesised from L-tyrosine through several steps catalysed by two cytochrome P450 enzymes and a UDP-glucosyltransferase, along with NADPH-dependent cytochrome P450 oxidoreductase (Gleadow et al. Reference Gleadow, McKinley, Blomstedt, Lamb, Møller and Mullet2021) (Table 1). Dhurrin biosynthesis genes are highly expressed in young developing vegetative tissues (Gleadow et al. Reference Zhang, Zeng, Liu, Gao, Li, Li, Song, Shi, Wang and Li2021). Once produced, dhurrin can be bioactivated to release HCN through the action of dhurrinase enzymes. NIT4A, NITB2, GSTL1 and GSTL2 are involved in dhurrin recycling (Table 1). The two transporter genes, SbMATE2 and SbCGTR1 mediate dhurrin movement within the plant (Table 1) (Gleadow et al. Reference Gleadow, McKinley, Blomstedt, Lamb, Møller and Mullet2021). Understanding how these genes are regulated across tissues, environmental conditions, and genotypes will inform breeding strategies by enabling selection of genotypes with reduced dhurrin accumulation in forage tissues while maintaining effective defence in young plants.
Key dhurrin pathway genes with their function, gene ID and gene name

Several studies have investigated the transcriptional response of S. bicolor to drought stress (Dugas et al. Reference Dugas, Monaco, Olson, Klein, Kumari, Ware and Klein2011; Fracasso et al. Reference Fracasso, Trindade and Amaducci2016; Ananda et al. Reference Ananda, Norton, Blomstedt, Furtado, Møller, Gleadow and Henry2022) often identifying substantial changes in gene expression in leaves. However, none have examined tissue-specific expression patterns across leaves, sheaths, and roots in adult plants using RNA sequencing, despite the likelihood that responses vary between tissues with distinct physiological roles. Here, we address this gap by analysing RNA-seq data from 8-week-old adult S. bicolor plants subjected to drought stress, quantifying tissue-specific differential expression and co-regulation of genes. This study is the first to include the sheath alongside leaves and roots, providing a tissue-resolved view of drought responses in adult plants that has not been captured previously. We tested whether drought-induced gene expression patterns differ among leaves, sheaths and roots during rapid vegetative growth, and whether these patterns explain previously observed phenotypic responses (Myrans et al. Reference Myrans, Chithrarachchige, Henry, Norton and Gleadow2025). Because BTx623 provides the main genomic reference for sorghum landraces and most wild relatives, understanding its tissue-specific drought regulatory landscape is a prerequisite for interpreting expression variation in plant genetic resources. Based on previous work, we predicted that drought would induce strong transcriptional changes in leaves and sheaths, where shifts in photosynthesis, water-use efficiency, and secondary metabolite production, including dhurrin biosynthesis, are expected, as well as in roots, which mediate water uptake. Drought has been shown to increase dhurrin concentration in above-ground tissues at this developmental stage (Myrans et al. Reference Myrans, Chithrarachchige, Henry, Norton and Gleadow2025), motivating an examination of transcriptional responses in stress and defence-related pathways. However, given that the reference genotype studied here is known for high drought tolerance, we also hypothesised that above-ground transcriptional responses might be attenuated compared with roots, reflecting a greater reliance on constitutive protective mechanisms in mature shoots.
Materials and methods
Plant growth
Samples for this study were taken from a random subset of Sorghum bicolor line BTx623 plants grown for the study by Myrans et al. (Reference Myrans, Chithrarachchige, Henry, Norton and Gleadow2025). Seeds were germinated in seedling trays and grown inside the greenhouse at Monash University, Clayton. Temperature was 31.35 ± 0.09°C and 21.46 ± 0.03°C Day/night, with a mean photoperiod of 13.7 h (average daytime illuminance was 7913 ± 103 lx). Supplementary light was provided using sodium lamps for 13 h per day (MK-1 Just-a-shade, Ablite, NSW, Australia). Soil for planting was prepared by mixing Debco Seed & Cutting premium germinating mix and river sand in (2:1 v/v ratio). After two weeks, seedlings were transferred to 6 L pots filled with the same soil mixture along with 30 g Scotts Osmocote All Purpose Landscape Controlled Release Fertilizer.
Drought and control treatment implementation and sampling
Drought and control treatments followed Marchin et al. (Reference Marchin, Ossola, Leishman and Ellsworth2020). Each pot had four 51 mm holes drilled into its base and was lined with 20 cm2 of 20 μm nylon mesh (Allied Filter Fabrics, Berkeley Vale, NSW). A total of 12 S. bicolor plants were grown, with 6 plants per treatment group (control and drought). Plants were assigned to control or drought treatments using a randomized incomplete block design. The potted plants were set on 23 cm Ideal Floral Foam Maxlife Bricks (OASIS Floral Australia, VIC, Australia), sitting inside 100 L plastic tubs with water level to a depth of 1 cm below the top of the tub (z = 1 cm). Plants were given two weeks to acclimatise to capillary watering in tubs, with z = 1 cm in all tubs. After this, water level in half of the tubs were drained down to z = 21 cm to impose the drought treatment. Control tubs were kept at z = 1 cm. Treatments were maintained for four weeks, with tub water levels topped up twice a week. The soil volumetric water content (VWC; %) of each pot was measured twice a week using a CS658 HydroSenseII with a 20 cm water content probe (Campbell Scientific Inc., UT, USA). If VWC was below 20% in a control pot or below 5% in a drought pot, 250 ml of water was added immediately to the pot through top watering to maintain the desired VWC. These thresholds were selected based on the results of Marchin et al. (Reference Marchin, Ossola, Leishman and Ellsworth2020), who used a similar soil composition to us, so that the VWC of control plants would be maintained above the permanent wilting point (14%) and droughted plants would have VWCs below this point. Top watering of droughted plants was also performed by Marchin et al. (Reference Marchin, Ossola, Leishman and Ellsworth2020) when VWC was < 5% in order to prevent plant deaths. After four weeks of treatment, leaf, sheath and root tissues were harvested. The timing and duration of the drought treatment were selected based on prior studies demonstrating that drought induced changes in biomass and HCN potential are detectable at this developmental stage. Specifically, plants were harvested at 8 weeks of age, matching the sampling age used in two independent studies of drought responses in S. bicolor (Cowan et al. Reference Cowan, Blomstedt, Møller, Henry, Gleadow and Norton2020; Ananda et al. Reference Ananda, Norton, Blomstedt, Furtado, Møller, Gleadow and Henry2022). In Cowan et al. (Reference Cowan, Blomstedt, Møller, Henry, Gleadow and Norton2020), drought effects on biomass as well as leaf and sheath HCNp were observed, while in Ananda et al. (Reference Ananda, Norton, Blomstedt, Furtado, Møller, Gleadow and Henry2022) changes in leaf HCNp were detected at this stage. Consistent with these previous findings, we observed significant effects of drought on biomass and on leaf and sheath HCNp in S. bicolor, while root HCNp was not affected. The concordance of our results with independent experiments conducted under different conditions supports the biological relevance of our sampling time and strengthens confidence in the observed drought responses. From the six plants per treatment, three biological replicates were selected for RNA extraction from each tissue type. Harvesting procedure involved snap freezing 100 mg of each of the tissue types in liquid nitrogen and storing at − 80°C until the RNA extraction.
RNA extraction and sequencing
RNA was extracted from three biological replicate plants per treatment, with leaf, sheath, and root tissues harvested from each plant. Frozen tissues were ground to a fine powder using FastPrep-24TM homogenizer (FastPrep-24, M.P. Biomedicals, California, USA) while maintaining the ice-cold conditions using dry ice. RNA extractions were performed using a Sigma-Aldrich SpectrumTM Plant total RNA extraction kit. On-column DNase digestion was performed using a Sigma-Aldrich on-column DNase 1 Digestion set. Extracted RNA was quality controlled using a nanodrop (Biolab), agarose gel electrophoresis (110 V, 100 mA, 45 minutes), a qubit 2.0 fluorometer (Invitrogen Qubit 2.0) and a bioanalyzer. Stranded mRNA libraries (polyA enrichment) were prepared by the Australian Genome Research Facility and sequenced on an Illumina NovaSeq X Plus platform (150 bp paired end reads), targeting ∼ 20 million reads per sample. Base calling and FASTQ conversion were performed using the Illumina DRAGEN BCL Convert pipeline (v07.021.645.4.0.3). The raw fastq files were uploaded to the Monash MASSIVE High-Performance Computing (HPC) facility to perform the downstream analysis.
Data analysis
Quality control: A total of 18 RNA samples were submitted for sequencing, of which all passed initial quality control and were subsequently used for library preparation. The raw fastq files were quality trimmed using fastp/0.20.0 to trim adapters, remove low-quality reads and trim polyA sequences from the 3′ ends. Fastp-filtered reads were validated using FastQC/v0.12.1. The quality trimmed reads were used for all the subsequent downstream analysis.
Read alignment and counting: Filtered reads were mapped to the Sorghum bicolor v3.1 reference genome (Phytozome) using the STAR aligner (v2.7.9a). Quality of the alignment was assessed using samtools (1.19.3) flagstat. Raw counts were obtained using featurecounts, a component of the Subread package (2.0.1).
Differential gene expression analysis and visualisation: Differential gene expression analysis was conducted using edgeR (Chen et al. Reference Chen, Mccarthy, Ritchie, Robinson, Smyth and Hall2008) with a particular focus on the expression profiles of key genes in the dhurrin biosynthesis pathway (Table 1). Raw gene counts were used as input data to conduct differential gene expression analysis using edgeR/4.0.16, which uses negative binomial distribution to model gene counts. Generalised linear modelling was implemented for this experiment with multiple factors. Low gene counts were filtered out using filterByExpr inbuilt function. This function retains genes that have CPM ≥ CPM.cutoff in MinSampleSize samples, where CPM.cutoff = min.count/median(lib.size)*1e6 and MinSampleSize is the smallest group sample size. Library sizes were normalised with the trimmed mean of M-values (TMM) method to account for differences in sequencing depth. A design matrix was created to model the experimental factors, including the tissue type and treatment as well as the treatment tissue interactions. For this experiment with multiple factors, Cox-Reid profile-adjusted likelihood (CR) method was used in estimating common, tagwise and trended dispersions. Differential expression was assessed using the quasi-likelihood F-test (QLF), which was chosen over the likelihood ratio test because our experiment had a small number of biological replicates per treatment (n = 3), and QLF methods provide stricter type I error control and more reliable detection under such conditions (Lun et al. Reference Lun, Chen and Smyth2016). Resulting P values were adjusted for multiple testing using the Benjamini and Hochberg false discovery rate (FDR) method, with genes considered differentially expressed at FDR < 0.05.
Multidimensional Scaling (MDS) plots and heatmaps were generated to visualise the differential gene expression patterns using the plotMDS function in edgeR and heatmap2 function in gplots package. MDS plots were utilised to view the sample clustering, overall structure of the data and potential outliers. Heatmaps were used to visualise the expression levels of the top ranked differentially expressed genes as well as key dhurrin genes and their expression patterns across samples.
Gene Ontology analysis: Gene Ontology enrichment analysis was conducted to identify the over-represented biological processes, molecular function and cellular components among the differentially expressed genes (DEG) in response to the treatment. GO terms were assigned to genes using the Sorghum bicolor v3.1 annotation, and enrichment analysis was conducted using the TopGO (2.56.0) R package. We used Fisher’s exact test to assess significance, using a threshold of 0.05. Ratio of differentially expressed genes for a particular GO term to the expected number of genes for the same GO term was used to calculate the enrichment. R package ggplot2 was used to visualise the information of the enriched GO terms. To confirm the robustness of the enrichment, GO terms were also cross-checked against the annotations of individual DEGs.
Constitutive expression analysis of known drought-responsive genes
To assess whether the absence of DEGs in leaf and sheath tissues under drought was due to constitutive expression of drought-responsive genes, we performed a targeted analysis. A curated list of known drought-responsive genes (Table S2) in S. bicolor was compiled from published sources. TPM (transcripts per million) values from control samples were extracted for all expressed genes and for the known drought-responsive subset across leaf, sheath, and root tissues using rpkm function in edgeR. Gene lengths required for TPM calculation were obtained from the annotation file. A Wilcoxon rank-sum test was used to compare TPM distributions, evaluating whether drought-responsive genes were significantly more expressed even under control conditions. This aimed to determine if their baseline activity masked differential expression during drought. Results were visualized using violin plots generated with the R packages ggplot2 and ggbeeswarm.
Weighted correlation network analysis (WGCNA)
WGCNA was conducted using the R package WGCNA (version 1.72-5) to identify clusters of co-expressed genes and relate them to experimental traits (tissue type, drought treatment). We constructed a signed network using Pearson correlation coefficients between variance-stabilised counts (vst, DESeq2), which were then used to build an adjacency matrix among genes. The soft-thresholding power was chosen as the lowest value where the scale-free topology fit index exceeded 0.8, which in our dataset was 20. The adjacency matrix was converted into a topological overlap matrix (TOM), and gene modules were defined using the blockwiseModules function with a minimum module size of 20 genes. Given the dataset comprised 18 samples (3 tissues × 2 treatments × 3 replicates), WGCNA was applied in an exploratory framework. The relatively small sample size may limit the stability of module detection, and results should therefore be interpreted with caution.
Module eigengenes, which represent the first principal component of the expression matrix, were calculated for each module to identify the gene clusters that are strongly linked with the experimental factors. The modules that are strongly associated with the experimental variables were selected and further examined for their expression profiles. The relationship between the expression profiles of modules and a specific trait of interest was evaluated by calculating the correlation between the trait (treatment or tissue group) and module eigengenes. This calculated pairwise correlation is the eigengene gene significance. Module trait relationships were visualized using heatmaps. Gene Ontology enrichment analysis was performed for the genes in the most significant modules following the approach described above. Hub genes in each of the significant modules were identified using chooseTopHubInEachModule in the WGCNA package.
Association of dhurrin pathway genes with co-expression modules
To investigate potential co-regulation of dhurrin pathway genes under drought, we examined the most significant WGCNA modules for the presence of known dhurrin biosynthesis, transport, and turnover genes (Table 1). In addition, the genomic locations of dhurrin genes and closely associated genes were examined to assess physical clustering, with a focus on known co-localisation of SbMATE2, several glutathione S-transferase (GST) genes (Table S1), and other genes previously reported as co-expressed with dhurrin genes. These genes are identified in the literature as co-expressed with dhurrin genes. Therefore, we investigated how these genes correlate with the dhurrin genes within a module under investigation.
Results
Sequencing output and global expression patterns
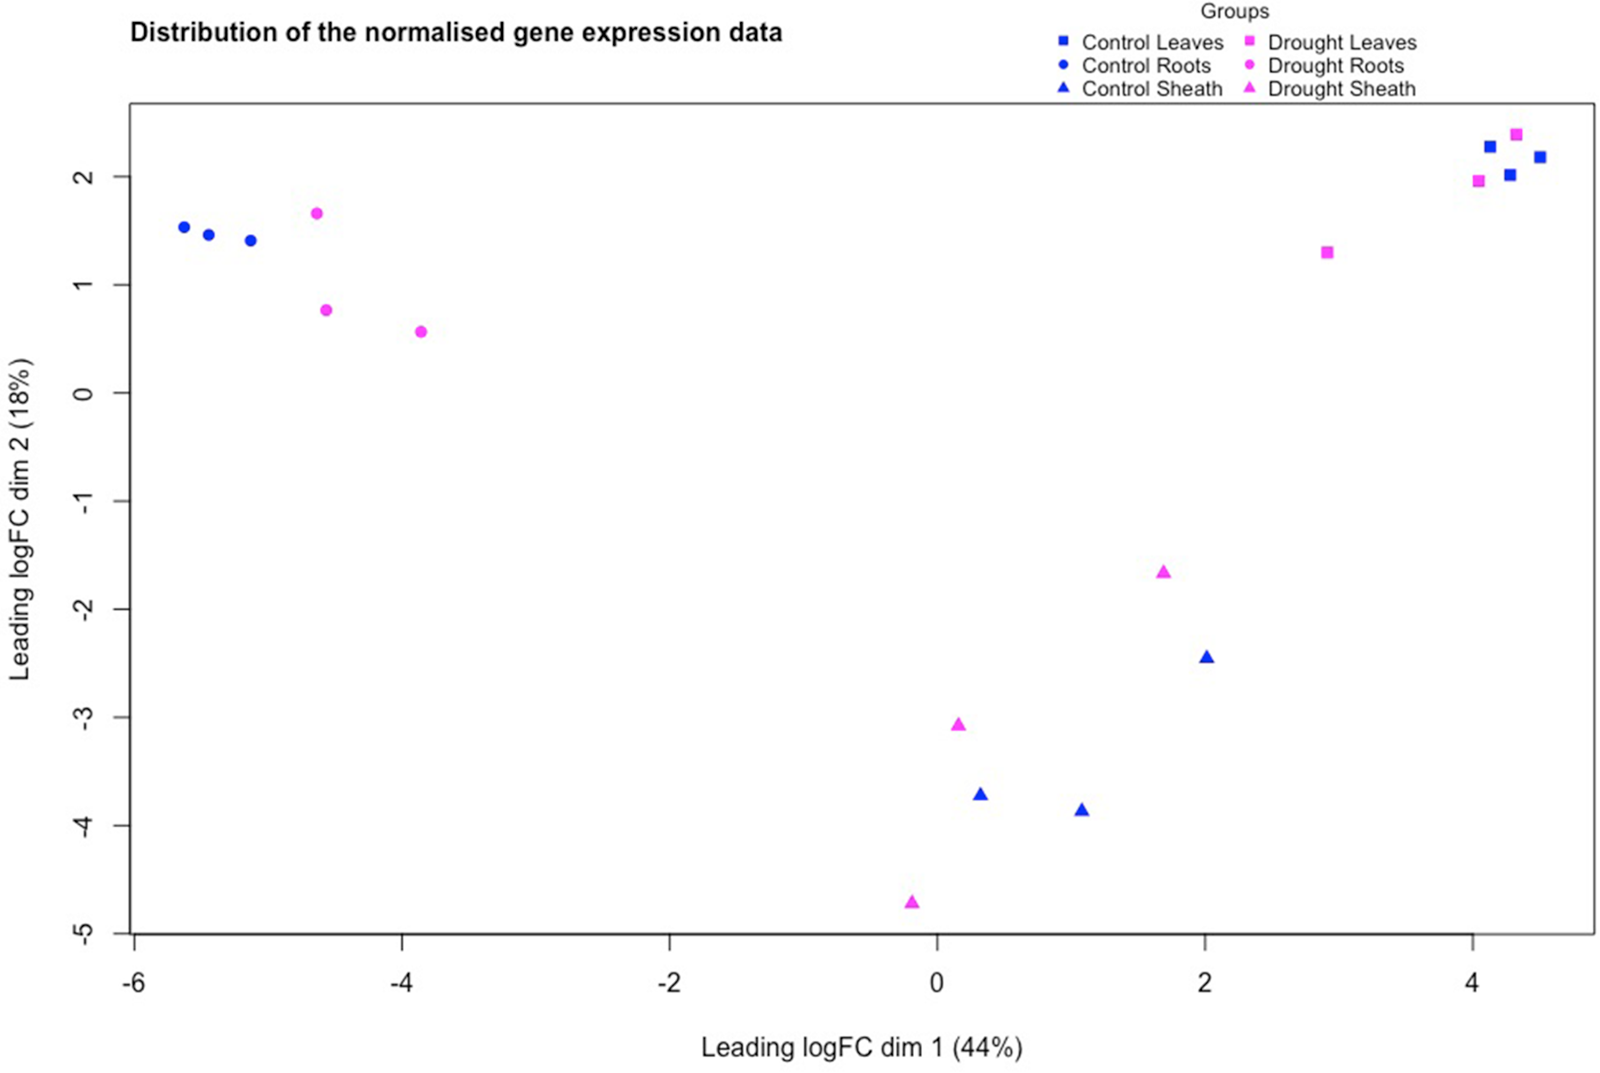
All 18 S. bicolor RNA samples passed quality control and proceeded to library preparation. Sequencing generated ∼ 1.25 billion paired-end reads (178 GB), with an average unique mapping rate of 94–97 % across tissues, indicating high-quality data suitable for downstream analysis. Multidimensional scaling (MDS) plots identified a distinct separation of the gene expression profiles among the three tissue types (leaf, sheath, root; Fig. 1), while control and drought treatments showed minimal separation within tissues. This suggests that tissue identity was the dominant driver of transcriptional variation, with limited global transcriptional reprogramming under the applied drought regime. Dhurrin biosynthetic genes clustered similarly to the whole-transcriptome patterns and showed no distinct treatment-specific expression at the global scale (Figure S1).
Distribution of the normalised gene expression data of the control (blue) and drought (magenta) treated samples of the three tissue types, leaves (squares), root (circles) and sheath (triangles) in S. Bicolor, using multidimensional scaling (MDS). Each of the square, circle and triangle represents a sample and the distance between them resembles how similar they are in gene expression.

Differential gene expression analysis
EdgeR differential gene expression analysis identified 56 genes between the control and drought treated roots with a false discovery (FDR) below 0.05. In contrast, no statistically differentially expressed genes were identified in the leaves and sheaths after FDR correction (Figure S4A and S4B). Importantly, none of the DEGs corresponded to key dhurrin biosynthesis, activation, or detoxification genes, indicating that the dhurrin pathway was not transcriptionally responsive under the conditions tested. This root-specific DEG pattern aligns with the MDS results, where tissue type, rather than treatment, explained most of the variation in gene expression. The drought response in this drought-tolerant sorghum variety therefore appeared to be localised to the root–soil interface, consistent with roots acting as the primary site of drought perception and signalling. Heatmaps for the top 50 genes ranked on p-values for the differential expression analysis revealed visually distinct patterns of expression between the treatments in all tissues, but high within-treatment variability, particularly in the leaves and sheaths, potentially masking treatment effects (Figure S3A and S3B). Interestingly, nearly half of these root DEGs were also part of a single co-expression module (module 8) identified in the WGCNA analysis (see below), potentially highlighting a coordinated drought-response network.
Functional enrichment of root DE genes
GO enrichment analysis for the 56 root DEGs between the control and drought samples yielded 166 GO terms in total, with ten reaching significance at p < 0.05 (Figure S2). Among the enriched terms, “response to oxidative stress” and “peroxidase activity” align with known drought-induced reactive oxygen species (ROS) production and the activation of antioxidant defence mechanisms in sorghum roots (Li et al. Reference Li, Li, Ke, Kwak, Zhang and Deng2020; Shi et al. Reference Shi, Zhang, Chen, Liu, Liu, Zheng, Zou and Wang2025). Given the small DEG gene set and limited gene support for most GO terms, findings likely reflect a narrow subset of the sorghum root’s drought-response repertoire, potentially indicating that this drought-tolerant genotype employs constitutive rather than inducible oxidative stress responses.
Constitutive expression of drought-responsive genes
Known drought-responsive genes showed varying levels of constitutive expression across tissues under control conditions. Root tissue exhibited the strongest enrichment (W = 158631, p = 1.3 × 10⁻⁴) (Fig. 2). In sheath tissue, these drought candidate genes were also significantly upregulated compared to the background set of all expressed genes (W = 141576, p = 3.2 x 10⁻³). However, in the leaf tissue, the expression of drought-responsive genes showed only a marginal increase relative to background genes (W = 120853, p = 0.054). Together, these results support the hypothesis that the lack of differentially expressed genes in leaf and sheath tissues under drought may be due, at least in part, to high constitutive expression of stress-responsive genes in control conditions. In contrast, roots, despite also showing constitutive enrichment, exhibited a small but detectable set of genes that responded dynamically to drought.
Baseline expression of known drought-responsive genes in control root tissues compared to background genes. Violin plots show transcript per million (TPM) values for a set of eight known drought-responsive genes (indicated by the eight blue dots on the right) and background genes (left) under control conditions. The analysis was performed to test whether drought-responsive genes are already expressed at baseline, which explains the limited differential expression under drought stress in this experiment.

Weighted gene correlation network analysis (WGCNA)
WGCNA of all 18 RNA-seq libraries identified 55 different co-expression modules ranging in size from 20 to 4798 genes. Module 1 was the largest and showed the greatest overall expression variation across tissues and treatments (Figure S6). Correlations between module eigengenes and traits revealed that module 48 (Figure S7A) had the highest positive correlation with the drought treatment (35 genes; hub gene Sobic.001G416300.v3.1, annotated as an expressed protein), whereas module 40 had the highest negative correlation (47 genes; enriched for ATPase-coupled transmembrane transporter activity and alternative oxidase activity) (Figure S6, Figure S7B). Neither module contained any dhurrin pathway genes. Interestingly, module 49 had the strongest positive drought response in roots (Fig. 3A, Figure S6) with genes enriched for threonine-type endopeptidase activity. In contrast, droughted leaves and sheaths had distinct top positive modules (modules 19 and 7 respectively) enriched for functions including magnesium ion binding, terpene synthase activity and ion iron ion binding.
Weighted gene co-expression network analysis (WGCNA) and gene ontology (GO) of root-associated positive drought-responsive module (module 49; panels A and B) and the module with the largest proportion of 56 differentially expressed genes in root tissues (module 8; panels C and D): (A) Heatmap illustrating the expression profiles of genes that make up module 49 which has the highest positive drought response in root tissues; (B) Bubble plot illustrating the enriched GO terms of module 49. BP, MF, and CC represent Biological Process, Molecular Function, and Cellular Component, respectively; (C) Heatmap illustrating the expression profiles of genes that make up module 8; (D) Bubble plot illustrating the enriched GO terms of module 8. BP, MF, and CC represent Biological Process, Molecular Function, and Cellular Component, respectively.

Mapping the 56 differentially expressed root genes to the WGCNA modules revealed that nearly half (23 genes) were in module 8 (total size: 538 genes). This represents a statistically significant enrichment (Fisher’s exact test, p = 1.53 × 10⁻²³), suggesting that drought-responsive transcriptional changes in roots are concentrated within this co-expressed gene network. Module 8 was enriched for nutrient reservoir activity and response to water, highlighting potential coordinated roles in drought adaptation (Fig. 3D).
Dhurrin pathway gene expression
Given that drought can alter HCNp in sorghum, we examined the expression of genes involved in the dhurrin biosynthesis, bioactivation, transportation and detoxification. The key dhurrin pathway genes were distributed across modules 1 (4 genes), 2 (1 gene) and 3 (1 gene) in the WGCNA network while 3 genes did not belong to any co-expression module. None of these genes were differentially expressed in response to drought in any tissue, consistent with the absence of a drought-induced transcriptional response in leaves, where HCNp is typically highest in cultivated S. bicolor (Gleadow et al. Reference Gleadow, McKinley, Blomstedt, Lamb, Møller and Mullet2021). Module 1 contained CYP71E1 (biosynthesis), DHR2 and HNL (bioactivation) and CAS C1 (detoxification). No known dhurrin-associated transporters or GST genes (Table S1) were detected in these modules.
Discussion
Drought causes significant decline in sorghum yield by disrupting physiological, genetic and molecular processes. Understanding the molecular basis of drought tolerance is important for developing resilient sorghum varieties. Here, we applied RNA-seq to characterise tissue-specific transcriptional responses to drought in Sorghum bicolor, integrating leaf, sheath, and root data to provide a more comprehensive view of drought adaptation in a drought-tolerant genotype (var. BTx623) (Abdel-Ghany et al. Reference Abdel-Ghany, Ullah, Ben-Hur and Reddy2020). Because BTx623 provides the primary genomic reference for sorghum, these data establish a baseline for interpreting regulatory variation across sorghum genetic diversity, including landraces and crop wild relatives, in future studies. This represents the first transcriptomic study to simultaneously assess differential gene expression across all three tissues, particularly the sheath, in adult plants. Because cyanogenic risk and forage quality are determined primarily in mature plants, focusing on adult sorghum provides insight into drought responses under agriculturally relevant conditions. By combining these molecular data with physiological measurements from the same experiment (Myrans et al. Reference Myrans, Chithrarachchige, Henry, Norton and Gleadow2025), this study offers an integrated assessment of how drought influences plant function at multiple biological levels. Despite clear physiological shifts under drought (Myrans et al. Reference Myrans, Chithrarachchige, Henry, Norton and Gleadow2025), transcriptional changes were modest and largely confined to roots, suggesting that this variety maintains drought resilience without extensive reprogramming of above-ground gene expression, consistent with constitutive protective mechanisms.
In the same experiment, physiological measurements from Myrans et al. (Reference Myrans, Chithrarachchige, Henry, Norton and Gleadow2025) showed that drought significantly reduced biomass, altered chemical composition and increased the root:shoot ratio of S. bicolor. These phenotypic changes are consistent with a shift toward belowground resource allocation under water limitation, a well-documented drought adaptation strategy (Eziz et al. Reference Eziz, Yan, Tian, Han, Tang and Fang2017). In Myrans et al. (Reference Myrans, Chithrarachchige, Henry, Norton and Gleadow2025), S. bicolor similarly exhibited pronounced phenotypic and biochemical differentiation between drought-stressed and well-watered plants. Mean biomass under control conditions (44.7 g) was more than twice that of drought-treated plants (20.7 g) accompanied by significant increases in root:shoot ratio under drought. Physiological traits were also affected: total chlorophyll concentration declined in response to drought (10.2 vs. 7.5 mg g−1), whereas the chlorophyll a:b ratio increased significantly. Droughted plants depicted elevated leaf phenolic concentrations relative to biomass. Consistent with these shifts, HCNp exhibited a substantial drought-induced elevation, particularly in the leaves, where concentrations increased from 480.6 to 797.5 µg g−1; sheath HCNp also increased, while root HCNp remained unaffected.
In contrast to these pronounced physiological adjustments, drought-induced transcriptional changes were modest and tissue-specific. MDS plots illustrated a clear clustering for the tissue types, reflective of known organ-specific expression patterns (Yaschenko et al. Reference Yaschenko, Fenech, Mazzoni-Putman, Alonso and Stepanova2022), but little separation was observed between drought and control samples within each tissue (Fig. 1). Consistent with this result, edgeR analysis detected 56 DEGs (FDR < 0.05) in roots, but none in leaves or sheaths. This divergence suggests that measurable physiological adjustments can occur even when transcriptional responses are subtle, particularly in drought-tolerant genotypes. The concentration of transcriptional responses in roots is expected given that roots are the first organs to sense water stress, which then triggers local stress responses before systemic signalling reaches the shoot, allowing the root system to adjust growth, water uptake capacity, and cellular protection mechanisms in anticipation of prolonged water stress (Rasheed et al. Reference Rasheed, Bashir, Matsui, Tanaka and Seki2016; Derakhshani et al. Reference Derakhshani, Ayalew, Mishina, Tanaka, Kawahara, Jafary and Oono2020). However, the strong tissue bias observed here is consistent with the high drought tolerance of BTx623 and the developmental stage examined.
Genotype-specific drought tolerance is a key factor shaping transcriptional responses in S. bicolor. Previous work has shown that drought-sensitive genotypes often exhibit broader and more intense transcriptional reprogramming than tolerant ones, which may rely more on constitutive protective traits (Fracasso et al. Reference Fracasso, Trindade and Amaducci2016; Shi et al. Reference Shi, Hou, Li, Hu, Wang, Wu and Yi2024). BTx623 is among the most drought-tolerant sorghum varieties, and the plants in this study were sampled during a developmental stage that can tolerate moderate water deficits with minimal impact on photosynthetic capacity and growth ( Martínez-Goñi et al. Reference Martínez-Goñi, Miranda-Apodaca and Pérez-López2015). Under these conditions, extensive transcriptional reprogramming outside of roots may be less pronounced. Supporting this, our analysis revealed that a curated set of drought-responsive genes exhibited elevated baseline expression under control conditions, especially in sheath and root tissues (Fig. 2). This suggests that BTx623 may be transcriptionally pre-adapted to drought, with key stress-related pathways already active prior to exposure. This interpretation aligns with the physiological data, which show that BTx623 can maintain above-ground function while reallocating biomass towards roots under water-limited conditions (Myrans et al. Reference Myrans, Chithrarachchige, Henry, Norton and Gleadow2025).
GO enrichment analysis of 56 differentially expressed genes (DEGs) revealed ten enriched GO terms across biological processes, molecular functions, and cellular components (Figure S2). While not exclusively associated with water stress tolerance, several these enriched GO terms have been previously associated with drought stress in sorghum (Fracasso et al. Reference Fracasso, Trindade and Amaducci2016). These included functions related to heme binding, oxidative stress responses, and calcium-mediated signalling, consistent with indirect stress-response pathways commonly activated under water limitation. Enrichment of Photosystem I and thylakoid membrane terms in root tissue may reflect the presence of green prop roots. Overall, the GO enrichment patterns support a modest, root-focused molecular response to drought involving stress-associated pathways rather than extensive transcriptional reprogramming.
Dhurrin, a cyanogenic glucoside involved in herbivore defence and possibly drought adaptation (Gleadow et al. Reference Gleadow, McKinley, Blomstedt, Lamb, Møller and Mullet2021; Gruss et al. Reference Gruss, Souza, Yang, Dahlberg and Tuinstra2023), has been shown to increase in concentration under drought (Ananda et al. Reference Ananda, Norton, Blomstedt, Furtado, Møller, Gleadow and Henry2022). However, none of the key biosynthetic, bioactivation, or detoxification genes were differentially expressed here, aligning with the absence of significant HCNp changes in roots (Myrans et al. Reference Myrans, Chithrarachchige, Henry, Norton and Gleadow2025). Elevated leaf and sheath HCNp that we observed under drought (Myrans et al. Reference Myrans, Chithrarachchige, Henry, Norton and Gleadow2025) was therefore, likely driven by post-transcriptional or metabolic regulation rather than transcriptional induction of the core pathway. The absence of transcriptional changes in dhurrin pathway genes may reflect the use of a drought-tolerant genotype examined at an adult developmental stage, as well as the temporal dynamics of stress exposure. In this study, transcriptomes were sampled after four weeks of continuous drought stress, representing an intermediate duration relative to previous studies. For example, Ananda et al. (Reference Ananda, Norton, Blomstedt, Furtado, Møller, Gleadow and Henry2022), reported no changes in dhurrin-related gene expression in S. bicolor under short-term drought (10 days), with transcriptional shifts occurring only after prolonged water deficit (47 days). Together these findings suggest that transcriptional regulation of dhurrin biosynthesis in S. bicolor operates on longer timescales or under more severe cumulative stress than those required to elicit physiological and metabolic responses, particularly in drought tolerant genotypes such as BTx623.
WGCNA modules are formed by clustering genes that share similar expression patterns, which in this dataset were primarily influenced by tissue type but also by treatment. Several modules showed significant correlations with drought, particularly in the roots. Module 8 contained 23 of the 56 root DEGs, the largest overlap of any module. The gene set was significantly enriched for several functional categories, including response to water, nutrient reservoir activity and negative regulation of growth, consistent with growth restraint as an adaptive response to water limitation (Fig. 3C, 3D).These functions are consistent with oxidative stress mitigation, osmotic adjustment and structural changes under water stress (Prasad et al. Reference Prasad, Govindaraj, Djanaguiraman, Djalovic, Shailani, Rawat, Singla-Pareek, Pareek and Prasad2021; Ma et al. Reference Ma, Liu, Guo, Wang, Zou and Zhang2025). Additional drought-associated modules in roots showed enrichment for functions related to membrane remodelling, protein turnover, and transport processes (Fig. 3B; Figure S7C). Together, these patterns suggest that drought responses in this drought-tolerant genotype involve coordinated modulation of cellular maintenance and resource allocation pathways in roots, rather than widespread transcriptional reprogramming across tissues.
Key genes involved in dhurrin biosynthesis (CYP71E1), bioactivation (DHR2 and HNL), and detoxification (CAS C1) were in module 1 – the largest co-expression module, primarily shaped by tissue-specific expression patterns (Figure S8A). However, none of the dhurrin-related genes were differentially expressed under drought stress. Given the lack of transcriptional induction, their presence in these modules may reflect constitutive co-expression or tissue-specific expression patterns not triggered by the applied stress. Additionally known dhurrin co-expression partners such as SbMATE2 and GST family genes linked to dhurrin recycling were absent, consistent with the limited transcriptional responsiveness of the dhurrin pathway in this drought-tolerant genotype at the adult stage.
Interpretation and implications
The limited transcriptional response to drought observed in Sorghum bicolor BTx623 is consistent with a drought-tolerant reference genotype examined during rapid vegetative growth, a developmental stage at which constitutive protective mechanisms may buffer above-ground tissues against water limitation. In this context, transcriptional responses were largely confined to roots, where oxidative stress responses and signalling pathways were modulated, while known drought-responsive genes and dhurrin pathway genes showed little change. This contrasts with reports of more extensive transcriptional reprogramming in drought-sensitive sorghum genotypes, which often exhibit stronger inducible responses under water stress (Fracasso et al. Reference Fracasso, Trindade and Amaducci2016). Rather than indicating an absence of drought response, these results suggest that BTx623 maintains resilience through constitutive or developmentally programmed regulatory states, with physiological and metabolic adjustments occurring in the absence of large-scale transcriptional reprogramming. This interpretation is supported by the integration of transcriptomic and physiological data from the same experiment, which revealed substantial shifts in biomass allocation, root:shoot ratio, and HCNp despite modest changes in gene expression. By establishing tissue-resolved transcriptional responses in the primary sorghum reference genotype, this study provides a baseline regulatory framework for comparative analyses across sorghum genetic diversity. In parallel experiments, we have characterised drought responses at the phenotypic and physiological level in wild sorghum relatives (Cowan et al. Reference Cowan, Blomstedt, Møller, Henry, Gleadow and Norton2020; Myrans et al. Reference Myrans, Chithrarachchige, Henry, Norton and Gleadow2025), but until recently lacked the genomic resources required to fully analyse their transcriptomes. The reference dataset presented here therefore enables future comparative RNA-seq and network analyses to directly test how regulatory responses to drought differ between cultivated sorghum and crop wild relatives with contrasting drought sensitivity and HCNp.
Supplementary material
The supplementary material for this article can be found at https://doi.org/10.1017/S1479262126100586.
Acknowledgements
The authors gratefully acknowledge Nawar Shamaya, Kira Maher, Prasangi de Silva, Saila Kabir, Emily Fu, and Monique van Dorssen for their assistance with sample collection and Cecilia Blomstedt for feedback on the manuscript. Computational resources were provided by the Monash M3 facility. This research was funded by the Australian Research Council Discovery Project DP210103010 awarded to R.M.G. and R.J.H. and a grant from the School of Biological Sciences to K.H. D.C. was supported by a Faculty of Science via a Dean’s Postgraduate Scholarship and a Dean’s International Postgraduate Research Scholarship.
Competing interests
The authors declare none.


 Open access