

INTRODUCTION
Injecting drug users (IDUs) are at increased risk of infection from hepatitis B (HBV) compared to non-IDUs. In England and Wales the prevalence of HBV core antibody amongst current IDUs is 21% [1], compared to 0·3% in the general population of the United Kingdom [2].
IDUs are at high risk of incarceration with >70% of IDUs aged >40 years in England and Wales reporting a previous spell of imprisonment [Reference Weild3], while IDUs spend less time in prison during each period of incarceration compared to non-IDUs [Reference Weild3, Reference Sutton4]. A high proportion of prisoners (24% [Reference Weild3]) have been found to have previously injected illicit drugs [Reference Weild3, Reference Gore5, Reference Allwright6] with the prevalence of HBV core antibody among prisoners in England and Wales being 8% [Reference Weild3].
Since 2001 HBV vaccination has been offered to prisoners on reception into selected prisons in England and Wales. For prisoners aged ⩾18 years a super-accelerated schedule has been implemented with vaccine doses administered at 0, 7, and 21 days while for those aged <18 years, doses are administered at 0, 1, and 2 months. For all ages, where possible, a booster dose 12 months after the first dose is offered, with no pre- or post-test vaccination antibody titre tests being undertaken. In recent years the coverage has increased and in 2005 about 15% of prisoners on reception into prisons in England and Wales were offered HBV vaccination (unpublished data from the prison HBV vaccination monitoring programme of England and Wales: Health Protection Agency Prison Infection Prevention Team).
Short campaigns of vaccinating prisoners across individual prisons have achieved high vaccination coverage for limited periods in attempts to interrupt community-based outbreaks of hepatitis A [Reference Vong7, Reference Gilbert8]. Periodic short campaigns may be a preferable way of vaccinating prisoners instead of offering vaccination on reception into prisons.
How should vaccination be administered in a prison setting? The objective of this study is to compare the impact of vaccinating continuously on reception into prison with a strategy of vaccinating the whole of the prison population periodically (a pulse vaccination strategy). These proposed strategies will be compared by considering the proportion of the IDU population vaccinated over time, the number of doses of vaccine required to administer each scenario, and the proportion of doses of vaccine that are administered to IDUs.
METHODS
Model structure
The model applied here has been described in a previous study [Reference Sutton4]. Briefly, a model has been developed to assess the potential impact of the HBV vaccination programme on the coverage of prisoners, ex-prisoners and IDUs. The model describes non-IDUs and IDUs as they flow in and out of prisons in England and Wales and start and stop injecting drugs. The model is stratified by injecting status (never injected, current injector, past injector), imprisonment status (never imprisoned, currently imprisoned, previously imprisoned), vaccination status (0, 1, 2, or ⩾3 doses received) and age (Fig. 1). The coverage of the vaccination programmes at reception or via a campaign is entered as an input into the model, with the model outputs including the vaccination status of IDUs and the number of vaccine doses used over time.
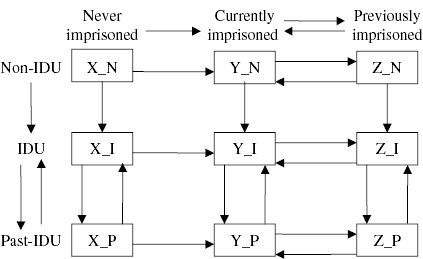
Fig. 1. Flow diagram of the turnover of prisoners in England and Wales [including injecting drug users (IDUs)]. The mutually exclusive compartments represent the different imprisonment and IDU states. Arrows represent the flow between the states. (X are individuals that have never been imprisoned, Y is the prison population, and Z are individuals previously imprisoned. N are those individuals that have never injected while I and P denote current and previous IDUs respectively). This structure is further stratified by age 15–74 years. The rates that individuals move between compartments may be age-dependent.
Prison vaccination scenarios
The prison vaccination scenarios here consider what proportion of individuals participate in the vaccination programme either on reception into prison, or via a pulse in which a proportion of the prison population is vaccinated at a specific time point.
During the period 2002–2005 vaccination was administered to prisoners on reception into prisons in England and Wales. Data collected as part of prison surveillance in England and Wales in 2003–2005 is used to guide the coverage estimates during this period. For all vaccination scenarios applied here these values are used to describe the vaccination coverage on reception into prison during this period with a ‘best guess’ estimate being taken for the 2002 value. From data taken from a previous study [Reference Gilbert9] it is assumed that for individuals on reception into prison who participate in the programme; 38% receive a single dose, 28% receive two doses, and 34% the complete three-dose schedule [Reference Sutton4] unless wasted doses are administered (see below). This reflects the possibility that prisoners may leave prison before having the chance to receive all three doses of vaccine.
To allow for additional vaccination being applied in the community, the community vaccination rate is assumed to be 0·1/IDU per year [Reference Sutton4]. For clarity of exposition this is assumed to be constant from 2002 onwards.
HBV vaccination schedules typically include a fourth booster dose administered 12 months after the third dose, this has not been considered here as most prisoners will leave prison before being eligible for a fourth dose. Instead it is assumed that three doses constitute a complete course of vaccination. To reflect the possibility that due to inaccurate record keeping or recall issues some individuals may be given unnecessary doses of vaccine it is assumed for all scenarios that 10% of individuals that have already received three doses of vaccine that participate in the programme will accept an additional unnecessary dose.
Continuous scenarios
Four alternative prison vaccination scenarios that describe vaccination coverage on reception into prisons in England and Wales are investigated. Taking coverage values from 2002 to 2005 at 5%, 7·5%, 10% and 15%, these scenarios consider the impact of varying levels of vaccination coverage on receptions into prison over time. Each continuous vaccination scenario assumes an alternative constant vaccination coverage from 2006 onwards of 30%, 50%, 80% and 100% respectively.
Pulse vaccination scenarios
For the pulse vaccination scenarios it is assumed from 2006 onwards that all vaccination on reception into prisons in England and Wales is ceased, and instead a policy of periodically vaccinating the entire prison population is adopted in addition to community vaccination. It is assumed for each pulse scenario that a pulse is delivered to a proportion of the prison population (30%, 50%, 80%, and 100%) at a given frequency (every 3 months, 6 months, 1 year and 2 years). Pulses are assumed to be implemented instantaneously with the same proportions of those offered vaccine receiving one, two or three doses as in the continuous scenarios, again this is because some individuals may leave prison before receiving three doses of vaccine. This approach does ensure greater comparability between the pulse and continuous scenarios. However, it is acknowledged that prisoners that are vaccinated in prison will be further into their prison sentences and therefore more likely to leave prison before receiving a complete course of vaccinations compared to prisoners vaccinated on reception into prison.
Scenario efficiency
IDUs are at increased risk from HBV infection compared to non-IDUs. To make a comparable measure between the efficiency of each scenario the proportion of the doses of vaccine that are administered to IDUs is considered.
RESULTS
Proportion of the IDU population vaccinated over time
Figure 2 shows a comparison between the continuous vaccination scenarios and the pulse scenarios implemented 3 months apart. The continuous scenarios capture a greater proportion of the IDU population than the comparable pulse scenario in each case. For example implementing the 80% continuous scenario may lead to >60% of the IDU population being vaccinated compared to <55% for the 80% 3-month pulse scenario.
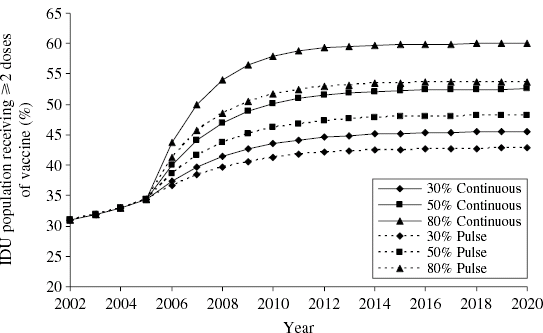
Fig. 2. Vaccination status of the injecting drug user (IDU) population over time under the continuous and pulse vaccination scenarios in which pulses are administered 3 months apart.
Figure 3 shows the vaccination status of the IDU population in 2012 for each of the pulse and continuous vaccination scenarios considered here. Offering vaccine to 100% of prisoners on reception into prison (continuous scenario) captures the greatest proportion of the IDU population with vaccine (⩾2 doses). In all cases the continuous scenario captures a greater proportion of the IDU population than the comparable (same percentage of prisoners offered vaccine) pulse scenario.

Fig. 3. Vaccination status of the injecting drug user (IDU) population in 2012 with variations in vaccination scenario. (For the 2-year pulses due to the oscillations of the vaccination coverage an average over 2011 and 2012 is taken.)
Number of doses required to implement each proposed scenario over time
An important consideration when comparing vaccination scenarios is the number of vaccination doses required to implement each scenario. From 2002 to 2005 the number of vaccination doses required is the same for each vaccination scenario, therefore only the number of doses required from 2006 to 2012 are considered here (Fig. 4a). The continuous scenarios require a greater number of doses than the pulse scenarios with the exception of pulse scenarios that are 3 months apart and have coverage of 80–100% (Fig. 4a).

Fig. 4. (a) Number of doses required to implement each vaccination scenario from 2006 to 2012. (b) Percentage of doses (first, second, third doses) given to under-vaccinated injecting drug users (IDUs) in 2012 with variation in the vaccination scenario. (c) The age-specific percentage of the IDU population receiving ⩾2 doses of vaccine in 2012 when applying the 100% continuous and 100% 3-month pulse scenario. (d) Percentage of doses that are administered unnecessarily with variation in the vaccination scenario. Key (panels a, b, d): ■, Continuous; □, 3-month pulse; ![]() , 6-month pulse;
, 6-month pulse; ![]() , 1-year pulse;
, 1-year pulse; ![]() , 2-year pulse.
, 2-year pulse.
Vaccination scenario efficiency
Taking the definition of scenario efficiency to be the proportion of doses of vaccine administered to IDUs, the efficiency of each scenario in 2012 is shown in Figure 4b. In all cases the continuous scenarios are considerably more efficient at capturing IDUs for vaccination than the pulse scenarios. For the pulse scenarios it can be seen that they become more efficient at vaccinating IDUs if they can be implemented with high coverage.
Age-specific vaccination coverage
Figure 4c shows the age-specific vaccination coverage in 2012 for the 100% continuous and 100% 3-month pulse scenarios. These scenarios have been chosen as they have been shown to be the most efficient at capturing IDUs for vaccination (Fig. 4b). The 100% continuous vaccination scenario captures a greater percentage of younger IDUs than the 100% 3-month pulse scenario. In both cases the age-specific percentage of the IDU population receiving ⩾2 doses of vaccine increases with age.
Wasted doses
Figure 4d shows what percentage of doses administered are given to individuals unnecessarily. In all cases the pulse vaccination scenarios waste more doses of vaccine than the continuous vaccination scenarios; the shorter the length of time between the pulses, the greater the wastage leading to many fully vaccinated individuals being exposed to repeated vaccination, this is due to there being less turnover of the prison population between pulses.
DISCUSSION
It has been established elsewhere that prison provides a good location in which to vaccinate IDUs for HBV [Reference Sutton4, Reference Hutchinson10–Reference Weinbaum, Sabin and Santibanez12]. The work here investigates whether it is preferable to offer HBV vaccination on reception into prisons, or whether the whole prison population should be periodically vaccinated by means of a vaccination campaign (pulse vaccination scenario). The work here makes a number of comparisons between a range of alternative hypothetical vaccination scenarios considering the percentage of the IDU population receiving ⩾2 doses of vaccine, the number of doses required to administer each scenario, and the efficiency of each scenario in terms of the proportion of vaccine doses administered to IDUs.
The present study shows that vaccinating on reception into prisons captures a higher proportion of the IDU population for vaccine than vaccinating the prison population periodically via a pulse. Considering the number of doses over time required to implement each vaccination scenario and the number of IDUs that are vaccinated allows us to measure the efficiency of each scenario at capturing the IDU population with vaccine. In all cases it was found that the continuous vaccination scenarios were more efficient at vaccinating IDUs than the pulse scenarios. It has been found in previous studies that IDUs are typically given shorter prison sentences compared to non-IDUs [Reference Weild3, Reference Sutton4, Reference Bird13]. A consequence of this is that there will be a greater proportion IDUs on reception into prison than in the prison population itself and hence reception will provide a better location in which to capture IDUs with vaccine.
Previous studies have shown that younger IDUs with shorter injecting career lengths are at increased risk of blood-borne virus infection compared to more experienced IDUs [Reference Sutton14]. Therefore it is of interest to consider whether a pulse or continuous vaccination strategy would be better at capturing younger IDUs for vaccination. The present study shows that when comparing the pulse and continuous vaccination scenarios that are most efficient at capturing the IDU population for vaccination (100% continuous and 100% 3-month pulse) (Fig. 4c) the continuous scenario captures a greater proportion of younger IDUs than the pulse scenario. This suggests that continuous vaccination on prison reception may also have a greater impact on the transmission of HBV compared to a pulse vaccination strategy.
The model used here describes the flow of IDUs and non-IDUs through prisons in England and Wales and reflects the differing offending characteristics of IDUs and non-IDUs. However, this model used an extensive survey of prisoners that was undertaken in 1997, and no survey of comparable size giving detailed data on the offending characteristics of IDUs in England and Wales has been undertaken since. If the offending characteristics of IDUs have changed since 1997 then this will not be reflected in the modelling work presented here, however, as data become available the model here can be re-parameterized to incorporate this new information.
The present study shows that vaccinating prisoners against HBV on reception into prison is preferable to periodically vaccinating the whole of prison population via a pulse. Vaccinating on reception into prison captures a greater proportion of the IDU population with vaccine, is more efficient at vaccinating the IDU population, and wastes less doses of vaccine than a pulse vaccination strategy. However, it should be noted that vaccinating on prison reception requires more doses of vaccine than a pulse vaccination campaign.
ACKNOWLEDGEMENTS
The authors thank Mary Piper and Prison Health at the Department of Health for England and Wales for funding this study.
DECLARATION OF INTEREST
None.


