
Naturalistic second language acquisition (L2A) tends not to reach nativelike ability. Although it may be sufficient for everyday communicative purposes, adult-acquired language predominantly includes nouns, verbs, and adverbs with closed-class items, in particular grammatical morphemes and prepositions, that fail to be put to full nativelike use (Bardovi-Harlig, Reference Bardovi-Harlig1992; Clahsen & Felser, Reference Clahsen and Felser2006; Klein, Reference Klein1998; Schmidt, Reference Schmidt1984; vanPatten, Reference vanPatten1996, Reference vanPatten, VanPatten and Williams2006). In comprehension, L2 learners prefer lexical to grammatical cues (Lee, Reference Lee, Gutiérrez-Rexach and Martínez–Gil1999; Lee, Cadierno, Glass, & VanPatten, Reference Lee, Cadierno, Glass and VanPatten1997; Musumeci, Reference Musumeci1989). In production, novice L2 learners make temporal references mostly by use of temporal adverbials, prepositional phrases, serialization, and calendric reference, with the grammatical expression of tense and aspect emerging only slowly thereafter, if at all (Bardovi-Harlig, Reference Bardovi-Harlig1992, Reference Bardovi-Harlig2000; Meisel, Reference Meisel and Pfaff1987; Noyau, Klein, & Dietrich, Reference Noyau, Klein and Dietrich1995).
One factor determining cue selection is salience: prepositional phrases, temporal adverbs, and other lexical cues to time are pronounced in the speech stream; they tend to be multisyllabic with at least one of the primary syllables receiving primary stress. Verbal inflections, in contrast, are often subsyllabic and unstressed (consider yesterday I walked). They are often unreliable as well; for example, in English the regular past tense morpheme can be pronounced /ed/ /d/ or /t/, but present tense verbs, as well as many other words, can also end with these phonemes/ letters. These factors make grammatical cues less easy to learn that lexical cues. However, they are equally of low salience and low reliability whether the language is learned as a first language (L1) or as a second language (L2). Something else must account for the grammatical limitations of L2A. Historically, the response to this question has been in terms of transfer and the ways that prior knowledge of an L1 biases attention in the learning of an additional language (James, Reference James1980; Lado, Reference Lado1957; Odlin, Reference Odlin1989). Contemporary theories of L2A that incorporate notions of transfer and learned attention include the competition model (MacWhinney, Reference MacWhinney and Robinson2001; MacWhinney & Bates, Reference MacWhinney and Bates1989; MacWhinney, Bates, & Kliegl, Reference MacWhinney, Bates and Kliegl1984), input processing theory (vanPatten, Reference vanPatten1996, Reference vanPatten, VanPatten and Williams2006), and the associative–cognitive CREED (Ellis, Reference Ellis, VanPatten and Williams2006c, Reference Ellis, Robinson and Ellis2008).
Associative learning research studies the range of transfer and inhibition effects that modulate learners’ attention to input as a result of prior experience. In particular, Kamin (Reference Kamin, Campbell and Church1969) and Kruschke (Reference Kruschke2006) describe the phenomenon of blocking. Learning that a particular stimulus is associated with a particular outcome makes it harder to learn that another cue, subsequently paired with that same outcome, is also a good predictor of it. For example, if an animal learns that conditioned stimulus (CS) X is a reliable predictor of an unconditioned stimulus (e.g., that a light reliably predicts the onset of some painful stimulus such as a shock), then it will not become conditioned to another CS, Y, or learn that any other CS predicts that unconditioned stimulus (e.g., that a bell predicts the onset of the shock the same way the light did). The prior association essentially “blocks” further associations. Blocking is an effect of learned attention (Kamin, Reference Kamin, Campbell and Church1969; Kruschke & Blair, Reference Kruschke and Blair2000; Mackintosh, Reference Mackintosh1975). It is a robust and ubiquitous phenomenon across animal and human learning (Moore & Schmajuk, Reference Moore and Schmajuk2008; Rescorla & Wagner, Reference Rescorla, Wagner, Black and Prokasy1972; Shanks, Reference Shanks1995, Reference Shanks2010; Wills, Reference Wills2005).
Ellis (Reference Ellis2006b) reviews this phenomenon as it might apply in L2A. There are many situations in natural language where cues are redundant (Schmidt, Reference Schmidt and Robinson2001; Terrell, Reference Terrell1991; vanPatten, Reference vanPatten, VanPatten and Williams2006) and thus, as a consequence of blocking, one of the redundant cues might be less readily learned. If a learners’ L1 experience has led them to look for a certain type of cue to interpretation, they might use these cues where available in L2A. If they do, the principles of associative learning predict that this will be to the detriment of learning other cues that might also be relevant. For example, L1-derived knowledge that there are reliable lexical cues to temporal reference (words like gestern, hier, ayer, yesterday) might block the acquisition of verb tense morphology from analysis of utterances such as Yesterday I walked.
Ellis and Sagarra (Reference Ellis and Sagarra2010b) explored these phenomena of learned attention in two experiments. The first demonstrated short-term instructional sequence effects in adults learning temporal reference in Latin using the standard blocking experimental paradigm (Kruschke, Reference Kruschke2006) but with linguistic content. Native English speakers learned a small number of Latin expressions and their English translations. There were three groups: adverb pretraining, control, and verb pretraining. In Phase 1, adverb pretraining participants learned two adverbs and their temporal reference, hodie “today” and heri “yesterday”; verb pretraining participants learned two verbs and their temporal reference, cogito “I think” present and cogitavi “I thought” past; the control group had no such pretraining. In Phase 2, all participants were shown sentences that appropriately combined an adverb and a verb (e.g., heri cogitavi “yesterday I thought,” hodie cogito “today I think,” cras cogitabo “tomorrow I will think”) and learned whether these sentences referred to the present, the past, or the future. If they chose incorrectly on any trial, they were given feedback as to the appropriate choice. In Phase 3, the comprehension test, all combinations of adverb (hodie, heri, cras) and verb tense marking (cogito, cogitavi, cogitabo) were combined, and the participants were asked to judge, without feedback, whether each sentence referred to the past, present, or future on a scale from 1 ( past) to 5 ( future). The logic of the design was as follows. In Phase 2 every utterance contained two temporal references—an adverb and a verbal inflection. If participants paid equal attention to these two cues, then in Phase 3 their judgments should be equally affected by them. However, if they paid more attention to adverbial ( /verbal) cues, then their judgments would be swayed toward them in Phase 3.
The results showed that the three groups reacted to the cues in very different ways. In two-cue sentences (where both an adverb and an inflection cued temporal information), when these cues deviated, the verb pretraining group followed the verbal cue, the adverb pretraining group followed the adverbial cue, and the control group lay in between. Multiple regression analyses, one for each group, where the dependent variable was group mean temporal interpretation for each of the Phase 3 strings and the independent variables were the information conveyed by the adverbial and verbal inflection cues, estimated the differential cue use by each of the three groups. These were, in standardized ß coefficients, adverb group time = 0.97 adverb + 0.23 verb; verb group time = 0.12 adverb + 0.97 verb; control group time = 0.60 adverb + 0.72 verb.
An additional design element allowed the inference that these results illustrate attentional biases to particular dimensions of cue (adverb vs. verbal inflection) rather than to particular words. In Phase 1, participants in the adverb and verb pretraining groups learned particular constructions relating to the present and the past. There was no reference to future at this stage. Thus, whereas subsequent responses relating to past and present judgments could reflect specific prior-learned associations, responses relating to future judgments could not. The Phase 3 results showed that the adverb and verb pretraining groups were as unalike and dissociated in their performance on cras “tomorrow” and cogitabo “I will think” items referring to the future as they were on the other past and present reference ones.
Ellis and Sagarra (Reference Ellis and Sagarra2011) extended the experimental paradigm to allow morphological cues in a more naturally complete state where the inflections reflected tense and person (cogito, cogitas, cogitat, “I think, you think, he thinks”; cogitavi, cogitavisti, cogitavit, “I thought, you thought, he thought”; cogitabo, cogitabis, cogitabit, “I will think, you will think, he will think”) in a design otherwise parallel to that of Ellis and Sagarra (Reference Ellis and Sagarra2010b). Under these conditions, participants overall came to rely much more on adverbial cues, with performance in the control group of time = 0.93 adverb + 0.17 verb (compare control group time = 0.60 adverb + 0.72 verb in Ellis & Sagarra, Reference Ellis and Sagarra2010b). However, against this background, again the adverb pretraining individuals paid greater subsequent attention to the adverbial cues, as the verb pretraining individuals did to the inflectional cues.
Learned attention effects can result in positive or negative transfer. Experience can lead us to pay more attention to cues we have known in the past, to process them more fluently or automatically, to be more open to particular evidence, to be positively disposed to arguments (+). It can also lead us to ignore new, foreign cues, to be blind to information, to be prejudiced against beliefs or explanations (−). Although these outcomes are often related, they are logically separable effects. In our language learning experiments, adverb pretraining might cause participants to pay more attention to adverbs in future language processing, but their future sensitivity to other morphological cues could be untouched by this history. Positive effects of frequency of exposure are those of entrenchment of the practiced cue (for a review of frequency effects, see Ellis, Reference Ellis2002a). Alternatively, increased sensitivity to adverb cues might be accompanied by a reduced sensitivity to morphological cues, that is, blocking as discussed in Ellis’ review of learned attention (Reference Ellis2006b). Increased reliance on one cue, means, or method tends to diminish reliance on others, but not necessarily so. Not only are these logically separable effects, but they are also empirically separable. In these experiments, entrenchment effects are indexed by increased sensitivity of the adverb group to adverbs, and increased sensitivity of the verb pretraining participants to verbs cues, relative to control participants. Blocking effects are indexed by decreased sensitivity of adverb pretraining participants to verb cues, and decreased sensitivity of verb pretraining participants to adverb cues, relative to controls. A meta-analysis of the combined results of Ellis and Sagarra (Reference Ellis and Sagarra2010b, Reference Ellis and Sagarra2011) demonstrated that the average effect size of entrenchment was large (+1.23) and that of blocking was moderate (−0.52).
An important question is whether these learned attention effects in L2A are overt or covert. Overt attention is the act of directing sense organs toward a stimulus source; covert attention is the act of mentally focusing on one of several possible sensory stimuli (Wright & Ward, Reference Wright and Ward2008). Overt attention involves physical orienting; covert attention is a neural process that enhances the signal from a particular part of the sensory input. There are various methodologies for tracking overt attention in L2A, such as think-aloud protocols, stimulated recall, and other measures of conscious focus (e.g., Bowles, Reference Bowles2010; Ellis, Reference Ellis1994; R. Ellis, Reference Ellis2005; Gass & Mackey, Reference Gass and Mackey2000). One direct measure that is gaining in currency is that of eye tracking, which is monitoring the timing and location of each fixation during visual study (Godfroid, Reference Godfroid and Robinson2012). Covert attention cannot be measured directly, but it can be inferred by analyzing behavioral cues, such as accuracy or fluency of processing, for evidence of cue-based learning.
After initial preexposure to a cue (X) that sets the bias, is the differential attention to cues X and Y co-present in the subsequent input in Phase 2 overt or covert? Do people spend more time looking at the blocking cue X and less time looking at the blocked cue Y? Further, if there are differences in overt attention to the cues in Phase 2, do these predict what is learned from this experience, as indexed by measures of covert attention to these cues as it affects comprehension in Phase 3 and production in Phase 4? Not only are these questions theoretically important, but they also have important pedagogical consequences. If acquisition from Phase 2 input is prejudiced as a consequence of the learner simply not looking at the blocked cues in the simultaneous input, there is instructional scope in directing their attention to these so to increase gaze fixations and dwell time. However, if acquisition is prejudiced because fixated physical input fails to become intake (Corder, Reference Corder1967), the challenge of successful intervention is greater.
Kruschke, Kappenman, and Hetrick (Reference Kruschke, Kappenman and Hetrick2005) demonstrated that eye tracking could be used to inform the processes of blocking in associative learning. They showed that participants’ eye gaze in a later XY training phase of a blocking experiment (the equivalent of our Phase 2) was greater for the blocking cue than the blocked cue, and that individual differences in this ratio covaried with covert indices of blocking in a subsequent testing phase (r = .48): individuals who showed stronger overt gaze preferences in the learning phase tended to show stronger blocking. We therefore adopt eye tracking here to investigate the locus of learned attention effects in L2A. As in Ellis and Sagarra (Reference Ellis and Sagarra2010b), the experiment involves the learning of a small number of Latin expressions and their English translations. It investigates the effects of successive learning of different types of cue for temporal reference, adverbs (hodie “today”; heri “yesterday”; cras “tomorrow”) and verbal inflections (cogito “I think”; cogitavi “I thought”; cogitabo “I will think”). Following Kruschke et al. (Reference Kruschke, Kappenman and Hetrick2005), it uses total gaze duration to each cue as an index of overt attention to that cue. It determines if the acquisition of one set of cues is impaired if another is already known as a reliable indicator of event time.
RESEARCH QUESTIONS
There are seven detailed research questions. The first set concerns the replication of Ellis and Sagarra (Reference Ellis and Sagarra2010b).
Research Question 1 (RQ1): Does early experience of adverbial cues prejudice the acquisition of verbal tense morphology, and, contrariwise, early experience of tense prejudice later learning of adverbs, as indexed in participants’ relative reliance on these cues in subsequent language comprehension?
Research Question 2 (RQ2): Do these learned attention effects also show themselves in relative accuracy in the ability to subsequently produce the cues?
Research Question 3 (RQ3): Do these behaviors generalize to references to future temporality, previously unexperienced in pretraining, and therefore demonstrate learned attention to cue dimensions rather than to particular items of content?
The second set concerns the overt/covert status of any learned attention to language effects.
Research Question 4 (RQ4): Does prior exposure to adverbial (/morphological) cues to temporal reference lead to biases in subsequent overt perceptual attention (as indexed by number of fixations and dwell time to that cue) in subsequent input where there are both adverbial and morphological cues to the same interpretation?
Research Question 5 (RQ5): Does any bias in overt attention to input cues in turn lead to subsequent overt attentional biases to the adverbial (/morphological) cue in subsequent language comprehension?
Research Question 6 (RQ6): Does any bias in overt attention to input cues in turn lead to subsequent covert attentional biases to the adverbial (/morphological) cue in subsequent language comprehension?
Research Question 7 (RQ7): Does any bias in overt attention to a particular input cue result in superior knowledge of that cue as indexed by subsequent production accuracy?
PARTICIPANTS
The participants were students between 18 and 24 years from a major US university. They were native speakers of English. They volunteered and were paid $10 for their participation in the experiment. They were randomly allocated to one of three groups. There were 16 people in the adverb pretraining group (6 men, 10 women), 16 in the verb pretraining group (3 men, 13 women), and 11 people in the no pretraining control group (5 men, 6 women).
MATERIALS AND PROCEDURE
The visual stimuli were presented on a computer monitor using SR Research Experiment Builder. Participants were seated approximately 24 in. from the screen. The visual angle from the fixation cross to the pictures was approximately 9 degrees. Eye position was recorded as participants viewed the stimuli using an EyeLink 2© Head-mounted Eye Tracking System. The eye and scene cameras were mounted on headgear, with a sampling rate of 500 Hz.
Before the start of Phase 1 (or Phase 2 for control participants), a 6-point calibration slide was presented, and participants’ gaze was calibrated and validated. On each trial, participants were presented with a fixation slide before stimuli appeared on the screen. The fixation point was used to monitor the amount of “drift” from accurate calibration, and if necessary, initiate recalibration. The entire experiment lasted less than 1 hr and comprised four phases: Phase 1, pretraining; Phase 2, sentence decoding; Phase 3, comprehension testing; and Phase 4, production testing. Between each phase, a drift correction screen was presented to confirm accuracy of eye tracking. The phases of the procedure are schematized in Figure 1.
Experimental design of Phases 1−4.

The data were organized and analyzed using the EyeLink® Data Viewer provided by SR Research. Statistical analyses were performed using R (R Development Core Team, 2008).
Phase 1
Participants in the adverb pretraining group in Phase 1 had 36 randomized trials where they saw either the adverb hodie “today” or the adverb heri “yesterday.” Note that Phase 1 involved only present and past temporal reference, no future. The participants had to choose whether today or yesterday was the correct translation by clicking the appropriate alternative with the mouse. These alternatives appeared in counterbalanced positions on the screen. A correct choice returned the feedback “correct”; an incorrect one received the feedback “wrong—the meaning of [Latin] is [English]” with these slots filled appropriately.
Participants in the verb pretraining group in Phase 1 were exposed to the inflectional cues cogito “I think” and cogitavi “I thought” instead of adverbial cues to tense and had to choose whether I think or I thought was the correct translation. Otherwise the procedure was as above. Again note that Phase 1 involved only present and past temporal reference, no future.
Participants in the no pretraining control group had no Phase 1.
After these different beginnings, all three groups of participants underwent identical Phases 2, 3, and 4.
Phase 2
In Phase 2, participants were exposed to six sentences (hodie cogito, cogito hodie, heri cogitavi, cogitavi heri, cras cogitabo, cogitabo cras), which correctly combined the adverb with a verb, three in adverb–verb word order and three in verb–adverb, and had to choose whether these sentences referred to the present, the past, or the future. Both word orders were used in order to counterbalance which cue was experienced first across sentences. There were six blocks of these trials to consolidate learning. Again, participants were given feedback if incorrect.
From the presentation of the fixation point at the start of Phase 2, the eye and scene cameras recorded eye movements and fixations at a rate of 500 samples per second. For each trial, fixation count, total dwell time, and first run dwell time were recorded and retrieved through the EyeLink Data Viewer. Fixation count is defined as the total number of fixations falling in a specific interest area, or the number of times a participant focuses on a specific area. Total dwell time is defined as the summation of the duration across all fixations on a specific interest area. First-run dwell time is defined as the summation of the duration across all fixations of the first run within a specific interest area. For this experiment, there were two rectangular regions of interest, approximately 2.5 cm high and 5 cm wide, centered upon each cue. Figure 2 shows two example trials with eye movement recordings. Each grey circle represents a fixation and the numbers next to it are the duration in milliseconds. Total dwell time and fixation count are strongly associated with each other and significantly, but less so, with first-run dwell time. For succinctness, we therefore report analyses only on dwell time in subsequent graphs, analysis of variance (ANOVAs), and correlational analyses. We choose total dwell time because, as the sum of the fixation time given to each cue, it is the most valid index of overt attention. Statistical analyses on fixation count and first-run dwell time generally parallel those on total dwell time. They are available from the authors on request.
Sample screenshots of eye-tracking data. Both images are of Phase 2 data. The top image is from an adverb-pretraining participant, while the bottom image is from a verb-pretraining participant. Each gray circle represents a fixation on that particular point, and the size of the circle is indicative of the duration of fixation. The number next to each fixation gives the exact duration of fixation (ms). [A color version of this figure can be viewed online at http://journals.cambridge.org/aps]

Phase 3
Following the lead of competition model studies of cue use (MacWhinney, Reference MacWhinney and MacWhinney1987), in the comprehension test, Phase 3, all combinations of adverb (hodie, heri, cras) and verb tense marking (cogito, cogitavi, cogitabo) were combined, and the participants were asked to judge whether each string referred to the past, present, or future on a 5-point scale. The factorial crossing of these cues resulted in sensible strings that the learners had experienced before, equivalent, for example, to today I think and tomorrow I will think; words which they had not experienced separately before, such as cras and cogitabo; and strange combinations equivalent to, for example, yesterday I think. The possible scale points were labeled 1 ( past), 2 (between past and present), 3 ( present), 4 (between present and future), and 5 (future). Participants were asked to type the number that they thought best applied. There was no feedback in Phase 3. Both permissible word orders were tested, and the block was repeated twice to allow reliable assessment of the relative weight that learners put on adverbial and inflectional cues to temporal reference. The average weight of the two cues within each string, which we will call the semidiem because it is a Latin experiment, is shown on the right side of the Phase 3 panel of Figure 1.
Eye movements were also recorded in Phase 3 using the same procedure as described above.
Phase 4
In the production test, Phase 4, participants were asked to translate from English to Latin by typing in the Latin equivalents of the various elements they had been exposed to: I thought, I think, I will think, Yesterday, Today, Tomorrow, Yesterday I thought, Today I think, Tomorrow I will think. There was no feedback on the Phase 4 responses.
The dependent variables were accuracy of learner responses on the adverbs and verbs in Phases 3 and 4 and the eye movements to these cues.
The logic of the experiment follows that of Ellis and Sagarra (Reference Ellis and Sagarra2010b). In Phase 2, every sentence comprises two cues, an adverb and a morphological inflection, which both cue the same temporal reference. Every participant experiences these together. Control participants only ever see them together. If participants pay equal attention to these two cues, then in Phase 3 their judgments should be equally affected by them, and in Phase 4 they should be equally good at producing adverbs and verbal inflections. However, if they pay more attention to the adverbial ( /verbal) cues, then their judgments will be swayed from the semidiem toward the adverbial ( /verbal morphological) cues in Phase 3, and they will better produce them in Phase 4.
Control performance in Phases 3 and 4 thus indicates how native English speakers naturally weigh these two cues, for example, whether more salient lexical cues overshadow less obvious morphological ones. Performance in the adverb pretraining group assesses potential learned attention and blocking as a detrimental effect of prior learning of lexical cues upon later learning of inflectional cues. Performance in the verb pretraining group assesses potential blocking as a detrimental effect of prior learning of inflectional cues upon later learning of lexical cues.
Subsequent responses relating to past and present judgments could reflect specific prior-learned associations as proactive interference effects where, as in paired associate learning experiments, memory for association A–B (e.g., present–cogito) is worse after prior learning of A–C (present–hodie) in comparison with a control condition involving prior learning of unrelated material D–E (Baddeley, Reference Baddeley1976, chap. 5). However, the future reference sentences cras cogitabo and cogitabo cras are a special case in that every participant, whether in the control, verb pretraining, or adverb pretraining group, experiences these two cues together only in Phase 2. Nobody has prior experience of these in Phase 1. They are thus a pure indicator of learned attention to adverbial or verbal cue type.
BEHAVIORAL RESULTS
Phase 2
By the second half of Phase 2, control performance, despite their having no prior training, was 80% correct compared to 97% for the adverb pretraining group and 90% for the verb pretraining group. The learning curves, divided by quarter, for each group through Phase 2 are shown in Figure 3. A two-factor ANOVA (three groups by four quarters with participants nested within groups) demonstrates a significant group effect, F (2, 40) = 4.19, p < .05, and a significant quarter effect, F (3, 120) = 15.9, p < .001, but no significant interaction between group and quarter. Post hoc testing using the Tukey honestly significant difference (HSD) test showed that the control group differed from both the adverb pretraining and verb pretraining groups (p < .001) but that these latter two groups did not differ significantly.
The percentage correct in Phase 2 according to group by quarter.

RQ1: Phase 3 perception data
In order to determine whether participants in the three groups differed in their cue use in Phase 3, we performed three multiple regression analyses, one for each group, where the dependent variable is group mean temporal interpretation for each of the 54 two-word strings and the independent variables are the interpretation cued by the adverbial cue and that by the verbal inflection. The differential cue uses by each of the three groups, in standardized ß coefficients, are shown in Table 1.
Regression analyses predicting mean temporal interpretation across the 36 two-word strings in Phase 3 as a function of adverbial and verb inflectional cue information in each of the three groups

***p < .001.
Participants in the control group, who had not been pretrained on either cue, were almost equally reliant upon the adverbial cue, ß = 0.64, p < .001, 95% confidence interval (CI) = [0.50, 0.77], and the verbal cue, ß = 0.66, p < 0.001, 95% CI = [0.53, 0.80]. Adverbial cues determined 41% of their ratings (.642), whereas verbal morphology accounted for 44%.
Against this baseline there are then effects of prior exposure to cues. Participants in the adverb pretraining group were wholly reliant upon the adverbial cue, ß = 0.99, p < .001, 95% CI = [0.96, 1.03], and much less affected by the verbal cue, ß = 0.06, p < .001, 95% CI = [0.03, 0.09]. Adverbial cues determined 99% of their ratings, whereas verbal morphology accounted for 0.04% with the CI for this value spanning zero.
Participants in the verb pretraining group were reliant upon both the adverbial, ß = 0.64, p < .001, 95% CI = [0.55, 0.73], and verbal, ß = 0.72, p < .001, 95% CI = [0.63, 0.81], cues. Adverbial cues determined 41% of their ratings, and verbal morphology accounted for 52%.
Comparing the 95% CIs for these coefficients across groups, using pooled variance CI estimates for the differences between these beta coefficients (Edwards, Reference Edwards1984) that show adverb cue sensitivity: adverb pretraining group > control group ≈ verb pretraining group (p < .01); verb cue sensitivity: verb pretraining group ≈ control group > adverb pretraining group (p < .01).
These differences in the relative amounts of variance explained by the adverb and verb cues on the mean group ratings are substantial. However, are the group performance means truly reflective of the individuals within that group or do they provide a central tendency that blurs individual within-group differences? To answer this, we took each individual's responses in Phase 3 and calculated the degree to which their temporal rating on each construction correlated with the information provided by the verb cue and that separately provided by the adverbial cue. These Pearson correlations show the degree to which each participant is biased by each cue. Figure 4, which plots each individual in the space defined in this way, shows a majority of the adverb pretraining individuals to be heavily influenced by the adverb cue much more than the verbs. Participants in the verb pretraining group are more divided: there is a cluster of seven individuals who are heavily influenced by the verb cue and not at all the adverb; there are three individuals on the diagonal, seemingly influenced by both; there are five individuals who follow the adverb information; and there is one individual who does not seem to know what's going on. Control participants are similarly clustered, with three individuals strongly influenced by the verb but not the adverb, and two individuals influenced by the adverb but not the verb. On the whole, not many participants lie along the 45% diagonal, equally affected by these two cues as the beta weights for the verb or control groups means might suggest. This finding is in line with others demonstrating that, in the early stages of acquisition of a problem space comprising multiple cues to interpretation, participants had to focus upon one cue at a time, exploring its utility and only introducing others later, one by one, as they reduce error of estimation (Cheng & Holyoak, Reference Cheng, Holyoak, Meyer and Roitblat1995; MacWhinney, Reference MacWhinney and MacWhinney1987; Matessa & Anderson, Reference Matessa and Anderson2000; McDonald, Reference McDonald1986). It also replicates the pattern found in Ellis and Sagarra (Reference Ellis and Sagarra2010b).
Individual participants from the three training groups as they are affected by adverbial and verbal inflectional cues to temporal reference in Phase 3. [A color version of this figure can be viewed online at http://journals.cambridge.org/aps]

The group means of these correlations are shown in Figure 5. These group means of the individual correlations within each group are slightly different, because of the different orders of steps of calculation, from the correlations of the group mean scores over the individuals, but the patterns are substantially the same. The adverb pretraining group continues to be exclusively influenced by the adverb, M = 0.90, 95% CI = [0.87, 0.93], but not the verb, M = 0.05, 95% CI = [−0.03, 0.14], control participants are almost equally influenced by the adverb, M = 0.37, 95% CI = [0.10, 0.63], and the verb, M = 0.40, 95% CI = [0.10, 0.70], and the verb pretraining group are influenced by both adverb, M = 0.39, 95% CI = [0.16, 0.61], and verb, M = 0.45, 95% CI = [0.26, 0.65]. A two-factor ANOVA (3 groups × 2 cues with participants nested within groups) shows a highly significant interaction between group and cue, F (2, 40) = 13.0, p < .001, a significant main cue effect, F (1, 40) = 10.95, p < .01, but no effect of group, F (2, 40) = 1.10, p = 0.34. Post hoc testing using the Tukey HSD test showed that the adverb pretraining group differed from both the control and verb pretraining groups in adverb cue use (p < .001) but that these latter two groups did not differ significantly. The verb pretraining group members were significantly more sensitive than adverb pretraining groups to the verb cue (p < .01) but not more sensitive than the control group, and the control group was marginally significantly more sensitive than the adverb pretraining group to the verbs using a directional test in the predicted direction (p < .05, one tailed).
Group mean correlations between individual participants’ ratings on each sentence in Phase 3 and the information given by the adverb and verb cues in those sentences.

RQ2: Phase 4 production data
The production data parallel these patterns. Table 2 shows two typical individuals’ responses from Phase 4 of the experiment where participants were asked to produce, for the first time, utterances in Latin that related to event time. The adverb pretraining participant provided the appropriate adverb on every trial where required, and often on trials where they were not, alongside some variation on the verb cogito, but usually incorrectly. The verb pretraining participant usually provided the appropriate tense inflections where required. When asked for a bare adverb, they did provide one, though they had some confusion over spelling of the adverb hodie. Phase 4 was less transparent for control group participants because they had not learned the translations in Phase 1. Nevertheless, most control participants attempted this phase, and like language learners the world over, made a reasonable stab at generalizing from what they already knew.
Two individuals’ qualitative responses from Phase 4 illustrative of each group's performance

Note: Responses were taken from the same adverb pretraining and verb pretraining participants whose eye movements are seen in Figure 2.
To analyze the production data across individuals, each response was given a score of 0 to 1 for adverb and/or verb based on the following criteria. For the adverb, a score of 0 was given if no adverb was provided or the wrong adverb was provided, and a score of 1 was given if the adverb was given and spelled correctly. Intermediate scores of 0.33 were given if the adverb was misspelled by two letters (e.g. “codi” for “hodie”) while being a closer match to the target and 0.66 if the correct adverb was given but misspelled by one letter. For the verbs, a key factor in the scoring was the distinction between using a b in the ending for the future tense, a v in the ending for the past tense, and a lack of b or v for the present tense. A score of 0 was given if no verb was provided, and a score of 1 was given for the correct verb and correct spelling. Intermediate scores of 0.33 were given if a unique verb form was used to represent this tense albeit one which did not make the correct distinction between b or v, or the correct future/past distinction was used (b vs. v) but the root was badly misspelled; a score of .66 was given for answers that included cog or cogit as the root and included correct use of the future/past (b/v) distinction but included some slight misspelling. Each participant translated 9 unique items twice, for a total of 18 items. Among these 18 items, 12 required adverb production and 12 required verb production. For each participant, a proportion correct score was calculated separately for verb and adverb production.
The group means of these production scores are shown in Figure 6. The adverb group was able to produce adverbs, M = 0.84, 95% CI = [0.72, 0.96], much more accurately than verbs, M = 0.24, 95% CI = [0.09, 0.38]. The control group produced fewer adverbs, M = 0.37, 95% CI = [0.18, 0.56], than verbs, M = 0.53, 95% CI = [0.24, 0.82]. In parallel with their perception data, the verb group showed knowledge of both adverbs, M = 0.47, 95% CI = [0.27, 0.67], and verbs, M = 0.55, 95% CI = [0.41, 0.70].
Group means of individual production accuracy on adverb and verb cues in the sentences of Phase 4.

A two-factor ANOVA (three groups × two cues, with participants nested within group) showed a highly significant interaction between group and cue, F (2, 40) = 18.0, p < .001, a significant cue effect, F (1, 40) = 7.05, p < .05, and a nonsignificant main group effect, F (2, 40) = 0.42, p = .66. Post hoc testing using the Tukey HSD showed that the adverb pretraining group differed from the control group in adverb cue provision (p < .005) and from the verb pretraining group, though to a lesser degree (p < .05), and that the verb pretraining and control groups did not differ significantly. The verb pretraining group was superior to the adverb pretraining group in verb cue provision (p < .05) but did not differ significantly from the control group, and the adverb pretraining and control groups also did not differ significantly.
These results mirror the perception data: the adverb pretraining group attends to adverb cues and is able to produce adverb information at a relatively high proficiency, while production of verb information is low. The control group shows more balanced understanding and production of the adverb cues and the verb cues. The verb group also shows balanced understanding in production of verb cues to temporal reference, although it is superior to the adverb pretraining group on use of verbal morphology.
RQ3: Cues or Content?
A key element of the design of the experiment is that all participants had equivalent exposure to the future items cogitabo cras and cras cogitabo in Phase 2 and that no one had any experience of these items or any reference to future temporality beforehand. Every participant in the experiment encountered these utterances six times each in Phase 2, being shown that they relate to the future. Analysis of these items therefore allows us to identify pure effects of blocking devoid of prior training on particular content. Performance on these effects must reflect attentional biases to particular dimensions of cue (adverb vs. verbal inflection) rather than to particular words or tenses because neither these forms nor their function has been encountered before Phase 2.
Figure 7 isolates these future items and shows these two groups’ temporality ratings for the adverb cras and the verb inflection cogitabo when they are experienced on their own in Phase 3. The left panel shows the two groups’ temporality ratings for the adverb cras: adverb pretraining, M = 4.56, 95% CI = [4.25, 4.87]; verb pretraining, M = 3.59, 95% CI = [2.88, 4.30]; and the verb inflection cogitabo: adverb pretraining, M = 3.34, 95% CI = [2.73, 3.96]; verb pretraining, M = 3.94, 95% CI = [3.40, 4.48], when they are experienced on their own as individual words in Phase 3. Both of these items, if fully acquired, should receive an extreme future rating of 5. Yet the adverb pretraining group has learned from the two-word utterances experienced in Phase 2 about cras while the verb pretraining group has learned from the same exposure to the same utterances about cogitabo. A two-factor ANOVA (2 groups × 2 cues with participants nested within group) shows this to be a significant interaction, F (2, 40) = 4.08, p < .05, with nonsignificant main group, F (2, 40) = 0.29, p = .74, and cue, F (1, 40) = 2.25, p = .14, effects.
Group means of individual participants’ rating and production scores for the adverb and verb cues cras and cogitabo when experienced as isolated stimuli in Phases 3 and 4.

These items can similarly be isolated in production. In Phase 4, the participants were asked for the Latin translations of, on separate trials, tomorrow, I will think, and tomorrow I will think. The right panel of Figure 7 shows the averaged accuracy (out of a possible maximum 1.0) of the two groups on the adverb cras: adverb pretraining, M = 0.80, 95% CI = [0.62, 0.97]; verb pretraining, M = 0.55, 95% CI = [0.32, 0.79]; and the verb inflection cogitabo: adverb pretraining, M = 0.17, 95% CI = [0.04, 0.30]; verb pretraining, M = 0.47, 95% CI = [0.27, 0.67]. While both groups seem to have picked up something about cras from the two-word utterances experienced in Phase 2, the verb pretraining group has learned more from that same exposure to these utterances about cogitabo. A two-factor ANOVA (2 groups × 2 cues with participants nested within groups) shows a nonsignificant main effect of group, F (1, 30) = 0.09, ns, a main effect of cue with higher overall accuracy on the adverb, F (1, 30) = 18.2, p < .001, and a significant two–way interaction, F (1, 30) = 10.9, p < .01.
RQ1, RQ2, and RQ3 synthesis
Table 3 presents the correlation matrix relating eye tracking variables (Phase 2 total dwell time on the adverb and verb cue; Phase 3 total dwell time on the adverb and verb cue), comprehension variables (Phase 3 average ratings of cras and cogitabo; Phase 3 correlation for each individual participant of their ratings on the adverb and verb cue to the information provided by those cues), and Production variables (Phase 4 correct production of cras and cogitabo both as part of a sentence and independently). There is a lot of information here, and we will return to it in subsequent sections as the data relate to a variety of questions.
Correlation matrix based on data from Phases 2, 3, and 4

*p < .05. **p < .01.
First, correlational analysis of the performance variables across all of the participants allows synthesis of the behavioral outcome measures and assessment of their validity. Within the comprehension variables in the upper left block of Table 3, participants who were strongly influenced by the adverbial cues induced that the adverb cras referred to the future (r = .74, p < .01); those influenced by the verb cue induced that the verb cogitabo referred to the future (r = .63, p < .01); and adverb and verb influence were negatively correlated (r = −.63, p < .01). Within the production variables in the center block of Table 3, accurate production of cras alone was correlated with its accurate production in sentences (r = .85, p < .01), production of cogitabo alone was correlated with its accurate production in sentences (r = .83, p < .01), and knowledge of cras was essentially independent of knowledge of cogitabo (−.02 < r < .08). The left middle block of Table 3 shows the associations between comprehension and production abilities. Adverb comprehension was correlated with adverb production (r = .62, .60, .63, .68; all ps < .01); verb comprehension with verb production (r = .52, .49, .73, .70; all ps < .01); and the associations between cras production and cogitabo comprehension (r = −.15, −.11, −.31, −.32); and cogitabo production and cras comprehension (r = −.10, −.04, −.33, −.23) were all negative. The measures of knowledge of adverb and verb cues thus show reassuring patterns of convergent, discriminant, concurrent, and predictive validity.
EYE-MOVEMENT RESULTS
RQ4
Does prior exposure to adverbial (/morphological) cues to temporal reference lead to subsequent overt perceptual attention (as indexed by total dwell time to that cue) in subsequent input where there are both adverbial and morphological cues to the same interpretation in Phase 2?
Total dwell time is defined as the summation of the duration across all fixations on a specific interest area. The total time spent by each participant group on verbal and adverbial cues is presented in Figure 8. A three-factor ANOVA (three groups × two cues × three tenses, with participants nested within groups) yielded significant interactions between group and cue, F (2, 40) = 6.12, p < .01; between cue and tense, F (2, 80) = 8.46, p < .001; and between group, cue, and tense, F (4, 80) = 2.80, p < .05. There were nonsignificant effects of group, F (2, 40) = 0.19, p = .83; cue, F (1, 40) = 0.03, p = .86; and tense, F (2, 80) = 0.71, p = .50; and a nonsignificant interaction between group and tense, F (4, 80) = 1.06, p = .38. Post hoc testing using the Tukey HSD revealed significant differences between the adverb pretraining group and the control (p < .05) and verb pretraining (p < .05) groups on verb cue use, with the latter two groups not differing significantly. The adverb and verb pretraining groups were also significantly different in adverb cue use (p < .05), with the control group not differing significantly from either. Combining these results, the adverb pretraining group used the verb cue significantly less and the adverb cue significantly more than did the verb pretraining group. There was a significant difference in the adverb pretraining group between adverb and verb cue use in the past tense (p < .05), but no other group, cue, or tense interactions showed significant differences.
Average total dwell time per trial on the adverb and verb cue for stimuli in the past, present, and future of Phase 2.

The group effects and group by cue interactions confirm that prior exposure to adverbial (/morphological) cues to temporal reference in Phase 1 leads to subsequent overt perceptual attention in subsequent input during Phase 2 where there are both adverbial and morphological cues to the same interpretation.
RQ5
Does any bias in overt attention to input cues in turn lead to subsequent overt attentional biases to the adverbial (/morphological) cue in subsequent language comprehension in Phase 3?
Total dwell time on adverbial and verbal cues are represented in Figure 9. A two-factor ANOVA (three groups × two cues with participants nested within group) of total dwell time found a highly significant cue effect, F (1, 40) = 20.5, p < .001; no effect of group, F (2, 40) = 0.58, p = .57; and a nonsignificant overall interaction between group and cue, F (2, 40) = 0.04, p = .96. Post hoc testing using the Tukey HSD indicated a significant difference between verb and adverb cues (p < .05).
Phase 3 eye-tracking data. Bars represent the average dwell time spent on each cue per group.

The lack of group effect and of group by cue interactions in eye movement indices of overt attention in Phase 3 suggests that whereas pretraining affects overt attention during subsequent input processing and usage-based learning in Phase 2 (RQ4), this does not carry over as strongly to the testing phase in Phase 3 (RQ4). Correlational analyses support this conclusion. The lower right block of Table 3 shows the relations between overt attention to cues within and between Phases 2 and 3. Adverb and verb dwell were essentially independent during Phase 2 (r = .05). Overt attention to adverbs in Phase 2 was associated with greater overt attention to adverbs in Phase 3 (r = .41, p < .01), but not to verbs (r = .16, ns). Overt attention to verbs in Phase 2 was associated with greater overt attention to verbs in Phase 3 (r = .44, p < .01), but not to adverbs (r = .26, ns). However, within Phase 3, overt attention to adverbs and to verbs was strongly correlated (r = .80, p < .01): some people studied both cues present in Phase 3 more than other people did, but there was little bias to one or other cue dimension.
COMBINED RESULTS
RQ6
Does any bias in overt attention to input cues in turn lead to subsequent covert attentional biases to the adverbial (/morphological) cue in subsequent language comprehension?
The lower left block in Table 3 shows how overt attention to cues as indexed by the eye-tracking measures is associated with better subsequent comprehension accuracy. Greater overt attention to adverbial cues during language exposure in Phase 2 was associated with better Phase 3 comprehension of adverbs (r = .49, p < .01) and of cras (r = .34, p < .05) and worse comprehension of verbs (r = −.47, p < .01) and cogitabo (r = −.14, ns). Greater overt attention to verb cues during language exposure in Phase 2 was associated with better Phase 3 comprehension of verbs (r = .53, p < .01) and of cogitabo (r = .37, p < .05) and worse comprehension of adverbs (r = −.37, p < .05) and cras (r = −.14, ns). Overt attention to these cues during Phase 3, when they were actually doing the ratings, was not associated with cue comprehension in the same ways (−.02 < r < .18, all ns).
RQ7
Does any bias in overt attention to a particular input cue result in superior knowledge of that cue as indexed by subsequent production accuracy?
The lower middle block of Table 3 shows similar patterns of how overt attention to cues as indexed by the eye tracking measures is associated with later production accuracy. Greater overt attention to adverb cues during language exposure in Phase 2 was associated with better Phase 4 production of cras alone (r = .41, p < .01) or in a sentence (r = .39, p < .01) and a nonsignificant tendency toward worse production of cogitabo alone (r = −.21, ns) or in a sentence (r = −.28, ns). Greater overt attention to verb cues during language exposure in Phase 2 was associated with better Phase 4 production of cogitabo alone (r = .41, p < .01) or in a sentence (r = .34, p < .05). Overt attention to these cues during Phase 3 was not associated with cue production in the same ways (−.15 < r < .13, all ns).
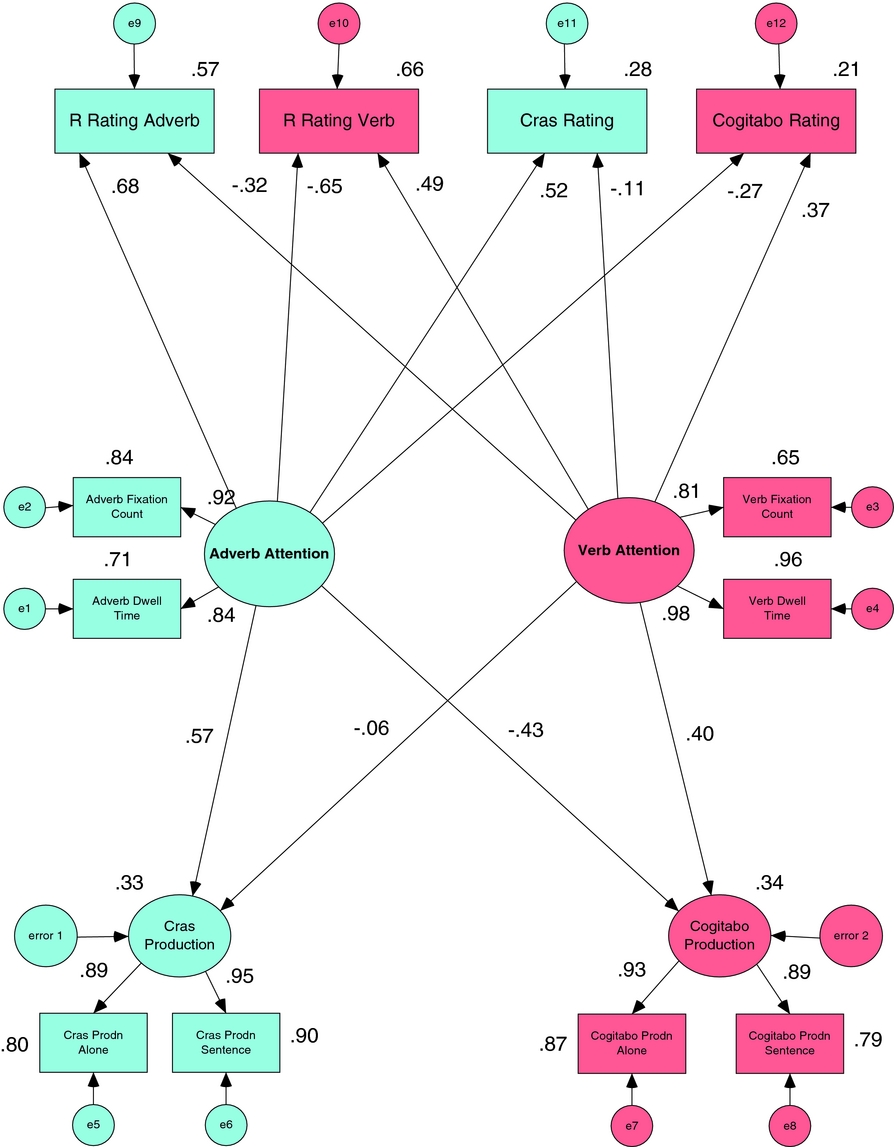
SYNTHESIS: A STRUCTURAL EQUATION MODEL
These analyses have been relatively piecemeal. In order to investigate these effects as they operate together, the structural equation model shown in Figure 10 was performed using AMOS (Arbuckle, Reference Arbuckle2006). The two latent factors adverb attention and verb attention in the center of the model each are estimated from the observed overt fixation count and dwell time in Phase 2. Latent variables have their associated errors, labeled as e in the figure. The proportion of nonerror variance explained is shown for each endogenous variable (e.g., the model explains 84% of the variance in adverb fixation count). The model estimates the effects of these factors upon (a) the covert learned attention effects in comprehension at the top of the model (these are indexed by the correlation for each individual participant of their ratings on the adverb and verb cue with the information provided by those cues over all the sentence stimuli of Phase 3 and, for testing learned attention to cue rather than content, to Phase 3 cras and cogitabo rating); and (b) the covert learned attention effects in production at the bottom of the model (these are estimated as latent variables for adverb cue generalization item cras and verb cue generalization item cogitabo, each indexed by accuracy at production alone and in sentences in Phase 4). Adverb-related measures are shown in blue, verb related measures in pink. The path weights for these effects are standardized. All are significant. There is a clear overall pattern whereby
1. the higher the overt attention to adverbs in Phase 2,
a. the more covert attention to adverb content and cues in comprehension,
b. and the less attention to verb content and cues in comprehension,
c. the greater the knowledge of adverb cues in production, and
d. the less the knowledge of verb cues in production;
2. the higher the overt attention to verbs in Phase 2,
a. the more covert attention to verb content and cues in comprehension,
b. and the less the attention to adverb content and cues in comprehension,
c. the greater the knowledge of verb cues in production, and
d. the less the knowledge of adverb cues in production;
3. the magnitude of effects of adverb attention effects (both + and −) are generally greater than those of verb attention effects.
A structural equation model relating (center) overt attention (gaze and fixations) to one of two cues during Phase 2 to (top) later covert attention to cues in comprehension (Phase 3) and (bottom) cue knowledge in production (Phase 4). [A color version of this figure can be viewed online at http://journals.cambridge.org/aps]
DISCUSSION
Taken together, these findings replicate our earlier demonstrations of short-term learned attention to adverbs in the acquisition of temporal reference in Latin, and they extend the investigation of the processes involved using eye-tracking indicators to determine the extent to which these biases are overt or covert. Behavioral indices of comprehension and production demonstrated that early experience with adverbial cues strongly enhanced subsequent use of this cue dimension and significantly blocked the acquisition of verbal tense morphology. Early experience of verbal morphology somewhat enhanced subsequent use of this cue, although the effects upon adverb acquisition were less pronounced. Eye tracking showed that early experience of particular cue dimensions affected what participants overtly focused upon during subsequent language processing and how in turn this overt study resulted in covert attentional biases in comprehension and in productive knowledge. We will discuss these findings in turn.
With regard to RQ1 and RQ2 and the effect of adverb pretraining upon subsequent adverb and verb use, there are clear effects across linguistic stimuli and group participants. Table 4 shows the regression coefficients across linguistic stimuli from Ellis and Sagarra (Reference Ellis and Sagarra2010b, Reference Ellis and Sagarra2011) and the present experiment. In all experiments, the adverb pretraining group showed enhanced subsequent use of the adverb cue and reduced sensitivity to verb tense in contrast to the control group. Inspection of the individual participants in Figure 4 shows that all members of the adverb pretraining group were heavily affected by the adverb group, with only three members showing sensitivity to the verb cues at r > .1. Prior experience of the adverbial cues enhanced the use of these cues and blocked the acquisition of verb tense morphology.
A comparison of the Research Question 1 multiple regression results from the Ellis and Sagarra (E&S) Reference Ellis and Sagarra2010b and Reference Ellis and Sagarra2011 studies and the present study

With regard to RQ1and RQ2 and verb pretraining, the picture is more mixed. Table 4 and Figures 5 and 6 shows that in the present study, the verb pretraining group showed numerically enhanced subsequent use of the verb cue in contrast to the control group, but there was no blocking effect upon adverb use. Across individual participants, in Figure 4, seven members of the verb pretraining group were strongly sensitive to the verb cues to the exclusion of the adverb, but there were three members who nevertheless picked up on the adverb alone, and five members closer to the diagonal showing some sensitivity to both cues.
The current experiment was designed to be as close a replication as possible of Ellis and Sagarra Reference Ellis and Sagarra2010a. There were some minor differences in that the original experiment was written in E Prime whereas this experiment, to allow for eye tracking, was written in SR Research Experiment Builder and involved head-mounted cameras; but otherwise, the materials and procedure were as similar as possible. Yet in Ellis and Sagarra (Reference Ellis and Sagarra2010b), verb pretraining also blocked adverb learning, a finding that is not evidenced here in the multiple regressions. Why participants here are generally less sensitive to pretraining on (the same) verbal morphology than those in Ellis and Sagarra (Reference Ellis and Sagarra2010b) is a matter of speculation. Adverb blocking of verb learning was also robust in Ellis and Sagarra (Reference Ellis and Sagarra2011) where, like here, verbal blocking of adverb acquisition was not as pronounced. In Ellis and Sagarra (Reference Ellis and Sagarra2011) the verbal morphology was less transparent in that the paradigm included both tense and person. We believe that the reduced blocking in Ellis and Sagarra (Reference Ellis and Sagarra2011) therefore resulted from the lowering of the verb salience, making the more salient adverbial cues more readily acquired and more likely to overshadow less salient verbal morphology (Rescorla & Wagner, Reference Rescorla, Wagner, Black and Prokasy1972). Another factor is language learning background resulting in transfer and long term learned attention. Ellis and Sagarra (Reference Ellis and Sagarra2010b, their expt. 2, Reference Ellis and Sagarra2011, their expt. 2) show that sensitivity to verbal morphology is greater in speakers of languages with rich verbal morphology, and less in speakers of reduced verbal morphology. Unfortunately, we did not gather details of the language competencies of our participants here beyond L1 English and so are unable to analyze this further.
RQ3 concerned whether these behaviors generalize to references to future temporality, previously unexperienced in pretraining, and therefore demonstrate learned attention to cue dimensions rather than to particular items of content. The data in Figure 7 and the analyses regarding cues or content show significant interactions of group by cue use in both comprehension and production of cues to future temporality, supporting the conclusion that they reflect learned attention to cue dimensions rather than particular content. These results replicate similar findings using the current paradigm (Ellis & Sagarra, Reference Ellis and Sagarra2010b, Reference Ellis and Sagarra2011) as well those in other cue competition experiments (MacWhinney, Reference MacWhinney and Robinson2001; MacWhinney & Bates, Reference MacWhinney and Bates1989; MacWhinney et al., Reference MacWhinney, Bates and Kliegl1984).
With regard to the overt and covert status of any learned attention to language effects, RQ4, our findings showed that prior exposure in the adverb and verb pretraining groups results in increased overt attention to those cues in subsequent sentences that contain both adverb and verb cues simultaneously in Phase 2 (Figure 8). The significant group by cue interactions in overall dwell time in Phase 2 indicate that participants spend more time and overt attention studying cue dimensions that they have experienced first. However, when it comes to using these cues later to comprehend sentences that contain both cues, RQ5, this attentional bias is no longer overt: there is no group by cue interactions in gaze duration in Phase 3 (Figure 9).
However, bias in overt attention during study of input cues in Phase 2 did in turn lead to subsequent covert attentional biases to the adverbial (/morphological) cue in subsequent language comprehension (RQ6). The correlation analyses and structural equation model (Figure 10) demonstrate that the higher the overt attention to a particular (adverbial /morphological) cue in Phase 2, the greater the covert attention to this content and cue dimension in subsequent comprehension, and the less the attention to the other cue dimension (RQ6). The structural equation model also demonstrates that the higher the overt attention to a particular (adverbial /morphological) cue in Phase 2, the greater the knowledge of this cue dimension in subsequent production, and the less the ability to produce to the other cue (RQ7).
It was overt attention to a cue dimension during original exposure in Phase 2 that predicted its later accuracy. Thus, it appears that these learned attention effects are overt during initial exposure and usage when learning takes place, but then become covert during later processing: greater accuracy on a cue is not associated with greater overt attention at this stage. This is consistent with theories that hold initial encoding is enhanced by preparatory attention and voluntary orienting (Cowan, Reference Cowan1997; N. C. Ellis, Reference Ellis2005; LaBerge, Reference LaBerge1995; Schmidt, Reference Schmidt and Robinson2001); and once a construction has been seeded in this way, with the form-meaning conjunction consolidated as an explicit memory, thereafter there is scope for its implicit learning on every subsequent occasion of use (Ellis, Reference Ellis2002a, Reference Ellis2002b; N. C. Ellis, Reference Ellis2005). Noticing is no longer necessary; mere usage in processing is enough for this implicit tallying, priming, and strengthening to take place. Once this usage-dependent entrenchment has occurred, psycholinguistic performance data are intimately tuned to the frequencies of form-function mappings, with high-frequency patterns being more fluently processed (Ellis, Reference Ellis2002a).
In the ANOVA analyses relating to Figures 4–6, the magnitude of differences between adverb pretraining versus control (both + and −, upon comprehension and production) are generally greater than those between verb pretraining and control. The same is true in the structural equation model where the path weights from adverb attention are generally of a higher magnitude than those from prior verb attention. This is consistent with the hypothesis that the adverbial cues here are more salient than verb inflections and hence capture bottom-up attention more easily. Salience effects are standard in associative learning experiments: more salient cues are learned faster than less salient cues (Rescorla & Wagner, Reference Rescorla, Wagner, Black and Prokasy1972); more salient cues tend to overshadow less salient ones that are simultaneously present (Kamin, Reference Kamin, Campbell and Church1969); it is usually easier to block conditioning to a CS of weaker salience with a CS of stronger salience than the other way around (Marchant & Moore, Reference Marchant and Moore1973; the meta-analysis of Ellis & Sagarra, Reference Ellis and Sagarra2011).
A pragmatic approach to L2 instruction might be to teach learners useful lexical temporal cues like today, yesterday, and tomorrow because these are so generally useful and applicable that they will give the learner a strong “leg up” in their communication. However, the results of learned attention research such as this suggest that any initial advantage comes with substantial negative consequences. Knowing such lexical cues can actively block the acquisition of parallel grammatical cues. Effective instruction might well take the opposite approach. Terrell (Reference Terrell1991) characterized explicit grammar instruction as “the use of instructional strategies to draw the students’ attention to, or focus on, form and/or structure” (p. 53), with instruction targeted at increasing the salience of inflections and other commonly ignored features by firstly pointing them out and explaining their structure, and secondly by providing meaningful input that contains many instances of the same grammatical meaning–form relationship. An example is processing instruction (vanPatten, Reference vanPatten1996, Reference vanPatten2002), which aims to alter learners’ default processing strategies, to change the ways in which they attend to input data, and thus to maximize the amount of intake of data in L2 acquisition. One element of processing instruction for tense learning is that the study materials lack lexical cues to temporal reference, and thus demand that learners attend and process the morphological cues in order to succeed on the exercises.
Our findings that the mechanisms of prior cue knowledge are mediated by learners’ preferential looking at blocking over blocked cues when they are simultaneously present in input suggests there is scope in directing learners’ attention to the ignored cues to promote their study through increased dwell time. Research on the effects of textual input enhancement on adult L2A show that the acquisition of morphological cues can be enhanced by making them more salient in the input by means of typographical enhancement (Han, Park, & Combs, Reference Han, Park and Combs2008; Lee & Huang, Reference Lee and Huang2008; Wong, Reference Wong2005). We are therefore currently investigating whether blocking of the acquisition of verbal inflections can be attenuated during Phase 2 of our research paradigm by means of increasing their salience through the use of typographical enhancement.
LIMITATIONS AND FUTURE DIRECTIONS
The present experiment, like the studies of Ellis and Sagarra (Reference Ellis and Sagarra2010b, Reference Ellis and Sagarra2011), concern the first hour of language learning. While there is increasing interest in the initial stages of language learning (Gullberg & Indefrey, Reference Gullberg and Indefrey2011), this is admittedly a very small sample of experience. It samples a trivial amount of language material, too. There was just one verb form for each tense, a selection that artificially balanced the complexity and salience of the adverbial and inflectional cues; the three adverbs differed from each other in relatively slight ways (hodie, heri, cras) approximating the similarity of the verbal inflections (cogito, cogitavi, cogitabo). In natural languages, this is not the typical case. Verbal morphology, due to its high frequency, is typically of low salience in its surface manifestations compared to lexical cues (yesterday, today, tomorrow vs. I walked, I walk, I’ll walk), and hence inflections are typically overshadowed by more salient lexical and discourse cues (Bates & Goodman, Reference Bates and Goodman1997; Ellis, Reference Ellis2006a, Reference Ellis2006b). In Ellis and Sagarra (Reference Ellis and Sagarra2011), where the verbal paradigm came in a more naturally complete state and reflects tense and person, the participants relied much more on the adverbial cues. They were biased toward reliable, salient, lexical cues to temporality and this blocked acquisition of less salient, complex, morphological cues. Finally, the learning conditions are far from natural: learners very deliberately learn a few constructions of a “dead” language, taught by a computer using means reminiscent of audiolingualism, using visual presentations. Clearly there is need for further studies of these effects that more fully sample the full richness of language in naturalistic, social, aural, encultured usage. The closest we can presently offer is from parallel strands of research that demonstrate learned attention effects in the sentence-processing strategies of third- and eighth-semester English-Spanish L2 learners reading sentences in Spanish containing lexical (adverb) and morphological (verbal inflection) cues to temporal reference (e.g., Ellis & Sagarra, Reference Ellis and Sagarra2010a).
CONCLUSIONS
These experiments demonstrate short-term learned attention effects: cues learned early in the instructional sequence are preferentially attended in subsequent language processing and can block the acquisition of later experienced cues to the same interpretation. The present results also extend the investigation in showing that early experience of particular cue dimensions initially affects what participants overtly focus upon during subsequent language processing, and how this overt study results in turn in covert attentional biases in subsequent comprehension and in production.
The findings of such experiments reinforce the possibility that the limited attainment of adult second- and foreign-language learning follows general principles of associative learning. Contemporary learning theory holds that learning is driven by prediction errors: that we learn more from the surprise that comes when our predictions are incorrect than when our predictions are confirmed (Wills, Reference Wills2009). L2 learners, like learners in any problem domain, have limited working memory resources, have limited time on task, and bring to the task attentional biases derived from their prior experience. Temporal adverbs in the L2 input are typically clearer in their interpretation than are nonsalient and ambiguous verbal inflections, and L2 speakers can usually satisfice (a cognitive strategy that attempts to meet criteria for adequacy, rather than to identify an optimal solution; Simon, Reference Simon1957) and process language predominantly by lexical means. In the rich context of naturalistic language learning, temporal interpretation on the basis of contextual cues, lexical cues, and schematic story serialization is usually correct. Thus, prediction errors are rare, there is no surprise, and there is no concomitant need to discover underlying morphological cues that better prompt the correct temporal interpretation. We believe that L2 learners’ use of adverbs and other devices for expressing temporality blocks their acquisition of less salient and less reliable verb morphology, thus contributing to their limited attainment.
ACKNOWLEDGMENT
This research was supported by National Science Foundation Grant BCS-0717557. Katherine Martin is now at the University of Pittsburgh.


