


Introduction
The Poisson distribution is a fundamental principle for estimating the variance of 14C count rates in radiocarbon accelerator mass spectrometry (Burr et al. Reference Burr, Donahue, Tang and Jull2007; Stuiver and Becker Reference Stuiver and Becker1986; Stuiver and Polach Reference Stuiver and Polach1977). The Poisson probability density function (Eq. 1) computes the probability of counting a certain number of 14C events during a specific time lapse (Pinsky and Karlin Reference Pinsky and Karlin2011) or cycle time. The number of counts per cycle is the same as count rate or counts per block (N i ) where i is the cycle or block. The term µ i is the expected counts per cycle and can be approximated to the average count rate. AMS has long used Poisson uncertainty estimation from classical radioactivity-decay counting methods (Povinec et al. Reference Povinec, Litherland and von Reden2009).
 $$Pois\left( {N;\mu } \right) = {{{\mu ^N}\;{e^{ - \mu }}} \over {N!}}$$
Typically, an AMS radiocarbon measurement is conducted by counting during s number of cycles (e.g. s = 15 cycles). A group of cycles is called a run or pass (of the sample target wheel) and the entire sample measurement consists of n passes. In statistical terms, the counts per cycle are observations drawn from a population of unknown distribution, and the size s is the size of the statistical sample. If µ is constant across the passes or stationary, then µ can be estimated from the global mean of counts per cycle defined as
 $${\mu _{global}} = {N_T}/\left( {n \cdot s} \right)$$
where N T is the total counts for the entire measurement. If the Poisson model is applicable, then the absolute scatter (uncertainty) of the distribution of the whole set of count rates is given by
 $${\sigma _{pois}} = \sqrt {{\mu _{global}}} \;$$
If the mean count rate µ is not constant and behaves as a moving average across the passes of the measurement, then the Poisson process is deemed non-stationary. The uncertainty of non-stationary Poisson processes cannot be calculated with Eq. 3, but with ${\sigma _{pois}} = \sqrt {{\mu _i}} $
, because the uncertainty changes over time. Therefore, a model for µ
i
must be estimated to capture the trend of the counts per cycle (N
i
). The non-stationary data can then be transformed into stationary data around µ
global
by detrending with an appropriate model µ
i
(Poplová et al. Reference Poplová, Sovka and Cifra2017). Stationary and non-stationary processes fail to meet a Poisson distribution when the measured scatter is higher than
${\sigma _{pois}} = \sqrt {{\mu _i}} $
, because the uncertainty changes over time. Therefore, a model for µ
i
must be estimated to capture the trend of the counts per cycle (N
i
). The non-stationary data can then be transformed into stationary data around µ
global
by detrending with an appropriate model µ
i
(Poplová et al. Reference Poplová, Sovka and Cifra2017). Stationary and non-stationary processes fail to meet a Poisson distribution when the measured scatter is higher than $\sqrt {{\mu _i}} $
. This situation is called overdispersion. In short, counting statistics is the proposed model that dynamically describes the uncertainty at a certain time point along the measurement is being executed.
$\sqrt {{\mu _i}} $
. This situation is called overdispersion. In short, counting statistics is the proposed model that dynamically describes the uncertainty at a certain time point along the measurement is being executed.
Some papers discussing the counting of radioactive decay observed unusual overdispersion attributed to unexplained events occurring during the counting process. Consequently, several alternative models have been suggested (Currie et al. Reference Currie, Eijgenhuijsen and Klouda1998). In the case of AMS, the ion source physically destroys the graphite target during counting (Litherland et al. Reference Litherland, Paul, Allen and Gove1987). Therefore, owing to sample destruction, AMS assays should be prone to events that lead to a non-Poisson counting distribution. Nevertheless, most AMS studies do not report deviations from Poisson statistics.
In the field of radiocarbon by AMS, the Poisson processes have been investigated by measuring the time between the arrival of each 14C particle at the detector, known as the interarrival time (Vogel et al. Reference Vogel, Ognibene, Palmblad and Reimer2004). Vogel et al. (Reference Vogel, Ognibene, Palmblad and Reimer2004) showed a limited set of experiments where the interarrival time distribution corresponded to Poisson processes. They measured only a few (n = 5) samples with different 14C/12C ratios (14,12 R) and three measurements at different cathode potentials. However, we believe there is still insufficient evidence to assume that radiocarbon AMS counting follows a Poisson distribution. Rather, radiocarbon Poisson distribution should be directly evaluated from the observed count rates, considering the stability and conditions of the AMS signal.
From the point of view of the actual spread of the measurand of interest, 14C/12C ratio (14,12
R), the relative standard error of the whole measurement (Eq. 4) is calculated from the standard deviation of the passes means (σ
means
) factored by $\sqrt n $
(Malonda and Carles Reference Malonda, Carles and L’Annunziata2020) and such sampling means should be normally scattered around the global mean ⟨
14,12
R⟩global as stated by the Central Limit Theorem (CLT) (Evans and Rosenthal Reference Evans and Rosenthal2004; Malonda and Carles Reference Malonda, Carles and L’Annunziata2020). The factor
$\sqrt n $
(Malonda and Carles Reference Malonda, Carles and L’Annunziata2020) and such sampling means should be normally scattered around the global mean ⟨
14,12
R⟩global as stated by the Central Limit Theorem (CLT) (Evans and Rosenthal Reference Evans and Rosenthal2004; Malonda and Carles Reference Malonda, Carles and L’Annunziata2020). The factor $\sqrt n $
comes from the error propagation of the uncertainty of n statistical samples. In Radiocarbon, Eq. 4 is the “external error” (McNichol et al. Reference McNichol, Jull and Burr2001), and in this paper, it is denoted as the passes-based external error.
$\sqrt n $
comes from the error propagation of the uncertainty of n statistical samples. In Radiocarbon, Eq. 4 is the “external error” (McNichol et al. Reference McNichol, Jull and Burr2001), and in this paper, it is denoted as the passes-based external error.
 $$S{E_{\langle X \rangle, \;rel}} = {{{\sigma _{X\;means}}} \over {{{\langle X \rangle}_{global}}\sqrt n }} = {{{\sigma _{R\;means}}} \over {{}_{}\langle^{ 14,12}{R\rangle_{global}}\sqrt n }}$$
The proposed and expected relative standard error of the measurement should be calculated from the Poisson uncertainty (σpois) of the distribution of the entire set of 14C count rates. For the count rates, the distribution of the means is usually not performed. However, another property of the Central Limit Theorem (Evans and Rosenthal Reference Evans and Rosenthal2004) tells that the σmeans for the count rates can be approximated by the dispersion of the population factored by the sampling size ( ${\sigma _{pois}}/\sqrt s $
). The approximation of
${\sigma _{pois}}/\sqrt s $
). The approximation of ${\sigma _{pois}}/\sqrt s $
and definitions of µ
global
from Eqs. 2 and 3 were inserted into Eq. 5 to calculate the widely accepted Poisson relative standard error (“internal” error). We were unable to find any reference for this demonstration except in Vogel et al. (Reference Vogel, Ognibene, Palmblad and Reimer2004) who used an abridged approach. We assume that the inherited Poisson counting statistics have been so prevalent over time in radiocarbon AMS because of the simplicity of Eq. 5 to quickly predict the error of the measurement.
${\sigma _{pois}}/\sqrt s $
and definitions of µ
global
from Eqs. 2 and 3 were inserted into Eq. 5 to calculate the widely accepted Poisson relative standard error (“internal” error). We were unable to find any reference for this demonstration except in Vogel et al. (Reference Vogel, Ognibene, Palmblad and Reimer2004) who used an abridged approach. We assume that the inherited Poisson counting statistics have been so prevalent over time in radiocarbon AMS because of the simplicity of Eq. 5 to quickly predict the error of the measurement.
 $$S{E_{{}_{}^{14}C,\;rel}} = {{{\sigma _{{}_{}^{14}C\;means}}} \over {{\langle X \rangle}\sqrt n }}\; = {{\;{{{\sigma _{pois}}} \over {\sqrt s }}} \over {{\mu _{global}}\sqrt n }}\; = {{\sqrt {{\mu _{global}}} } \over {{\mu _{global}}\sqrt {ns} }} = \sqrt {{1 \over {{\mu _{global}} \cdot ns}}} \; = {1 \over {\sqrt {{N_T}} }}$$
Aerts-Bijma et al. (Reference Aerts-Bijma, Paul, Dee, Palstra and Meijer2021) clearly defines both errors: “The internal errors are the 14C uncertainties, as we calculate them along with the measurands, whereas the external errors are the uncertainties observable from the spread in measurands.” The internal error is the expected uncertainty predicted from counting statistics while the external error is the actual obtained uncertainty of 14,12 R. It is important to note that internal and external errors are both in the format of standard errors. It has been argued in the literature that when the internal and external errors are about the same then the measurement is dominated by counting statistics (Bonani et al. Reference Bonani, Beer, Hofmann, Synal, Suter, Wölfli, Pfleiderer, Kromer, Junghans and Münnich1987; Tumey et al. Reference Tumey, Grabowski, Knies and Mignerey2004; Vogel et al. Reference Vogel, Ognibene, Palmblad and Reimer2004). However, these two errors should follow a chi squared distribution and sometimes they differ within this chi-squared framework. In short, the internal error (Eq. 5) is obtained by assuming a stationary Poisson counting model µ = µ global and by assuming the CLT is applicable.
The non-Poisson distribution models we employed are the quasi-Poisson (qp) and the negative binomial (NB type 1) models, which account for overdispersion. These models are different, as reflected by their absolute counting uncertainty shown in Eqs. 6 and 7 (Dupuy Reference Dupuy2018; Greene Reference Greene2008; Tjur Reference Tjur1998). For simplicity, the general form of the non-Poisson absolute uncertainty can be seen as the product of a dispersion parameter (D) with the root of the overall mean counts per cycle $\left( {D\sqrt {{\mu _{global}}} } \right)$
.
$\left( {D\sqrt {{\mu _{global}}} } \right)$
.
 $${\sigma _{qpois}} = \sqrt {{\varphi _{qp}}} \sqrt {{\mu _{global}}} $$
 $${\sigma _{NB}} = \sqrt {\left( {1 + {\varphi _{NB1}}} \right)} \sqrt {{\mu _{global}}} $$
For the NB model, the stationary data is fitted by iteratively maximizing the likelihood where the parameter φ
NB1
is optimized to the stationary data and the mean is assumed constant. The NB model is a Poisson model where μi has a Gamma distribution with scale parameter φ
NB1
. While the qp model has a dispersion calculated from the Pearson χ2 and the degrees of freedom. The dispersion D, which is defined here as higher or equal to 1 and decided by $\sqrt {{\varphi _{qp}}} $
or
$\sqrt {{\varphi _{qp}}} $
or $\sqrt {\left( {1 + {\varphi _{NB1}}} \right)} $
, quantifies how many times wider the actual distribution (histogram of detrended count rates affected only by a random process) would be relative to a Poisson distribution. Similarly to Eq. 5, the relative standard error for the models with overdispersion can be written as Eq. 8, which is a multiplied version of the Poisson error. Thus, the non-Poisson model is versatile and supports Poisson or non-Poisson conditions depending on the calculated D.
$\sqrt {\left( {1 + {\varphi _{NB1}}} \right)} $
, quantifies how many times wider the actual distribution (histogram of detrended count rates affected only by a random process) would be relative to a Poisson distribution. Similarly to Eq. 5, the relative standard error for the models with overdispersion can be written as Eq. 8, which is a multiplied version of the Poisson error. Thus, the non-Poisson model is versatile and supports Poisson or non-Poisson conditions depending on the calculated D.
 $$S{E_{non - pois,\;rel}} = {D \over {\sqrt {{N_T}} }}$$
The dispersion D is exclusively related to the counting statistics which is the most basic error level, and the counting error must be propagated with other uncertainty components related to δ13C correction, standard and blank corrections to calculate the next level of error, the quoted error (Aerts-Bijma et al. Reference Aerts-Bijma, Paul, Dee, Palstra and Meijer2021). Several laboratories have adopted the concept of error multiplier (Scott et al. Reference Scott, Cook and Naysmith2007) to capture sources of variation that appear at the replication level and are not accounted for in the quoted error. The non-Poisson error and the error multiplier are difficult to compare, however, their magnitudes are indirectly related. The quoted errors can be further expanded by empirical functions comparing the replicated measurements to infer error multipliers or other top-down parameters (Salazar et al. Reference Salazar and Szidat2021). Examples of error expansion applications are: intercomparison studies that evaluate the quoted uncertainty and the error multiplier. Calibration curves and age modeling use Poisson-calculated expanded quoted errors (e.g. additive expansion) during the model construction (Blaauw et al. Reference Blaauw, Aquino-López and Christen2024; Heaton et al. Reference Heaton, Blaauw, Blackwell, Bronk Ramsey, Reimer and Scott2020; Scott et al. Reference Scott, Naysmith and Cook2018). Thus, conceptually, non-Poisson quoted errors may create differences in the expansion parameters, quoted errors, and inferences from intercomparison studies and radiocarbon models.
The aim of this paper is to demonstrate that radiocarbon AMS counting uncertainty is not necessarily Poisson, and to accordingly show the advantage of using non-Poisson counting to comparably report internal and external errors. We furthermore consider if the uncertainty or noise of the 12C current coming from instrumental instability should be accounted for in the internal error. Our objective is to develop a non-Poisson framework for radiocarbon AMS uncertainty estimation. A time-dependent model J i for the 12C current was inferred, and then a time-dependent model µ i was inferred from J i. The count rates were detrended to obtain stationary counting data distributed around µ global to finally measure the non-Poisson overdispersion with Eq. 8. The core calculations were not novel but well-established tools in the field of statistics, and an abridged code can be found in GitHub (github/oPAC). Simulations of 14C counting were carried out to validate our equations and to explain the empirical results. We hypothesized that non-Poisson counting statistics applied to our 14C counts would perform better than conventional Poisson statistics by comparing their respective internal errors relative to the external errors. This reassessment gives a more robust error calculation framework related to the AMS instrument itself during the days of measurement in a basic level of error estimation. The broader motivation is to show the non-Poisson error can affect the traditional quoted error and thus, as explained previously, the potential to affect parameters of existing calibration curves, age modeling, and interlaboratory studies.
Materials and methods
MICADAS AMS instrument
The MICADAS main ion optics were tuned before every measurement, but the range of running conditions did not change considerably over 2.5 years of data acquisition. The main instrumental running conditions ranges were: source cathode potential 7.146 kV (fixed); source ion potential 30.32 kV (fixed); source ionizer heating 122±10 W depending on the age of the ionizer and conditions of the ion source, and Cs reservoir 120–130°C to keep the HE 12C beam current between 40–60 μA; extractor potential –0.87±0.57 kV; box lens –15±1.9 kV; and accelerator 184.86 kV (fixed). The measurements mainly were 14 passes, with a few measurements using 13 or 15 passes. The cycles were fixed at 20 seconds and 15 cycles per pass.
Data query and preprocessing
Two computer scripts written in the R language (R Development Core Team 2013) automatically queried or simulated the variables corresponding to each measurement obtained with the MICADAS AMS. The variables were: 12C current at the high energy side (I i ), 14C counts per cycle (N i ); 14,12 R, and 13,12 R ratios. The R script analysed these variables at the cycle and pass levels. In our system, the 14,12 R accuracy degrades for C masses lower than 0.4 mg when using conventional high-mass standards. Thus, samples with C mass lower than 0.5 mg were rejected to ensure that the mass was not a variable that affected the value and uncertainty of the ratio and counts. The models µ i and J i were inferred from the analysis of N i , I i at the cycle level, which ultimately were used to calculate the internal error using the distribution models quasi-Poisson and negative binomial type II. A more detailed description of the calculations can be found in the online Supplementary materials.
Our shortest counting time unit was a 20-second cycle length. The count rate was the total 14C particle counts corresponding to each cycle, while the 12C current was the mean. During each pass, the cycles are repeated s times (e.g. s = 15) and then the graphite target is changed to the next sample in the sequence. The passes were repeated n times (e.g. n = 14). Thus, a typical 14C AMS measurement had 210 cycles, and the datasets (N i , I i ) each had 210 entries.
Determination of J from the 12C current and µ from the current and count rates
Because the passes of each graphite target were measured periodically, the target heated up during sputtering and cooled down during idling. Consequently, the trends of the 12C and 14C signals were not continuous relative to their neighbor passes, as shown in Figure 1a, b. Therefore, individual models for J i and µi were inferred for each pass. The J i model was a cubic smooth spline calculated on the 12C current data (I i). J i was proportionally scaled and converted into a count model to obtain a first estimate for µi using Eq. 9. In Eq. 9, J i is scaled by the mean of the counts per cycle and a scalar A divided by the mean 12C current of the pass. Each pass had its corresponding µi and J i models.
 $${\mu _i} = \;A \cdot {J_i} \cdot \;{{{\langle N \rangle_{pass}}} \over {{\langle I \rangle_{pass}}}}$$
 $${\mu _i} = \;B \cdot {J_i} \cdot \;{}_{}^{14,12}R$$
Graphical representation of the AMS data and model fits. Because the simulations fit the empirical data, simulations are only shown in Figure (a). (a) Empirical approximation of the simulation with spline models to the empirical and simulated behavior of the HE 12C current. The inset shows the details of the smoothness of the model and data points for the first pass which are further separated in knots by the algorithm. (b) Non-stationary behavior of the raw 14C count rate with the model inferred by proportionally bringing the 12C model into count rate scale. (c) Stationary transformation of the raw 14C counts (N’) at the cycle level and second type of transformation at the passes level (⟨N⟩”). (d) Histogram of the stationary-transformed counts (N’) with a superimposed theoretical Poisson distribution. (e) 14,12Ri values for each cycle i and the value of the mean ratio corresponding to each pass ⟨14,12R ⟩pass. (f) Schematic explanation of the need of including the 12C current uncertainty into the accounting of the internal error.

If the 14,12 R value was known, then, theoretically, the 14C count rate µi could be calculated with Eq. 10, which includes the constant B, which incorporates beam transmission, electron charge, detector efficiency, and live counting time. Eq. 10 justified our selection of Eq. 9 to model the count rate from the data. Eq. 10 was employed during the simulations to convert the ratio and current into the count rate model.
The goodness-of-fit for µi was evaluated with the Akaike Information Criterion (AIC) calculated with Eq. 11 where P is the number of parameters and ${{\cal L}_{pois}}$
is the Poisson loglikelihood calculated with Eq. 12. The AIC was minimized by optimizing the proportional constant A and by variating the smoothness parameter of the J
i
cubic spline which was scaled to infer µi. Graphically, the models can be seen in the insets of Figure 1a, b corresponding to the first pass.
${{\cal L}_{pois}}$
is the Poisson loglikelihood calculated with Eq. 12. The AIC was minimized by optimizing the proportional constant A and by variating the smoothness parameter of the J
i
cubic spline which was scaled to infer µi. Graphically, the models can be seen in the insets of Figure 1a, b corresponding to the first pass.
 $${\rm{AIC}} = {\rm{ }}2P - {\rm{ }}2{{\cal{L}}_{{\rm{pois}}}}$$
 $${{\cal L}_{pois}} = \sum \ln \left[ {Pois\left( {{N_i};\;{{\rm{\mu }}_i}} \right)} \right]$$
Transforming a non-stationary model into a stationary model for counting statistics
After determining the optimum J i and µi models for each pass, the counts per cycle (N i ) were transformed into a stationary model. As mentioned above Poplová et al. (Reference Poplová, Sovka and Cifra2017) did this by fitting a trend model of their count rates, which is akin to our µi. Using a Z-score, they could detrend the original signal and found the stationary transformation which is the set of scattered counts (N i ’) relative to a constant global mean (μglobal). The Z-score for a Poisson process is
 $$\left[ N_{i} - \mu_{i} \right]/\sqrt\mu_{i} = \left[N'_{i} - \mu_{global}\right] / \sqrt\mu_{global}\;$$
The numerator represents the detrending of the raw signal and the denominator normalizes it relative to the Poisson uncertainty. The left side of Eq. 13 uses the non-stationary model, and the right side is the stationary model. In our case, instead of the Z-score, our transformation (Eq. 14) was based on the Pearson’s χ-squared: $\chi _{}^2 = {\left[ {{N_i} - {\mu _i}} \right]^2}/{\mu _i}$
which is the square of the Z-score. The solution of Eq. 14 gave the transformed counts per cycle as shown in Eq. 15 and Figure 1c where N
i
’ is an integer and the root sign is the sign of N
i – µi.
$\chi _{}^2 = {\left[ {{N_i} - {\mu _i}} \right]^2}/{\mu _i}$
which is the square of the Z-score. The solution of Eq. 14 gave the transformed counts per cycle as shown in Eq. 15 and Figure 1c where N
i
’ is an integer and the root sign is the sign of N
i – µi.
 $$\left[ N_{i} - \mu_{i} \right]^2/\mu_{i} = \left[N'_{i} - \mu_{global}\right]^2 / \mu_{global}\;$$
 $$N' = \left\lfloor{ \;{\mu _{global}} \mp \sqrt {{\mu _{global}}\; \cdot {{\left[ {{N_i} - {\mu _i}} \right]}^2}/{\mu _i}}}\right \rfloor \;\;$$
Once the counts per cycle of a pass were transformed then the process was applied to the next pass. A one-time Grubb’s outlier detection at a confidence level α=0.05 was applied to the transformed counts (Alrawashdeh Reference Alrawashdeh2021) to ensure outliers were eliminated to avoid instabilities in the fitting calculations. The non-stationary to stationary transformation basically aligned the mean count rate of each pass to the global mean, see black line in Figure 1c. This alignment removed any scatter or drift of the mean count rate occurring along the passes, leaving only the dispersion of the counts. Next, we calculated the quasi-Poisson overdispersion using the Pearson χ2 (Tjur Reference Tjur1998) and the degrees of freedom (df) with Eq. 16.
 $$\varphi _{qp} = {\frac{\chi^2_{pearson}}\over{df}}={\frac{1}\over{df}} {\sum\nolimits_{i=1}^{ns}}\left[ N_{i} - \mu_{i} \right]^2/\mu_{i} ={\frac{1}\over{df}} \sum\nolimits_{}^{}\left[ N'_{i} - \mu_{global} \right]^2/\mu_{global}$$
The quasi-Poisson is not a real distribution but a model to which an overdispersion and quasi-likelihood calculations have been developed to deal with overdispersion and under-dispersion (non-Poisson situations). The application of Eq. 14 ensured that the dispersion was preserved from the non-stationary model into the stationary model, at least, from a quasi-Poisson point of view. In both situations, the degrees of freedom (df) were taken as ns – n.
Finally, we fitted the negative binomial distribution to the transformed stationary count rates using the generalized linear model option “gamlss” from the package “gamlss” in
R
(Rigby and Stasinopoulos Reference Rigby and Stasinopoulos2005; Stasinopoulos and Rigby Reference Stasinopoulos and Rigby2007). The generalized linear method (GLM) is a fitting of the counts which outputs φ
NB1
, but φ
NB1
must be corrected for the right df (see Online Supplementary Materials). Finally, we calculated the dispersion parameter D as $\sqrt {{\varphi _{qp}}} $
or
$\sqrt {{\varphi _{qp}}} $
or $\sqrt {1 + {\varphi _{NB1}}} $
; the internal error from the counting statistics and the external error from the
14,12
R ratios. The code in
R
program language to infer the models J and μ can be downloaded from github (github/oPAC) for using csv data files.
$\sqrt {1 + {\varphi _{NB1}}} $
; the internal error from the counting statistics and the external error from the
14,12
R ratios. The code in
R
program language to infer the models J and μ can be downloaded from github (github/oPAC) for using csv data files.
Cycles-based external error
The conventional method for expressing external error for AMS consists of calculating the standard error of the means ⟨14,12 R⟩ corresponding to each pass, as depicted in Eq. 4. The conventional passes-based external error is the scatter of ⟨14,12 R⟩pass (red lines in Figure 1e) which contains n–1 degrees of freedom. Furthermore, another external error is the standard error of all the 14,12 R i values corresponding to all the individual cycles which account for ns–1 degrees of freedom as defined in Eq. 17.
 $$SE_{\left \langle X\right \rangle, rel}= {{\sigma_{R\, cycles}}\over{{\left \langle _{}^{14,12}\textrm{R}\right \rangle _{global} \sqrt{ns}}}} = {{\sqrt{{\sum_{i= 1}^{ns}\left [ _{}^{14,12}\textrm{R}_{i}-\left \langle _{}^{14,12}\textrm{R}\right\rangle_{global} \right]^2}{\bigg/}{{ns-1}}}}\over{\left \langle _{}^{14,12}\textrm{R}\right \rangle _{global} \sqrt{ns}}}$$
The equivalency of Eq. 17 to Eq. 4 originates from the Central Limit Theorem which equates the standard deviation of the means to the standard deviation of the population factored by the root of the sample size ${\sigma _{R\;means}} = \;{\sigma _{R\;cycles}}/\sqrt s $
where the number of cycles per pass (s) is the sample size (Brussolo Reference Brussolo2018; Ruggieri Reference Ruggieri2016). The same approach was applied to the counting uncertainty to deduce internal error in Eq. 5. Here, we compared the cycles-based external error to the conventional passes-based external error to test if the results were obeying the Central Limit Theorem.
${\sigma _{R\;means}} = \;{\sigma _{R\;cycles}}/\sqrt s $
where the number of cycles per pass (s) is the sample size (Brussolo Reference Brussolo2018; Ruggieri Reference Ruggieri2016). The same approach was applied to the counting uncertainty to deduce internal error in Eq. 5. Here, we compared the cycles-based external error to the conventional passes-based external error to test if the results were obeying the Central Limit Theorem.
Calculation of the 12C noise (uncertainty)
The high-energy 12C beam current (I i ) relative uncertainty, shown in Eq. 18, was the noise of the current around a perfectly smooth model J i . We can show that the form of Eq. 18 is similar to Eq. 17 if the value of J i was constant as ⟨14,12 R⟩global then it would be possible to take J i out and by approximating ns to ns–1 then both equations would be almost the same.
 $$S{E_{C12,\;rel}} = \;{{\sqrt {\mathop \sum \nolimits_{i = 1}^{ns} \;{{\left[ {{{{I_i} - {J_i}} \over {{J_i}}}} \right]}^2}} } \over {ns - 1}}\;$$
The 14,12
R inset (Figure 1f) shows that a perfect ratio without scatter (horizontal red line) could be obtained across a pass by dividing the models of the count rates and current (μi/J
i
) which are also smooth and proportional to each other in their respective scales. Therefore, the count rate scatter and the noise of the current are both translated into the scatter on the 14,12
R values. Mathematically, the ratio is a function of the models and their uncertainties: ${}_{}^{14,12}{R_i} = ({\mu _i} \pm \Delta {\mu _i})/\left( {{J_i} \pm \Delta {J_i}} \right)$
where Δμ
i
= μ
i
-N
i
and ΔJ
i
= J
i
-I
i
. For this reason, the effect of the 12C uncertainty on the overall internal error calculation was taken into consideration in this paper.
${}_{}^{14,12}{R_i} = ({\mu _i} \pm \Delta {\mu _i})/\left( {{J_i} \pm \Delta {J_i}} \right)$
where Δμ
i
= μ
i
-N
i
and ΔJ
i
= J
i
-I
i
. For this reason, the effect of the 12C uncertainty on the overall internal error calculation was taken into consideration in this paper.
Novel passes-based internal error
 $$D_{passes}^2 = {\varphi _{passes}} = {s \over n}\mathop \sum \nolimits_{pass = 1}^n {{{{\left[ {\left( {{{{\langle J_{T,pass}\rangle}} \over {{I_{T,pass}}}}\langle{N_i}\rangle_{pass}} \right) - {\langle \mu \rangle_{global}}} \right]}^2}} \over {{\langle \mu \rangle_{global}}}}$$
 $$S{E_{passes,\;\;rel}} = {D_{passes}}/\sqrt {{N_T}} $$
The derivation of the passes-based internal error (Eq. 19) is shown in the Supplementary Materials. In Eq. 19 and 20; N
T
is the total 14C counts of the whole measurement of n passes, each pass containing s cycles. N
T
is the same concept defined for Eq. 2 and 5. ${N_T} = \mathop \sum \nolimits_{i = 1}^{ns} {N_i}$
. I
T,pass
is the accumulated 12C current magnitude corresponding to each pass.
${N_T} = \mathop \sum \nolimits_{i = 1}^{ns} {N_i}$
. I
T,pass
is the accumulated 12C current magnitude corresponding to each pass. ${I_{T,pass}} = \mathop \sum \nolimits_{i = i0}^{i0 + s - 1} {I_i}$
. Each pass is defined between i0 and i0+s–1 cycles. For example, the first and second passes for s=15 are defined by cycles 1 to 15 and 16 to 30 respectively. ⟨J
T,pass
⟩ is the average of accumulations of the J model current corresponding to each pass defined as
${I_{T,pass}} = \mathop \sum \nolimits_{i = i0}^{i0 + s - 1} {I_i}$
. Each pass is defined between i0 and i0+s–1 cycles. For example, the first and second passes for s=15 are defined by cycles 1 to 15 and 16 to 30 respectively. ⟨J
T,pass
⟩ is the average of accumulations of the J model current corresponding to each pass defined as ${\langle J_{T,pass}}\rangle = {1 \over n}\mathop \sum \nolimits_{pass = 1}^n \;{J_{T,pass}}$
where the cumulative J
T,pass
is defined exactly as I
T,pass
. Both ⟨J
T,pass
⟩ and I
T,pass
are accumulations at the passes level with similar magnitude, and there is no need for conversion into electrical charge. ⟨N
i
⟩pass is the average 14C counts per cycle for each pass calculated as the total counts corresponding to each pass divided by the number of cycles.
${\langle J_{T,pass}}\rangle = {1 \over n}\mathop \sum \nolimits_{pass = 1}^n \;{J_{T,pass}}$
where the cumulative J
T,pass
is defined exactly as I
T,pass
. Both ⟨J
T,pass
⟩ and I
T,pass
are accumulations at the passes level with similar magnitude, and there is no need for conversion into electrical charge. ⟨N
i
⟩pass is the average 14C counts per cycle for each pass calculated as the total counts corresponding to each pass divided by the number of cycles. $\langle {N_i}\rangle_{pass} = {1 \over s}\;{N_{T,pass}}$
. ⟨μ ⟩global is also an average 14C counts per cycle of the model calculated as the global accumulation relative to all the cycles (ns).
$\langle {N_i}\rangle_{pass} = {1 \over s}\;{N_{T,pass}}$
. ⟨μ ⟩global is also an average 14C counts per cycle of the model calculated as the global accumulation relative to all the cycles (ns). ${\langle \mu \rangle_{global}} = {1 \over {ns}}\;{\mu _T}$
. One I
T,pass
, J
T,pass
and ⟨N
i
⟩pass value is calculated for each pass. I
T,pass
= {I
T,1…
I
T,n
}, J
T,pass
= {J
T,1…
J
T,n
}, ⟨N
i
⟩pass ={ ⟨N
i
⟩1 …⟨N
i
⟩n }.
${\langle \mu \rangle_{global}} = {1 \over {ns}}\;{\mu _T}$
. One I
T,pass
, J
T,pass
and ⟨N
i
⟩pass value is calculated for each pass. I
T,pass
= {I
T,1…
I
T,n
}, J
T,pass
= {J
T,1…
J
T,n
}, ⟨N
i
⟩pass ={ ⟨N
i
⟩1 …⟨N
i
⟩n }.
A closer inspection of Eq. 19 showed that the average counts per cycle of each pass, ⟨N i ⟩pass, is weighted by a corresponding ratio ⟨J T,pass ⟩/ I T,pass which depends on the 12C current model J and the current data I. These ratios distribute around 1. In other words, ⟨N i ⟩pass is being transformed (see Eq. 21) and consequently, Eq. 19 can be rewritten as Eq. 22. The transformation ⟨N⟩”pass corresponding to each pass is illustrated in Figure 1c as horizontal red lines.
 $$\langle N \rangle_{pass}^{''} = \;{{\langle{J_{T,pass}}}\rangle \over {{I_{T,pass}}}}\langle{N_i}\rangle_{pass}$$
 $$D_{passes}^2 = {\varphi _{passes}} = {s \over n}\mathop \sum \nolimits_{pass = 1}^n {{{{\left[ \langle{N\rangle_{pass}^{''} - \langle{\mu \rangle_{global}}} \right]}^2}} \over {{\langle \mu \rangle_{global}}}}\;$$
Simulation of the 14C count rates
The raw counts of an AMS radiocarbon measurement, as noted above, were simulated by arbitrarily drifting the high-energy 12C current (I
i
) in a similar fashion to real measurements. The drift function shape and magnitude were chosen from our long experience running graphite samples. The simulation assumed the observed 14C count rates were random integers that follow a non-Poisson distribution. The expected 14C count rate was taken as the local count rate model (μ
i
). The expected count rate was calculated for each cycle i multiplying the HE 12C current with or without Gaussian noise by the
14,12
R absolute value and the cycle time; dividing by the elementary charge in Coulombs and supposing 100% transmission from the high energy side until the counting detector (see Eq. 10). At each cycle, a random count rate N
i
was generated around the calculated expectation μ
i
using the negative binomial random integer generator of the
R
program ${N_i}\sim NB\left( {{\mu _i},{\varphi _{in}}} \right)$
. A Poisson distribution could be simulated when φin =1. In this way, the underlying dispersion (φin) was known. Like the empirical data, the models J and μ were inferred from the simulated current and counts rates, which were transformed into N’
i
. The GLM fitting was carried out and the dispersion D was calculated. The parameters of interest, like 12C noise, HE 12C current, non-Poisson dispersion and other parameters, were systematically and uniformly sampled, and the simulation was repeated in a Monte Carlo fashion. This method allowed the simulated uncertainty of the 14,12
R ratio to depend on the combination of the dispersion of the 14C counts and the 12C uncertainty or noise.
${N_i}\sim NB\left( {{\mu _i},{\varphi _{in}}} \right)$
. A Poisson distribution could be simulated when φin =1. In this way, the underlying dispersion (φin) was known. Like the empirical data, the models J and μ were inferred from the simulated current and counts rates, which were transformed into N’
i
. The GLM fitting was carried out and the dispersion D was calculated. The parameters of interest, like 12C noise, HE 12C current, non-Poisson dispersion and other parameters, were systematically and uniformly sampled, and the simulation was repeated in a Monte Carlo fashion. This method allowed the simulated uncertainty of the 14,12
R ratio to depend on the combination of the dispersion of the 14C counts and the 12C uncertainty or noise.
Results and discussion
Validation of the simulations
Our strategy for validating the simulations was to compare our simulated uncertainty to empirical results from the literature and our own measurements. The studied parameters that affect the simulated uncertainty were the sample 14,12 R value, the number of passes (data points), and the beam currents. Furthermore, we assessed how much the simulated internal error explained the external error under Poisson conditions.
The Poisson distribution demonstrated a better fit to the count rate data and produced a more realistic model than the Normal distribution, as shown in Figure S1 (Supplementary Materials). The symmetrical position of the confidence intervals of the Normal distribution created a small but nonsensical probability of negative counts for a fossil sample. The Poisson distribution shape not only changed with the mean, but it was asymmetric, bounded at zero counts (Figure S1b), and this property gave zero probability of negative counts. Modern samples were exempt from the Gaussian failure because their means were far from zero, as shown in Figure 1d. Nevertheless, the Poisson distribution was chosen because it was applicable to every type of sample.
We characterized the beam current as its maximum value at the high energy (HE) side, e.g. 12C=20 μA in Figure 1a. The error magnitudes from the simulations (Figure 2a) at 14 passes were comparable to the empirical results extracted from our AMS database (see Figure S2). The range of errors in the simulation, (0.5–3) ×10–3 in units of absolute 14,12 R (1×10–12), was a bit higher than the empirical range (0.4–2) ×10–3, which was also in units of absolute error. In addition, the magnitude of the simulated errors (Figure 2a) was comparable to empirical errors from the literature, Figure 5 in Salazar and Szidat (Reference Salazar and Szidat2021). The error scale in the literature was (0.5–4) ×10–3 F14C. The conversion of our simulations absolute errors into F14C should result in a similar range to the literature empirical range because our oxa2 always has consistently given an absolute 14,12 R of (1.45–1.5) ×10–12 and the δ13C correction is too small to change the errors scale. It must be noted that the literature results were a compendium of four publications. The parabolic shape of Figure 2a agrees with empirical measurements and theory from Nadeau and Grootes (Reference Nadeau and Grootes2013).
Validation of the model simulations with Poisson distribution. (a) Absolute Poisson error behavior across a range of 14,12R values (0.003–1.4) ×10–12 for two sets with different number of passes. 12C current=20 μA max. (b) Absolute Poisson error behavior across a range of maximum 12C currents for 14,12R=1×10–12 for two sets with different number of passes described in (a). The legends for (a) and (b) are the same. (c) 1:1 plot of relative errors vs. relative external error for 14 passes. The 14,12R sample range was (0.003–1.0) ×10–12 and the same conditions as (a). (d) 1:1 plot of the relative errors vs. relative external error for 14 passes and the same conditions as in (b). The legends for (c) and (d) are the same.

Another interesting point about our simulations was that the scatter of the measured errors depended on the number of passes (Figure 2a, b). Every data point in Figure 2a, b came from the simulation of a certain number of passes (everything in Figure 1). This meant that repeating the simulation for the same conditions did not return the same measured error but a distribution of errors. This variability of the error measurement was due to the stochastic nature of the process. The parameter output of stochastic simulations is a distribution of values. A very simple example is generating a number of random values around a straight line with an underlying slope. Every time the simulation is performed, a slightly different slope is measured. In our case, when the number of simulated data groups was increased from 14 to 90 passes, then the variability of the measured errors decreased or in other words, the width of the output distribution of the errors became narrower.
The behavior of the absolute Poisson error showed a decaying pattern with the increase of the 12C beam currents (Figure 2b). The decaying shape of the plot was expected because at higher beams, the number of counts increased, and the measurement uncertainty decreased. One method to proportionally increase the beam 12C current, empirically, is to increase the sample carbon content within a certain range (Pearson et al. Reference Pearson, McNichol, Schneider, Von Reden and Zheng1997). These authors showed how the error decayed by increasing the sample C mass; thus, we can interpret that their error decayed with 12C current, giving a similar shape as our simulations (Figure 2b).
We compared several measurement errors with the conventional passes-based external error calculated using Eq. 4 (see Figure 2c, d). In both figures, the errors are scattered around the 1:1 line. The fact that there was a trend between the cycles-based external error and the passes-based external error demonstrated that the Central Limit Theorem was applicable to the simulated data for these Poisson conditions as explained in the introduction. The errors that lay exactly on the 1:1 line presented a reduced χ2 of 1, while the distribution around the 1:1 line should reflect a χ2 distribution. This distribution is presented in the last part of the Results section. In some papers, it had been argued that only when the internal and external errors are about the same then the uncertainty is mostly due to counting statistics (Bonani et al. Reference Bonani, Beer, Hofmann, Synal, Suter, Wölfli, Pfleiderer, Kromer, Junghans and Münnich1987; Tumey et al. Reference Tumey, Grabowski, Knies and Mignerey2004; Vogel et al. Reference Vogel, Ognibene, Palmblad and Reimer2004). However, here we argue that because both errors obey a χ2 distribution, then sometimes these errors can differ but still the counting statistics apply. One important condition of the simulations of Figure 2 is that they were fixed to Poisson distributions, and the measured quasi-Poisson error was similar to the Poisson error. This demonstrated the accuracy and versatility of the equation for the quasi-Poisson error.
As expected, the Poisson error, on average, followed the passes-based external error in Figure 2c, d. These results reproduced the traditional equivalency of the internal and external errors in AMS which relies on the CLT as shown in Eq. 4 and 5.
Simulated non-Poisson counting statistics
In this subsection, the simulation was carried out for count rate distributions spread away from the Poisson distribution. The accuracy and precision of measuring the dispersion D was checked and how this precision depended on the number of passes under non-Poisson conditions. Finally, a new passes-based internal error was demonstrated.
Under non-Poisson conditions, the histogram of the particles of Figure 1c became wider than a Poisson distribution (see Poisson example in Figure 1d) when the dispersion D was increased in the simulation. This generated data (input) was fed into the statistical model calculations to output the dispersion D and the errors. The measured dispersion D (D output) presented a good agreement with the input dispersion D for 14 and 90 passes, as shown in Figure 3a, b. This agreement showed that our method of calculating the non-Poisson dispersion was accurate. The uncertainty to measure the dispersion D was quantified with the confidence interval width (σD = 0.050 and 0.021 for 14 and 90 passes, respectively) corresponding to the D input-D output plots (Figure 3a, b). The magnitude of the scatter σD translates into higher uncertainty to measure D. The difference in scatter between Figure 3a, and 3b was explained above in “validation of the simulations.” If more data points (passes) were available, then the measurement of the error of the whole measurement would become more robust (better reproducibility and accuracy of measuring the error). Figure 3a, b also showed that the Negative Binomial method produced a similar dispersion D to the quasi-Poisson method. This is significant because the Negative Binomial is computationally exhaustive and involves optimization of the NB model recursively, while the quasi-Poisson just outputs the Pearson χ2 equation once. Thus, the quasi-Poisson method is an accurate and simple equation to calculate the non-Poisson error.
Simulated non-Poisson 14C counting statistics for 14,12R = 1.0×10⁻¹² and 20 μA which resulted in very similar NT counts for each dispersion D. (a) D input-D output plot is the plot of the measured dispersion D vs. input dispersion D for 14 passes. 2σ confidence interval is shown with dashed lines. (b) Measured dispersion D vs. input dispersion D for 90 passes, (a) and (b) shares the same legend. (c) Diverse relative errors vs. conventional passes-based external error for 14 passes. (d) Diverse relative errors vs. conventional passes-based external error for 90 passes. The error increase on the x,y axis on (c) and (d) was created by increasing the dispersion D of the 14C distribution shown in (a) and (b).

The errors of Figure 3c, d corresponded to the simulations of Figure 3a, b; therefore, the increase of the error was due to the increase of the 14C dispersion D. As expected, the measured Poisson error of the simulations was not able to capture the increase in count rate dispersion, while the quasi-Poisson and the cycles-based external errors (Eq. 17), to some degree, correlated with the conventional passes-based external as shown by their slope and scatter around the dashed line on Figure 3c. The Pearson correlation coefficient (r) of the quasi-Poisson vs. passes-based external errors was 0.47. When the number of passes was increased from 14 to 90, then the quasi-Poisson errors showed a better agreement with the passes-based external error with a r = 0.78. The same increase in agreement occurred for the cycles-based external (Figure 3d). The increase in correlation was mainly due to the increase in slope which became closer to the 1:1 line. The agreement of the cycles-based external error at higher number of passes indicated that the CLT required more data points to be applicable under non-Poisson conditions. In practice, to measure 14 passes, it takes 2.4 days but 90 passes would take 15 days and consume entirely the sample target. The 90-passes results are depicted primarily for demonstration purposes. Nevertheless, the quasi-Poisson error, to some degree, can follow the external error much better than the Poisson calculations under non-Poisson conditions. The uncertainty to measure the dispersion D (σD) decreased very fast, starting at 7 passes and stabilizing at 90 passes (see Figure S3 in the Supplementary Materials). The quasi-Poisson error correlation r with the external error increased very fast for the same range of passes.
We suggest that the difficulty in capturing the conventional external error using the quasi-Poisson internal error and the cycles-based external error arises because they are calculated at the level of the cycles and conventional external errors are based on the passes. Therefore, we developed a novel internal error which was based on the count rates analysed at the passes level (see Eq. 19, 20 and 22). We emphasize the similarity between our novel passes-based internal error equation (Eq. 22) with the literature quasi-Poisson equations (Eq. 16). This similarity of outcome validated Eqs. 19 and 22. The passes-based internal error was derived from the conventional passes-based external error converted into 14C count rates and 12C current. However, this conversion required that the models µ and J were accurately measured. Furthermore, the passes-based internal error defined the 14,12 R ratio averages at the global and passes levels as the ratio of the total accumulation of each isotope at the respective level, whereas the conventional external error uses true averages of the ratios.
The novel passes-based counting internal error (Eq. 22) showed excellent agreement with the conventional passes-based external error (Eq. 4) as shown in Figure 3c, d. The passes-based counting internal error was robust and independent of the number of passes in contrast with the other errors. Eq. 22 was back- engineered from Eq. 4 but Eqs. 19, 22 have a different definition for the global and passes ratios. In addition, Eqs. 19, 22 only work if the counting and current models are well inferred.
Simulated effect of the 12C uncertainty on the 14,12R error
The 12C uncertainty in Figure 4a was created by adding Gaussian noise into the input 12C current function of the simulation and then quantifying the 12C uncertainty with Eq. 18. As noted in the “Calculation of the 12C noise (uncertainty)” of the Methods, the 12C noise or uncertainty caused the passes-based external error to increase in the range of 0.15%–0.45% for a modern 14C sample. However, the increase of 12C noise did not cause the same effect in a low-14C sample. The reason is the 12C uncertainty magnitude was too low (0.05%–0.35%) for the old sample compared to the overall error of 2.5%–5.0%. This result contrasted with the effect of increasing the 14C dispersion, which is the same for both fossil or modern samples.
Simulated 12C noise impact on error at 20 μA. (a) passes-based external error vs. the 12C current noise for blank sample (14,12R=0.003×10⁻¹²) and modern sample (14,12R=1.0×10⁻¹²). The external error of the blank shows no correlation with the 12C noise and stays within the dashed lines, while for the Modern sample there is no increase within the dash square until high 12C noise. (b) Diverse relative errors vs. the passes-based external error, including the error propagation of the quasi-Poisson error and 12C uncertainty. The external error increase is due to the large increase of 12C noise from 0.05% to 0.35%. (c) Diverse relative errors vs. passes-based external error for a blank sample. The variation of the errors in (b) and (c) were due to the variation of the 12C uncertainty as shown in (a).

As expected, neither the quasi-Poisson and Poisson internal errors accounted for the 12C uncertainty, as shown in Figure 4b, but a simple error propagation between the quasi-Poisson and the 12C uncertainty showed good agreement for a modern sample. The error propagation did not work for the fossil sample (Figure 4c) due to the magnitude of 12C uncertainty being too small to cause any perceptible increase in the overall error. On the other hand, the passes-based internal error from Eq. 22 worked well for both cases. Figure 4 shows the importance of accounting for the 12C uncertainty to the internal error for non-fossil samples for the simulated conditions.
In summary, with the developed equations and demonstration plots, we propose a framework for a modified internal error calculation that include two novel aspects to explain the external error: the non-Poisson distribution and 12C uncertainty. It was important to infer models for the count rate and the 12C current. Afterwards, it was possible to calculate the quasi-Poisson and 12C errors. The longer version of the simulation involved the conversion to stationary count rates and the Negative Binomial modeling.
Our simulations showed that non-Poisson dispersion did not fully mirror the external error. However, it was still, on average, closer to the external error than the Poisson error. We also showed that if the 12C uncertainty is low, then it has no impact on the overall error. It is necessary to quantify these errors for each 14C measurement to check if they are considerable or not because the errors depend on many conditions, such as the sample’s 14,12 R, the 12C current magnitude, the number of passes, and instrument stability.
Empirical results
We analyzed the number of Poisson, slightly non-Poisson and strongly non-Poisson results; we measured the degree of 12C relative noise in the empirical data; examined the agreement of the internal errors with the passes-based external error for Poisson and non-Poisson results from the point of view of 1:1 plots and the chi-squared distribution; and how the δ 13C corrections improved the agreement in average.
The number of Poisson and non-Poisson results were recorded in the form of a histogram, shown in Figure 5a. We selected the threshold for Poisson results at a dispersion D range of 1–1.05. This selection was based on the uncertainty of calculating the dispersion D (σD = 0.05) shown in the 2σ confidence interval of the D input-D output plot (Figure 3a). We were not able to find a precedent for defining the uncertainty of measuring the dispersion D using D input-D output simulation plots, therefore using σD is a novel decision-making method. The proportion of Poisson results was 63% out of 7985 samples and reference materials within the range of dispersion D of 1.0 to 1.05 (1 to 1+σD). Around 34% corresponded to samples with slightly non-Poisson dispersion D in the range of 1.05–1.2 (1+σD to 1+4σD). The number of samples with D higher than 1.2 (>1+4σD) was 227, or 2.8%. Overall, most of the time, our instrument produced Poisson results, but the number of highly non-Poisson results cannot be ignored since each reported error must be independently and carefully determined for each sample. We think that the degree of non-Poisson error must be determined for each sample case by case. A dispersion of 1.2 or higher means that the real error is considerably high, 1.2 times the Poisson error or even higher. We can explain the presence of non-Poisson errors to the random instability of the AMS instrument, but this is a preconceived explanation that needs to be studied in the future.
The number of sample measurements in previous work (Vogel et al. Reference Vogel, Ognibene, Palmblad and Reimer2004) supporting Poisson distribution was ca. 8. In our study, we found 227 radiocarbon measurements with strong non-Poisson behavior (D>1.2). However, we can only generalize that Poisson behavior is observed more frequently with non-Poisson exceptions, and we recommend that counting statistics should be measured for each sample.
Figure 5a also shows that histograms for fossil samples (black trace) were similar to the whole population (red trace). This similar behavior meant that the degree of dispersion D was independent of the sample 14,12 R value. Otherwise, the shape of these histograms would have been different. As a routine procedure, each magazine measurement included at least four fossil samples. If the AMS instrument was behaving “non-Poisson” during a certain measurement, then samples and fossil samples would have presented non-Poisson results or Poisson results depending on the instrument condition. The same is true for all the other sample magazines; therein, the similarity of the histogram shapes.
On the other hand, the 12C uncertainty did not exceed a low value of 0.14%, as shown in the histogram of Figure 5b for all the 14C samples measured in our laboratory. The simulations of Figure 4a already showed that 12C uncertainty in the range of 0–0.14% is too low to affect the external error, thus the 12C uncertainty can be discarded from the internal error of our empirical results. A low 12C uncertainty cannot overcome the scatter or variability of the measurement of the external error, even for a modern sample. Nevertheless, we cannot assume that 12C uncertainty can be neglected for radiocarbon AMS. Every laboratory should measure their 12C noise to quantify it and decide.
The Poisson and quasi-Poisson internal errors, to some degree, agreed with the passes-based external error (see Figure 5c) when the experimental conditions favoured Poisson statistics (D<1.05). There is agreement between the internal and external errors as predicted by the simulations in Figure 2c. While, for non-Poisson conditions, internal errors strongly deviated from a 1:1 agreement after 4% (Figure 5d) with the quasi-Poisson error slightly better than the Poisson. The simulations in Figure 3c predicted a stronger deviation under non-Poisson conditions vs. less deviation under Poisson conditions. The reason that the internal and external errors, on average, agree is that their underlying relationship is the chi-squared distribution which allows for many data points to strongly differ within a chi-squared range.
Empirical internal vs. external errors chi-squared relationship
The Central Limit Theorem tells us that the average ratios, corresponding to each pass (14,12
R values) are normally distributed because each pass is a statistical sample. Therefore, from the theory of the chi-squared distribution (Anderson et al., Reference Anderson, Sweeney and Williams1994), the quotient Q should follow a chi-squared distribution (Eq. 23) because Q is the sum of squared normally distributed values standardized by the proposed error or expectation error (internal error). The proposed error is the hypothetical uncertainty that the data should follow along the measurement, and we take the proposed error as a constant value over n passes. For radiocarbon, the proposed error comes from the internal error shown in Eq. 5 ( $proposed\;err. = {\sigma _{pois}}/\sqrt s $
). If the numerator of Q is multiplied and divided by n–1, the numerator becomes the squared standard deviation (σR means)2 explained in Eq. 4. If we divide the numerator and denominator by their mean values to set the errors in relative form and divide both sides by
$proposed\;err. = {\sigma _{pois}}/\sqrt s $
). If the numerator of Q is multiplied and divided by n–1, the numerator becomes the squared standard deviation (σR means)2 explained in Eq. 4. If we divide the numerator and denominator by their mean values to set the errors in relative form and divide both sides by $\sqrt n $
to set both errors as standard errors, then Q becomes (n–1) times the squared quotient of the external and internal relative errors. The external error is the observed realization of the hypothesized proposed uncertainty then the external and internal errors are comparable.
$\sqrt n $
to set both errors as standard errors, then Q becomes (n–1) times the squared quotient of the external and internal relative errors. The external error is the observed realization of the hypothesized proposed uncertainty then the external and internal errors are comparable.
 $$Q = \mathop \sum \nolimits_{i = 1}^n {{{{\left( {{}_{}^{14,12}{R_i} - \;{\langle}_{global}^{14,12}{R_i}\rangle\;} \right)}^2}} \over {proposed\;err{.^2}}} \equiv {{n - 1{{\left( {{\raise0.7ex\hbox{${{\sigma _{R\;means}}}$} \!\mathord{\left/ {\vphantom {{{\sigma _{R\;means}}} {{}_{global}^{14,12}{R_i}\;\sqrt n }}}\right.}\!\lower0.7ex\hbox{${{\langle}_{global}^{14,12}{R_i}\rangle\;\sqrt n }$}}} \right)}^2}} \over {{{\left( {{\raise0.7ex\hbox{${{\sigma _{pois}}/\sqrt s }$} \!\mathord{\left/ {\vphantom {{{\sigma _{pois}}/\sqrt s } {{\mu _{global}}\sqrt n }}}\right.}\!\lower0.7ex\hbox{${{\mu _{global}}\sqrt n }$}}} \right)}^2}}} = {{\left( {n - 1} \right)\;ext.\;err{.^2}} \over {internal\;err{.^2}}}\; \tilde\;\;\chi _{n - 1}^2$$
Over a 2.5-year period, many target samples were consistently measured using 14 passes (n = 14), and a reduced Q value was calculated for each sample (Figure 6). The reduced Q value is Q divided by n – 1. The theoretical reduced chi-squared distribution was also calculated for n = 14 and its distribution shape was similar to that reported in the literature (Wendt and Carl Reference Wendt and Carl1991). Most of the reduced chi-squared values are near to 1.0, but other values are higher or lower. This variability is due to normal random events. If the histogram of the reduced Q values was different than the theoretical reduced chi-squared distribution, then other sources of errors were affecting the results, outliers were present, or the expectation error was incorrectly selected.
Empirical results for 14C non-Poisson dispersion and 12C uncertainty. (a) Histogram of dispersion D for all the samples and standards in our database and for fossil samples. (b) Histogram of 12C uncertainty (noise) for all the samples. (c) 1:1 plot of relative errors vs. passes-based external error at Poisson conditions: 1<D≤1.05, 12C uncertainty>0%, 20 μA <12C current<25 μA. (d) 1:1 plot of relative errors vs. passes-based external error at non-Poisson conditions. Same conditions as (c) but D>1.05.

Reduced Q values histograms and reduced χ2 distribution. The area of the χ2 distribution was approximately equal to the area of the histograms. The reduced χ2 distribution was generated by generating the χ2 distribution for n=14 and then dividing by n–1. The reduced Q values were calculated using two types of external errors relative to several proposed errors shown in the legends. a) reduced Q values calculated with external error with raw ratios. b) reduced Q values calculated with external error corrected with the δ13C information.

Both reduced Q histograms calculated with the raw 14,12 R and the Poisson and quasi-Poisson errors did not produce good chi-squared distributions (Figure 6a). Both reduced Q histograms had a tail to the right side because the reduced Q values were higher than they should have been. In contrast, the histograms of reduced Q values with the numerator calculated with the 14,12 R values corrected by the δ 13C presented a shape very similar to the chi-squared distribution (Figure 6b). Moreover, the quasi-Poisson error produced a better distribution than the Poisson error. The quasi-Poisson error almost mirrored the chi-squared distribution. As the internal errors were the same in Figure 6a and 6b, there is an indication that the δ 13C-uncorrected external errors were too high and not representative of the variability of the measurement in Figure 6a. The uncorrected external errors were too high because during the analysis, the measured 14,12 R values were not constant but usually drifted. This 14,12 R drift or fractionation caused by machine instability or ion source sputtering was another error source or uncounted error that was corrected by δ 13C. The δ 13C correction for carbon isotope fractionation, including machine-derived fractionation was demonstrated by (Steier et al. Reference Steier, Dellinger, Kutschera, Priller, Rom and Wild2004). The empirical evidence of the δ 13C-corrected external error agreeing with the internal error in a reduced χ2 fashion, statistically, showed why the external error should be a realization of the expectation error or proposed internal error.
The reduced Q values represent the ratio of external to internal error squared. Therefore, examining the distribution of the reduced Q values offers another perspective on the data shown in the 1:1 plots of internal error versus external error in Figure 5c and 5d. The reduced Q histograms show more detail and clearer patterns than the 1:1 plots. All data pairs with reduced Q values close to 1.0 fell on the 1:1 line in Figure 5. Figure 6a shows the same data of Figure 5c, d; however, the difference between the quasi-Poisson and Poisson errors can only be realized in the reduced Q histograms. The ideal behavior of the δ 13C-corrected external error versus internal error in Figure 6b cannot be easily seen in a 1:1 plot. The mechanism of δ 13C correction consists on supposing that the raw 14,12 R suffers the same drift shape but twice in magnitude as the 13,12 R along the passes, so the δ 13C drifts from a universal constant value, –25‰, decided by international convention (Steier et al. Reference Steier, Dellinger, Kutschera, Priller, Rom and Wild2004). The magnitude of the δ 13C drift is used to push the raw 14,12 R in the opposite direction, correcting the drift and leaving the scatter of the ratios. On the other hand, as explained in the methods section, the non-stationary to stationary transformation eliminates the drift of the count rates from an absolute constant value, its global mean. The drift is eliminated by aligning the mean count rate of each pass to the global count rate; thus, doing a similar job to the δ 13C correction. For this reason, the δ 13C-corrected external error is more compatible with the internal error, being the non-Poisson error a slightly better representative of the count rate dispersion from a chi-squared perspective.
Another important takeaway from Figure 6b is that sometimes, the internal and external errors can differ as long as their squared ratios stay within the confidence region of a reduced chi-squared distribution and the system is still governed by counting statistics. This chi-squared confidence region is between 0.38 and 1.9 for degree of freedom of 13 and a significance level of 0.05. This takeaway contradicts claims that both errors should be similar if artifacts and drift effects are well corrected (Bonani et al. Reference Bonani, Beer, Hofmann, Synal, Suter, Wölfli, Pfleiderer, Kromer, Junghans and Münnich1987; Tumey et al. Reference Tumey, Grabowski, Knies and Mignerey2004; Vogel et al. Reference Vogel, Ognibene, Palmblad and Reimer2004). Furthermore, we propose that the definition of internal and external errors should be extended to include the 12C uncertainty for completeness as follows: “The internal errors are the propagated 14C and 12C uncertainties, as we calculate them along with the measurand 14,12 R, whereas the external errors are the uncertainties observable from the spread in measurands.” In practice, the 14C counting uncertainty will continue dominating the internal error with the expectation that the 12C uncertainty is, in general, too small as demonstrated in this work in Figure 5c.
On the other hand, the reduced Q values corresponding to our passes-based internal error produced a narrow histogram. The passes-based internal error ultimately failed to match the chi-squared distribution. Therefore, the passes-based internal error is not independent of the conventional passes-based external error. However, the novel passes-based internal error is an extremely good predictor of the passes-based external error, as shown by the empirical data in Figure 5 and simulations (Figures 3, 4). The extremely good agreement of the novel passes-based internal error with the conventional external error is indirect evidence that the models J i, µi were accurately estimated.
Real-world applications
The quoted error absolute values were calculated with the equation proposed by Aerts-Bijma et al. (Reference Aerts-Bijma, Paul, Dee, Palstra and Meijer2021) using Poisson or non-Poisson internal errors and converted to 14C years rounded to the nearest integer (see Figure 7a). The subtraction between the non-Poisson quoted error and the Poisson quoted error are shown in Figure 7b, c and this difference was considerable. Some specific examples with high dispersion D (D>1.2) are written below in the format 14C of age ± Poisson quoted error, non-Poisson quoted error: 49869 ± (437, 456) years BP; 40066 ± (134, 147) years BP; 29986 ± (73, 79) years BP and 20112 ± (39, 43) years BP. The respective differences in the quoted errors are: 19, 13, 6 and 4 in years BP. The respective ratios of the non-Poisson to Poisson quoted errors are: 1.04, 1.10, 1.08 and 1.10 which is a non-Poisson factor of 1.1 on average. These differences are representative values from Figure 7b, c, but higher and lower values can also be expected.
Non-Poisson error translation into radiocarbon age quoted error. (a) Quoted error was calculated from Poisson and non-Poisson counting statistics for different ages with dashed lines indicating representative examples. (b) Difference between the non-Poisson and Poisson quoted errors in radiocarbon years BP for the radiocarbon age range of 0–30,000 years BP. The differences are divided in two groups: differences calculated including quoted errors that included non-Poisson errors with dispersion D between 1 and 1.1 (black) and for dispersion D between 1.1 and 1.5 (red) (c) Difference between the non-Poisson and Poisson quoted errors in radiocarbon years BP for the radiocarbon age range of 30,000–50,000 years BP.

As described in the introduction, it is usually observed that, at a higher processing level, the actual uncertainty of replicates turns out to be higher than the quoted error due to unknown errors. The quoted error has been an essential parameter for calculating expanded errors (by addition or by multiplication) for many applications. Therefore, the usage of non-Poisson quoted errors should decrease the existing known expansion parameters (e.g. error multipliers), helping to close the gap of unknown uncertainties. For example, previously for Figure 7b, c; we showed that on average the non-Poisson quoted error with high dispersion D was 1.1 times larger than the Poisson quoted error. While Aerts-Bijma et al. (2020) found errors multipliers for graphitization, graphite+combustion and graphite+combustion+pretreatment combinations to be 1.1, 1.4 and 1.6 respectively using Poisson quoted errors. Therefore, for this specific example, the non-Poisson quoted error explains 100% of the graphitization error multiplier, 25% for the graphite+combustion combination and 17% for the graphite+combustion+pretreatment combination. The apportionment explanation was calculated as ${{non\;Poisson\;factor - 1} \over {error\;multiplier - 1}} \times 100$
. The non-Poisson error seems to be more realistic than the Poisson, but it is more complicated to calculate. In contrast, the Poisson error is simpler to calculate for a quick and rough prediction of the error of the measurement. Finally, the non-Poisson cannot explain all the systematic effects of replications at high sample treatment level. These effects must be studied using a different method, top-down approach, in future.
${{non\;Poisson\;factor - 1} \over {error\;multiplier - 1}} \times 100$
. The non-Poisson error seems to be more realistic than the Poisson, but it is more complicated to calculate. In contrast, the Poisson error is simpler to calculate for a quick and rough prediction of the error of the measurement. Finally, the non-Poisson cannot explain all the systematic effects of replications at high sample treatment level. These effects must be studied using a different method, top-down approach, in future.
Conclusions and outlook
A new mathematical framework has been developed to quantify two novel parameters that affect the internal error of radiocarbon AMS. These are the non-Poisson uncertainty of the 14C count rate and the 12C uncertainty or the noise of the 12C beam. Simulations were developed based on inferring proportional models for the 14C count rate and 12C current and calculating the quasi-Poisson and 12C errors.
These simulations were verified to examine how these two new parameters were affected by the 14,12 R value of the sample, the 12C current magnitude, and the number of passes. Besides the nature of the sample, the stability of the AMS instrument is primarily what controls these two parameters. The simulations produced results similar to those of the literature and our empirical results. The simulations helped to explain better the following relationships: internal and external error vs. sample 14,12 R value and vs. HE 12C current magnitude; and the 1:1 correspondence, on average, between the internal error and external error for Poisson and non-Poisson conditions.
The analysis of more than two years of empirical radiocarbon results (7985 samples and reference materials) indicated that most of the results (63%) showed Poisson characteristics, 34.2% were slightly non-Poisson, and 2.8% had strongly non-Poisson characteristics. The 12C uncertainty ranged between 0% and 0.15%, which was too small to affect the external error of any 14C sample.
The comparison between the reduced Q value histograms and the reduced chi-squared distribution showed the importance of the δ 13C correction and within this frame of chi-squared distribution, we showed that the quasi-Poisson error is slightly better than the Poisson, in general, to explain the external error.
We emphasize that these results reflected the behavior of our MICADAS instrument. However, we have clearly demonstrated that radiocarbon AMS cannot be assumed to be a Poisson process. While we cannot generalize about how much non-Poisson behavior occurs on other Radiocarbon AMS instruments or that the 12C uncertainty can be neglected, it would be fascinating to see these calculations applied to other laboratories results.
Specifically, we hope our work encourages interest in radiocarbon laboratories evaluating:
-
Non-Poisson statistical models, such as quasi-Poisson and negative binomial models, to better account for internal error in radiocarbon AMS quoted errors, as traditional Poisson assumptions cannot be assumed always to be valid.
-
The 12C current noise, as it could significantly affect the measurement error, especially in modern samples.
Acknowledgments
The data used in this work came from graphite measurements funded by the Canadian Foundation for Innovation. We thank Sarah Murseli, Jennifer Walker and the radiocarbon team at the AEL facility for their hard work converting an enormous number of physical samples into valuable numerical data.
Definition of concepts
Statistical sample: sometimes referred as sample is a set of data observations that should represent the characteristics of the whole population. The population is an ideal concept, and it is the set of all possible data observations. In our context, the set of all possible observations (e.g. ratios) from a graphite target. n is the number of passes in a measurement and s is the size of the sample or the number of cycles per pass.
Internal error (cycles-based): uncertainty or error due to variability of the 14C counting.
Passes-based internal error: novel error of the counting means corresponding to each pass.
External error: Normal distribution uncertainty of the 14C/12C ratios.
Passes-based external error: conventional error of the ratio means corresponding to each pass.
Cycle-based external error: error of the ratios corresponding to all the cycles.
14,12 R, 13,12 R : variables that represents the 14C/12C or 13C/12C ratios.
I i , N i data: set of HE 12C and 14C count rate data respectively evaluated at each cycle i.
J i, µi models: set of values of the mathematical models for the HE 12C and 14C count rate data respectively evaluated at each cycle i. There is a single model for each parameter for each pass.
Dispersion D: model-dependant parameter that represents how many times the actual distribution of the count rates is wider than a Poisson distribution. D is root of the quasi poisson φ (φqp) or could be the root of 1+φNB1.
φqp : the parameter of the quasi-Poisson model and comes from the Pearson χ2 of the count rates.
φNB1 : the parameter of the negative binomial model which is obtained from fitting the count rate data to the model. φNB2 is higher than zero.
Supplementary material
To view supplementary material for this article, please visit https://doi.org/10.1017/RDC.2025.10115
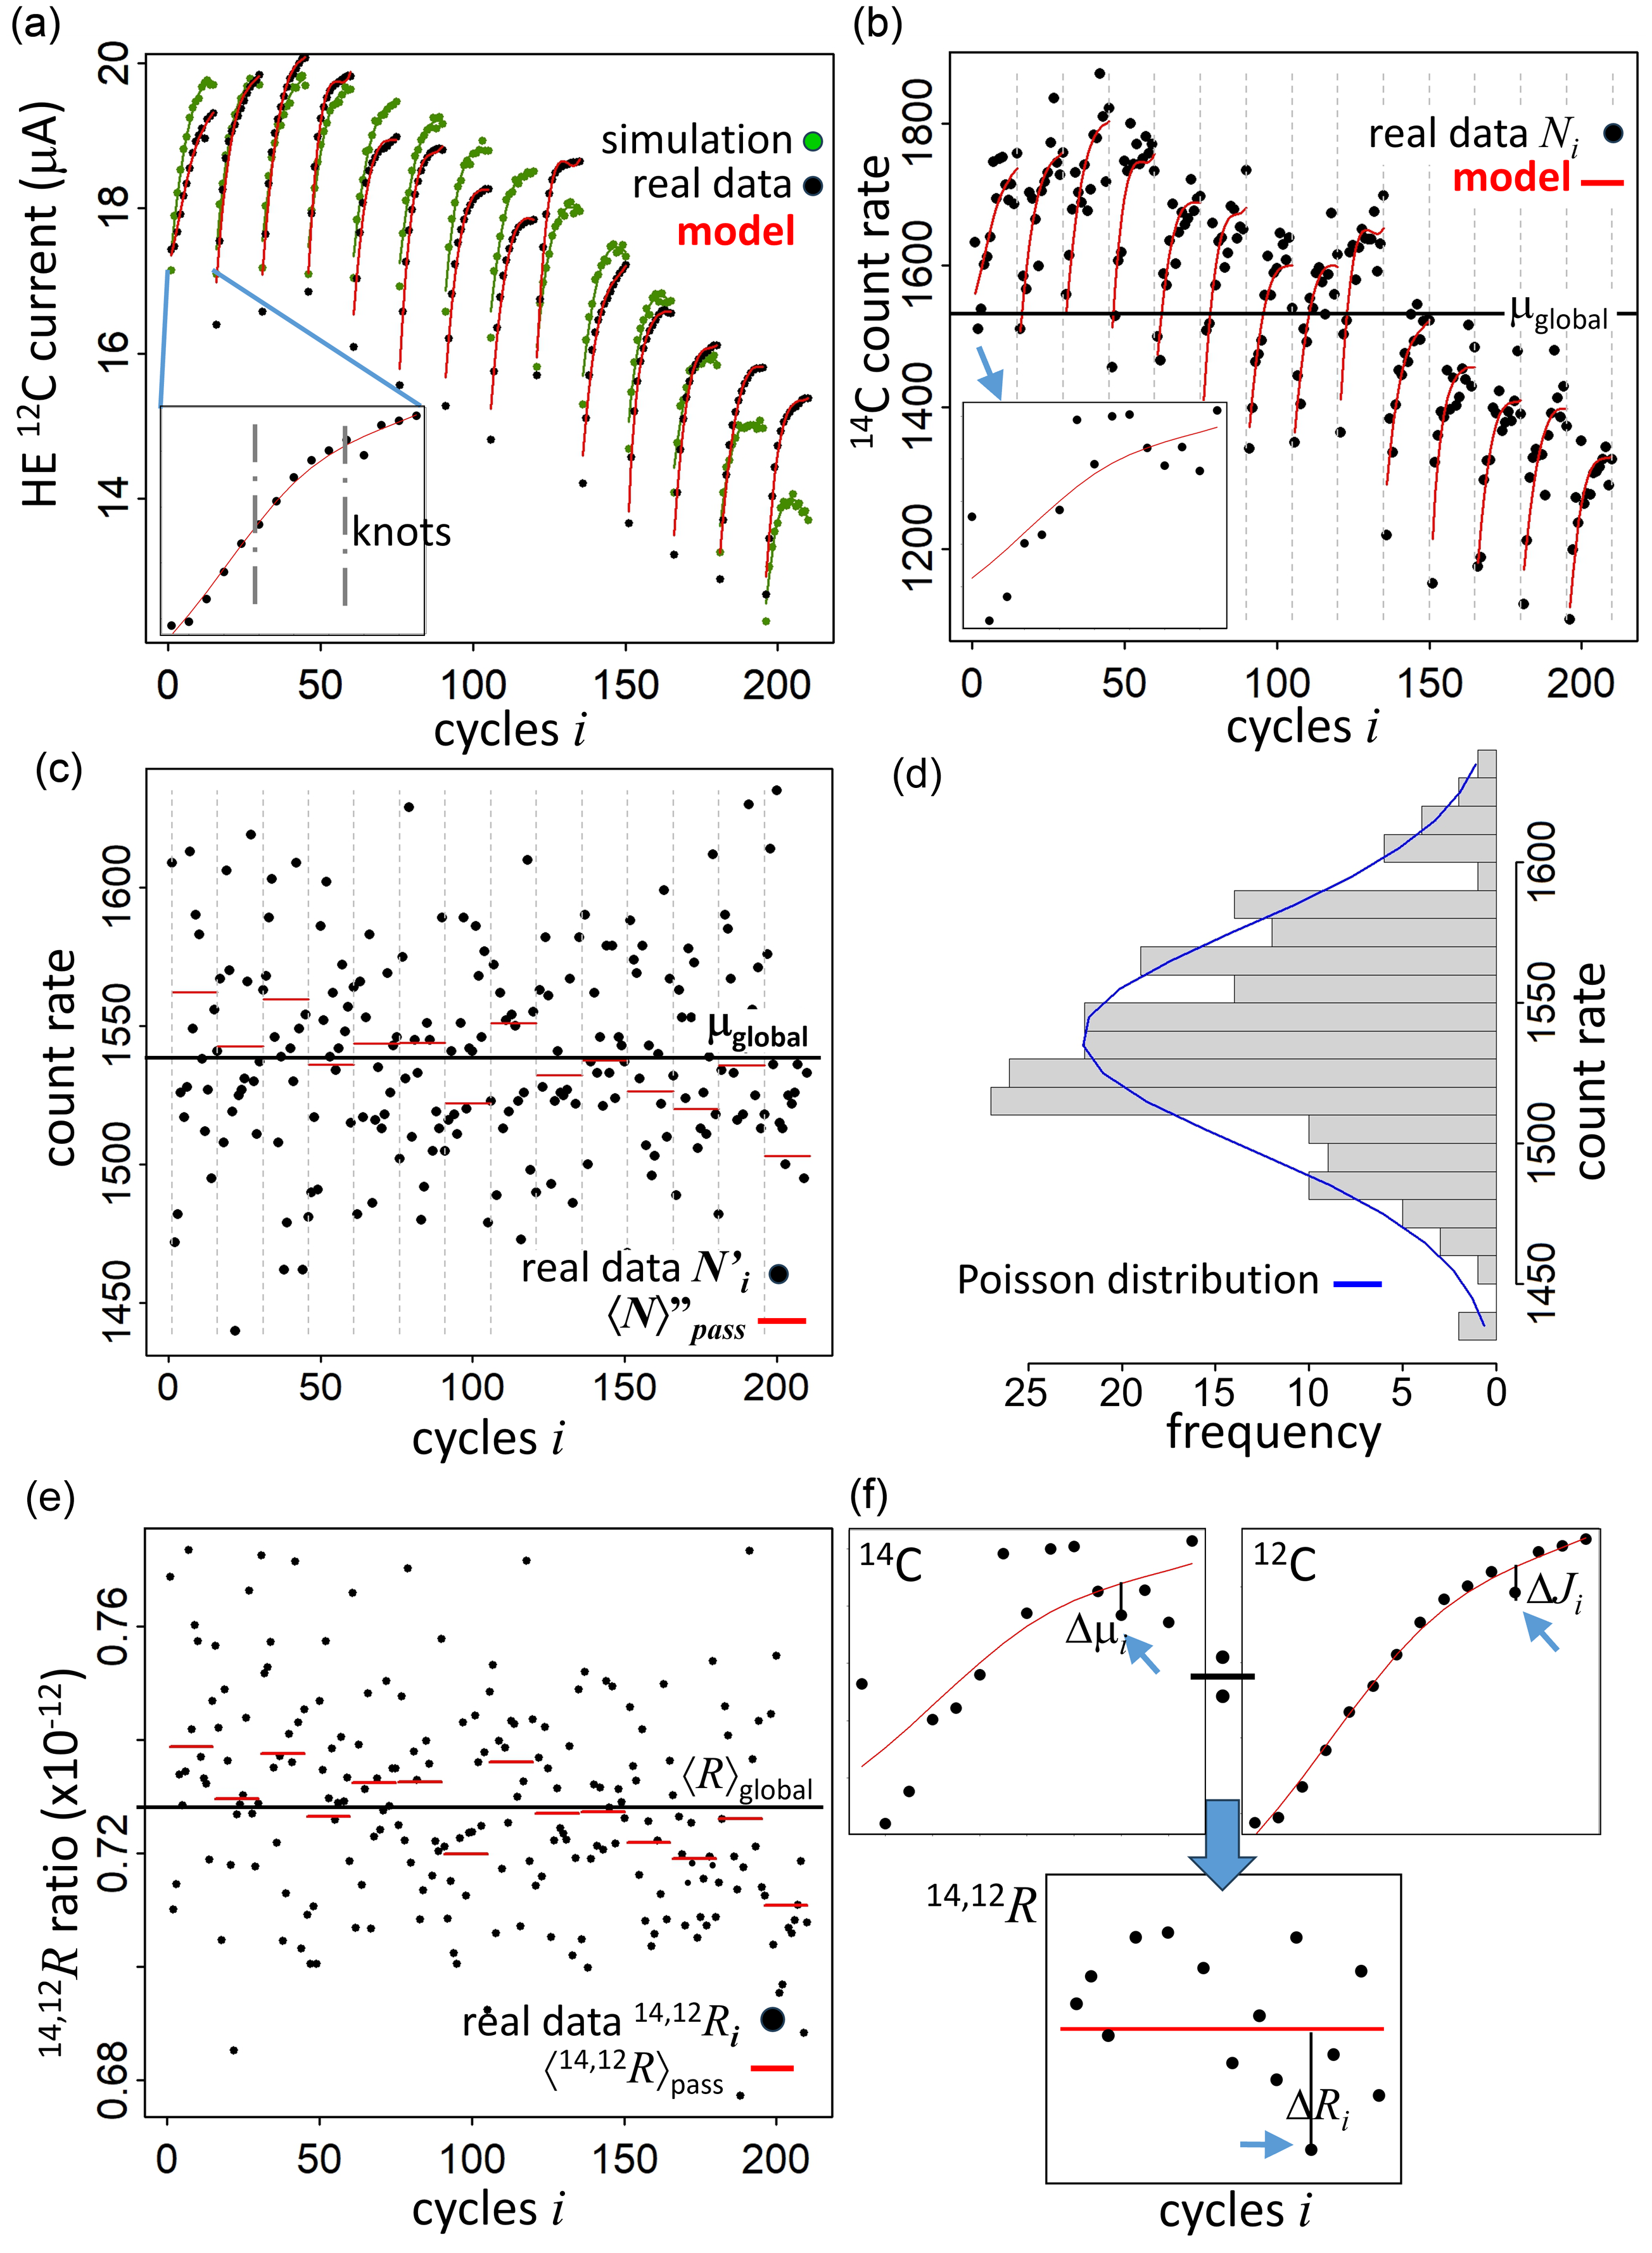
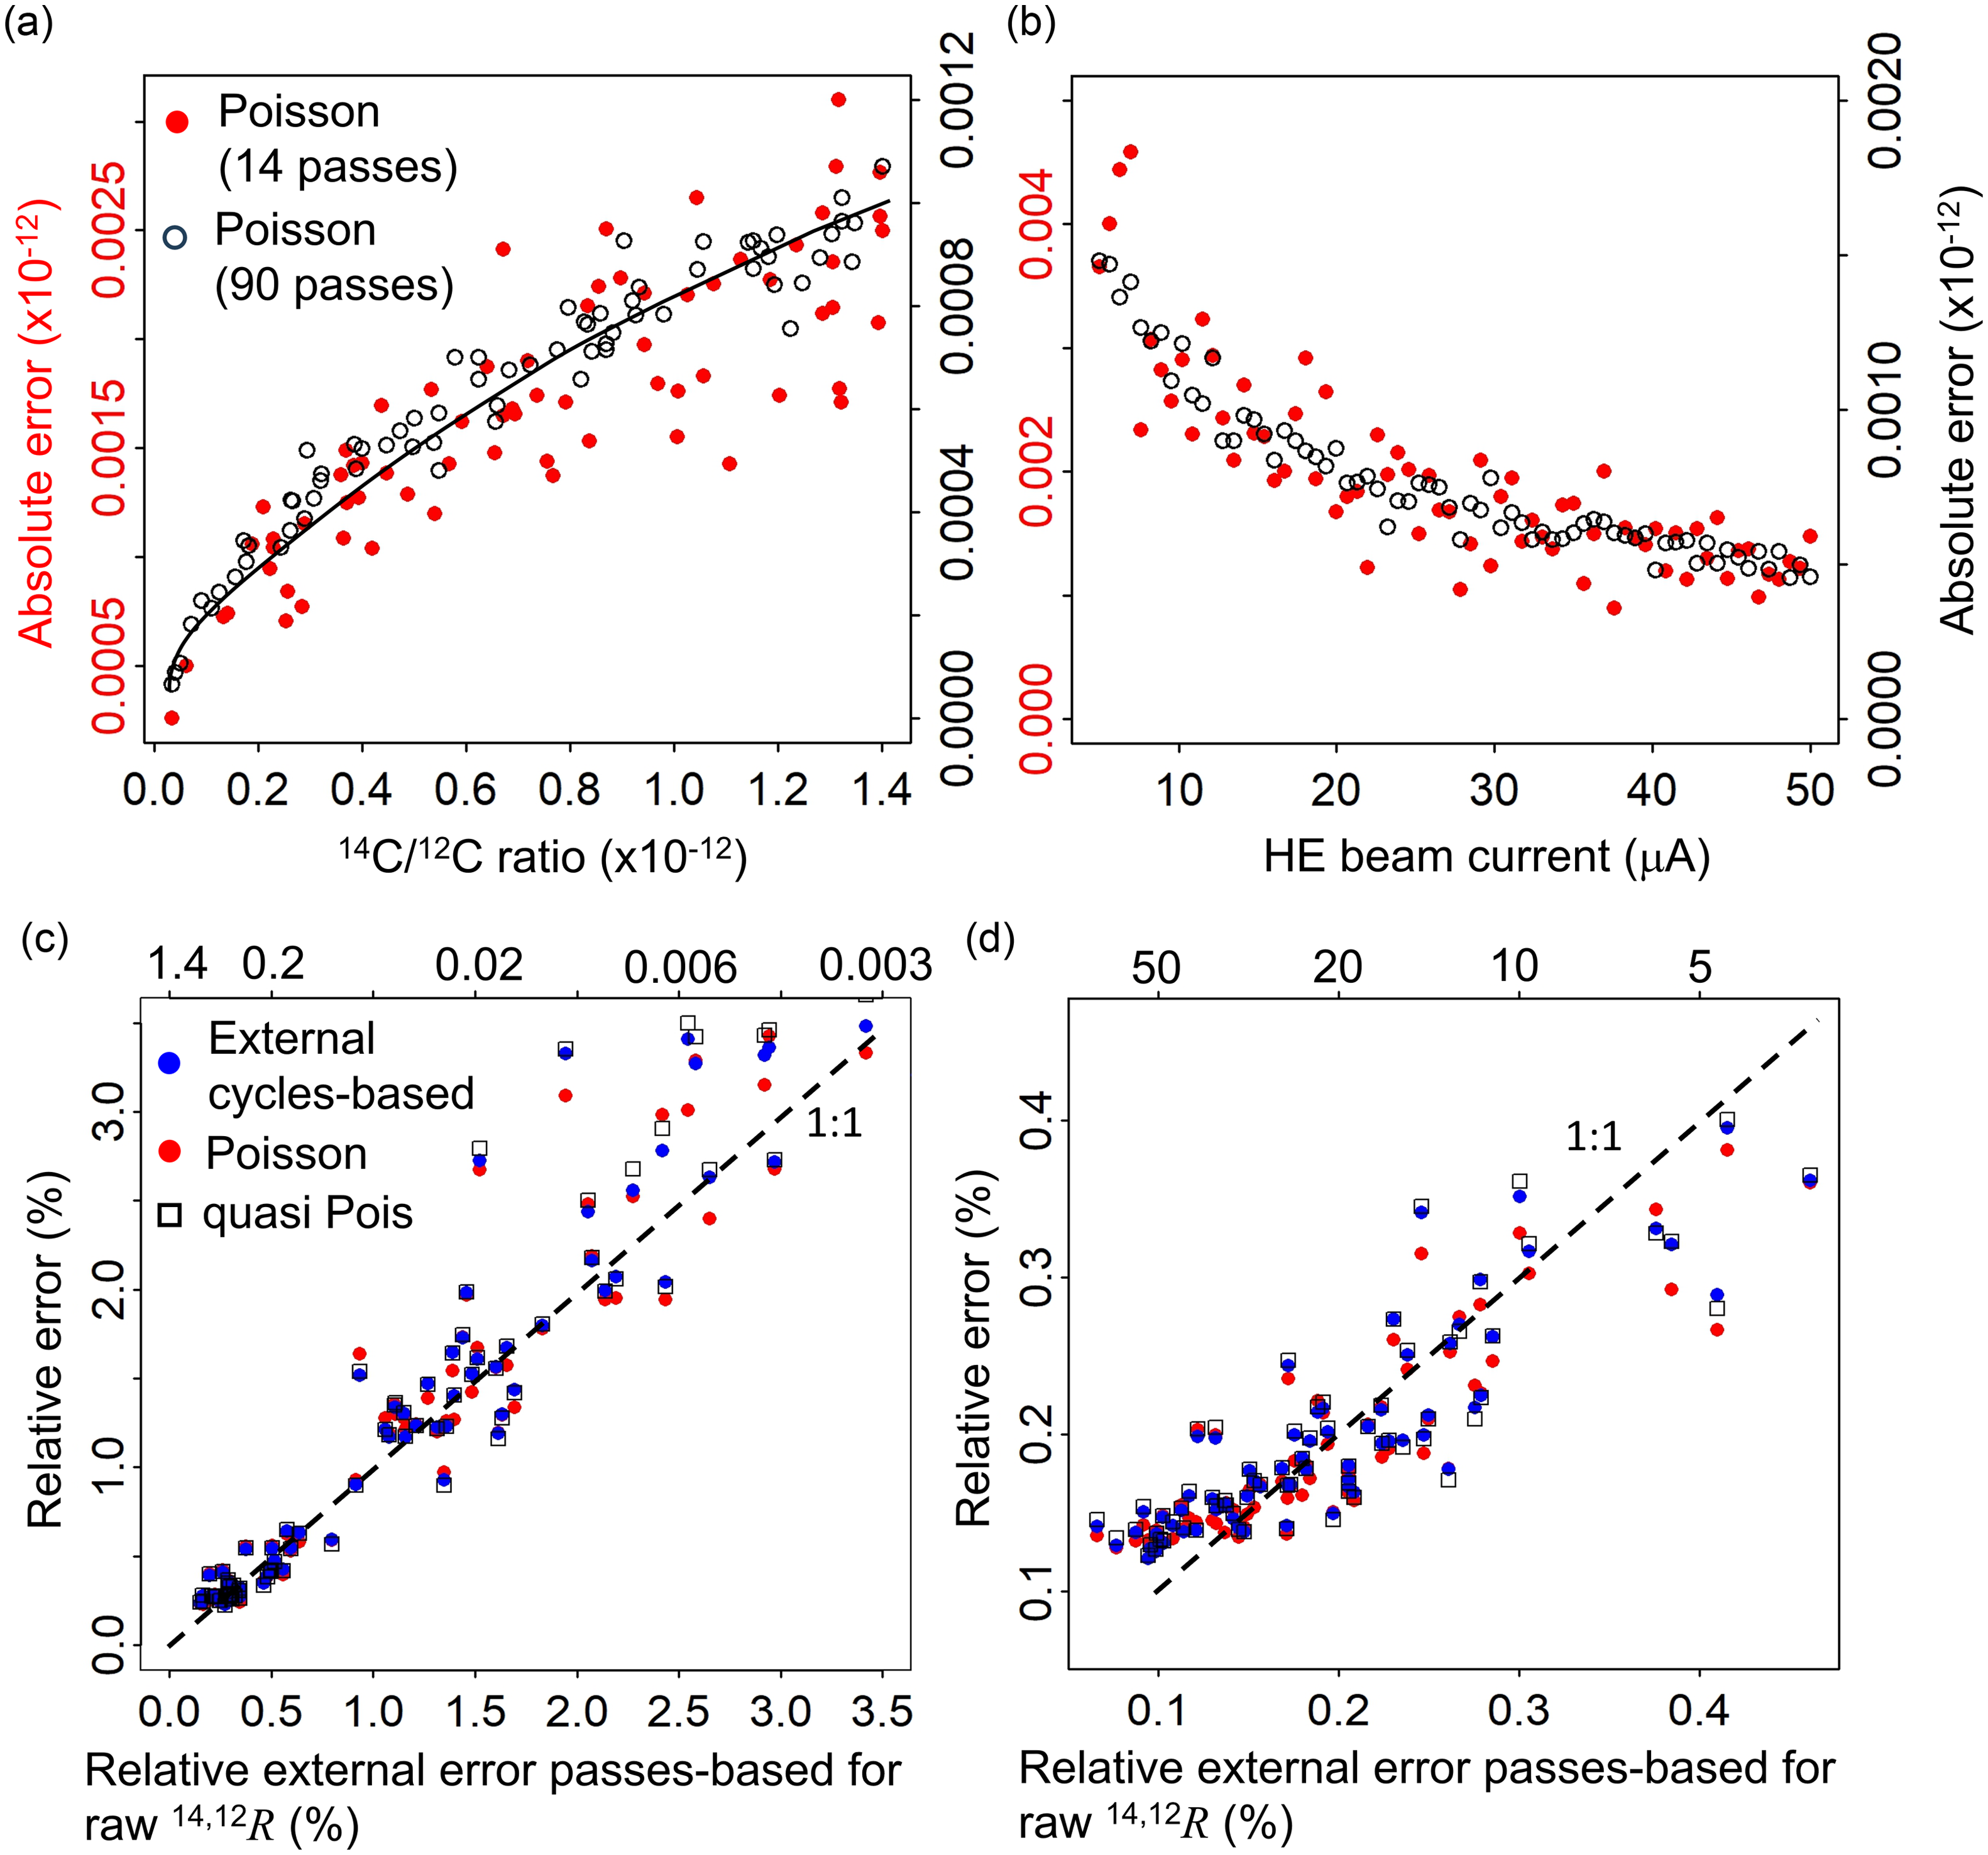
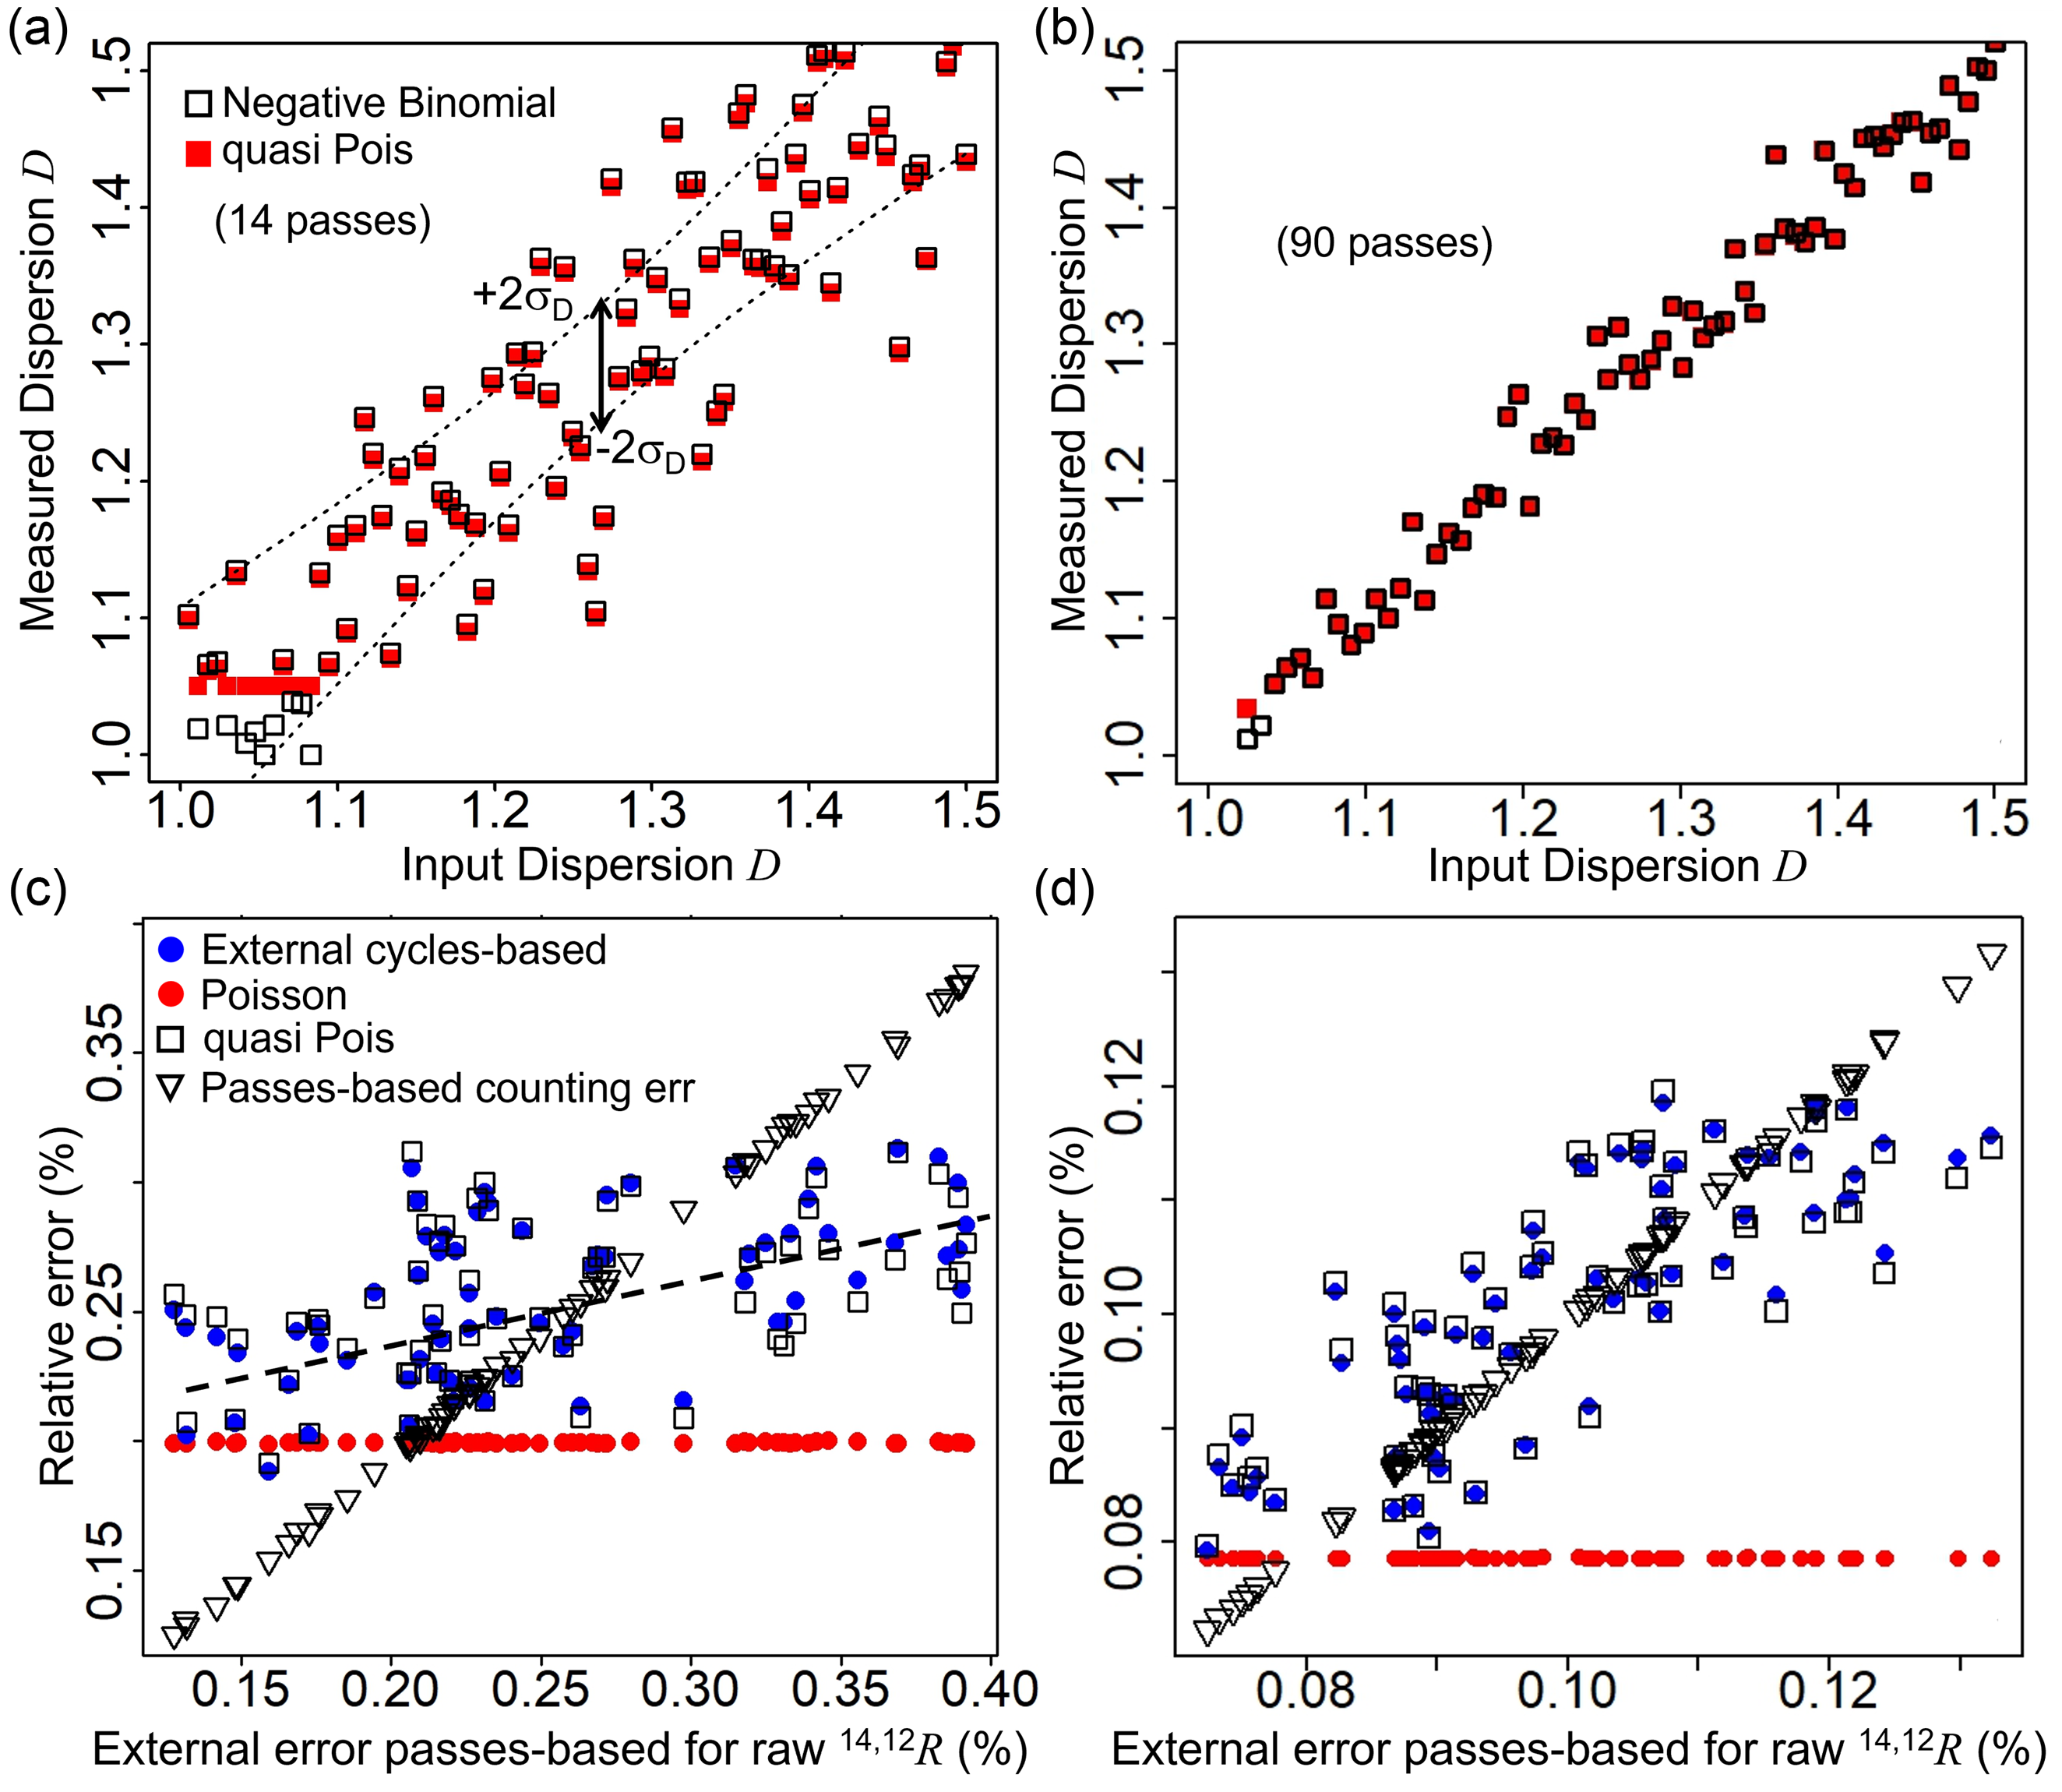
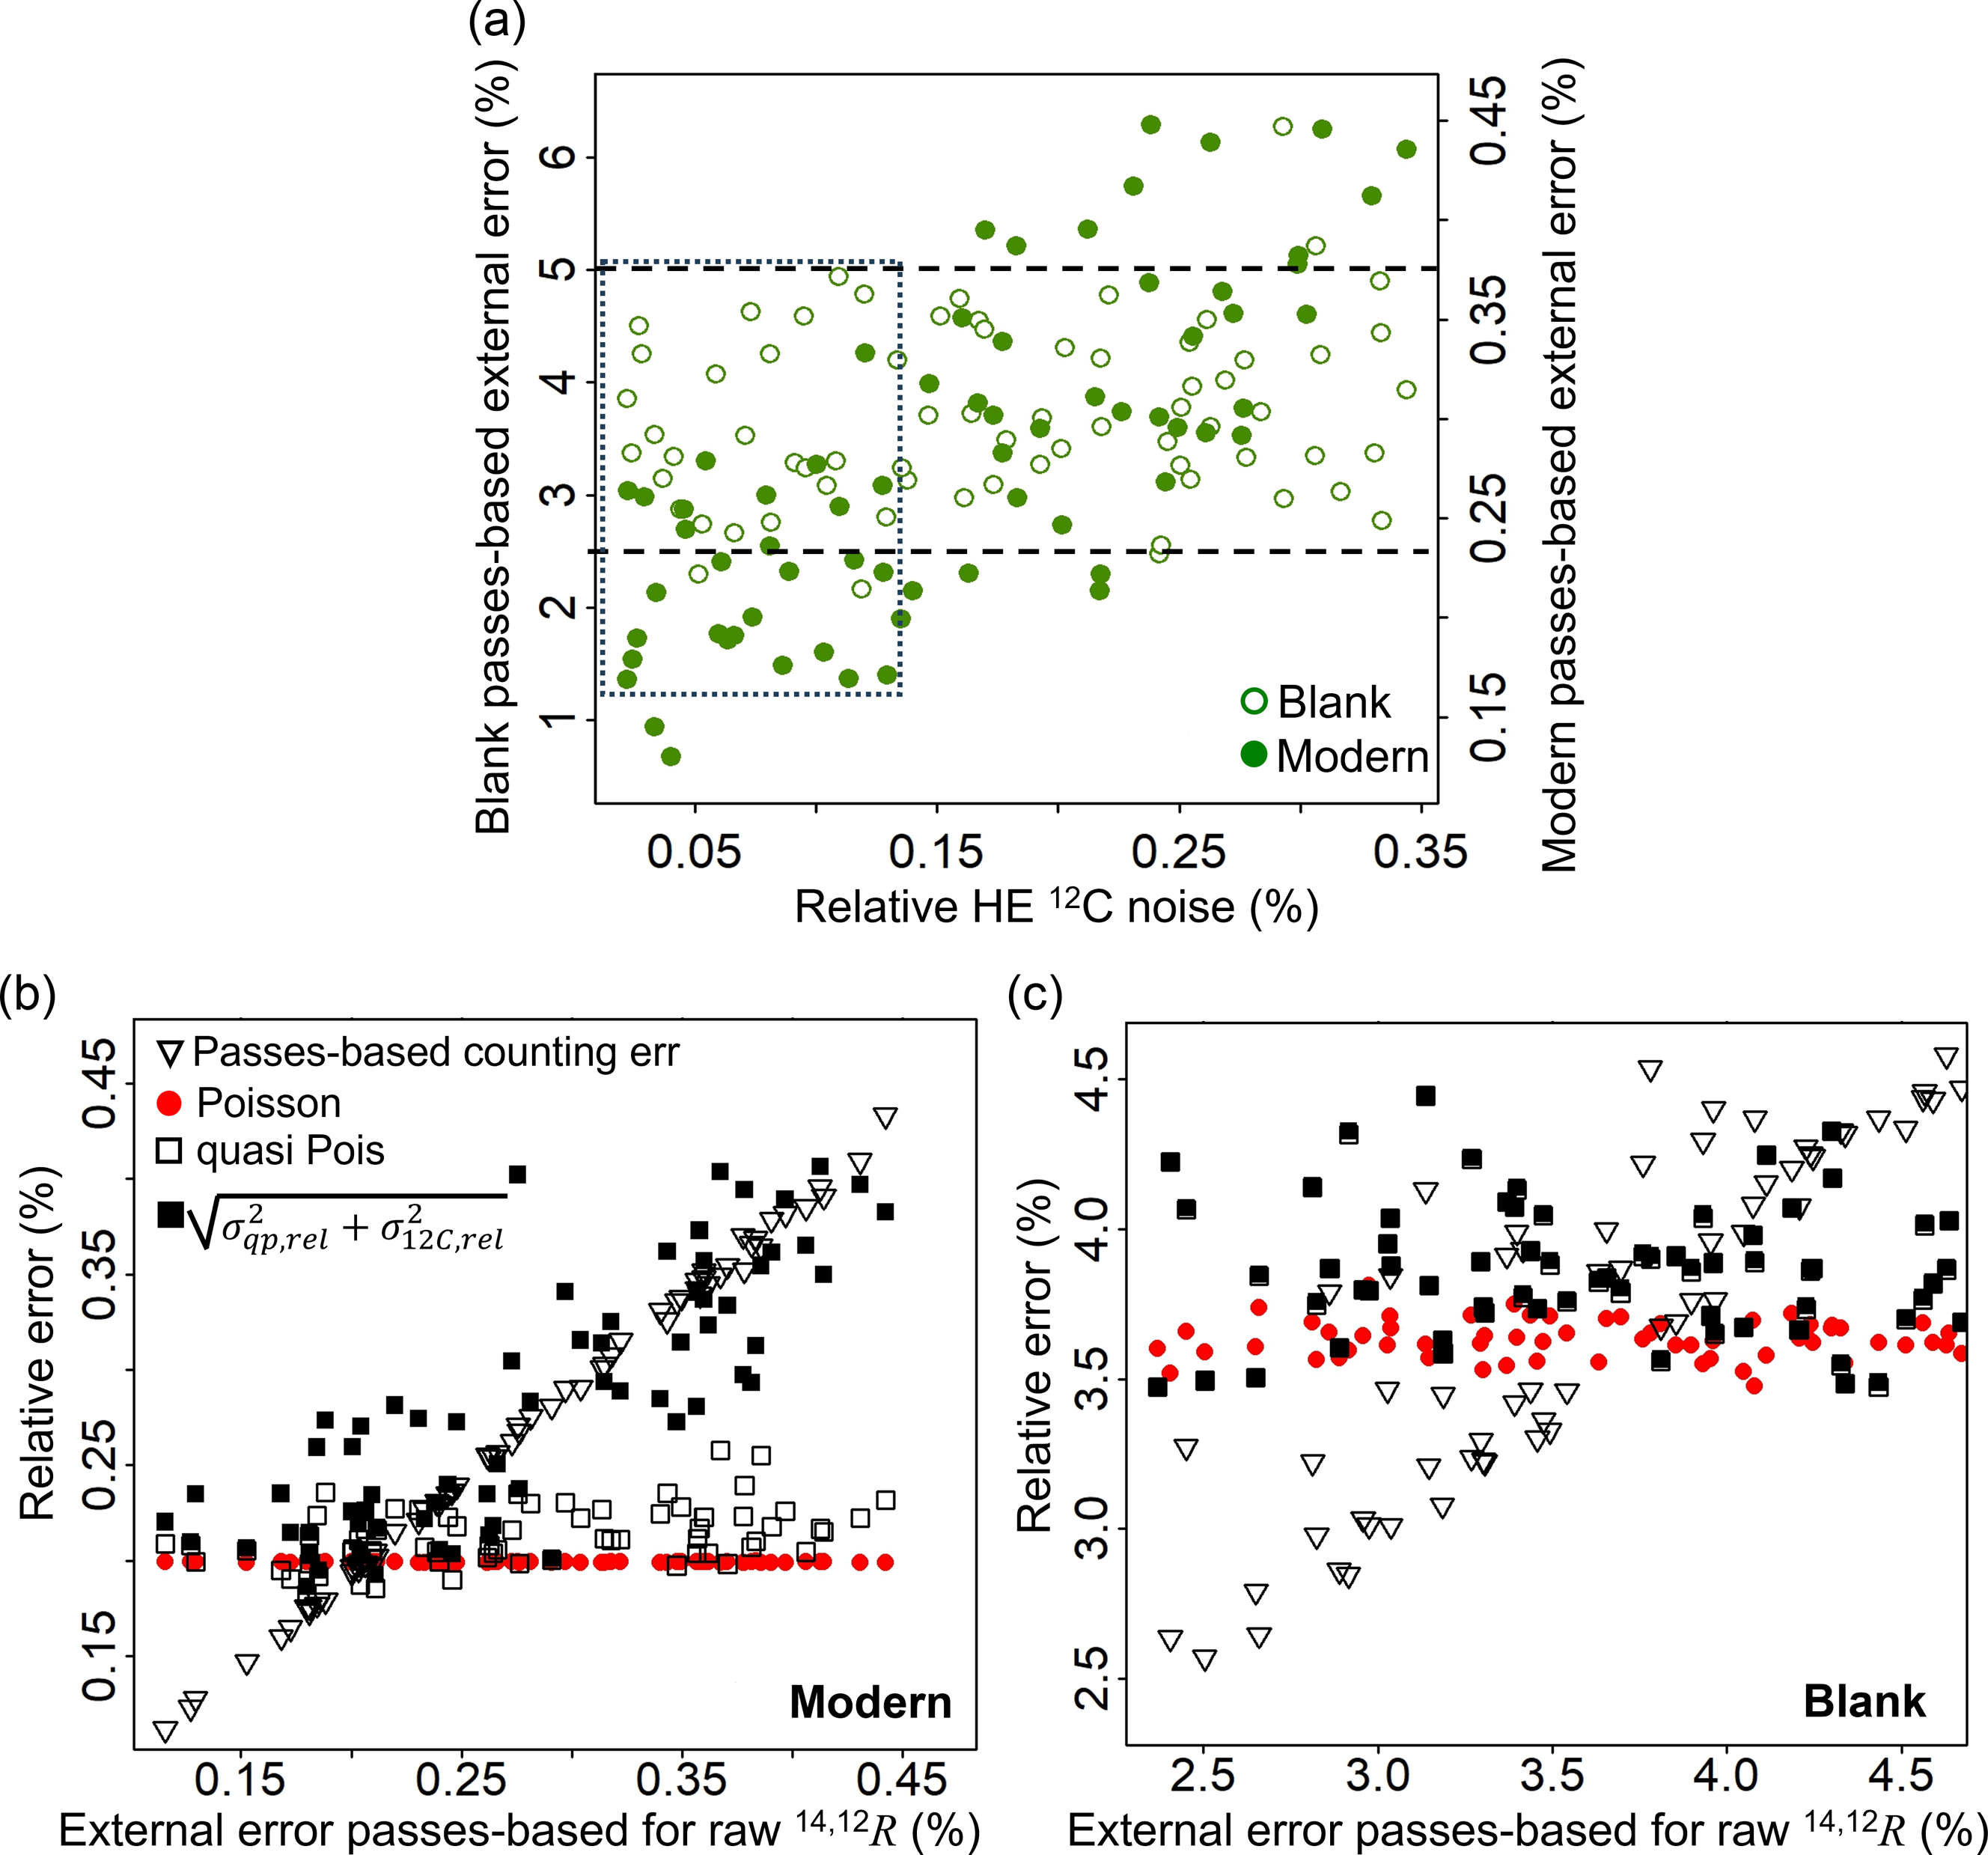
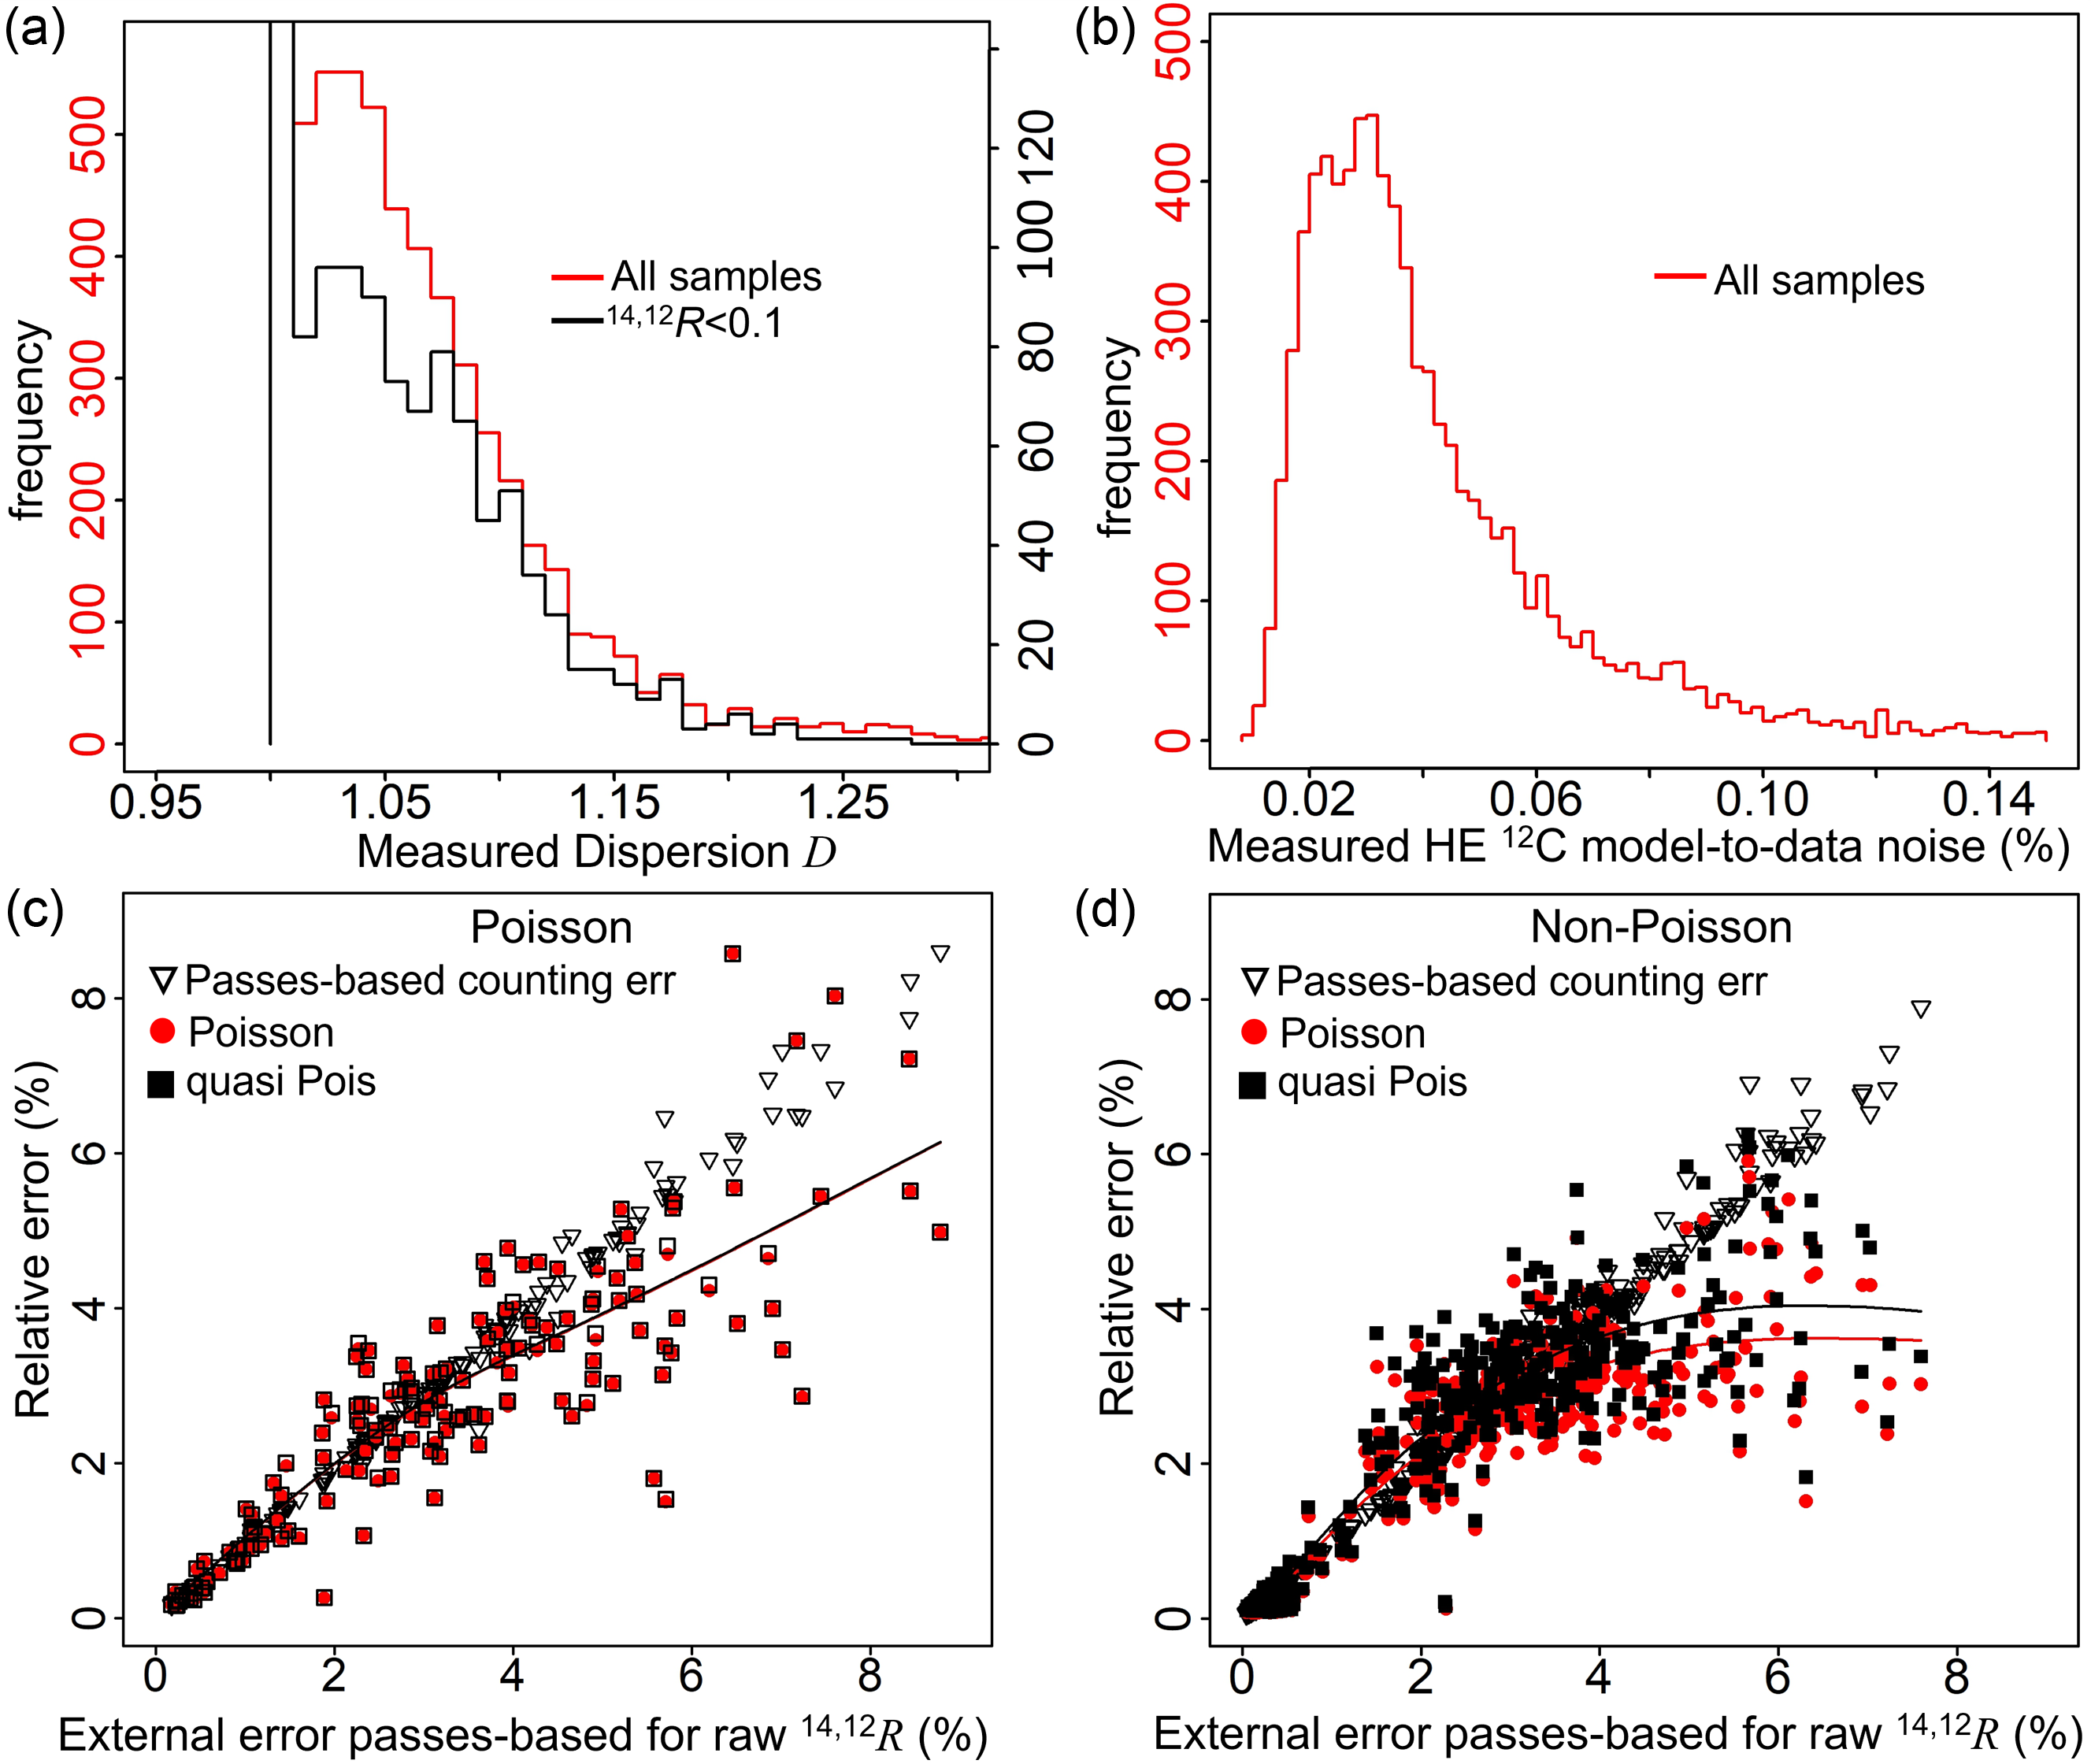
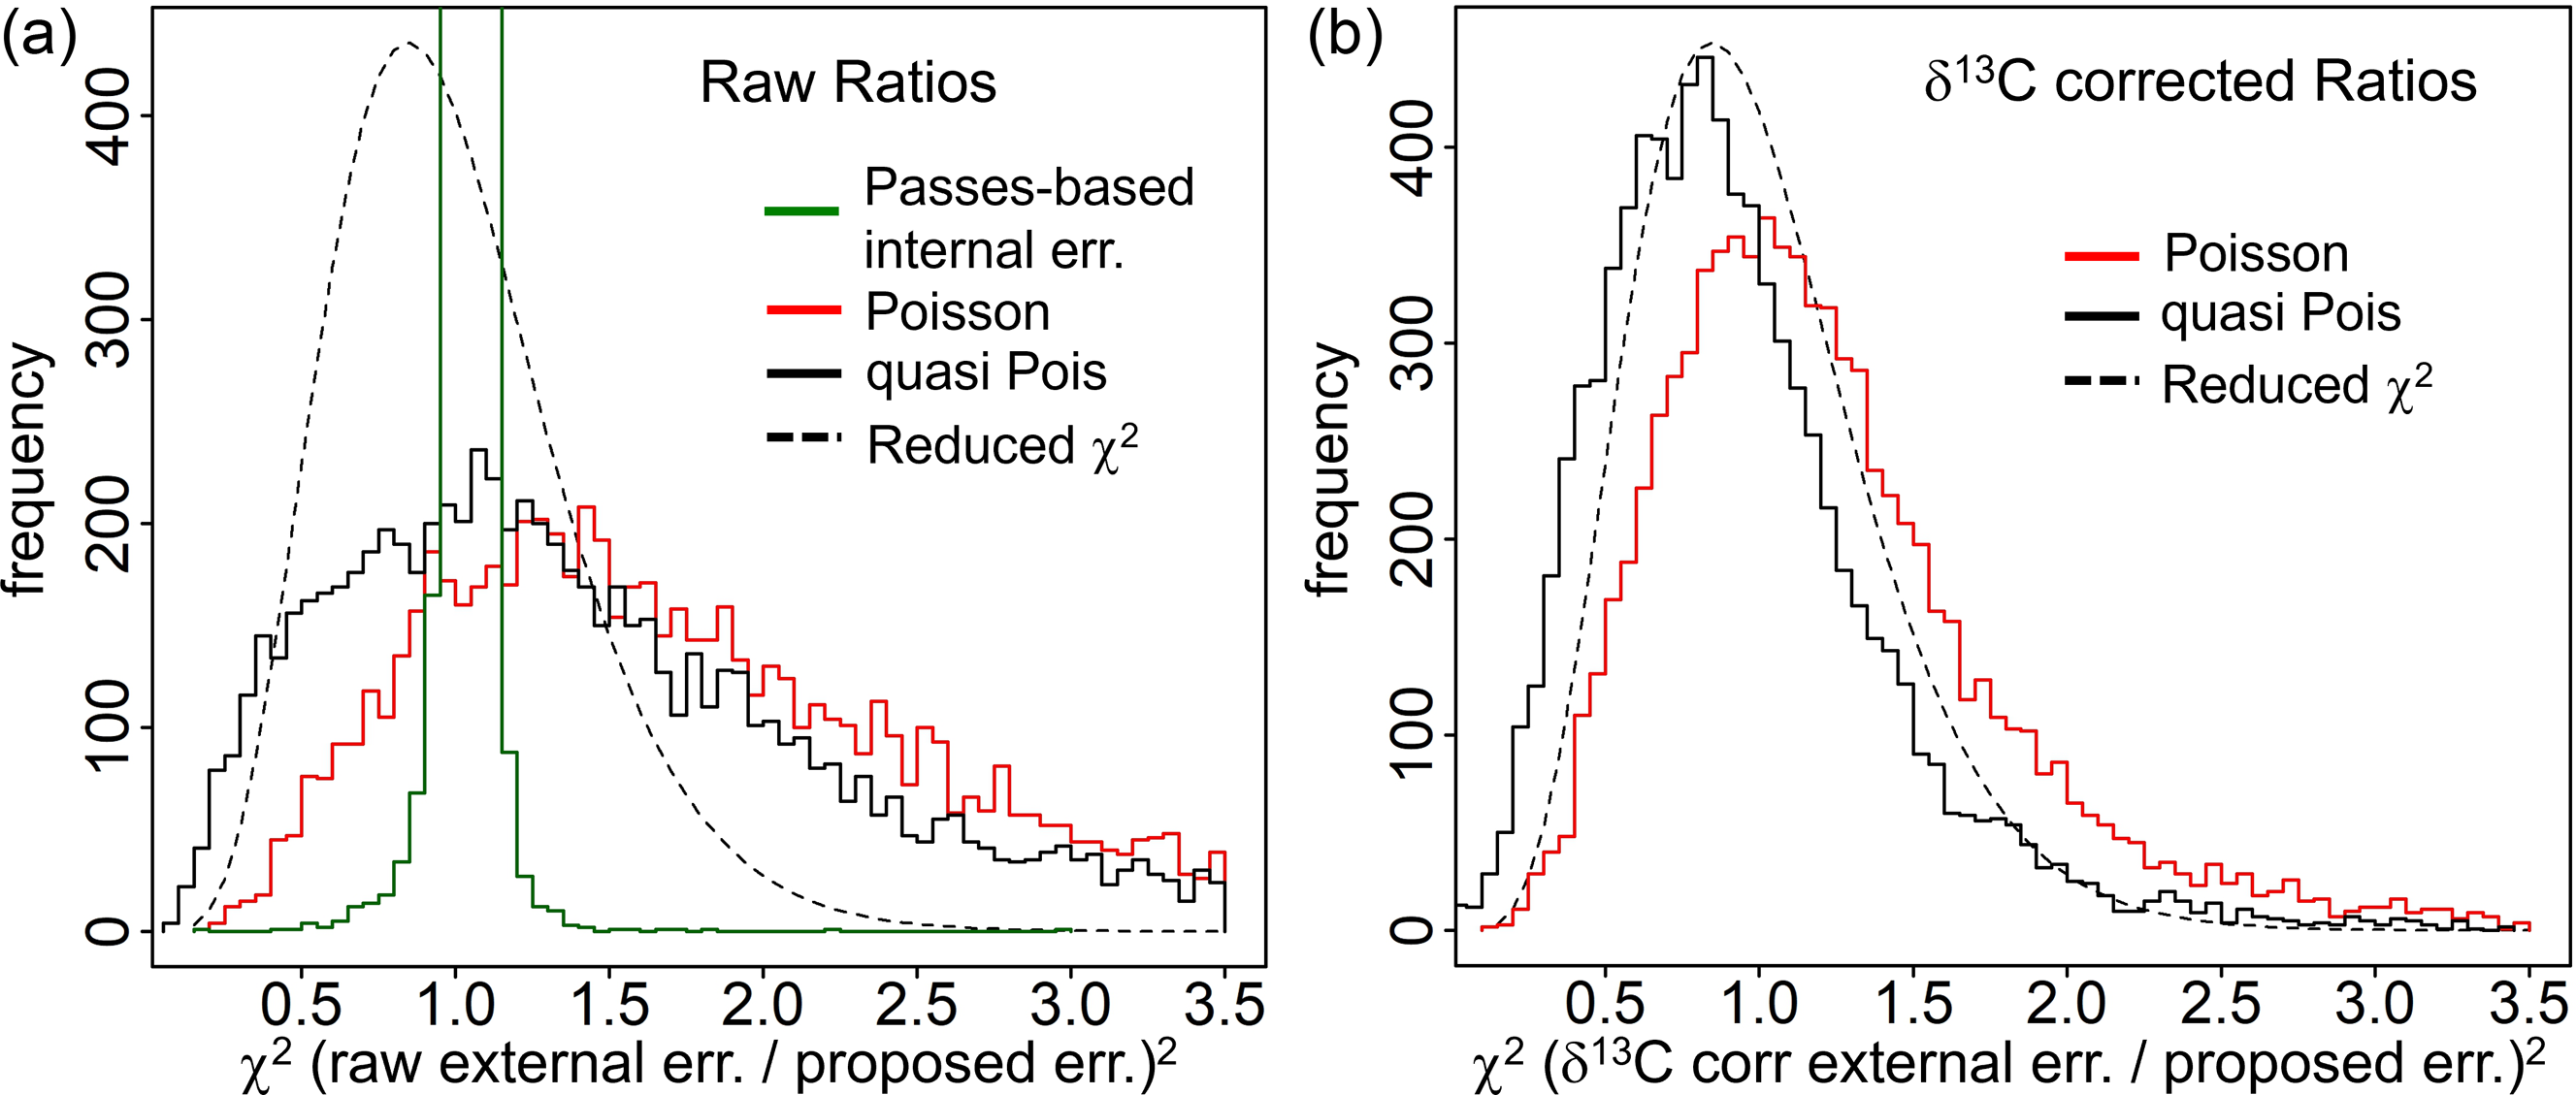
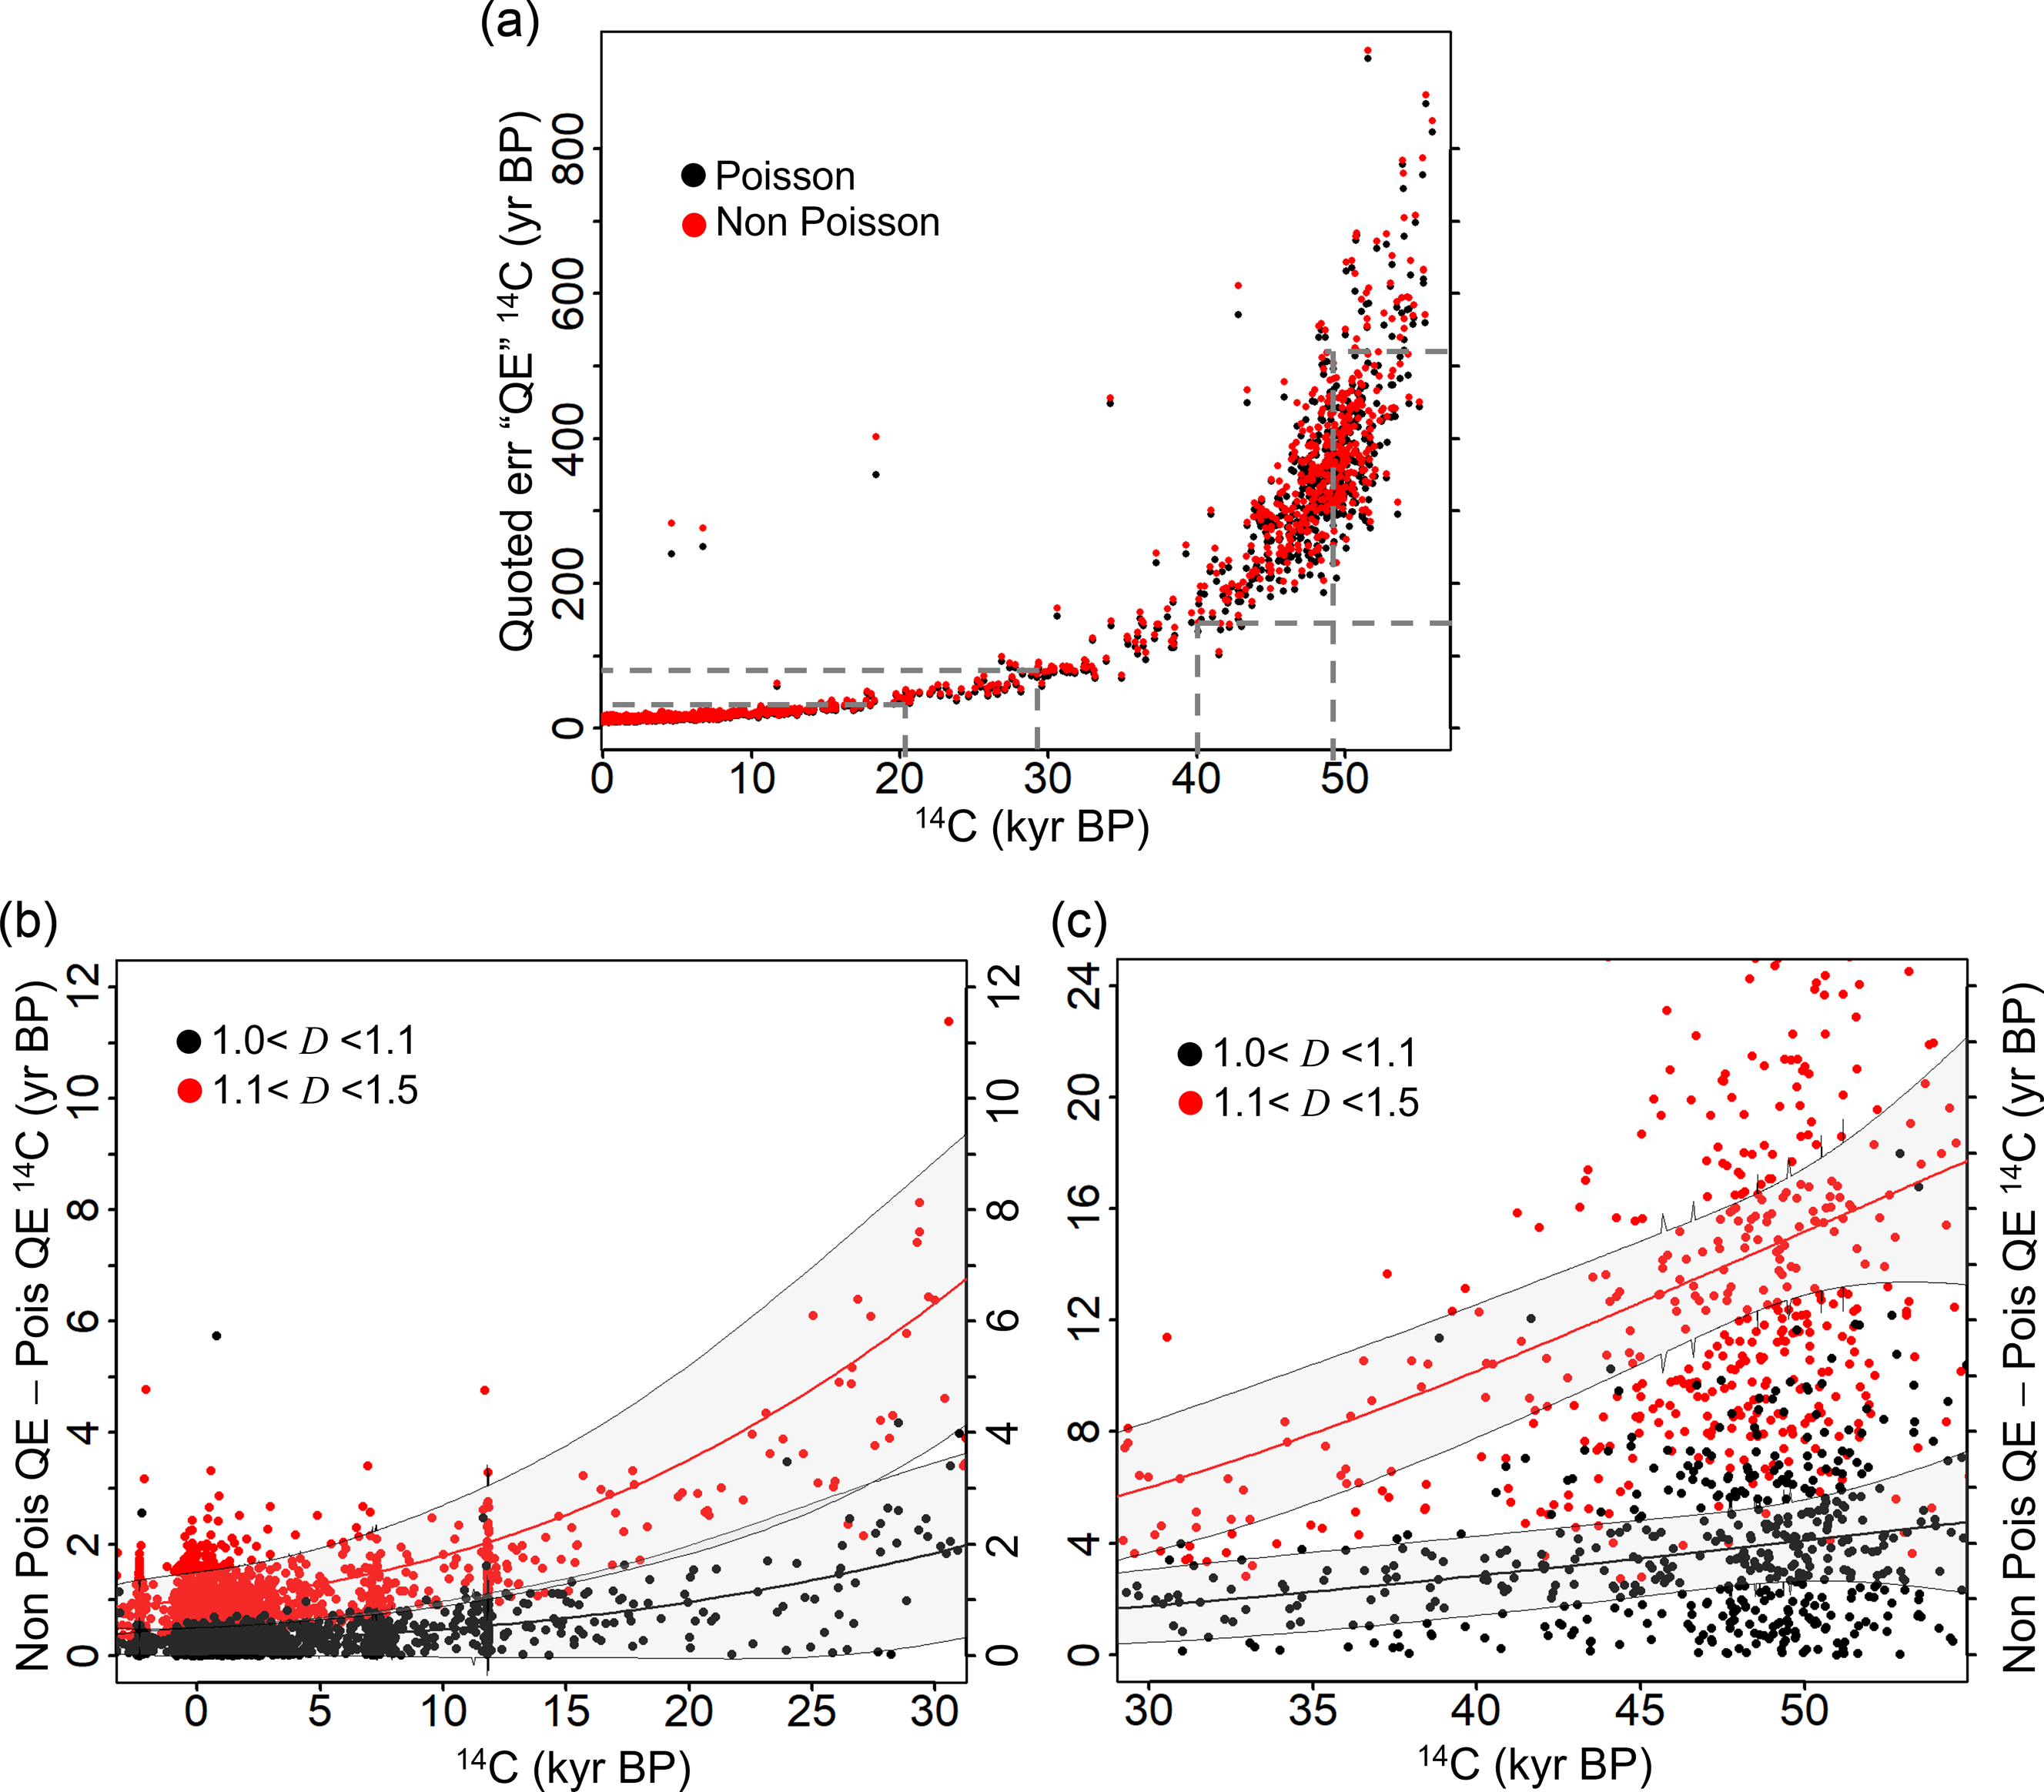


 Open access