

INTRODUCTION
Black gram is one of the most important highly priced pulse crops grown in a large scale in India and its subcontinents. It enhances soil fertility by fixing atmospheric nitrogen, carbon sequestration and soil amelioration. Among different pulse crops, black gram occupies first position in Assam in terms of area (37,412 ha) which covers about 32.5% of total pulse area. But, the production potential is much below the national level due to selection of marginal lands for its cultivation. As majority of black gram cultivation is done during Rabi or late Rabi season, therefore, the insufficient irrigation facility with erratic rainfall pattern leads to water deficit stress at various stages of crop growth (Belayet et al., Reference Belayet, Rahman, Rahman, Noorul Anwar and Hossen2010).
Drought disturbs normal turgor pressure in cells altering the physiological and biochemical processes, disrupting cell membrane and ultrastructure of subcellular organelles (Yordanov et al., Reference Yordanov, Velikova and Tsonev2003). RLWC is a measure to express the amount of water present in leaf tissues (Sampathkumar et al., Reference Sampathkumar, Pandian, Jeyakumar and Manickasundaram2014). Maintenance of high RLWC is always associated with drought resistance and considered as a valuable indicator of plant water status as compared to other water potential parameters (Keles and Oncel, Reference Keles and Oncel2004). Severe drought leads to excessive production of reactive oxygen species (ROS) such as superoxide (O2 · − ), hydrogen peroxide (H2O2), hydroxyl radicals ( · OH) and singlet oxygen (1O2) which are responsible for peroxidation of membrane lipids, bleaching of photosynthetic pigments, protein denaturation and DNA mutation (Mohammadi et al., Reference Mohammadi, Habibi, Rohami and Mafakheri2011). Among these, H2O2 produced in the chloroplast is especially toxic because it can inhibit the Calvin-cycle enzymes even at low concentrations thereby reducing the photosynthetic carbon assimilation (Abu-Muriefah et al., Reference Abu-Muriefah, Ibrahim and Elgaaly2014). Therefore, removal of this toxic compound through the activation of anti-oxidant defense system is very important for plants to alleviate the adverse effects of drought. Under water deficit condition, higher H2O2 scavenging capacity reflects better tolerance capacity of plants to drought. Lipid peroxidation in the cell membranes is considered as one of the most challenging and detrimental effect of osmotic stress (Thankamani et al., Reference Thankamani, Chempakam and Ashokan2003). The degree of lipid peroxidation is measured in terms of MDA (malondialdehyde) content which is the break down product of lipid peroxidation in cellular membranes and can be used as an important index to examine the incident of oxidative membrane damage (Ozkur et al., Reference Ozkur, Ozdemir, Bor and Turkan2009).
Plants produce a complex anti-oxidant defense system in a regular fashion to protect cellular components from the damaging effect of ROS. This system includes antioxidant enzymes- SOD, glutathione reductase (GR), CAT and peroxidase, and low-molecular antioxidants such as ascorbic acid, glutathione, α-tocopherol, flavonoids and carotenoids (Sgherri et al., Reference Sgherri, Stevanovic and Navari-Izzo2000). Hence, enhanced activity of antioxidant enzymes are often observed in plants under stress condition (Khan and Naqvi Reference Khan and Naqvi2010). O2 − can be dismutated into H2O2 by SOD (the first defense against ROS) in the chloroplast, mitochondrion, cytoplasm and peroxisome. CAT, APX, POD are the enzymatic anti-oxidants that catalyse the conversion of H2O2 to water and O2 and thus help in ameliorating the detrimental effects of oxidative stress (Abedi and Pakniyat, Reference Abedi and Pakniyat2010).
The selection of suitable plant characters within a short time at critical crop growth stages emerges as a major challenge to the plant breeders in drought-prone areas (Talebi et al., Reference Talebi, Ensafi, Baghebani, Karami and Mohammadi2013). A better understanding of genotypic variability to water stress can aid in identifying drought tolerant genotypes to maintain better yield under climate change. Performance of crop plants under drought has been extensively studied. But in spite of being a high value crop of Indian agriculture, black gram has gain very little attention regarding its response pattern towards drought. A number of literatures are available on how the concentration of H2O2 changes under water deficit condition but, to our knowledge, no information is available on changes in H2O2 scavenging activity/capacity of pulse crops in response to soil water deficit. The major objectives of this investigation was, therefore, to understand the responses of four commonly grown black gram genotypes in terms of leaf water balance, carotenoid and TSP content, degree of lipid peroxidation in terms of MDA content, H2O2 scavenging capacity, antioxidant enzyme activity (SOD and CAT) and finally seed yield under osmotic stress applied at different growth stages. Further, we tried to identify the most vulnerable growth stage to drought and the marker traits that can be useful for selection of drought tolerant genotypes of black gram.
MATERIALS AND METHODS
Experimental site
The experiment was conducted during March–Jun, 2013 at the experimental field of Tezpur University campus located at north bank plain zone of Assam (26°14′ N and 92°50′ E) at Tezpur, India. The maximum and minimum average temperature recorded was 32 °C and 20 °C respectively. Average rainfall recorded was 195 mm with a relative humidity of 79.45%. The experimental site is characterized by silt loam textured soil being slightly acidic in nature (pH 5.85).
Plant material and experimental design
Four popular black gram (Vigna mungo L.) genotypes of Assam- T9, PU 19, USJD 113 and KU 301 were used as test materials and were collected from Regional Agricultural Research Station (RARS), Shillongoni, Nagaon (Assam), India.
The site was ploughed with the help of a tractor. Fertilizers were applied @ 15:35:10 kg NPK ha−1 according to the package of practice of Assam Agricultural University. A temporary rain shed (42×32 m) was constructed in the field with PVC (polyvinyl chloride) film (of about 0.15 mm thickness and 85% of transmittance) to avoid rainfall. In control plants, soil water potential (ΨS) of −0.15 to −0.20 bar was maintained with irrigation throughout the growing season while in the treated plots −0.70 to −0.75 bar of the same was recorded after withholding of irrigation for 15 consecutive days.
The experiment was conducted in factorial randomized block design with three replications under stress and non-stress conditions. Seeds were sown in the field on 5th of March, 2013 maintaining the requisite gap of 10 and 30 cm between plants and rows respectively. Control plants were grown with proper irrigation throughout the growing period.
Drought treatments for all the genotypes were arranged as follows:
-
T1– withdrawal of irrigation for 15 days at vegetative stage (25 days after sowing)
-
T 2– withdrawal of irrigation for 15 days at flowering stage (35 days after sowing)
-
T 3 – withdrawal of irrigation for 15 days at pod filling stage (45 days after sowing)
Soil analysis
Soil samples were collected from the experimental field, processed and analysed for various physico-chemical parameters (e.g. bulk density, soil pH, water holding capacity, soil available nitrogen and organic matter content). Soil tensiometers were used to record soil water potential. Gravimetric method was also employed to over check the moisture content of soil at weekly interval throughout the crop growing period.
Plant analysis
Fully expanded youngest leaves (from three plants of each treatment including control) were sampled at 15 days interval to assess RLWC, carotenoid, TSP, MDA, antioxidant enzyme activity and H2O2 scavenging capacity of stressed plants with respect to their relative controls.
RLWC in leaves was estimated according to Lin and Ehleringer (Reference Lin and Ehleringer1982). Fresh weight of leaf samples were taken and were allowed to float in distilled water in a petri dish for 12 h. After 12 h, turgid weight was recorded and finally the leaves were dried at 70 ºC for 48 h. Dry weight of leaf samples were noted and RLWC was calculated by the following formula
 $$\begin{equation*}
{\rm{RLWC}} = \left[ {\left( {{\rm{fresh}}\;{\rm{mass}} - {\rm{dry}}\;{\rm{mass}}} \right)/\left( {{\rm{turgid}}\;{\rm{mass}}\; - {\rm{dry}}\;{\rm{mass}}} \right)} \right] \times 100.
\end{equation*}$$
$$\begin{equation*}
{\rm{RLWC}} = \left[ {\left( {{\rm{fresh}}\;{\rm{mass}} - {\rm{dry}}\;{\rm{mass}}} \right)/\left( {{\rm{turgid}}\;{\rm{mass}}\; - {\rm{dry}}\;{\rm{mass}}} \right)} \right] \times 100.
\end{equation*}$$
Carotenoid content in leaves was determined by homogenizing 200 mg of fresh leaves collected from top of the canopy with 10 ml of 80% acetone and centrifuged at 1238 g for 10 min. The supernatant was kept aside and the residue was again extracted with 5ml of 80% acetone and centrifuged. A final volume 50 ml was made with 80% acetone. The optical density of the supernatant was measured at 645, 663 and 480 nm in ultra-spec double beam spectrophotometer (UV-1700 series, Pharma Spec, Japan). Carotenoid content was calculated using the formula given by Kirk and Allen (Reference Kirk and Allen1965) and were expressed as mg g−1 fresh weight.
 $$\begin{equation*}
{\rm{Carotenoid}} = {A_{480}} + 114\left( {{A_{663}}} \right) - 638\left( {{A_{645}}} \right) \times V/\left( {1000 \times W} \right),
\end{equation*}$$
$$\begin{equation*}
{\rm{Carotenoid}} = {A_{480}} + 114\left( {{A_{663}}} \right) - 638\left( {{A_{645}}} \right) \times V/\left( {1000 \times W} \right),
\end{equation*}$$
where, A480= Absorbance of the extract at 480 nm; A645 = Absorbance of the extract at 645 nm; A663 = Absorbance of the extract at 663 nm; V = Volume of the sample; W= Fresh weight of the tissue.
TSP was estimated by the method of Lowry et al. (Reference Lowry, Rosebrough, Farr and Randall1951) using bovine serum albumin (BSA) as a standard. 500 mg of fresh leaves were homogenized in 0.1M of phosphate buffer (pH 7.5). The extract was centrifuged at 10,000 g for 20 min at 4 °C and supernatant obtained was used for protein determination and enzyme assay.
SOD activity was assayed by recording its ability to inhibit the photochemical reduction of nitroblue tetrazolium (NBT) as described by Dhindsa et al. (Reference Dhindsa, Dhindsa and Thorpe1981). 3 ml of reaction mixture was prepared by mixing 0.1 ml of 1.5 M Na2CO3, 0.2 ml of 200 mM methionine, 0.1 ml of 3mM EDTA, 0.1 ml of 2.25 mM NBT, 1.5 ml of 100 mM potassium phosphate buffer (pH 7.5), 1 ml of distilled water and 0.05 ml of enzyme samples. The tube without enzyme was taken as control. Reaction was started by adding 0.1 ml 60 μM riboflavin and placing the tubes below a light source of two 15 W fluorescent lamps for 15 min. The reaction was stopped by switching of the light and covering the tubes with black cloth. Absorbance was recorded in ultra-spec double beam spectrophotometer at 560 nm. SOD activity of the extract was expressed as U min−1 mg−1 protein.
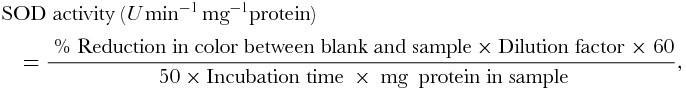 $$\begin{eqnarray*}
&&{\rm{SOD}}\;{\rm{activity}}\;(U\,{{\rm min} ^{ - 1}}\,{\rm{m}}{{\rm{g}}^{ - 1}}{\rm{protein}}) \\
&&\quad= \frac{{{\rm{\ \% }}\;{\rm{Reduction}}\;{\rm{in}}\;{\rm{color}}\;{\rm{between}}\;{\rm{blank}}\;{\rm{and}}\;{\rm{sample \times Dilution}}\;{\rm{factor}}\;{\rm{ \times }}\;{\rm{60}}}}{{{\rm{\ 50 \times Incubation}}\;{\rm{time\ \times \ mg\ }}\;{\rm{protein}}\;{\rm{in}}\;{\rm{sample}}}},
\end{eqnarray*}$$
$$\begin{eqnarray*}
&&{\rm{SOD}}\;{\rm{activity}}\;(U\,{{\rm min} ^{ - 1}}\,{\rm{m}}{{\rm{g}}^{ - 1}}{\rm{protein}}) \\
&&\quad= \frac{{{\rm{\ \% }}\;{\rm{Reduction}}\;{\rm{in}}\;{\rm{color}}\;{\rm{between}}\;{\rm{blank}}\;{\rm{and}}\;{\rm{sample \times Dilution}}\;{\rm{factor}}\;{\rm{ \times }}\;{\rm{60}}}}{{{\rm{\ 50 \times Incubation}}\;{\rm{time\ \times \ mg\ }}\;{\rm{protein}}\;{\rm{in}}\;{\rm{sample}}}},
\end{eqnarray*}$$
where, Dilution Factor = Biomass taken (in mg)/ Volume of extraction buffer, 50% reduction in colour was considered as one unit of enzyme activity expressed in enzyme U mg−1 protein min−1.
CAT was assayed as per the method of Aebi (Reference Aebi1984). The disappearance of H2O2 was monitored at 240 nm (ε = 40mM−1 cm−1) in the reaction mixture consisting of 50 mM K-phosphate buffer (pH 7.0), 33mM H2O2 and enzyme extract. The activity of CAT was expressed as μ mole H2O2 scavenged min−1 mg−1 protein.
MDA content was estimated following the method given by Heath and Packer (Reference Heath and Packer1968) and Dhindsa et al. (Reference Dhindsa, Dhindsa and Thorpe1981) with some modifications. For this, 1 ml of extracted enzyme solution was added to 2 ml of a reaction solution containing 20% (v/v) trichloroacetic acid (TCA) and 0.5% (v/v) thiobarbituric acid (TBA). The solution was placed in a water bath at 95 °C for 30 min and then transferred to an ice water bath. It was then centrifuged at 10,000g for 10 min and absorbance of the supernatant was read at 532 and 600 nm using ultra-spec double beam spectrophotometer. Nonspecific absorbance at 600 nm was subtracted from that at 532 nm, and MDA content was calculated using this adjusted absorbance and the extinction coefficient of 155 mM–1cm–1 and was expressed as μ mol g−1 fresh weight.
Hydrogen peroxide scavenging activity of leaf extracts was determined by the method of Ruch et al. (Reference Ruch, Cheng and Klaunig1989) with slight modification. For this, 1 ml of the extract prepared for enzyme estimation was dissolved in 3.4 ml of 0.1M phosphate buffer (pH 7.4) and mixed with 0.6 ml of 40 mM H2O2 solution. Absorbance of the reaction mixture at 230 nm was determined 10 minutes after H2O2 addition against a blank solution containing the phosphate buffer without H2O2 that was replaced by equivolume of buffer. The percentage of hydrogen peroxide scavenging were calculated as
 $$\begin{equation*}
\% \;{\rm{Scavenged}}\;\left[ {{H_2}{O_2}} \right] = \left[ {\left( {{A_0} - {A_1}} \right)/{A_0}} \right] \times 100,
\end{equation*}$$
$$\begin{equation*}
\% \;{\rm{Scavenged}}\;\left[ {{H_2}{O_2}} \right] = \left[ {\left( {{A_0} - {A_1}} \right)/{A_0}} \right] \times 100,
\end{equation*}$$
where, A0 was the absorbance of the control (without sample extract) and A1 was the absorbance in presence of the sample extract.
On maturity, harvesting was done from an area of 1m2 of each replication; weighed and seed yield for each genotype at different treatments including the control was recorded. DTI was used as a measure of tolerance capacity to drought in terms of minimization of reduction in yield caused by water stress in comparison to control condition and was calculated as
DTI = (Yielddrought × Yieldcontrol)/ Mean yield of all genotypes under control condition (Baroowa et al., Reference Baroowa, Gogoi, Paul and Sarma2012).
Statistical analysis
Results were analysed by analysis of variance (ANOVA) and LSD values were calculated for genotypes, treatments and the interaction between genotypes and treatments. Mean values were taken from the measurements of three replicates and standard error (SE) of the means was calculated. Duncan's multiple range tests (DMRT) was performed at p ≤ 0.05. All the statistical analyses were done using the Statistical Package for Social Sciences (SPSS) for Windows (version 16.0).
RESULTS
Relative leaf water content (RLWC)
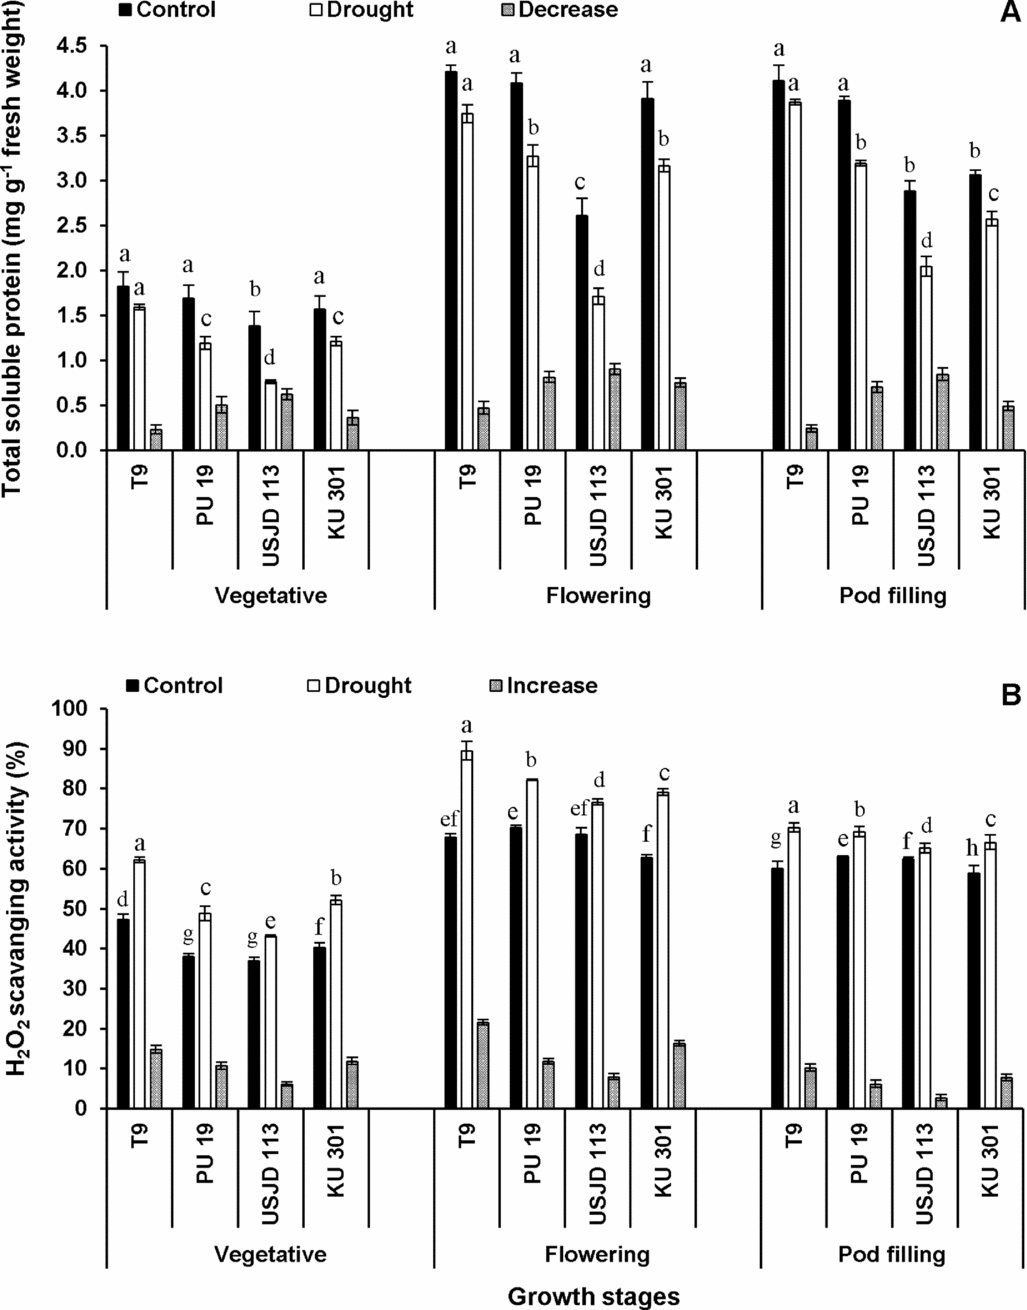
RLWC values of black gram genotypes grown under control and stress conditions are presented in Figure 1A. Application of drought significantly decreased (p ≤ 0.01) RLWC in stressed plants as compared to their respective control. This drought-induced reduction in RLWC was highest in those plants exposed to water stress during flowering stage (T2). A considerable difference among the genotypes was also observed for RLWC. Genotype T9 maintained higher RLWC at all the growth stages. In contrast, lowest value of RLWC was recorded in treated plants of USJD 113.
Drought induced changes in relative leaf water (A) and carotenoid (B) content of black gram (mean ± SE, values followed by different letters indicate significant differences among the genotypes within a stage of crop growth period at p ≤ 0.05).

Carotenoid
Carotenoid content of black gram leaves was highly influenced by water stress at all the growth stages. Withdrawal of irrigation for 15 consecutive days resulted in significant reduction (p ≤ 0.01) in carotenoid and it was more pronounced in the plants suffered from osmotic stress during flowering stage (Figure 1B). The rate of decline in this photosynthetic pigment varied with genotypes and highest reduction was observed in USJD 113 (54.95–66.67%). Better maintenance of carotenoid was noted in T9 followed by KU 301 and PU 19 irrespective of treatments.
Total soluble protein (TSP)
Under well-watered condition, the values of TSP were significantly higher (p ≤ 0.05) than the plants suffered from scarcity of water (Figure 2A). Drought-induced reduction in TSP occurred to a greater extent in treatment T2 (drought applied at flowering stage). Irrespective of growth stages, genotype T9 experienced lowest reduction of TSP (5.84–12.64%) followed by KU 301 (16.01–22.93%), PU 19 (17.99–29.59%) and USJD 113 (29.17–44.93%).
Drought induced changes in total soluble protein content (A) and hydrogen peroxide scavenging activity (B) of black gram (mean ± SE, values followed by different letters indicate significant differences among the genotypes within a stage of crop growth period at p ≤ 0.05).
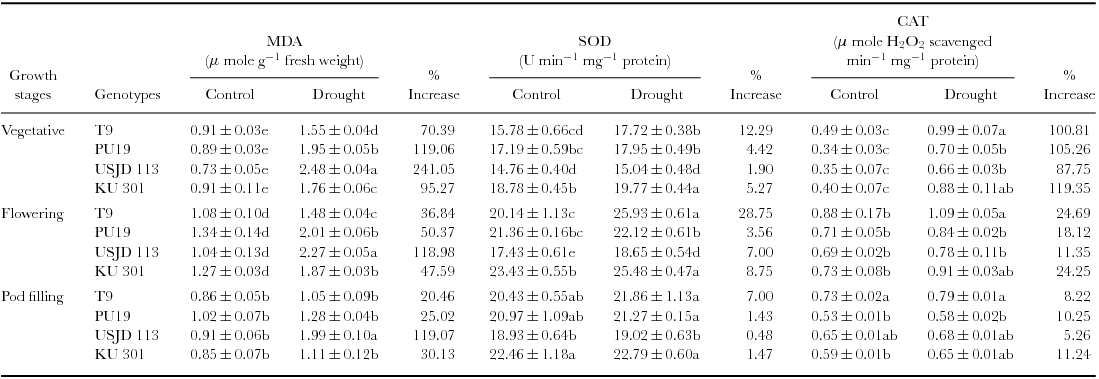
Membrane lipid peroxidation (MDA)
We noted a significantly higher (p ≤ 0.01) accumulation of MDA under water deficit stress in the studied genotypes which indicate higher degree of MDA (Table 1). Highest increment of MDA was observed in genotype USJD 113 (118.98–241.05%) in all the treatments. In contrast, T9 recorded lower increment of MDA (20.46–70.39%) after imposition of stress. Under water limited condition, highest increment in MDA were observed in T1 plants (stressed during vegetative stage) and it was in the order T1 >T2 >T3.
Effect of osmotic stress on membrane lipid peroxidation (MDA), super oxide dismutase (SOD) and catalase (CAT) activity of black gram (mean ± SE, values followed by different letters indicate significant differences among the genotypes within a stage of crop growth period at p ≤ 0.05).
H2O2 scavenging activity
A sharp increase in H2O2 scavenging activity was observed in plants experiencing drought for 15 consecutive days (Figure 2B). This enhancement was more pronounced at flowering stage followed by vegetative and pod filling stages. In all the treatments, genotype T9 showed highest capacity to scavenge H2O2 (16.97–31.67%). The increment in H2O2 scavenging activity followed the order of T9> KU 301> PU 19> USJD 113 in all the treatments.
Antioxidant enzyme activity
Stress applied at vegetative, flowering and pod filling stages activated the antioxidant system in all the genotypes. The activity of SOD and CAT increased considerably under stress condition as compared to their respective control (Table 1). Highest enhancement in the activity of SOD was noted in T2 plants (stressed at flowering stage) while, T1 plants (stressed at vegetative stage) of all the genotypes exhibited the highest increase of CAT activity. Under drought, highest enhancement of CAT activity was noted in genotype KU 301 (11.24–119.35%) while lowest of the same was recorded in USJD 113 (5.26–87.75%). On the other hand, enhancement of SOD activity was most prominent in genotype T9 followed by KU 301, PU 19 and USJD 113.
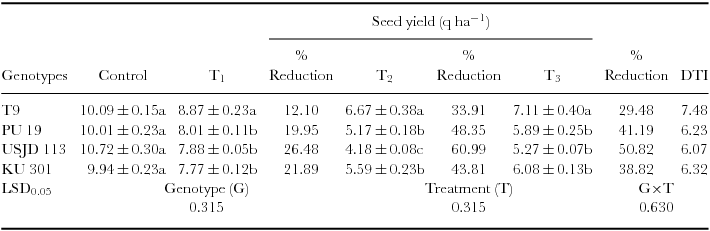
Seed yield
Imposition of drought had a significant (p ≤ 0.01) negative impact on seed yield of black gram regardless of growth stages (Table 2). The yields of all the genotypes in non-stress environment clearly out yielded in the stress environment. Plants subjected to drought at flowering stage (T2) produced lowest seed yield in comparison to the plants subjected to drought at vegetative and pod filling stages (Table 3). The reduction of yield was highest in USJD 113 (26.48–60.99%) and was lowest in T9 (12.10–33.91%). Genotype T9 also gave highest value of (DTI) than rest of the genotypes and it followed the order of T9> KU 301> PU 19> USJD 113.
DISCUSSION
This study was carried out to evaluate the mechanism of drought tolerance in four commonly grown black gram genotypes of Assam (India). All the genotypes showed differential response pattern to soil moisture deficit which was observed by the changes in RLWC, carotenoid, TSP, MDA, H2O2 scavenging capacity and the activity of antioxidant enzymes- SOD and CAT.
Deficiency in soil moisture significantly affected the water balance of black gram plants. Plants experiencing drought recorded considerably lower values of RLWC with respect to their control (Figure 1A). Being a measure of plant water status, RLWC reflects the metabolic activities in tissues. Maintenance of RLWC helps in sustaining photosynthetic capacity of plants which ultimately leads to greater yield (Sinclair and Ludlow, Reference Sinclair and Ludlow1986). Therefore, it can be considered as the most meaningful index for identifying genotypes with complementary differences in dehydration tolerance. In an earlier study, Zlatev (Reference Zlatev2005) found that drought tolerant bean cultivars had greater capacity to maintain RLWC under water-limited condition. In our experiment, maintenance of higher RLWC by T9 resulted in lesser yield loss which proves its tolerance capacity to drought. On the other hand, USJD 113 showed its susceptibility as it recorded highest reduction in RLWC and consequently seed yield in all the treatments.
In the present study, the reduction in carotenoid content may be due to either slow synthesis or fast breakdown as suggested by Smirnoff (Reference Smirnoff1993). During drought, the excess generation of ROS results in oxidative stress that damages cellular membranes through peroxidation of lipids and causes degradation of many important components of cell including carotenoids (Monakhova and Chernyad'v, Reference Monakhova and Chernyad'v2002). The observed higher concentrations of MDA under stress condition in our experiment support this. Maintenance of higher level of carotenoids throughout the growing period had a positive impact on seed yield. Therefore, the recorded lowest reduction of carotenoid in T9 can be attributed to its tolerance capacity to drought.
Plants subjected to soil moisture deficiency exhibited significant reduction (p ≤ 0.05) of TSP in all the treatments (Figure 2A). Our results are in accordance with the findings of Abdel-Nasser and Abdel-Aal (Reference Abdel-Nasser and Abdel-Aal2002) working with sunflower seedlings. Drought-induced overproduction of ROS caused damage in cell membranes which disrupted protein structures leading to reduction in yield. ROS are responsible for protein denaturation or they may also affect the process of protein synthesis (Schwanz et al., Reference Schwanz, Picon, Vivin, Dreyer, Guehl and Polle1996). Fattahi Neisiani et al. (Reference Fattahi Neisiani, Modarres Sanavy, Ghanati and Dolatabadian2009) suggested that under moisture stress, the decomposition of protein is essential for production of amino acids to contribute osmotic adjustment by acting as osmoticum. Therefore, the reduction of TSP is often considered as an adaptive mechanism to overcome the adverse effects of drought.
Mean square and LSD values for relative leaf water content (RLWC), carotenoid, total soluble protein (TSP), MDA, H2O2 scavenging activity and SOD and CAT activity of black gram.
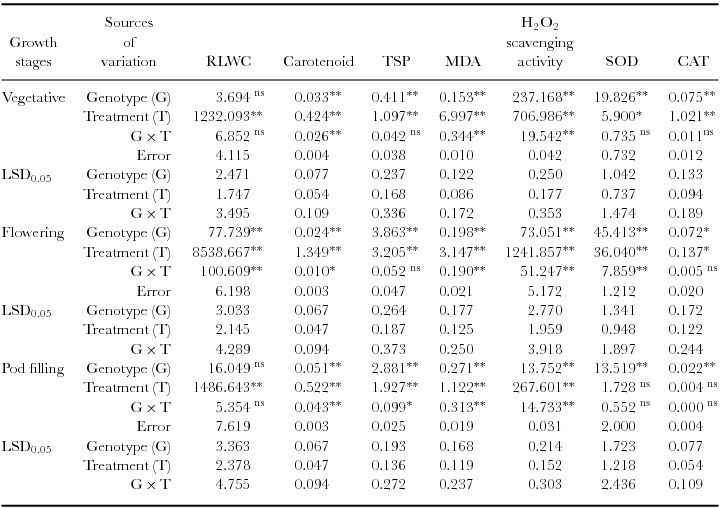
ns = non-significant.
* = significant at 0.05 probability level.
** = significant at 0.01 probability level.
Effect of osmotic stress on seed yield and DTI of black gram genotypes (mean ± SE, values followed by different letters indicate significant differences among the genotypes under same treatment at p ≤ 0.05).
Under osmotic stress, the MDA contents of all the genotypes increased significantly (Table 1) in comparison to the plants grown in well-watered environment. Higher accumulation of this product was previously recorded in many species like bread wheat and maize exhibiting osmotic stress (Fattahi Neisiani et al., Reference Fattahi Neisiani, Modarres Sanavy, Ghanati and Dolatabadian2009; Khan and Naqvi, Reference Khan and Naqvi2010). Like other environmental stresses, drought can bring about lipid peroxidation through the activation of toxic O2 molecules that can then attack fatty acids chains in thylakoid membrane. This results in enhanced formation of MDA with subsequent damage to membrane (Abu-Muriefah et al., Reference Abu-Muriefah, Ibrahim and Elgaaly2014). Pandey et al. (Reference Pandey, Baig, Chandra and Bhatt2010) suggested that genotypes which produce lower level of MDA under stress have better capacity for moisture stress tolerance. Hence, in our experiment, genotype T9 showed its tolerance capacity by recording lowest increment in MDA thereby preventing membrane damage. The increment in MDA was most prominent in the genotype USJD 113 which indicates higher degree of membrane damage triggered by osmotic stress.
Regardless of growth stage, hydrogen peroxide scavenging activity was found to increase significantly (p ≤ 0.01) when plants were subjected to drought for 15 consecutive days (Figure 2B). In plant cell, H2O2 is produced by univalent reduction of O2 .−. Excessive production of H2O2 under stress condition leads to the occurrence of oxidative stress due to its ability to inactivate anti-oxidant enzymes by oxidizing their thiol groups (Gill and Tuteja, Reference Gill and Tuteja2010). To hold out in this unfavourable condition, it is essential for plants to scavenge this free radical. During drought, the increased activities of antioxidant enzymes are associated with higher scavenging of H2O2. We observed a significant increase (p ≤ 0.05) in SOD and CAT activity under stress conditions (Table 1) which reveals that the H2O2 scavenging capacity of black gram is closely associated with the activation of anti-oxidant defense system triggered by enhanced activities of SOD and CAT. Our results resembles with the findings of Masoumi et al. (Reference Masoumi, Masoumi, Darvish, Daneshian, Nourmohammadi and Habibi2010) while working with soybean. In earlier studies also, higher increment in the activities of SOD, GR, APX, GPX, GST and POD under drought were recorded in tolerant varieties of common bean and wheat (Bhardwaj and Yadav, Reference Bhardwaj and Yadav2012; Hameed et al., Reference Hameed, Goher and Iqbal2013).
SOD is considered as the most efficient anti-oxidant enzyme. It plays a key role in quenching active oxygen by working as a catalyst to carry out the dismutation of O2 − into H2O2 which are further eliminated by CAT, POD and other anti-oxidant enzymes (Fu and Huang, Reference Fu and Huang2001). In all the studied genotypes, highest increment of CAT activity was observed in the plants stressed during vegetative stage (T1). The increased rate of metabolism and production of new organs in this stage leads to excess generation of ROS under water-limited environment. Up-regulation of CAT averts cytosolic H2O2 build up and protect plant cell from oxidative damage (Prochakova et al., Reference Prochakova, Sairam, Srivastava and Singh2001). Therefore, in water-limited conditions, higher activity of SOD accompanied by increased CAT activity is highly desirable to fulfil the high demand of quenching H2O2. In the present study, enhancement in the activity of antioxidant enzymes (SOD and CAT) was lowest in genotype USJD 113 regardless of treatments. These findings suggest the higher susceptibility of USJD 113 towards drought than rest of the studied genotypes. Our results are in confirmatory of the findings of Chen and Cao (Reference Chen and Cao2008). Lower level of MDA along with enhanced activities of SOD and CAT (Table 1) in T9 can be linked to its ability to cope up with water scarcity by limiting the damaging effects of drought through up-regulation of antioxidant enzymes. Again, higher level of MDA and lower increment in anti-oxidant enzyme activities in USJD 113 could be one of the reasons of its susceptibility.
Osmotic stress imposed at vegetative, flowering and pod filling stages had significant (p ≤ 0.01) impact on seed yield. Control plants of all the genotypes gave considerably better yield than the plants grown under water deficit condition (Table 3). The effect of water scarcity on yield is a highly complex phenomenon and involves processes like gametogenesis, fertilization, embryogenesis and seed development (Barnabas et al., Reference Barnabas, Jager and Feher2008). Zare et al. (Reference Zare, Ghahremani nejad and Bazrafshan2012) reported that limitation of soil moisture during reproductive stage is especially detrimental for crops in terms of economic yield. Because at this stage, the development of reproductive organs is under the control of photo-assimilate production and partitioning by the source tissues. Therefore, lack of moisture in active crop root zone during flowering and pod formation causes poor nutrient utilization and hindrance in flowering. As a result, the probability of transition from a developing flower to pod is reduced resulting in pod abortion (Kimber and McGregor, Reference Kimber and McGregor1995). In our experiment, highest reduction in yield was observed when plants were subjected to stress during flowering stage (T2) followed by pod filling (T3) and vegetative (T1) stage. Reduction in yield due to drought was also observed in our earlier studies on black gram and green gram (Baroowa and Gogoi, Reference Baroowa and Gogoi2013; Baroowa and Gogoi, Reference Baroowa and Gogoi2014). Lesser yield loss accompanied by higher value of DTI recorded in T9 (Table 2) proves its tolerance capacity to soil moisture deficit. On the other hand, greater yield loss and lower value of DTI noted in USJD 113 can be attributed to its susceptibility to osmotic stress.
CONCLUSION
Remarkable impact of drought was observed in all the genotypes of black gram. Deficiency of soil moisture significantly reduced RLWC, carotenoid and TSP while it increased peroxidation of membrane lipid giving higher concentration of MDA. To counterpart this changes, all the genotypes increased their antioxidant defense capacity through enhancement in the activity of SOD and CAT for scavenging of drought-generated ROS including H2O2. Among the studied genotypes, T9 was identified as the most tolerant genotype of black gram for Assam (India) and areas with similar environmental condition while USJD 113 showed its susceptibility towards osmotic stress. Flowering stage had been proved to be the most vulnerable growth stage towards drought. Genotypic variability, treatment difference and the interaction effect of treatment and genotypes was statistically significant (p ≤ 0.01) for carotenoid, MDA content and H2O2 scavenging activity at all the growth stages and can be taken as marker traits for selection of drought tolerant genotypes of black gram. These findings suggest that black gram can be successfully cultivated even in drought-prone areas by coinciding the time of reproductive development with the period of water availability to minimise yield loss. These results may able to aid some important information in the field of black gram research which will be helpful for breeders also.


