

1. Introduction
The main role of agriculture systems in developing countries is to provide food security for billions of people. Since the 1960s, agricultural systems have seen large increases in yield and output (Ritchie & Roser, Reference Ritchie and Roser2013). These productivity improvements, substantially spurred by the proliferation of agricultural innovations, have led to increased food security, lower poverty, better health outcomes, and greater economic output (Evenson & Gollin, Reference Evenson and Gollin2003; Pingali, Reference Pingali2012; Alston & Pardey, Reference Alston and Pardey2014; von der Goltz et al., Reference von der Goltz, Dar, Fishman, Mueller, Barnwal and McCord2020; Gollin et al., Reference Gollin, Hansen and Wingender2021). Much of the well-documented progress of the 20th century is tied to productivity improvements in agriculture (Gollin et al., Reference Gollin, Hansen and Wingender2021).
Despite these improvements, challenges remain. Still, 10% of the world suffers from hunger, with a much higher prevalence (24%) in Sub-Saharan Africa (FAO, 2021). Environmental concerns, such as climate change, poor soil health, and lower water availability are likely to slow the general march of progress (Mbow et al., Reference Mbow, Rosenzweig, Barioni, Benton, Herrero, Krishnapillai, Liwenga, Pradhan, Rivera-Ferre, Sapkota, Tubiello and Xu2019). As in the past, innovation will likely play a large role in addressing the challenges of the 21st century (Burney et al., Reference Burney, Davis and Lobell2010; Alston & Pardey, Reference Alston, Pardey, Barrett and Just2021). Besides addressing specific challenges, innovation also has broad welfare implications for all humanity by increasing the quantity and quality of available food and saving ever-scarcer planetary resources.
The purpose of this paper is to document the economic case for increased funding for agricultural research and development (R&D), highlighting it as one of the interventions with the highest return in all of agriculture and global development. The rationale for focusing on agricultural R&D as opposed to other agricultural interventions is the large returns reported in previous studies (Alston et al., Reference Alston, Chan-Kang, Marra, Pardey and Wyatt2000; Pardey et al., Reference Pardey, Andrade, Hurley, Rao and Liebenberg2016a,Reference Pardey, Andrade, Hurley, Rao and Liebenberg b, Reference Pardey, Alston, Chan-Kang, Hurley, Andrade, Dehmer, Lee, Rao, Kalaitzandonakes, Carayannis, Grigoroudis and Rozakis2018; Alston et al., Reference Alston, Pardey and Rao2020).Footnote 1 Moreover, “[t]here is widespread professional consensus that agricultural research and development (R&D) realizes high economic returns” (Rao et al., Reference Rao, Hurley and Pardey2019). Agricultural R&D was placed by an Eminent Panel, including Nobel Laureate economists, as one of the top interventions for the post-2015 agenda across all sectors in a previous Copenhagen Consensus project (Lomborg, Reference Lomborg2015). Discussions and correspondence with advisors to the Copenhagen Consensus’s Halftime SDG project confirmed agricultural R&D as the highest or one of the highest returning interventions in agriculture.Footnote 2
This paper extends a recent modeling study that estimated the investments required to attain the Sustainable Development Goal (SDG) promise of eliminating hunger by 2030, where ‘eliminate’ means a hunger prevalence of less than 5% (Rosegrant et al., Reference Rosegrant, Sulser, Dunston, Cenacchi, Wiebe and Willenbockel2021). The intervention calls for an increase in funding – an average of $5.2 billion per year measured in 2020 USD over the next 35 years. The majority of this will be deployed towards international public goods agricultural research that has broad applicability, such as foundational research into higher yielding and more resistant staple crops. Some of the incremental funding is also earmarked for adapting these innovations to local contexts and improving research efficiency. Last, a share of funding is assumed to be provided by the private sector for marketable innovation adapted to the needs of the developing world.
The outcomes of these investments are assessed using IFPRI’s IMPACT model, a global, partial-equilibrium, multi-market agricultural model.Footnote 3 After 35 years, the increased funding is estimated to increase agricultural output by 10%, reduce the prevalence of hunger by 35%, reduce food prices by 16%, and increase per capita incomes by 4% relative to a counterfactual where funding continues to rise on historical trends. Using an 8% discount rate, the net present value of the costs of agricultural R&D is estimated at $61 billion for the next 35 years, while the net present benefits in terms of net economic surplus (the sum of consumer and producer surplus) are estimated at $2.1 trillion. The central estimate of the benefit–cost ratio (BCR) is therefore 33, consistent with previous research documenting high average returns to agricultural research and development (Alston et al., Reference Alston, Chan-Kang, Marra, Pardey and Wyatt2000; Pardey et al., Reference Pardey, Chan-Kang, Dehmer and Beddow2016a,Reference Pardey, Andrade, Hurley, Rao and Liebenberg b, Reference Pardey, Alston, Chan-Kang, Hurley, Andrade, Dehmer, Lee, Rao, Kalaitzandonakes, Carayannis, Grigoroudis and Rozakis2018; Alston et al., Reference Alston, Pardey and Rao2020). In the discussion section of this paper, we address technical challenges that may impact the robustness of the BCR, including the accurate classification and inclusion of costs and the use of different benefits measures. Broadly speaking, this discussion points to the fact that the BCR calculated in this paper is reasonable and may even be on the lower end of the potential range. Overall, agricultural R&D stands out as one of the highest returning interventions related to the SDGs.
One novel contribution of this paper compared to previous analyses is contextualizing the reported BCR within a wider universe of interventions that might compete for additional development resources, both within agriculture and across global development broadly. To do this, we consult the Copenhagen Consensus library of more than 600 BCRs conducted since 2004 across major development fields, including agriculture, health, education, governance, environment, infrastructure, and more. While of course, the Copenhagen Consensus library does not contain all BCRs ever estimated in global development, it provides a relatively large and representative share of benefit–cost analyses across many sectors with interventions that have been validated as important by governments of several developing nations. When placed within the context of competing uses of resources in agriculture and global development, agricultural R&D comes out as an intervention with substantial returns. The central BCR of agricultural R&D reported in this study places the intervention at the 91st percentile of all previous Copenhagen Consensus BCRs in agriculture, and 87th percentile for all BCRs regardless of sector. Agricultural R&D is likely one of the best uses of resources for the remainder of the SDG period and decades beyond.
2. Description of baseline and intervention scenarios
The documentation and analysis of historical agricultural R&D spending have been the focus of substantial scholarship (Pardey et al., Reference Pardey, Chan-Kang, Dehmer and Beddow2016a, Reference Pardey, Alston, Chan-Kang, Hurley, Andrade, Dehmer, Lee, Rao, Kalaitzandonakes, Carayannis, Grigoroudis and Rozakis2018; Fuglie, Reference Fuglie2018; Beintema & Echeverria, Reference Beintema and Echeverria2020). This body of work has attempted to estimate not only total spending, but also categories of spending by country or region of origin, and whether the spending supported private or public goals. Within public agricultural R&D for developing nations, there has often been a further delineation between spending by CGIAR – a group of aligned research centers that provide innovations and technical and policy support to improve food security, poverty, and eco-system services globally – and national agricultural research systems (NARS), which typically conduct locally relevant research for the benefit of their own nations.
While they form separate parts of an integrated global innovation chain, it is worth highlighting some of the differences between CGIAR and NARS. First, being a coordinated institutional model for conducting important upstream functions like fundamental research, germplasm collection, and knowledge sharing for the global public good, CGIAR offers economies of scale and scope (Byerlee & Lynam, Reference Byerlee and Lynam2020). Individual NARS, by their nature, lack the same benefits,Footnote 4 although their main advantage lies in their capacity to adapt innovations to local contexts. Second, spending by NARS in aggregate has been higher than spending by CGIAR (see Figure 1). Moreover, the relative share of NARS compared to CGIAR in public agricultural R&D spending has increased over time, with a noticeably large jump after the spike in global food prices in 2008, which subsequently saw significant increases in investment in agricultural R&D by middle-income countries, particularly China, Brazil and India (Pardey et al., Reference Pardey, Chan-Kang, Dehmer and Beddow2016a; Pardey et al., Reference Pardey, Alston, Chan-Kang, Hurley, Andrade, Dehmer, Lee, Rao, Kalaitzandonakes, Carayannis, Grigoroudis and Rozakis2018). However, much of this increase was not seen in Sub-Saharan Africa, the region with the largest current and projected prevalence of food insecurity. Based on figures from the Agricultural Science and Technology Indicators (ASTI) database, only 10% of the increase in NARS investment from 1999 to 2013 across developing countries was due to additional resources deployed by NARS in Sub-Saharan Africa.
Historical spending by NARS (National Agricultural Research Systems), CGIAR, and private sector in developing countries: 1961–2018. All figures in 2020 USD converted using GDP deflators from World Bank (2021). Spending by CGIAR figures derived from Beintema and Echeverria (Reference Beintema and Echeverria2020) while spending by NARS is from the ASTI database with data only available between 1981 to 2011. Spending by private sector derived from Fuglie (Reference Fuglie2016).

For completeness, Figure 1 also includes spending by the private sector in developing countries sourced from Fuglie (Reference Fuglie2016). Private R&D in developing countries represents a relatively small share of total private sector R&D and total agricultural R&D in developing countries. However, available data suggest this is a larger contributor to R&D spending than CGIAR in developing countries.
Against this backdrop, scenarios of future R&D spending were examined in a recent exercise to determine what additional investments would be required to eliminate hunger over the period 2016–2030 and the impacts of further spending to 2050 (Rosegrant et al., Reference Rosegrant, Sulser, Dunston, Cenacchi, Wiebe and Willenbockel2021). We extend that analysis to estimate a BCR of this spending for Copenhagen Consensus’ Halftime SDG project. In addition, we bring forward the period of analysis by 6 years, such that reported results correspond to the period 2022–2056.Footnote 5
Baseline investment is assumed to average $2.2 billion annually by CGIAR and $8.3 billion annually by NARS, over the period 2022–2056 (2020$) and is based on projections from historical spending. Note that these figures represent average yearly spending across the period of analysis and not the point value of yearly spending.
This baseline is compared to four different investment scenarios (all figures reported in 2020$).
-
1. Increased agricultural R&D for international public goods research: This scenario sees a substantial increase in funding to all 15 CGIAR centers. The profile of historical, baseline, and intervention spending are depicted in Figure 2. In the intervention scenario, R&D spending starts at $2 billion ($0.8 billion above baseline) before increasing rapidly to $6.8 billion by 2040 ($4.4 billion above baseline). After this point, additional spending tapers downwards so that by 2056, the intervention scenario only calls for an additional $0.4 billion. This profile of additional spending reflects accelerated investment in existing projects as well as the early commencement of new projects. This essentially exhausts the pipeline of foreseeable projects over the course of the first 15 to 20 years with subsequent funding mostly covering the costs of additional projects underway, leading to a tapering off towards baseline spending. In reality, a new decision can be made in the late 2030s whether to taper off or not, but the expectation is that substantial progress will already have been made towards reaching the hunger targets with further increases not required. Moreover, a rise then tapering off by the end of the period is appropriate for a model that ends in 2056 since substantial extra spending in the years before 2056 would not have time to generate a commensurate benefit, leading to an underestimate of the BCR. The greatest share of additional CGIAR spending is directed towards Sub-Saharan Africa (83%), with smaller shares devoted to South Asia (7%) and Latin America and the Caribbean (6%).
While it is beyond the scope of this exercise to outline exactly what the extra investment would be spent on, and indeed beyond a certain timeline, it is unknowable, research is likely to reflect CGIAR’s historical endeavors: basic research, genetic innovation, capacity building, and technical and policy support. The types of priority research areas were identified in collaboration with CGIAR centers in IFPRI’s Global Futures and Strategic Foresight program. For example, a survey of research scientists under this program noted that the most probable highest returning investments for cassava were (i) efficient and massive high-quality planting material production, (ii) distribution systems, and (iii) sustainable crop and soil fertility management practices (Alene et al., Reference Alene, Abdoulaye, Rusike, Labarta, Creamer, del Río, Ceballos and Becerra2018). Looking at CGIAR’s 2022–2024 investment prospectus also provides some insight on what funds are likely to be spent on. The prospectus highlights 33 projects requiring $1bn to $1.4bn of funding. Within these, there is a range of traditional CGIAR projects such as crop improvement using precision genetic technologies, policy support for food, land, and water systems transformation, and extension support to promote climate-resilient intercropping systems for women and young farmers (CGIAR, 2021). Moreover, the recently developed CGIAR 10-year strategy, One CGIAR 2030, outlines new capabilities that CGIAR requires for the rest of the decade to meet strategic goals covering food security, nutrition, inclusion, poverty reduction, climate change, environmental health, and biodiversity (CGIAR, n.d.). These new capabilities include expertise in consumer food environments, innovative finance, digital technologies, risk management, insect food production, and expanded partnerships with the private sector. Last, additional research may also tackle ‘breakthrough’ technologies such as cultured meat, although the passage of these innovations is difficult to predict.
-
2. Increased agricultural R&D for international public goods research and national research systems: This scenario includes the above investment, plus additional spending for NARS across the developing world as shown in Figure 3. The largest shares are for Sub-Saharan Africa (33%) and the Middle East and North Africa (30%). NARS includes a multitude of actors including universities, government laboratories, and NGOs. Services that promote and disseminate agricultural technologies, such as extension, are also included within the umbrella of NARS. National research systems undertake similar activities as international research systems but with a more in-depth focus on the relevant nation. A common activity is using improved varietals developed by international research institutions and engineering new varietals more appropriate to the given country’s agroecological conditions and consumer preferences. The funding required for this scenario is $1.3 billion per year on average above Scenario 1, and $4.0 billion per year on average above baseline levels.
-
3. Increased agricultural R&D for international public goods research and national research systems, plus spending for improved research efficiency: This scenario includes the investments in Scenario 2 and adds investments in higher research efficiency as shown in Figure 3. Research efficiency is gained through advances in breeding techniques, including further improvements in genomics and bioinformatics and high throughput gene sequencing. For example, the use and development of next-generation genome editing technology have the potential for more rapid and precise varietal development, enabling larger genetic diversity than current dominant varietals (Pourkheirandish et al., Reference Pourkheirandish, Golicz, Bhalla and Singh2020). In recent times, the use of CRISPR for more precise gene editing has led to varietals with higher yields and improved disease resistance (Zhu et al., Reference Zhu, Li and Gao2020). High-throughput sequencing dramatically alters the role of NARS because it reduces the need for in situ adaptation and testing. In addition, more effective regulatory and intellectual property rights systems that reduce the lag times from discovery to deployment of new varieties can also improve the efficiency of research, particularly in light of advanced breeding technologies (Waltz, Reference Waltz2018). Improved research efficiency is estimated to cost an extra $0.5 billion per year on average above Scenario 2, and the combined scenarios with efficiency investments are $4.5 billion per year larger on average than baseline spending.
-
4. Increased agricultural R&D for international public goods research, national research systems, and private sector R&D, plus spending for improved research efficiency: The fourth scenario is the costliest R&D scenario and involves all of the above spending plus a 30% increase in private sector investments in developing countries as shown in Figure 3. Assuming that private sector investment follows historical trends, roughly two-thirds to three-quarters of this additional investment would be in crop-related research (and most of this category devoted to seeds and biotech) with the remainder in animal and farm machinery R&D (Fuglie, Reference Fuglie2016). As discussed in Fuglie (Reference Fuglie2016), technology policy can influence the extent of private R&D spending in developing countries. While it is beyond the scope of this paper to detail exactly what these policy changes might be across all developing countries, supportive policy changes in the arenas of biotechnology, property rights, and foreign investment can increase the propensity of private sector firms to invest in agricultural R&D in the global south (Fuglie, Reference Fuglie2016). A 30% increase in private investment is not infeasible given historical experience. For example, both Brazil and India saw at least six-fold increases in private R&D between the late 1990s and early 2010s due to supportive investment policies (Pray & Fuglie, Reference Pray and Fuglie2015). The investment required for Scenario 4 is $0.7 billion on average above Scenario 3 with 75% of the incremental investment going to Sub-Saharan Africa and East Asia and Pacific. Scenario 4 costs $5.2 billion per year on average above baseline levels (see Figure 3).
Historical, baseline, and intervention Scenario 1 funding for CGIAR: 1961–2057. All figures in 2020$ converted using GDP deflators from World Bank (2021). Historical spending by CGIAR derived from Beintema and Echeverria (Reference Beintema and Echeverria2020). Baseline and intervention scenarios are derived from Rosegrant et al. (Reference Rosegrant, Sulser, Dunston, Cenacchi, Wiebe and Willenbockel2021).

Additional R&D spending under different Scenarios. Scenario 1 is additional R&D spending by CGIAR; Scenario 2 adds additional spending by NARS; Scenario 3 adds additional spending towards improving research efficiency; Scenario 4 adds additional spending by the private sector. For Scenario 4, the largest share of additional spending (just over 50 %) is directed towards centralized public agricultural R&D, with spending by NARS taking up 25 % of the new spending.Footnote 6

3. Benefit-cost analysis
3.1. General parameters
The period of analysis is the 35-year span from 2022–2056. We adopt an 8% social discount rate – a consistent parameter across all Halftime SDG papers, based on the recommendations of Robinson et al. (Reference Robinson, Hammitt, Cecchini, Chalkidou, Claxton, Eozenou, de Ferranti, Deolalikar, Guanais, Jamison, Kwon, Lauer, O’Keeffe, Walker, Whittington, Wilkinson, Wilson and Wong2019). All figures are reported in 2020 USD. Where currency or inflation conversions needed to be made, we consulted exchange rates and GDP deflators from World Bank Open Data (World Bank, 2021).
3.2. Outcomes
Outcomes of the different investment scenarios are estimated using IFPRI’s IMPACT model. IMPACT is a partial equilibrium model that solves market clearing production, demand, and prices for national and global markets in numerous commodities. Since its development in the early 1990s, it has expanded to include linked additional modules that provide scenario analyses for climate, water, crops, value chains, land use, nutrition and health, and welfare (Robinson et al., Reference Robinson, Mason-D’Croz, Sulser, Islam, Robertson, Zhu, Gueneau, Pitois and Rosegrant2015). All scenarios assume Shared Socio-Economic Pathways middle-of-the-road scenario (SSP2) and a Representative Concentration Pathway (RCP) of 8.5.
For the current analysis, investments in agricultural R&D are assumed to increase output via empirically estimated relationships between the stock of knowledge and production (Evenson & Gollin, Reference Evenson and Gollin2003; Nin Pratt, Reference Nin Pratt2015; Nin Pratt et al., Reference Alejandro, Falconi, Ludeña and Martel2015).Footnote 7 The realized average elasticity of yield growth with respect to the stock of knowledge is 0.2 for CGIAR funding, 0.23 for NARS, and 0.14 for private-sector research.Footnote 8 Impacts from research follow a gamma distribution, peaking 10 years after knowledge formation and being fully obsolete after 20 years.Footnote 9 Changes to output are estimated individually for each commodity-country combination as a growth shock, with IMPACT calculating the market clearing price and quantity and associated changes to economic surplus, land use, climate change, water and nitrogen use, and more (Robinson et al., Reference Robinson, Mason-D’Croz, Sulser, Islam, Robertson, Zhu, Gueneau, Pitois and Rosegrant2015).
Several papers show the potential benefits of more rapid and efficient breeding and faster adoption of innovations (Bayer et al., Reference Bayer, Norton and Falck-Zepeda2010; Falck-Zepeda et al., Reference Falck-Zepeda, Yorobe, Husin, Manalo, Lokollo, Ramon and Sutrisno2012; Smyth et al., Reference Smyth, McDonald and Falck-Zepeda2014; Ludlow et al., Reference Ludlow, Smyth and Falck-Zepeda2016; Lenaerts et al., Reference Lenaerts, de Mey and Demont2018; Hickey et al., Reference Hickey, Hafeez, Robinson, Jackson, Soraya, Tester, Gao, Godwin, Hayes and Brande2019; Lenaerts et al., Reference Lenaerts, Bertrand and Demont2019). For example, Lenaerts et al. (Reference Lenaerts, de Mey and Demont2018) show that reduction in time of breeding through one technique, Rapid Generation Advance, can generate an increase in economic benefits of 26%, 36%, and 47% with saving of 3 years, 4 years, and 5 years respectively at a discount rate of 8%. This is achieved by bringing forward the realization of the benefits of research, increasing the present value of benefits. Falck-Zepeda et al. (Reference Falck-Zepeda, Yorobe, Husin, Manalo, Lokollo, Ramon and Sutrisno2012) show that regulatory costs and time lags of 2 years reduce the net present benefit for adoption of various crop varieties by 23% to 71%. Based on these studies, research efficiency improvements are assumed to increase the efficiency of CGIAR and NARS spending by 30% and reduce the lag time between spending and realization of maximum benefits by 5 years. These changes to output are initially modeled as exogenous changes to output within IMPACT and results are endogenously estimated based on subsequent changes in prices and demand, among other factors.
Here, we restate some of the headline findings documented in the latest IMPACT run with results shifted forward by 6 years (Rosegrant et al., Reference Rosegrant, Sulser, Dunston, Cenacchi, Wiebe and Willenbockel2021). The investments are expected to increase yields across the developing world with crop yields increasing by 2–17% and livestock yields increasing by 5–24% depending on the scenario and region. The largest gains in crops are seen in Sub-Saharan Africa followed by the Middle East and North Africa. For livestock, the largest gains are seen in Sub-Saharan Africa and South Asia. Real prices also decrease across all commodities relative to baseline. By 2056, commodity prices are 14–29% less on average, depending on the scenario with the largest drops coming from cereals, pulses, roots, and tubers.
These outcomes change the value of net economic surplus across the IMPACT run. Consumer and producer surplus are calculated as per standard calculations described in Appendix H of Robinson et al. (Reference Robinson, Mason-D’Croz, Sulser, Islam, Robertson, Zhu, Gueneau, Pitois and Rosegrant2015) with the summation of the two equaling the net economic surplus (see Figure 4).
Net economic surplus (2020 USD) under each investment scenario. Scenario 1 is additional R&D spending by CGIAR; Scenario 2 adds additional spending by NARS; Scenario 3 adds additional spending towards improving research efficiency; Scenario 4 adds additional spending by the private sector.

Using a linked general equilibrium module, called GLOBE, wider economic implications of the investment scenarios were estimated. These results indicate that GDP in developing countries would be $2.2 trillion higher by 2036 and $11.9 trillion higher by 2056 compared to the baseline scenario. These represent a 2% and 6% increase in per capita incomes respectively, a non-trivial contribution to economic growth.
The IMPACT model also estimates how increased food availability would impact the number of people at risk of hunger in 2036 and 2056, compared to 2010 (see Figure 5).Footnote 10 For reference, we also include the global 5% hunger target – the target notionally equated by the FAO as “elimination of hunger.” In the baseline scenario, a decrease in hunger is still expected due to rising incomes and the impacts of continued investments in agricultural R&D. Even then, there would be an estimated 490 million people at risk of hunger, a more than 5% prevalence overall.
Number of people hungry under various R&D investment scenarios. Sources: Rosegrant et al. (Reference Rosegrant, Sulser, Dunston, Cenacchi, Wiebe and Willenbockel2021) and FAO (2021).
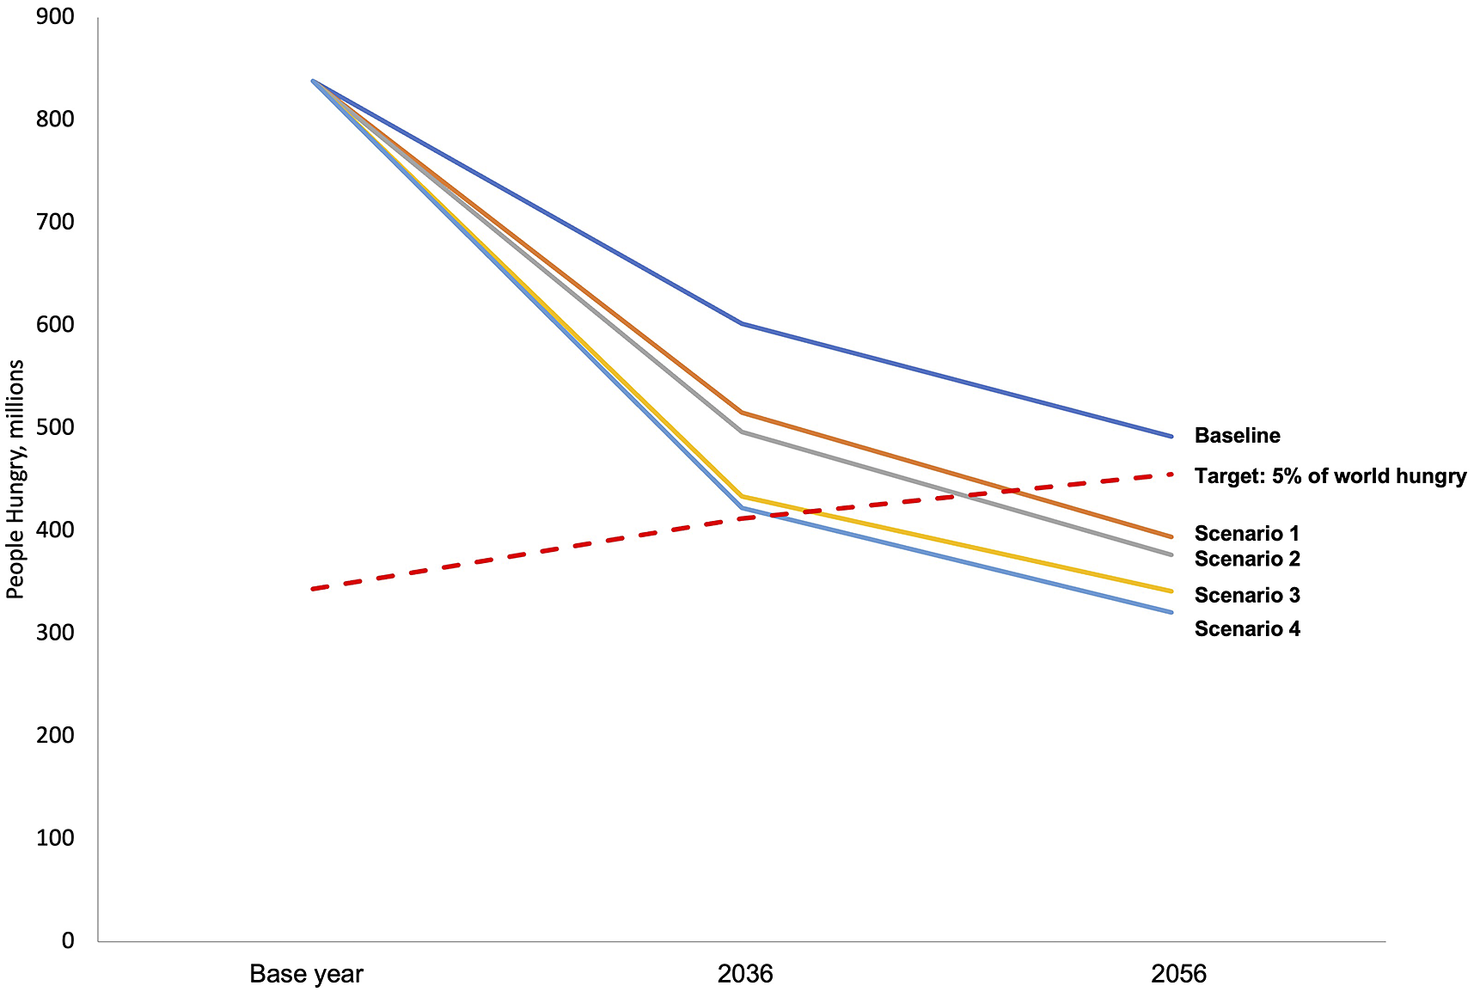
All investment scenarios would generate reductions in expected hunger, with greater investment leading to less hunger. The costliest scenario (Scenario 4) would allow the world to hit the 5% prevalence target by 2036, more than 20 years earlier than in the baseline scenario. This world average obscures pronounced variations across locations. Of greatest concern, Sub-Saharan Africa would still experience substantial hunger prevalence, estimated at 11.8% in 2036, only reaching 5.3% in 2056.
The investments are expected to have a range of positive environmental impacts. For instance, in the context of Scenario 4, increases in productivity enable agriculture to reduce land use with around 1 million hectares of avoided deforestation per year across the period of analysis. This represents roughly a 10–15% reduction in the rate of deforestation to the middle of the century. Greenhouse gas emissions are also estimated to be lower in Scenario 4, with 402 million tons of avoided CO2-eq in 2036 rising to 745 million tons in 2056. This is due to reductions in fertilizer use and improved productivity from rice and livestock. In addition, reduced deforestation due to avoided expansion of agricultural land contributes approximately 30% of the greenhouse gas emissions avoided. The investments are also expected to reduce water use and pollution from fertilizer. Global water use in agriculture would fall slightly by 0.3% in 2036 and 0.9% by 2056. There is a projected 21–35% annual reduction in nitrogen pollution and 14–15% annual reduction in phosphate pollution from fertilizer.
3.3. Results
For the benefit-cost analysis, costs are defined as the net present value of additional R&D investments to 2056 for each scenario. Benefits are defined as the net economic surplus, that is, the sum of consumer and producer surplus following previous benefit-cost analyses of agricultural R&D (Rosegrant et al., Reference Rosegrant, Magalhaes, Valmonte-Santos and D’Croz2015; Alene et al., Reference Alene, Abdoulaye, Rusike, Labarta, Creamer, del Río, Ceballos and Becerra2018). In the discussion section, we examine the implications of altering these cost and benefit definitions. Figure 4 shows the annual benefit after each year of consistent investment. Sustained investments in agricultural research generate an ever-increasing benefit profile (albeit with diminishing marginal returns) as new knowledge from agricultural research exceeds knowledge decay, leading to an ever-increasing stock of knowledge and an ever-increasing addition to yields and thus net economic surplus.
The costs, benefits, and BCR of each scenario is presented in Table 1 using an 8% discount rate. The first three columns present the absolute costs, benefits, and corresponding BCR of each scenario. The scenario with the highest BCR is Scenario 3, where $54 billion of investment yields $1.9 billion in benefits for a BCR of 35. Since each scenario adds an extra dimension of investment to the previous scenario, we can also calculate incremental costs and benefits to determine the BCRs of moving up to the next scenario, conditional on being at the previous scenario.Footnote 11 From this, we can see that adding research efficiency (Scenario 2 to Scenario 3) has the largest incremental BCR of 90. Moreover, adding private sector research (Scenario 3 to Scenario 4) requires an incremental investment of $10 billion to yield a benefit of $237 billion for an incremental BCR of 23 – an excellent return on investment that is much higher than typical returns on development programs. We therefore recommend the full investment represented by Scenario 4 although Scenario 3 is also an excellent investment.
Costs, benefits and benefit–cost ratios of each investment scenario (billions of 2020 USD at an 8% discount rate): 2022–2056.

Note: Incremental benefits, incremental costs, and incremental BCR show the change in the relevant metrics from the previous scenario.
4. Discussion and conclusion
Building on a recent modeling analysis conducted by the Committee on Sustainable Agriculture Intensification (Rosegrant et al., Reference Rosegrant, Sulser, Dunston, Cenacchi, Wiebe and Willenbockel2021), we estimate the costs and benefits of increased investment in agricultural R&D over the period 2022–2056. The results indicate that additional funding of $5.2 billion per year would substantially increase agricultural production and economic surplus, with benefits equivalent to $172 billion per year. Agricultural R&D has an excellent BCR of 33. In this section, we discuss potential challenges to this central result and how it sits within the broader cost–benefit literature.
4.1. Have all costs been considered?
In this analysis, costs are defined as the extra funds required for agricultural research. However, reaping the benefits of this research may require additional inputs such as fertilizer, labor, and seed, or more intensive promotion techniques including extension. To what extent might this affect the reported BCRs? While it is difficult to estimate all incremental costs precisely, it is unclear whether they are even positive in aggregate. Some technologies necessitate more inputs. For example, compared to non-hybrid seeds, the adoption of certain hybrid seeds has been shown to require additional fertilizer and improved storage to achieve their full production potential (Lin, Reference Lin1994; Ricker-Gilbert & Jones, Reference Ricker-Gilbert and Jones2015; Smale et al., Reference Smale, Kergna and Diakité2016; Waldman & Richardson, Reference Waldman and Richardson2018). However, other technologies may be cost-neutral or cost-saving depending on the existing cultivation conditions. For example, in Malawi, drought-tolerant maize varieties are typically no more costly than other hybrid maize varieties (Holden & Fisher, Reference Holden and Fisher2015), and have been shown to increase yields by 44% (Katengeza & Holden, Reference Katengeza and Holden2020). Micro-dosing of fertilizer reduces overall input use relative to recommended dose approach to fertilizer application (Okebalama et al., Reference Okebalama, Safo, Yeboah, Abaidoo and Logah2016; Mamadou et al., Reference Mamadou, Frédéric, Daniel, Sibiri and Marie-Paule2020). Mechanization reduces labor costs for specific on-farm tasks (Norman et al., Reference Norman1988; Afridi et al., Reference Afridi, Bishnu and Mahajan2020). With respect to the analysis at hand, the environmental outcomes estimated by the IMPACT run suggest an overall reduction in input intensity and therefore an overall cost-saving. For example, fertilizer pollution and water use decrease while an estimated 1 million hectares of forests are not converted to agriculture every year. These would generate cost savings relative to the baseline scenario and would have to be offset against any potential increases in cost across existing agricultural land, if any.
Would promotion costs increase from extra R&D? Focusing on extension – one important mode of technology dissemination – many governments as well as the SDG Indicator 14 under Goal 2.3 target a certain level of extension workers per 1000 farmers, rather than base extension staffing on the stock of agricultural knowledge (for example, Ministry of Agriculture, Animal Industry and Fisheries, 2016; National Planning Commission (Malawi), 2021). This suggests that from a whole-of-society perspective, extension costs are unlikely to increase under higher agricultural R&D with presumably the same amount of extension workers simply promoting better technologies in the intervention scenario.
Another important factor in estimating second-order costs relates to economy-wide, labor market transitions spurred by increased agricultural productivity. Across many developing countries, jumps in agricultural production accelerate economic growth and a broad labor market transition out of agriculture to manufacturing and services (Mellor, Reference Mellor1995; Gollin et al., Reference Gollin, Hansen and Wingender2021).Footnote 12 Historically, this has facilitated farm consolidation and lower overall cultivation costs particularly with respect to labor (Mellor, Reference Mellor1995; Dimitri et al., Reference Dimitri, Effland and Conklin2005). For example, in 1900, around 70% of the global population were employed in agriculture; in modern times that figure is less than 30% (Roser, Reference Roser2013). In high-income countries, the percentage of the labor force in agriculture is substantially less, typically under 5% (Dimitri et al., Reference Dimitri, Effland and Conklin2005; Roser, Reference Roser2013).
Since it is impossible to predict what technologies will arise out of agricultural R&D, it is hard to estimate second-order costs with certainty. Given the above considerations, a reasonable middle ground appears to be an assumption of no incremental change in cultivation costs. If anything, the substantial reductions in labor use – often the largest economic cost in smallholder farming – suggest that incremental costs may even be negative in the long run.
4.2. What is the impact of an alternative method for estimating net economic surplus?
During the review process for this paper, an important comment was provided that offered an alternative approach to estimating the net economic surplus for this analysis. The essence of the comment draws on the different ways in which technology improvements can be incorporated into supply shocks. To estimate economic surplus, the IMPACT model incorporates yield improvements from improved technology as rightward shifts in the supply curve, i.e., an increase in supply proportionate to the increase in yield. In the alternative case, technology improvements can be modeled as a reduction in costs at the industry level, where costs are reduced proportionately to the change in yield.
The reviewer states that, rather than assuming a given percentage increase in yield for every farmer would result in the same percentage rightwards shift in supply at the industry level, a given percentage increase in yield for every farmer would result in the same percentage downwards shift in supply at the industry level. Thus, the increase in yield from new technology results in cost savings of that order of magnitude at the initial equilibrium.
In this section of the discussion, we present alternative BCRs using an adjustment to account for the potential overestimate if technology improvements are modeled as resulting in a reduction in costs per unit output (downward shift of the supply curve), rather than an increase in supply for a fixed cost (rightward shift of the supply curve). The resulting BCRs are 11 for Scenario 1, 10 for Scenario 2, 14 for Scenario 3, and 13 for Scenario 4.
4.3. What is the impact of alternative methods for estimating benefits?
While there are important considerations when estimating net economic surplus, alternative approaches to benefit estimation may produce larger BCRs. First, numerous co-benefits were excluded. Environmental benefits from avoided greenhouse gas emissions, fertilizer pollution, water use, and deforestation are not included. Neither were human health and productivity benefits from avoiding hunger and malnutrition. These benefits may be significant. The value of ecosystem services provided by forests ranges from $3,854 per hectare per year for temperate forests to $6,612 per hectare per year for tropical forests based on figures reported in Costanza et al. (Reference Costanza, de Groot, Sutton, van der Ploeg, Anderson, Kubiszewski, Farber and Turner2014) inflated to 2020 values using US GDP deflators. Given that agricultural R&D is expected to avoid 1 million hectares of deforestation every year (i.e., 1 million more hectares of forest in year 1, rising to 35 million more million hectares of forest in year 35), the intervention provides a net present value of ecosystem services equivalent to $492 billion to $845 billion over 35 years, at an 8% discount rate. If included, this would increase the BCR of Scenario 4 by approximately 20–40%.
Alternative definitions of benefits would also yield higher BCRs. If each year’s benefit is estimated as the quantum of extra production multiplied by the price that prevailed in 2015Footnote 13 across 29 commodities, the BCR of Scenario 4 would increase to 39. Furthermore, one might choose to use net household income as has been applied in a previous benefit–cost analysis (Rosegrant et al., Reference Rosegrant, Dunston, D’Croz, Sulser, Wiebe and Willenbockel2019). While this was not conducted for this analysis, it would likely be in the same range as the broader economic effects calculated using the GLOBE module. As reported above, the investment is expected to increase GDP in developing countries by $2.2 trillion by 2030 and $11.9 trillion by 2050, a 2% and 6% increase in per capita incomes respectively. The ratio of incremental GDP to costs, is eight times larger than the BCR measure reported in Table 1. This last result implies a BCR of ~250, a result congruent with substantial benefits from accelerated structural transformation arising out of improved agricultural efficiency, and the reduced need for agricultural labor.
4.4. Should a different (lower) social discount rate be applied?
Economic analyses of agricultural R&D typically use a real 5% social discount rate (Alston et al., Reference Alston, Pardey and Rao2020). We have adopted an 8% discount rate. It is beyond the scope of this paper to argue for a given discount rate, and we acknowledge a range of discount rates may be appropriate depending on the decision-making context. In this case, we adopt an 8% discount rate primarily following the guidance provided by Robinson et al. (Reference Robinson, Hammitt, Cecchini, Chalkidou, Claxton, Eozenou, de Ferranti, Deolalikar, Guanais, Jamison, Kwon, Lauer, O’Keeffe, Walker, Whittington, Wilkinson, Wilson and Wong2019), which suggests using a rate that is twice the short-term per capita growth rate of the relevant context (in this case low and lower-middle income countries); 8% is more consistent with this recommendation than 5%. Moreover, higher discount rates, in the range of 5–9%, are more consistent with observed and expected per capita growth rates for developing countries following the Ramsey Equation (Haacker et al., Reference Haacker, Hallett and Atun2020). Third, other papers in the Halftime SDG series adopt 8% as the central discount rate, and we use the same value for consistency.
As a sensitivity analysis, we test the impacts of three different discount rates, constant 3%, constant 5%, and a time-varying discount rate, which equals two times the expected per capita growth rate in the same period.Footnote 14 At a 3% discount rate, the BCR for Scenario 4 is 52, while at 5% it is 43. Using a time-varying discount rate generates a BCR of 40. Using discount rates lower than 8% leads to larger BCRs since benefits increase over time due to the accumulation of knowledge (see Figure 4), while annual marginal costs decrease over the latter half of time period (see Figure 3).
4.5. A recent study identified a median BCR of 10 for CGIAR investments – why is this different?
A recent study noted that the BCR of agricultural R&D was 10 for CGIAR interventions (Alston et al., Reference Alston, Pardey and Rao2020). This was based on a survey of more than 600 BCRs plus two supplementary analyses looking at the returns from billion-dollar projects and comparing agricultural value from productivity improvements (as measured by total factor productivity multiplied by total agricultural value) to overall agricultural R&D spending. While the approach used in this paper, economic modeling based on IMPACT results is distinct from the approaches used in that paper, this does not mean our results are necessarily inconsistent with the findings of Alston et al. (Reference Alston, Pardey and Rao2020).
The BCR of 10 represented the median BCR from their sample. In contrast, the mean BCR was much higher, at 26. We argue that this is the more appropriate BCR comparator for a large portfolio of agricultural R&D investments such as the one considered in this paper. Since innovation is inherently uncertain and high BCR projects are likely difficult to identify ex-ante, investing in a portfolio is an optimal strategy. In this case, many projects are likely to yield low BCRs or fail entirely. However, a relatively small proportion of research endeavors would succeed and proliferate, generating substantial returns. Historically, this phenomenon has occurred at both an individual varietal level within a given commodity and across commodities. For example, IR8 – a cross of Indonesian and Taiwanese rice − was the first successful mega-variety to come out of the International Rice Research Institute, accounting for 10% of Asia’s rice only 4 years after its creation (Gollin et al., Reference Gollin, Hansen and Wingender2021). Across commodities, Gollin et al. (Reference Gollin, Hansen and Wingender2021) note that in the early years of CGIAR, both wheat and rice generated substantial benefits, while research efforts for other crops were less successful. In more recent times, wheat research conducted by the International Maize and Wheat Improvement Center (CIMMYT) during 1994 to 2014 was estimated to return between $73 and $103 in economic benefits for every dollar spent (Lantican et al., Reference Lantican, Braun, Payne, Singh, Sonder, Baum, van Ginkel and Erenstein2016), a return substantially larger than average CGIAR research. In short, relatively few successes raise the overall value of a research portfolio.Footnote 15 This dynamic is captured in the mean, and not the median BCR. In this analysis, the BCR to further CGIAR investment alone is 29, which is relatively close to the historical average of 26 reported by Alston et al. (Reference Alston, Pardey and Rao2020).
4.6. What are the potential impacts on the BCR of extending the period of analysis?
The analysis for this paper is truncated at 35 years, following the modeling of Rosegrant et al. (Reference Rosegrant, Sulser, Dunston, Cenacchi, Wiebe and Willenbockel2021). This produces an underestimate of the BCR since the benefits from investments made in year 16 onwards are not fully captured under a 20-year lag structure. While we are unable to model this in IMPACT, to approximate the potential missing benefits, we extend the benefits profile to 2072, with benefits tapering off linearly until they reach zero following the gradient of discounted benefits over the previous 5 years. BCRs increase by 12–17%, depending on the scenario. The BCR for Scenario 4 jumps from 33 to 39.
4.7. What are the potential impacts on BCR of increasing the lag structure?
In this analysis, the assumed longevity of research is 20 years, with impacts peaking after 10 years. Analyses on the returns from R&D have used alternative lag structures, with empirical evidence from the USA indicating that lag structures may be twice as long, i.e., the benefits of research last 40 years, with impact peaking roughly after 20 years (Alston et al., Reference Alston, Pardey and Ruttan2008; Alston et al., Reference Alston, Pardey, James and Andersen2009; Baldos et al., Reference Baldos, Viens, Hertel and Fuglie2019). Extending the longevity of benefits has countervailing impacts on estimated BCRs under discounting. Since the time taken to reach maximum impact is longer, benefits in the earlier years are smaller. At the same time, the extension of impacts ensures there are more benefits in later years. The exact impact of these two depends on the assumed discount rate, but typically, the overall BCR is a decreasing function of the length of the lag structure, under the types of timeframes considered appropriate for R&D (i.e., 20 to 50 years) under discounting. To approximate the impact of doubling the lag structure, the benefits are recalculated by assuming the benefits for year t, where t equals the number of years after the start of the intervention, are instead realized in year 2 t. For example, the year 10 benefits (2032) are instead realized in year 20 (2042). In the in-between years, the benefit is assumed to be a simple average of the surrounding years. For example, the year 11 benefit is assumed to be the benefit of year 10 and year 12. Recalculating the BCR under an 8% discount rate yields a BCR of 18 for Scenario 4. While this is lower than the central estimate of 33, it is still very large compared to other uses of development spending and continues to represent an excellent return on investment.
4.8. What are the implications of significantly increased funding for CGIAR?
The analysis assumes that CGIAR would expand quickly in a short period of time, compared to existing and projected baseline levels. Funding would start at $2bn by 2022, rising to $5bn by 2030. This compares to an assumed $1.2bn in 2022 and $1.8bn by 2030 under baseline conditions. As discussed previously, funding projections were based on consultations with CGIAR centers under IFPRI’s Global Futures and Strategic Foresight program. While these are derived from the practical experience of participants working in CGIAR research environments, it is worth considering the impact of this rapid additional funding. First, it is worth noting from a historical perspective that CGIAR has seen rapid increases in funding in the past. Between 1972 and 1983, funding almost quadrupled in real terms from $100 million to $389 million (2020$). Funding also rapidly expanded in the early part of the millennium, with spending almost doubling between 2003 and 2013 from approximately $500 million to $1 billion. It is beyond the scope of this paper to exhaustively document any potential changes in returns to CGIAR investment over time. However, there is some evidence of diminishing marginal returns to increased investment, potentially from diseconomies of scope. As noted in Alston et al. (Reference Alston, Pardey and Rao2020), historical expansions in funding were generally accompanied by expansions in the number of research centers, each focusing on new commodities (beyond CGIAR’s original four research centers) or policy-based research. There is some evidence that returns to centers focusing on additional commodities (e.g., fish, agroforestry) have experienced lower returns than the original four (Alston et al., Reference Alston, Pardey and Rao2020). Returns to the original four appear to be consistently larger, which is not unexpected given that they conduct research into some of the most widely consumed staples in the world (rice, wheat, maize, cassava, and beans) with a greater potential for impact.
Importantly, the model set up for the benefit-cost analysis incorporates diminishing marginal returns, parameterized as elasticities between the stock of knowledge and yield growth. The reported elasticity of 0.2 for CGIAR implies that for every 1% increase in the stock of knowledge, yield growth increases (on average) by 0.2%. As the stock of knowledge increases from more agricultural R&D investment, larger amounts of additional funding are required to generate the same 0.2% increase in yield growth. The presented results, therefore, include diminishing marginal returns, congruent with economic theory.
4.9. How does this BCR compare to other uses of resources in agriculture and in global development generally?
To determine agricultural R&D’s relative ranking, we collated central BCRs from all Copenhagen Consensus analyses conducted since 2004. These cover all development areas (e.g., health, governance, infrastructure, education, climate change, environment, agriculture, conflict and violence, and more). These represent “global” or multi-country analyses as well as analyses for specific countries or regions, including Ghana, Malawi, two states of India, Haiti, and Bangladesh. While, of course, these do not represent all cost–benefit analyses ever conducted in global development, they are likely representative of the universe of cost–benefit analyses of promising policies, given that they have been validated as relevant by sector experts and analyzable by academic researchers. If anything, the sample of Copenhagen Consensus BCRs might be biased upwards given that Copenhagen Consensus typically instructs sector experts to identify interventions that are likely to generate high returns. To the extent they are able to do this, the overall distribution may be representative of higher BCRs than random and would bias against us finding the BCR of this benefit-cost analysis to be large in comparison.
The total sample has 45 BCRs within agriculture, and 652 BCRs across all development areas. Within agriculture we further categorized interventions into one of five types: cultivation referring to interventions that address inputs to the cultivation process (e.g., irrigation, seeds) or types of cultivation practices (e.g., system of rice intensification, intercropping); storage and processing referring to interventions that focused on storing or processing commodities post-harvest; marketing policy referring to interventions that impacted how goods were sold (e.g., trade restrictions), enabling environment referring to policies that indirectly impact the agricultural sector and farmers broadly (e.g., insurance, credit, loan waivers) and agricultural R&D. Almost half of the interventions (23) relate to cultivation with another 16% (7) relating to storage and processing.
Compared to other agriculture interventions, the BCR of agricultural R&D from this study ranks as one of the highest in a sample, with only three other interventions demonstrating larger BCRs.Footnote 16 The central BCR of 33 is 3 times larger than the average BCR in agriculture, and 11 times larger than the median BCR for agriculture (see Figure 6). Indeed, when looking at other agricultural R&D interventions conducted by Copenhagen Consensus, all except one are clustered towards the top of the distribution. Why might this be the case?
Distribution of agriculture BCRs, ranked from lowest to highest conducted by Copenhagen Consensus Center. IQR = inter-quartile range, s.d. = standard deviation. Dark red line is this BCR. Light-red lines represent other agricultural R&D BCRs.

One defining feature of the distribution is that most agricultural BCRs are in the range of 0–5. This is because fundamentally, agriculture is a private enterprise, with (mostly) private costs and benefits. The private nature of agriculture arguably constrains returns in cultivation, storage, and processing and most enabling environment interventions (insurance and credit). In these circumstances, extremely high BCRs (e.g., above 15) are unlikely to be available because they would have been captured by farmers and enterprises already.
The exception to this occurs when there is some form of constraint that makes it hard or impossible for private actors to realize sufficient (risk-adjusted) gains from their investments. Much agricultural R&D in both rich and developing countries is of this type, where private actors cannot fully appropriate the gains from research (Alston et al., Reference Alston, Norton and Pardey1995). In this case, large (social) returns may be available on which governments can capitalize.
That is not to say that all arenas where private actors cannot intervene yield high BCRs. The small number of interventions under marketing policy do not generate a consistent pattern of high BCRs like agricultural R&D does, even though these represent interventions that usually only governments can influence. Agricultural R&D has strong ‘fundamentals’ that generate superior returns: a small investment upstream in the agricultural process can eventually impact millions of farmers positively with little or no further investment. As discussed above, it may even reduce costs in the long run. These features – a fundamentally efficient intervention where gains are hard to capture by private actors – are the main reason why agricultural R&D is such a strong investment from a social standpoint.
A few final comments are worth making about the comparability of agricultural interventions. The other interventions against which agricultural R&D is being compared arguably represent investments that are substantially different in terms of time scale, locality, and size of investment. Few of the competing interventions envisage or require billions of dollars of investment globally over a 35-year horizon. In this regard, the interventions may not be substitutes from the perspective of a decision maker who may want to address tangible, relatively short-term challenges of smallholder farmers as well as increase the long-term productivity of the agricultural sector overall.Footnote 17 Also, despite the substantial BCR advantage agricultural R&D has over other interventions, the competing BCRs are not necessarily ‘small’ from a beneficiary perspective. For example, a farmer who normally returns 150% on inputs (i.e., a BCR of 1.5) and then switches to a cultivation practice that yields 250% (i.e., a BCR of 2.5) would see a meaningful improvement in her living standards.
Nevertheless comparing the BCRs of competing investment opportunities is important as it acknowledges the fundamental presence of opportunity costs. All investments require money. Directing resources to one intervention naturally means less resources for another. This reality of competing resources is true even if the decision maker does not consider them in this manner, and for this reason, there is utility in ranking and comparing interventions.
As a last and potentially unique point of comparison, we address the question, “How does agricultural R&D stack up against interventions across a much broader set of development domains?” Compared to the other 652 interventions, agricultural R&D from this paper sits at the 87th percentile, with a BCR that is 5.5 times the BCR of the median intervention (see Figure 7). It is clear that agricultural R&D represents one of the best uses of resources not only within agriculture but also across all conceivable development interventions. Ambitious, large, and sustained investment in agricultural R&D is a global best buy par excellence.
Distribution of BCRs, ranked from lowest to highest of all interventions conducted by Copenhagen Consensus. The interventions with the highest BCRs have been truncated on the graph for clarity. IQR = inter-quartile range, s.d. = standard deviation.


 Open access

