


1. Introduction
Visually imperfect (VI) produce describes food products with physical blemishes or abnormalities. Although these imperfections do not decrease the potential health benefits or nutritional quality of the food, many grocery stores do not purchase VI produce due to the enforcement of strict cosmetic standards (Yuan et al., Reference Yuan, Yi, Williams and Park2019). To illustrate the extent of this practice, in California, 20–50% of citrus, stone fruits, and grapes, and almost 70% of cucumbers do not meet such cosmetic standards (Gunders, Reference Gunders2012). Overall, about 10 million pounds of food with cosmetic imperfections is wasted annually (Bhandarkar, Reference Bhandarkar2020).
A consequence of cosmetic standards is that farmers often do not harvest VI produce, which can potentially translate to substantial economic losses (Johnson et al., Reference Johnson, Bloom, Dunning, Gunter, Boyette and Creamer2019). Additionally, enforcement of cosmetic standards discourages consumer demand for VI produce as it alters realistic expectations of produce appearances (Qi et al., Reference Qi, Penn, Li and Roe2022). However, over the last few years, some grocery stores have started introducing sections with “ugly” produce and/or implementing “ugly food campaigns” (e.g., Kroger, Harris Teeter).Footnote 1 Nevertheless, as there is still limited knowledge about consumer preferences for ugly produce, it is necessary to quantify consumer willingness to pay (WTP) for suboptimal food items and to determine the potential marketability of these products (Pfeiffer et al., Reference Pfeiffer, Sundar and Deval2021).
Previous research indicates that consumers will often purchase suboptimal food items when given a discount that corresponds to the respective suboptimality (de Hooge et al., Reference de Hooge, Oostindjer, Aschemann-Witzel, Normann, Loose and Almli2017; Helmert et al., Reference Helmert, Symmank, Pannasch and Rohm2017). Studies conducted specifically on VI fruits and vegetables have found that consumers associate these food products with lower price points (Grewal et al., Reference Grewal, Hmurovic, Lambertin and Reczek2018). Consumers in Uruguay accepted VI apples only when the price became sufficiently low (Aschemann-Witzel et al., Reference Aschemann-Witzel, Giménez and Ares2018). Interestingly, Yue et al. (Reference Yue, Alfnes and Jensen2009) determined consumer WTP decreased more for organic VI apples than conventionally produced VI apples.
A different strand of the literature highlights that the marketability of VI produce can be enhanced when VI produce is supplemented with informational messaging such as: (i) naturalness/authenticity of VI (Qi et al., Reference Qi, Penn, Li and Roe2022) or (ii) information about the societal problems caused by excessive food waste (Collart et al., Reference Collart, Interis, Henson and Maples2022). This finding is further supported by a recent meta-analysis of 40 studies related to imperfect foods that found that positive messaging about VI produce increases WTP for these products (Hartmann et al., Reference Hartmann, Jahnke and Hamm2021). Lastly, certain designs of the price labels of suboptimal foods can increase consumer attention toward these products as well (Helmert et al., Reference Helmert, Symmank, Pannasch and Rohm2017).
Despite the aforementioned literature, studies examining consumer WTP for leafy greens with VI are rather limited.Footnote 2 The first objective of our research extends the literature by examining how consumer characteristics (i.e., demographics, lifestyle preferences) affect WTP for organic VI kale. Kale was selected as a product of study because of recent increases in demand due to its purported health benefits. We specifically examined organic kale because most kale production in the United States is certified organic (Pullano, Reference Pullano2015).
Our second objective is twofold. We first examined how explicitly highlighting (with an arrow) where the imperfections are on the leaf impacts WTP. We also examined how informational treatments on safety of consumption and produce origin impact WTP. We then developed a pre-post analysis where consumers are informed of the percentage of leaf area affected by imperfections to test if straightforward information changes purchasing decisions. The first two objectives are evaluated with organic kale that features 2% and 10% surface areas of visual imperfections. The pre-post analysis is only conducted with the 10% VI organic kale.
We developed seven treatmentsFootnote 3 to test whether information on produce origin, safety of consumption, and explicitly highlighting areas of imperfections affect the purchasing decision and/or WTP. A probit model was utilized to test whether these treatments impact the decision to purchase VI organic kale. Second, an ordered probit model was utilized to examine if the treatments impact WTP for VI organic kale.
As a preview of the results, our findings indicate that several consumer characteristics and lifestyle traits, including but not limited to gender, dietary preference, age, and past purchases of VI produce significantly affect both the purchasing decision and WTP. None of the treatments had a statistically significant impact on the purchasing decision. However, several treatments, such as explicitly highlighting the imperfections, had a statistically significant effect on WTP at both the 2% and 10% imperfection level.
Our findings can help organic kale producers identify potential unrealized gains by marketing VI organic kale instead of discarding or not harvesting it. We conduct a profitability analysis using the mean price selection from the control payment card at the 10% imperfection level to evaluate the potential unrealized gains in this market. This result has significant implications for organic kale production as kale grows in popularity with both consumers and producers across the study area and beyond (Boehm, Reference Boehm2019).
2. Methodology
2.1. Data collection
The data for the study were collected over 2 weeks in November 2022, 1 week in January 2023, and 1 week in March 2023 using an online survey instrument distributed by Qualtrics XM. The survey instrument was developed with input from South Carolina agricultural extension agents,Footnote 4 agricultural researchers, and organic kale producers. Several pilots were conducted before the survey was implemented. A pretrial with university students and faculty was first performed.Footnote 5 Then, a second larger pilot was distributed by Qualtrics XM that garnered 40 responses from members of the study population. Based on the feedback received, the survey instrument wording, length, etc. were modified.
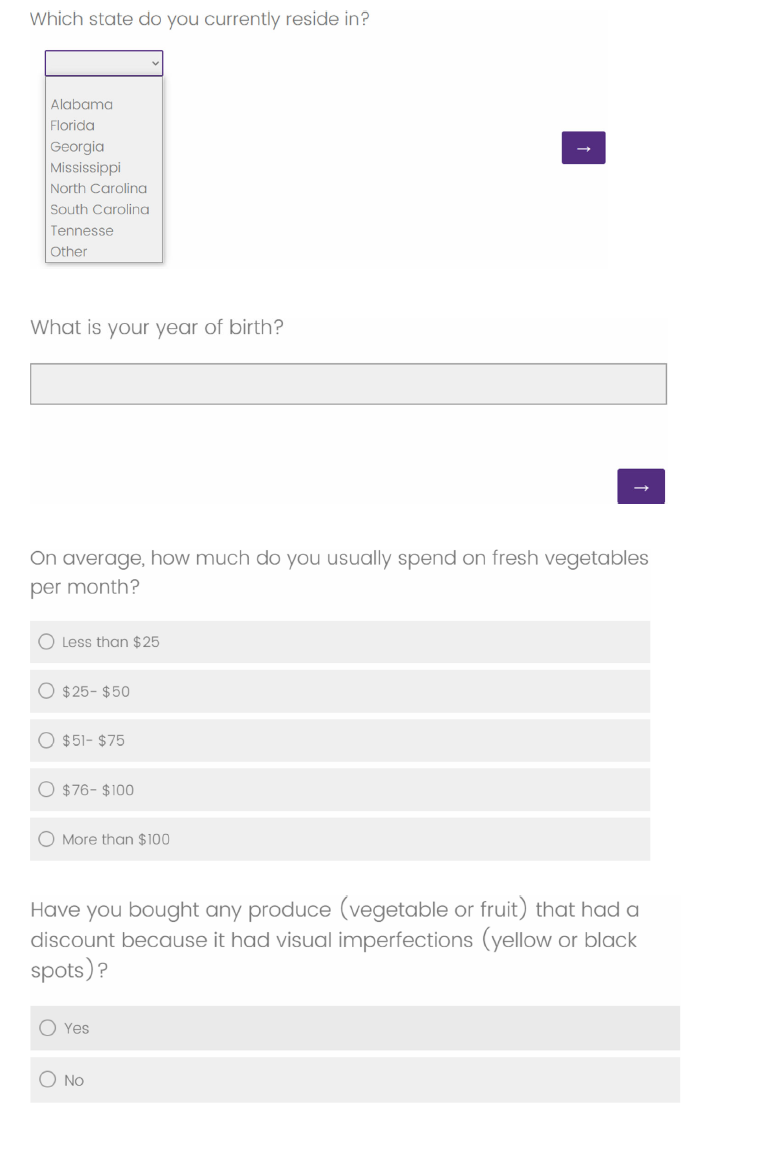
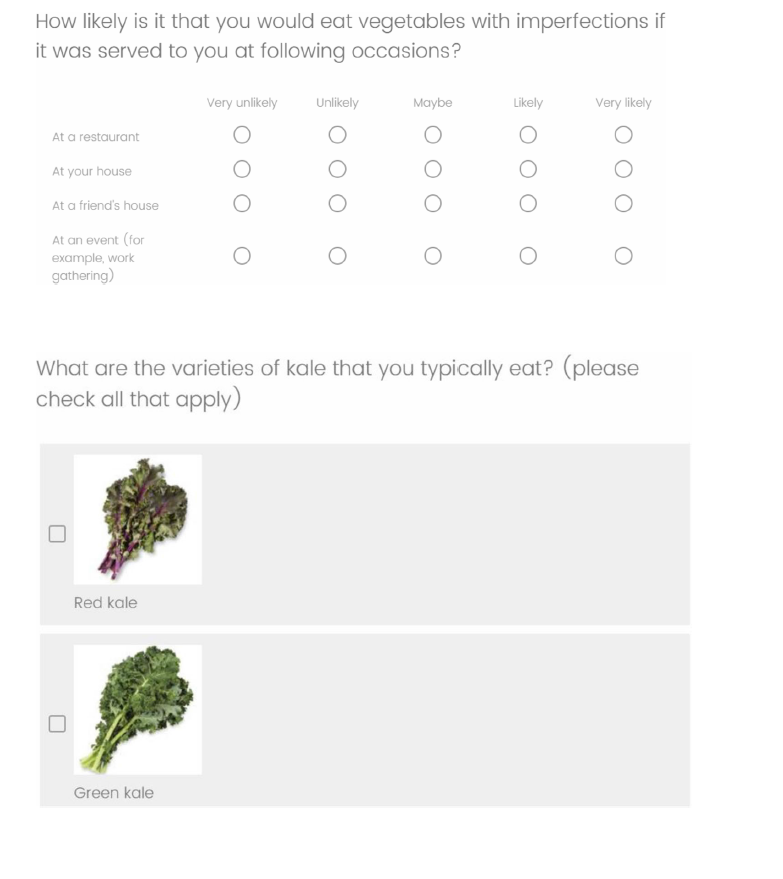
The final sample size included 802 responses from consumers in the Southeast region of the United States (Mississippi, Alabama, Florida, Georgia, South Carolina, North Carolina, and Tennessee). The survey instrument was divided into five sections. The first section included a set of screening questions; respondents who indicated that they lived in the Southeast U.S., were born before 2003, are the primary grocery shopper for their household, and that they buy vegetables every month were eligible to complete the survey. Also included in this section was a question on the varieties of kale consumers typically eat. Response options included red kale, green kale, kale lacinato/Tuscan, and/or “other (please specify).” “I do not eat kale” was a response option for this question as well. The second part of the survey instrument focused on respondents’ perceptions, purchasing habits, and knowledge of organic products. To assess consumer knowledge, the survey asked respondents if they had heard of the term “organic food products,” if they were familiar with common food attribute labels, and their reasonings for purchasing organic food products.
Following Umberger et al. (Reference Umberger, Thilmany McFadden and Smith2009) and Verhoef (Reference Verhoef2005), payment cards were utilized to evaluate consumer WTP for VI organic kale in the third section of the survey. The final two sections of the survey instrument explored participants’ dining preferences at restaurants and their demographic information.
2.1.1. Description of the payment card design
In the payment card, participants were presented with two pictures of kale products. The first picture included a bunch of healthy leaves, while the second one included leaves with visual imperfections. Two levels of visual imperfection were included (2% and 10%).Footnote 6 Consumers were presented with eight bid intervals, with the highest bid set at $1.33 per bunch and subsequent bids decreasing by 4% increments.Footnote 7 Participants were asked to select the amount they thought it is reasonable to pay for the VI kale and the maximum amount they would pay. Participants were also able to select an option stating, “I would not buy kale with VI.” The variety used in the payment cards was “green kale” given that it is the most widely consumed variety. Nearly 74% of the consumers in our sample indicated that they eat green kale.
Survey participants were divided into two groups and were provided with eight payment card questions. While the content of the payment cards was similar for both groups, the first group received cards with arrows highlighting kale imperfections, while the second group did not (Figure 1). The arrows were incorporated to test whether explicitly highlighting visual imperfections impacted consumer WTP.
Payment cards WOA and WA.

Among the eight payment cards, four cards displayed a bunch of kale where three out of five leaves exhibited visual imperfections covering 2% of the leaf surface area. The remaining four cards included a bunch of kale in which three leaves from a bunch of five leaves had 10% of the leaf surface area affected by visual imperfections. The difference between the two blocks allowed us to test how increasing the imperfection level from 2% to 10% alters purchasing behavior and price selection.
The first payment card served as the status quo, in which no additional information was given. The second payment card was identical to the status quo, except that it contained a statement claiming that the kale was safe to eat (WAS and WOAS). The third payment card was also identical to the status quo, but contained a statement claiming that the kale was grown locally (WAL and WOAL). Lastly, the fourth payment card stated that the kale was both safe to eat and grown locally (WASL and WOASL).Footnote 8 The payment cards were presented to respondents in a randomized order. The differences in WTP between the four payment cards allowed us to test how statements about locality of production and/or food safety impact consumer WTP. Table 1 summarizes the respective treatment of each payment card.
Description of the payment card treatments explored in our survey

Note: WOA (1) represents the treatment “without arrow,” WOAS (2) represents the treatment without arrows and safe to eat, WOAL (3) represents the treatment without arrows and locally grown, and WOASL (4) represents the treatment without arrows, safe to eat, and locally grown. WA (5) represents the treatment with arrows, WAS (6) represents the treatment with arrows and safe to eat, WAL (7) represents the treatment with arrows and locally grown, and WASL (8) represents the treatment with arrows, safe to eat, and locally grown.
After the last payment card, respondents were asked a follow-up question soliciting their opinion on the percentage of the leaf damage. Then, consumers were informed of the exact percent of leaf area affected by imperfections. The respondents were then prompted to answer another payment card, which allowed us to analyze how information on the level of imperfection impacts WTP. The presence of arrows on the postanalysis payment card was kept consistent with the response block that each respondent was in through the payment card section.
2.2. Data
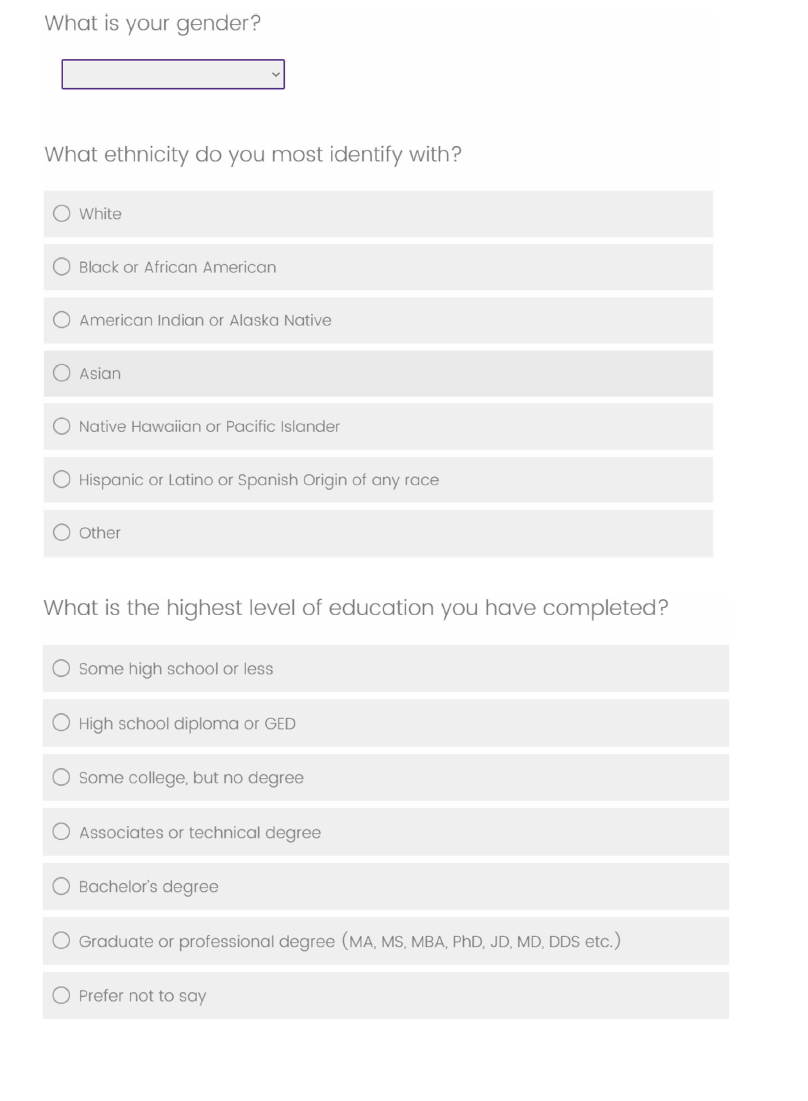
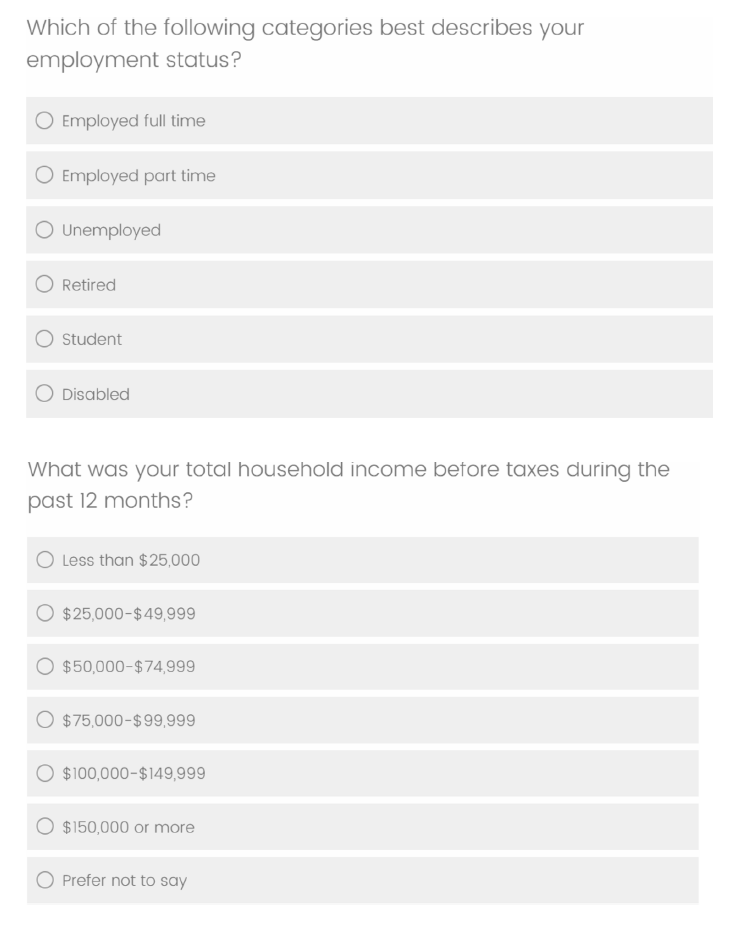
A comparison of the demographic characteristics of the survey participants and the demographics of the population in the focus region is presented in Table 2. The sample composition of states is similar to the population metrics based on the American Community Survey (2021), with participants from Florida constituting the highest percentage of our sample and Mississippi constituting the lowest.
Respondent summary statistics

Females are overrepresented in our sample. However, this is not uncommon for WTP studies of food products as females are most commonly the primary grocery shoppers in households (Grannis and Thilmany, Reference Grannis and Thilmany McFadden2002). The racial composition of the population is 56.9% White, 21.1% Black, and 14.6% Hispanic or Latino (Decennial Census, 2020), which is comparable to our sample composition. The median age of our sample is 34 years old, which is a few years lower than the median age of the analyzed states (American Community Survey, 2021).
Educational attainment is comparable to the regional averages of 20.0% for a bachelor’s degree and 12.4% for a graduate or professional degree (American Community Survey, 2021). Full employment status of the population is 56.3% and the unemployment rate is 3.3% (American Community Survey, 2021), and 45.9% of our sample is employed full time and 12.0% is unemployed. Respondents also had the option of selecting if there were retired, students, disabled, or employed part time. These individuals collectively constituted 42.1% of our sample. Of our sample, 73.9% typically eat green kale, 25.3% typically eat red kale, 12.8% typically eat kale lacinato/Tuscan, and 1.4% typically eat an unlisted kale variety.Footnote 9
2.3. Empirical strategy
In the payment cards, respondents had the option of selecting one of eight price bids or to indicate that they were not willing to purchase the kale. This format yielded two dependent variables: whether the consumers prefer to purchase VI kale, and for the consumers who do purchase, the price decision on the payment card (WTP i ).
We modeled the two dependent variables in separate regressions.Footnote
10
A probit analysis modeled the dependent variable bought or not (BON
i
). We considered three sets of independent variables – X, Z, and T. ${\bf X}$
is a vector of variables capturing respondent demographics,
${\bf X}$
is a vector of variables capturing respondent demographics, ${\bf Z}$
is a vector of variables capturing lifestyle variables, and
${\bf Z}$
is a vector of variables capturing lifestyle variables, and ${\bf T}$
is a vector of dummy variables capturing the seven payment card treatments discussed above. All variables were included as binary dummy variables with the exception of age and state of residence. These variables allow us to determine how their respective capacities affect the purchasing decision and/or WTP.
${\bf T}$
is a vector of dummy variables capturing the seven payment card treatments discussed above. All variables were included as binary dummy variables with the exception of age and state of residence. These variables allow us to determine how their respective capacities affect the purchasing decision and/or WTP.
To capture the treatment effect, ${\bf T}$
, seven dummy variables were included (Table 1). The status quo without arrows (WOA) was chosen as the reference treatment (control). We expected treatments with greater information to have a positive marginal effect on WTP. An ordered probit analysis modeled price selection on the payment card. The independent variables are kept the same as in the prior probit analysis. The dependent variable accounts for all eight price levels as they decrease from $1.33 to $0.96 by 4% increments. To capture potential correlation, the standard errors are clustered at the respondent level.
${\bf T}$
, seven dummy variables were included (Table 1). The status quo without arrows (WOA) was chosen as the reference treatment (control). We expected treatments with greater information to have a positive marginal effect on WTP. An ordered probit analysis modeled price selection on the payment card. The independent variables are kept the same as in the prior probit analysis. The dependent variable accounts for all eight price levels as they decrease from $1.33 to $0.96 by 4% increments. To capture potential correlation, the standard errors are clustered at the respondent level.
We employed nested regression models to examine how the addition of different vectors of variables impacts regression results, specifically the treatment variables (Allen, Reference Allen1997). This process was completed for both the probit and ordered probit regressions. A total of four regressions were performed for each decision stage (probit and ordered probit). In the first regression, only the payment card treatment vector ( ${\bf T}$
) was included as independent variables. To test whether the marginal effects of treatments change as we add respondent characteristics, the second regression added the demographic variable vector (
${\bf T}$
) was included as independent variables. To test whether the marginal effects of treatments change as we add respondent characteristics, the second regression added the demographic variable vector ( ${\bf X}$
). A third regression added the lifestyle variables vector (
${\bf X}$
). A third regression added the lifestyle variables vector ( ${\bf Z}$
) aiming to test whether the treatment variables were capturing respondent lifestyle decisions. A final fourth regression was estimated that included dummy variables for the state of residency in addition to the three other variable vectors that sought to capture respondent characteristics intrinsic to a given state. In all eight regressions, standard errors were clustered at the respondent level. The accuracy of the nested regressions was compared by Akaike information criterion (AIC) values. Likelihood ratio (LR) testsFootnote
11
between the models were conducted as well.
${\bf Z}$
) aiming to test whether the treatment variables were capturing respondent lifestyle decisions. A final fourth regression was estimated that included dummy variables for the state of residency in addition to the three other variable vectors that sought to capture respondent characteristics intrinsic to a given state. In all eight regressions, standard errors were clustered at the respondent level. The accuracy of the nested regressions was compared by Akaike information criterion (AIC) values. Likelihood ratio (LR) testsFootnote
11
between the models were conducted as well.
3. Results
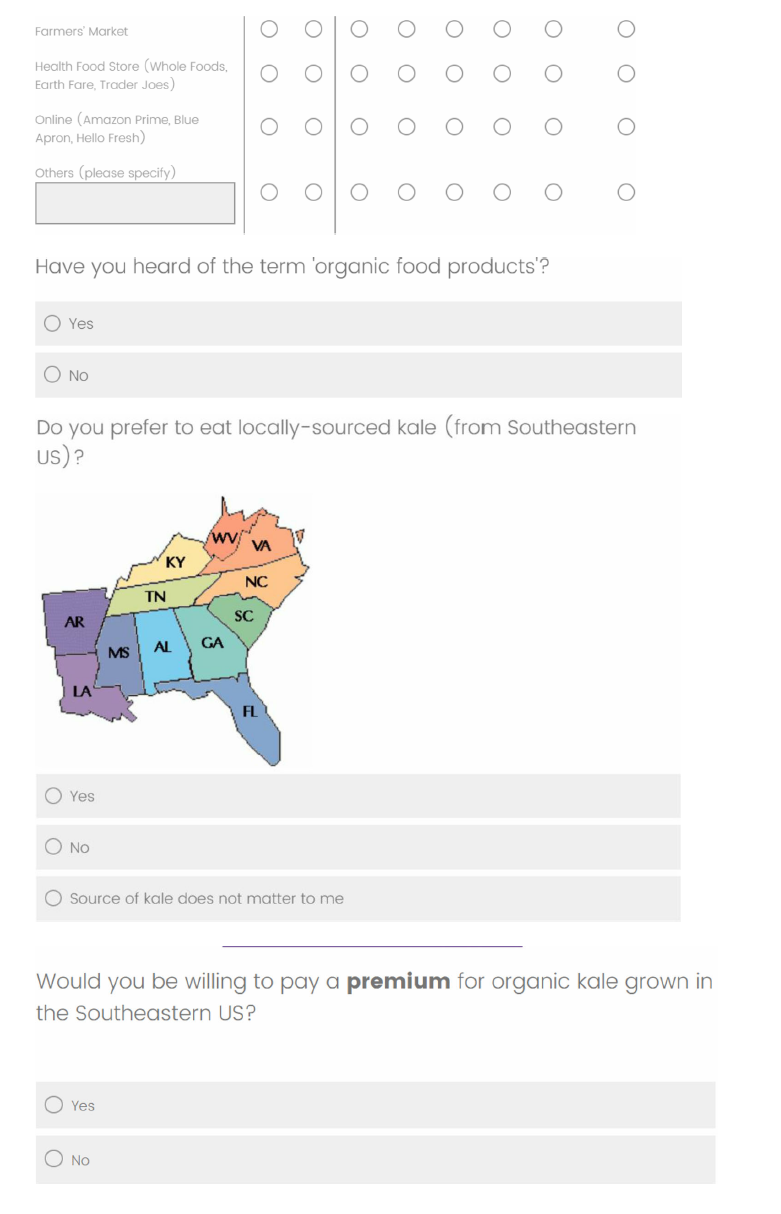
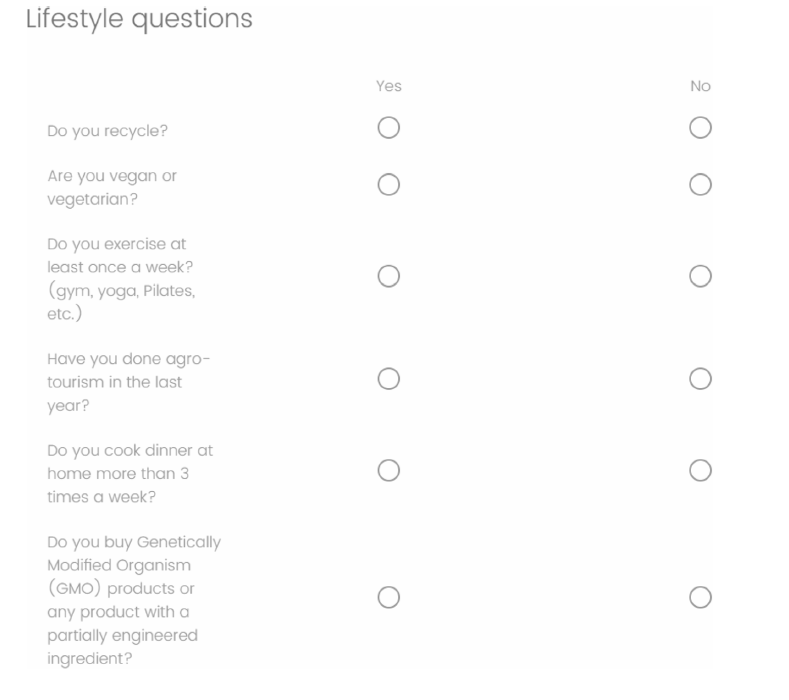
Regarding respondents’ food consumption habits, 79.8% indicated that they have purchased at least one variety of kale before,Footnote 12 and 13.9% indicated that they follow a vegetarian or vegan diet. The overwhelming majority (96.3%) were familiar with the term “organic food product.” On eating locally sourced kale, 54.9% of the respondents preferred local kale, 11.6% did not prefer local kale, and 33.5% were indifferent to whether kale was grown locally or not.
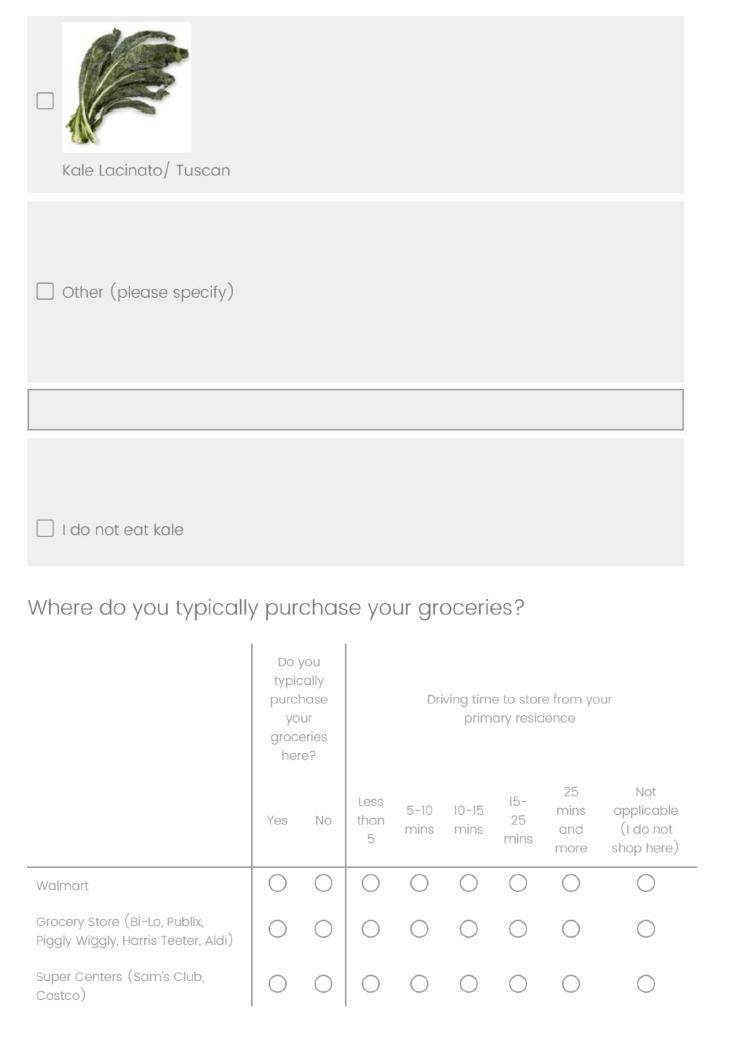
Respondents were also asked if they were willing to pay a premium for organic kale grown in the southeastern U.S., and 49.9% indicated they were willing to do so. Around 40% of the respondents regularly purchase groceries from farmers markets, 33.3% from health food stores, and 20.9% regularly purchase groceries from both of these markets. Respondents purchased groceries from other markets at the follow percentages: 81.7% at Walmart; 74.6% at grocery stores; 46.9% at super centers; 24.3% online; and 17.21% from other markets. Approximately 44% of survey participants had purchased discounted VI produce before. More than 52% of respondents indicated that they were very likely or likely to eat VI produce at home, while 23.6% of respondents indicated that they were unlikely or very unlikely to do so. Lastly, 40.6% of the sample spent more than 51 dollars per month on fresh produce. The above results that are attributed to variables included in the regression models are summarized in Table 3.
Food consumption habits

On average, 85% of respondents indicated that they would purchase VI organic kale in the payment cards, ranging from 84.10% under WAS treatment to 85.79% in WOAS treatment, at the 2% imperfection level. The average WTP for the 2% imperfection level across all payment cards is $1.12 and the standard deviation is 0.123. This is approximately 21 cents cheaper than the median retail price of a bunch of kale in the Southeast from January to February 2022 (USDA, 2022). The average WTP per payment card ranges from a low of $1.112 on payment card WA to a high of $1.129 on payment card WOA, a difference of only 1.7 cents. Table 4 depicts the share of respondents that selected each price level by treatment at the 2% imperfection level. Results from the 10% imperfection level analysis are found in the appendix.
Table 5 breaks down WTP selected on payment card WOA at the 2% imperfection level by demographics. WTP is grouped into three levels: high, medium, and low. The high category includes price bids $1.33 and $1.28; the medium category includes price bids $1.22, $1.17, and $1.12; the low category includes price bids $1.06, $1.01, and $0.96; did not buy is included in the table as well. The pattern of price selection across the demographics is generally consistent, with most individuals typically selecting the low category of price bids. Notable exceptions to this pattern are that a greater proportion of males are likely to select the high price bids compared to females, and that a greater share of individuals with household incomes of less than $75,000 selected the high and medium price bids compared to individuals with household incomes of greater than $75,000. The consistency of preferences extends across states of residence with the exception of Mississippi. However, Mississippi residents constitute the lowest representation in the sample by state of residence.
Price selected by payment card, 2% imperfection level

Note: Total respondent number for the WOA response block (columns 2–5) is 387. Total respondent number for the WA response block (columns 6–9) is 415.
WTP category selected by demographics for payment card WOA

Note: The high WTP category includes price bids $1.33 and $1.28; the medium WTP category includes price bids $1.22, $1.17, and $1.12; the low WTP category includes price bids $1.06, $1.01, and $0.96; did not buy is included as well.
Based on the AIC and the LR test, model P4, which included the state of residence dummy variables, provides the best fit at both the 2% and 10% imperfection levels for the probit analysis. On the other hand, model O3, which excluded the state of residence dummy variables, provided the best fit at both the 2% and 10% imperfection levels for the ordered probit analysis. Thus, the results from models P4 and O3 are interpreted at both levels of imperfection.
3.1. Purchase or not purchase?
The regression results from the nested probit models (both the estimated coefficients for models P1, P2, P3, and P4, and the marginal effects for model P4) for the 2% imperfection level are found in Table 6. The findings indicate that older consumers are less likely to purchase VI kale. Those who have bought VI produce before and those that stated they are very likely or likely to eat VI produce at home are more likely to purchase VI kale. Also, those who are willing to pay a premium for organic kale grown in the southeastern U.S. and those who prefer local products are more likely to purchase VI kale. Lastly, South Carolina residents are more likely to purchase VI kale.
Probit regression results, 2% imperfection level

*p < 0.1; **p < 0.05; ***p < 0.01. Data represent the beta coefficients of the nested probit models. 3,208 observations.
None of the payment card treatments are statistically significant in any of the models. Thus, it is concluded that the treatments do not impact respondents’ purchasing decision of VI kale at this level of imperfection.
3.2. WTP ordered probit models
The regression results from the nested ordered probit models on the kale with a 2% imperfection area are presented in Table 7. The findings from model O3 are interpreted in this section (model 3 is interpreted in the ordered probit regressions based on the results of the AIC and the LR test). Only a few of the treatments, respondent characteristics, and response variables are statistically significant. The payment card WOAL (3) was statistically significant at 10% and payment card WA (5) was significant at 5%. Both treatments had negative coefficients.
Ordered probit regression results, 2% imperfection level

*p < 0.1; **p < 0.05; ***p < 0.01. Data represent the beta coefficients of the nested ordered probit models. 2,712 observations.
We found that female respondents are more likelyFootnote 13 to select a lower price on the payment card than males. Also, respondents willing to pay a premium for organic kale grown in the Southeastern U.S. and who follow a vegan or vegetarian diet are more likely to select a higher price on the payment card.
3.3. Analysis of 10% VI organic kale
We conducted the same analyses on the payment cards with the 10% imperfection level. The mean WTP selection on the payment cards ranged from $1.095 to $1.112, which is slightly less than the average price selections from the 2% imperfect kale. Consistent with the findings for the 2% VI, none of the payment card treatments significantly impacted the purchasing decision (probit regression). The same independent variables as in the 2% VI probit analysis were found to be significant in the fourth regression, with the addition of respondents who frequently shop at health food stores and Mississippi residents. The same independent variables (excluding Mississippi) were significant in the 10% VI ordered probit analysis, with the addition of consumers who were aware of the definition of organic, which had negative coefficient. However, the ordered probit regression revealed significant variations between the treatment effects. Treatments WOAS (2), WA (5), WAS (6), and WAL (7) were statistically significant in the fourth regression, and all had negative coefficients.
One of the treatments, with arrow (WA5), was statistically significant at both VI levels. We depicted the marginal effects in Figure 2. The effects on probability are very similar between the imperfection levels. Both margin plots reveal that consumers are more likely to select lower prices compared to the base payment card that lacked arrows.
Marginal effects of “arrows” at the 2% and 10% imperfection levels.

3.4. Pre-post analysis
The statically insignificant results of the dummy variables on treatments and the marginal effects raise the question as to whether explicit information on the amount of imperfection would affect the WTP. Therefore, the effect of informing respondents of the exact percentage of leaf area impacted by imperfections on WTP was examined using a simple pre-post analysis. This analysis was only conducted with the 10% visual imperfect kale payment cards in both the with arrow and without arrow response blocks. We first asked respondents to estimate the level of VI in the picture shown in the 10% VI payment cards. Then, we inform them of the true VI level. In the “with arrow” response block, 25.30% of the respondents selected the correct VI level; 26.36% of respondents selected the correct VI level in the “without arrow” response block. Then, we asked them to provide their WTP for 10% VI organic kale if they initially chose to purchase it. Many respondents did not alter their WTP after the information was presented: 57% respondents who reported a WTP of $0.96 to payment card WOA (1) reported the same WTP post-information. In the arrow treatment block, 52% respondents who originally selected $0.96 on payment card WA (5) did so again.
However, there were some substantial shifts in WTP after the imperfection information was presented. In the without arrows response block, 45.6% of respondents who did not previously purchase did so after the imperfection rate was presented; 32.8% of respondents who had previously chosen to purchase did not purchase after the imperfection rate was presented. Likewise, in the arrow response block, 33.3% of respondents flipped from not purchasing to purchasing and 28.8% of respondents flipped from purchasing to not purchasing after the imperfection rate was presented.
3.5. Profitability analysis
We perform a profitability analysis using the mean price selection for respondents who chose to purchase on the control payment card (WOA) at the 10% imperfection level. Mean price selection was determined to be $1.10, which implies that consumers, on average, expect a $0.23 discount to purchase organic kale with this imperfection rate.Footnote 14 An organic kale producer indicated to us in conversation that they anticipate that, on average, 10% of kale goes unharvested due to visual imperfections. Based on a Clemson University (CU) Enterprise budgetFootnote 15 on conventional and organic kale, farmers received, on average, $0.58 per bunch of organic kale and produce a yield almost 17 thousand non-VI bunches per acre.Footnote 16 We assume that the farmer would receive a price per bunch of $0.35 for VI organic kale given the results from our payment card analysis. If 10% of kale bunches remain unharvested because of imperfections, this represents a lost yield of an estimated 1,860 bunches. Therefore, at the discounted price we estimate an unrealized gross revenue of $651 per acre. Total harvest and post-harvest costs per acre add to $3,552.24 per acre, resulting in an additional cost of $393.58Footnote 17 per acre to harvest the VI kale. Then, the estimated profit per acre of harvesting VI organic kale with VI rates between 2% and 10% is $257.42 per acre. Provided they have access to the markets that are willing to sell VI organic kale, these estimates using the WTP results and CU budget indicate that there are unrealized profits.
4. Discussion and conclusions
Every year, a substantial amount of food production is not harvested because of cosmetic regulations in grocery stores and consumers reluctance to purchase VI produce. This phenomenon accentuates the negative externalities associated with agriculture and represents lost economic opportunities. However, recent efforts have been made in marketing VI food products. For example, grocery stores have started selling fresh produce and vegetables that are misshapen or have other visual imperfections. Nevertheless, there is limited research examining consumers’ preferences and WTP for leafy green vegetables with visual imperfections. We extend this literature by examining consumer WTP for organic kale with visual imperfections using data from an online survey instrument (n = 802).
Results from the purchase decision (probit model) and pricing decision (ordered probit) indicate that none of the messaging techniques increase the likelihood of purchase or lead to a higher WTP. This finding differs from the results of other WTP studies on VI produce found in the literature (Grewal et al., Reference Grewal, Hmurovic, Lambertin and Reczek2018; Hartmann et al., Reference Hartmann, Jahnke and Hamm2021). We find that in some cases messaging lowered reported WTP. While a majority of studies examining the WTP for organic food products found locality of production to have a significant increase on WTP, the finding is not unanimous in the literature (Katt and Meixner, Reference Katt and Meixner2020). The impacts of food safety concerns on WTP for organic foods are less clear (Katt and Meixner, Reference Katt and Meixner2020). There is a scarcity of research on consumer WTP for VI and/or organic leafy green vegetables. It is plausible that the factors affecting consumer WTP for these products differ from other more heavily studied VI foods, such as carrots or potatoes. Addition research examining WTP for VI/organic leafy green vegetables will better elucidate the factors that affect consumer WTP for these products.
The implication of the finding that messaging on safety and locality of production do not increase reported WTP is notable for potential markets of VI organic kale. Caution should be practiced when investing in messaging, labels, or marketing techniques that highlight the safety of consumption or localness of production for this product.
We also find that highlighting the specific areas of imperfections reduces reported WTP. In a supermarket setting, sellers would not be able to use arrows to highlight the areas of imperfections on a kale leaf. While it would be feasible for online grocers to highlight imperfections, our results indicate that this approach may not be necessary. The results derived from the pre-post information analysis confirm this finding. When faced with the exact knowledge of the level of imperfection, most consumers altered their price selection by either a small margin or not at all. While some consumers switched their purchasing decision after the information was presented, a nearly even amount switched from buying to not buying and vice versa.
Prior purchases of VI produce and a stated willingness to eat VI produce at home are found to significantly increase the likelihood of purchasing VI organic kale. These findings highlight the importance of initial exposure to VI produce to ensure continued acceptance of these products. The ambiguity of the term “produce” is crucial in this analysis: respondents did not have to have previously purchased VI organic kale specifically or be willing to eat only VI organic kale at home to be more likely to purchase VI organic kale. This indicates that experiences with any type VI produce will likely increase the probability of purchase for a variety of other types of VI produce. Therefore, our findings demonstrate the importance of gaining consumer acceptance toward any type of VI produce. Programs that educate the public about VI produce, provide free samplings of VI produce, and/or encourage the serving of VI produce in restaurants and/or grocery stores can potentially increase overall acceptance of these products.
We did not determine WTP for VI organic kale to be higher among respondents who frequently shop at farmers markets or health food stores. These respondents were also not found to be more likely to purchase VI organic kale. However, we did find that respondents with vegan or vegetarian dietary preferences had a higher WTP for VI organic kale. This has a significant implication on marketing techniques for VI organic kale. Selling VI organic kale in stores that specifically cater to consumers with vegan/vegetarian dietary preferences or in aisles of larger grocery stores featuring other plant-based food items could be a successful strategy toward increasing VI organic kale sales.
The results from our profitability analysis indicate that it can be profitable for organic kale producers to harvest and sell organic kale with VI rates between 2% and 10% at the price point preferred by survey participants. Thus, even if farmers are unable to sell this kale through grocery stores because of cosmetic standards, they are recommended to sell directly to consumers through farmers markets and/or other markets.
There are several limitations to our work that we would like to address. A potential source of bias in our sample may have been caused by screening for participants who stated that they purchased vegetables at least once a month. This strategy may have resulted in sample that is more health conscious and more environmentally aware than the general population of the S.E. United States. It is feasible that the prices and availability of substitute products affect WTP for organic VI kale; unfortunately, the payment card methodology does not allow us to directly capture this potential effect. Future research should consider alternative ways of estimating WTP that allows researchers to account for substitutes.
The online format of our survey did not allow us to capture how physical factors other than appearance (such as taste) affect WTP. While studies indicate that results from in-person and online data collection do not differ considerably (Lindhjem and Navrud, Reference Lindhjem and Navrud2011), future research should consider testing whether this has any impact on WTP for VI produce.
Future research could further examine WTP for VI produce using latent class models. The model would allow researchers to determine expenditure share on imperfect produce across different demographics, which would aid markets in identifying consumers most willing to pay higher prices for VI produce.
Data availability statement
Data can be provided by the corresponding author upon request.
Author contribution
Conceptualization, S.B., F.S., M.V., and J.U.
Methodology, S.B., F.S., and M.V.
Formal analysis, S.B., F.S., and M.V.
Data curation, S.B., F.S., and M.V.
Writing – original draft, S.B.
Writing – review and editing, S.B., F.S., M.V., and J.U.
Supervision, F.S. and M.V.
Funding acquisition, F.S. and M.V.
Financial support
This work was supported by the USDA National Institute of Food and Agriculture, the Organic Transitions Program (Award Number: 2021-51106-35495).
Competing interests
The authors have no competing interests.
Appendix
Price selected by payment card, 10% imperfection level

Note: Total respondent number for the WOA response block (columns 2–5) is 387. Total respondent number for the WA response block (columns 6–9) is 415.
A.1. Survey questions from which variables were derived


 Open access