

1. Introduction
Direct measurements of mass balance do not extend far back in time: the longest uninterrupted series, that of Storglaciären, Sweden, begins in 1946. It may thus be worth trying to reconstruct the mass balance of the period before measurements started. Knowledge of the historical variations in mass of some selected glaciers helps us to understand their present variations, as well as suggesting the variations of unmonitored glaciers in the same area (Reference Reynaud, Vallon, Martin and LetréguillyReynaud and others, 1984; Reference Letréguilly and ReynaudLetréguilly and Reynaud, 1990).
Glacier de Sarennes is one such well-monitored reference glacier for the French Alps. Its mass balance has been measured since 1949 (Reference VallaValla, 1996), and has been extended back to 1882 by Reference MartinMartin (1978). Reference MartinMartin (1978) used a statistical method to find a relation between annual mass balance and meteorological parameters (temperature and precipitation).
This also has been done for a number of other glaciers: Rhone-, Limmern- and Plattalvagletscher and Clariden Gletscher in Switzerland (Reference Chen and FunkChen and Funk, 1990; Braun, 1994; Müller-Lemans and others, 1995), Wurtenkees and Hintereisferner in Austria (Reference HammerHammer, 1996; Reference SchlosserSchlosser, 1996), and glaciers in New Zealand (Reference Woo and FitzharrisWoo and Fitzharris, 1992), North America (Reference TangbornTangborn, 1980) and the former Soviet Union (Reference Mikhalenko and SolominaMikhalenko and Solomina, 1996). The Martin reconstruction can now be improved by including the last 20 years of mass-balance measurements, and by taking into account surface albedo variations during the ablation period (Reference Vincent and VallonVincent and Vallon, 1997), which is made possible by the frequent mass-balance measurements available during each summer (see section 4). Meteorological time series may be century-long, and their link with mass-balance records (even distant ones) has long been recognized (Reference Chizhov and KoryakinChizhov and Koryakin, 1962). Hence, for practical rather than physical reasons, meteorological data are used here as predictors for mass-balance reconstruction.
In addition, we evaluate the confidence that can be placed in such a series by testing its temporal stability for different calibration periods, and by comparing it to volumetric changes calculated from maps.
2. Description of the Glacier and Meteorological Stations
2.1. Geographical situation
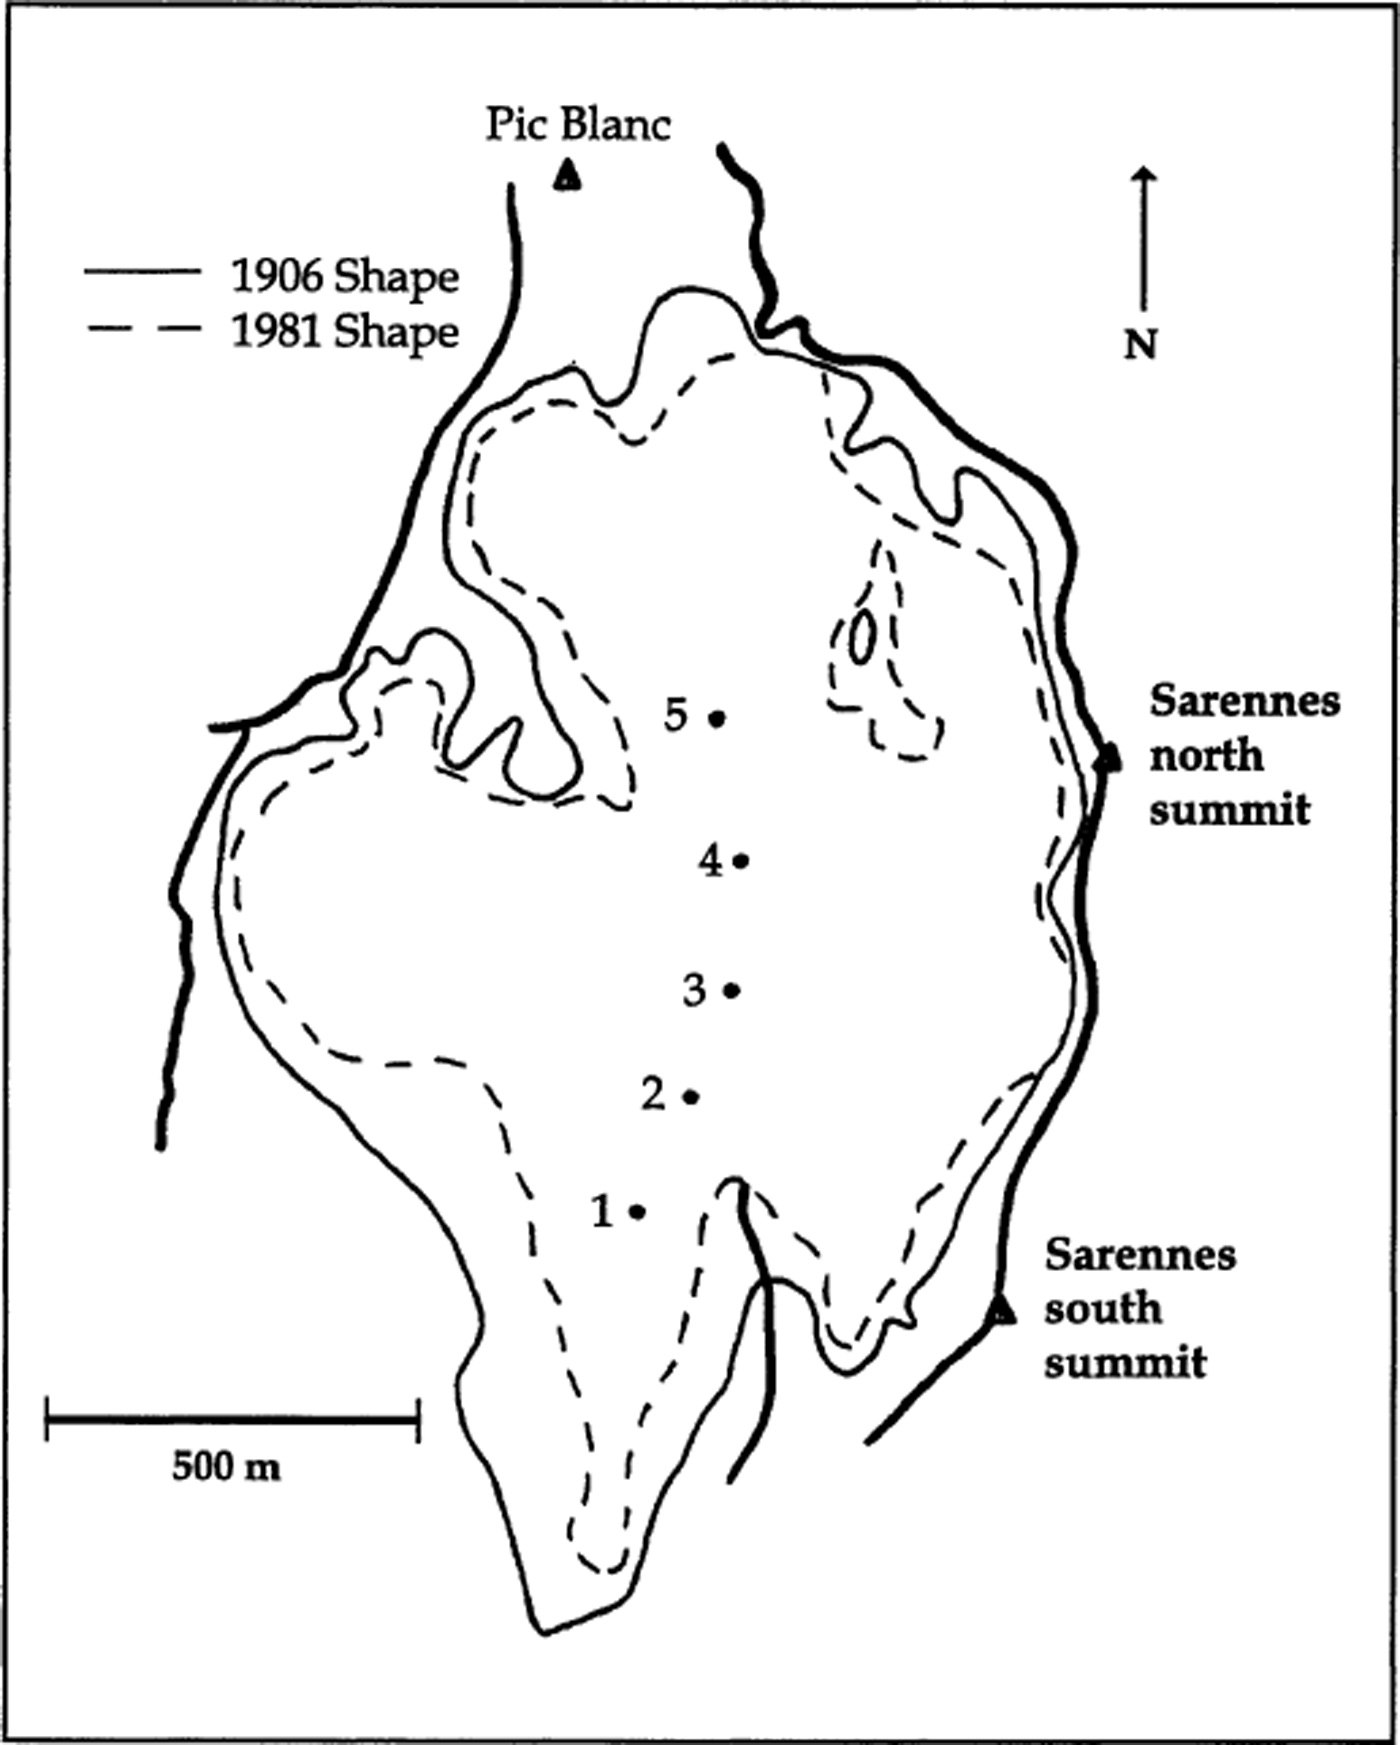
Glacier de Sarennes is part of the Massif des Grandes Rousses near Grenoble (45°10′ N, 6°10′ E; Figs 1 and 2). Its accumulation/ablation area is situated at approximately 3000 m a.s.l., and the glacier faces south. It is a small cirque glacier of 0.8 km2 with very little ice flow, and is situated below its average equilibrium line over the past five decades.
Map showing the locations of Glacier de Sarennes and the meteorological stations used.

Map showing the extent of Glacier de Sarennes. Thin solid line: perimeter of the glacier in 1906. Thin dashed line: perimeter of the glacier in 1981. Thick lines: mountain ridges surrounding the glacier. Dots 1–5: permanent balance-measurement locations.
2.2. Mass-balance data
The mass balance of Glacier de Sarennes is measured using direct glaciological methods by Reference VallaValla (1989, Reference Valla1996): accumulation is obtained by means of core drillings through the winter snowpack, and ablation by means of stakes drilled in the ice at five fixed sites along the glacier (see Fig. 2). The glacier is visited about twice a month during summer, from May to the first lasting snowfall in autumn (usually September), so the mass-balance evolution as well as the state of the glacier surface (snow or ice for albedo variation) are known during the ablation period. For our reconstruction, we used only the data of the measurement station at 2940 m a.s.l. (station 3, Fig. 2), which is the most regularly visited. It has a central position on the glacier, which makes it representative of the average glacier surface state: its mass balance is very close to the average (−0.625 cm w.e. for the glacier, −0.685 cm w.e. for station 3, with a correlation coefficient of 0.97 between the two series).
2.3. Maps
The oldest available map of the Massif des Grandes Rousses dates from 1906 (Reference Flusin, Jacob and OffnerFlusin and others, 1909). More than 100 points were surveyed on the glaciers of this range, and a map at a scale of 1:10 000 was produced. Its estimated precision in elevation is 10 m.
During the measurement period, other maps were made of the glacier and its surroundings. We used that of the Sintégra office with aerial photographs from 1981, which includes the surrounding grounds that were ice-covered in 1906 and is also the most accurate (Reference VallaValla, 1982). Its scale is 1:5000, and the average estimated error in elevation is negligible compared with the 1906 map. For this work, we computed volumetric change using the 1906 and 1981 maps and also used those computed by Reference Valla and PiedalluValla and Piedallu (1997) for the 1906–59, 1959–81 and 1981–91 periods.
2.4. Meteorological data
The reconstruction method we use requires monthly winter and daily summer precipitation, and minimum and maximum daily temperatures. Existing long meteorological records within 150 km of the Grandes Rousses range are given in Table 1, and their location is shown in Figure 1. Besse-en-Oisans is the most interesting station, as it is closest to the glacier. The record starts in 1923 but includes precipitation only. As it is best correlated with winter balance observations performed on Glacier de Sarennes, it was retained as reference for glacier precipitation and extended back to 1907 and 1881 with the Bourg d’Oisans (r 2 = 0.71) and the Saint-Genis-Laval data (r 2 = 0.19), respectively. The low-lying (200 m a.s.l.) Lyon–Bron and Saint-Genis-Laval stations, both situated in the outer suburbs of Lyon at a distance of 120 km from the massif, were used for their maximum and minimum daily temperatures series. The Lyon–Bron station has uninterrupted, high-quality records starting in 1922, to which the Saint-Genis-Laval data are closely correlated (r 2 = 0.98 and 0.92 for maximum and minimum temperature, respectively).
Meteorological stations with long data series in the vicinity of the Grandes Rousses massif

In the following, we will use the precipitation data from Besse-en-Oisans, extended by means of the other stations (Bourg d’Oisans, 1907–20; Saint-Genis-Laval previous to that period), and the temperature data from Lyon–Bron, extended back to 1881 with the Saint-Genis-Laval data.
3. The Classical Method
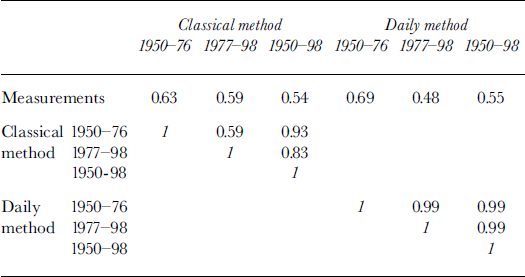
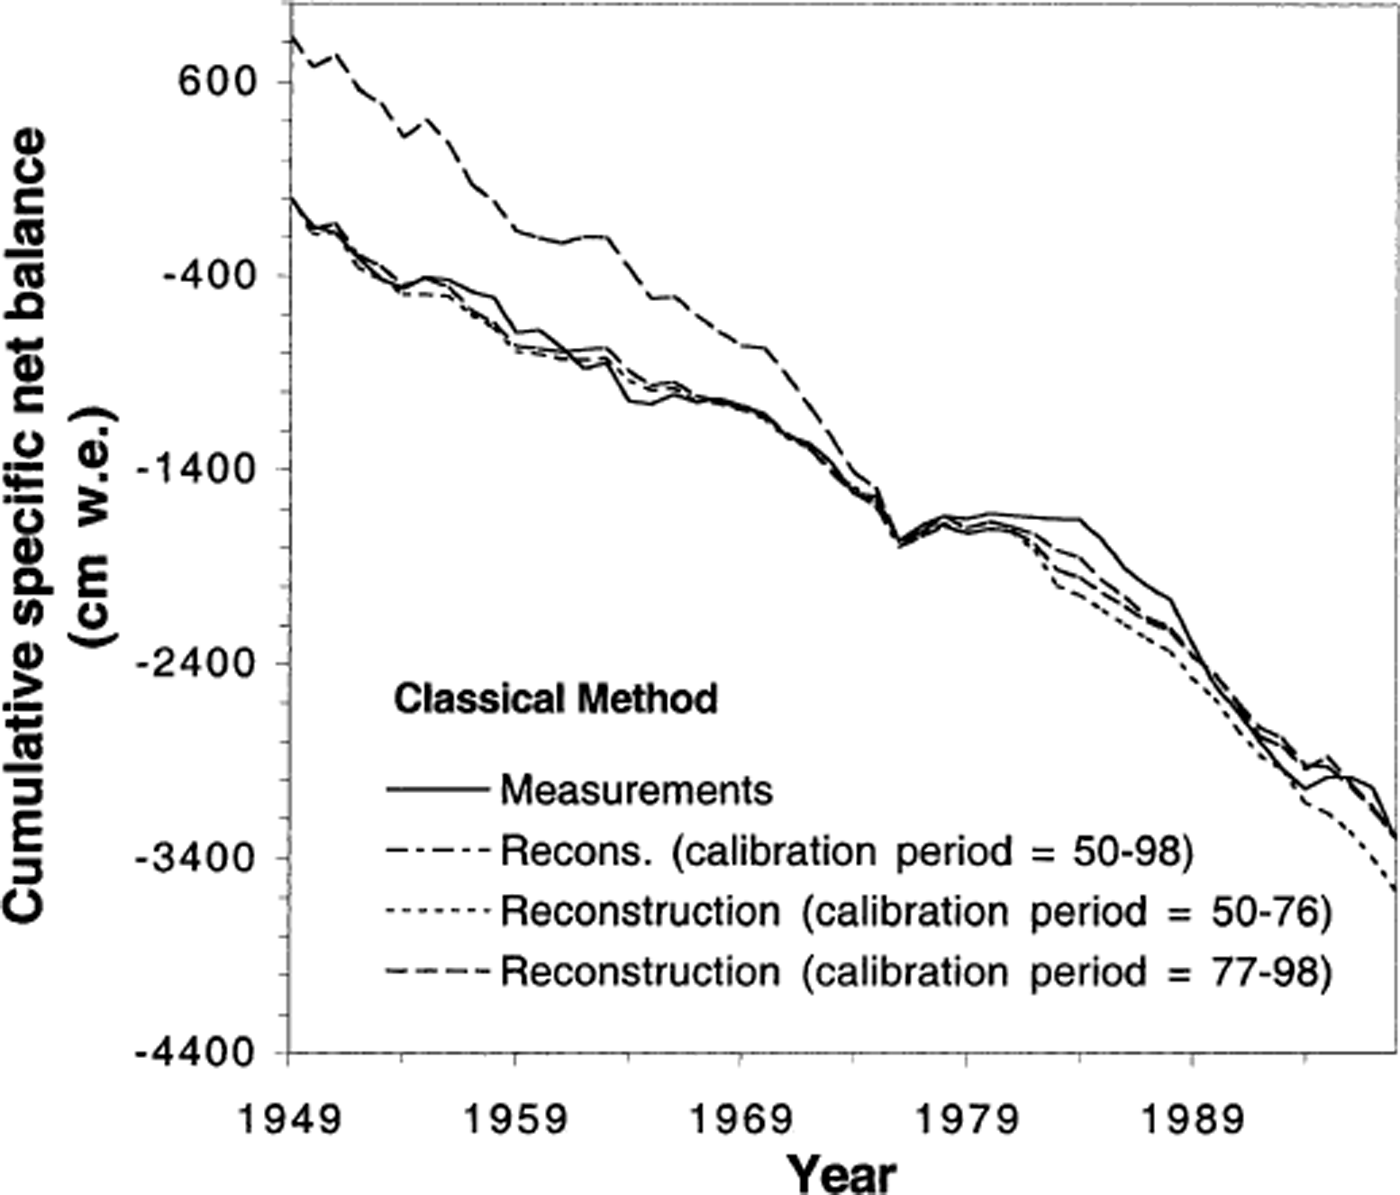
The classical method (e.g. Reference TangbornTangborn, 1980; Reference Chen and FunkChen and Funk, 1990; Reference Woo and FitzharrisWoo and Fitzharris, 1992; Reference BraunBraun and others, 1995; Müller-Lemans and others, 1995; Reference HammerHammer, 1996; Reference Mikhalenko and SolominaMikhalenko and Solomina, 1996; Reference SchlosserSchlosser, 1996) consists of finding a statistical relation between the summer mean monthly temperatures, winter cumulative monthly precipitation and the mass balance. As shown by Reference Vincent and VallonVincent and Vallon (1997) for Glacier de Sarennes, this relation does not produce good results for small climate variations such as the break in slope between the periods 1950–76 and 1977–98 (see Fig. 3). It also simulates average mass balance poorly: for the 1950–76 period, such a statistical relation explains only 63% of the variance, which decreases to 54% when the relation is established using the entire 1950–98 period (see Table 2). Martin’s (1978) relation explained 77% of the variance using the longer 1949–75 period together with a third parameter, June precipitation. However, the gain is mostly caused by the 1949 mass balance, an outlier. That value is dubious because of density-measurement incompatibilities, and we did not use it.
Sarennes cumulative specific net balance since 1950: measured mass balance and the results of the classical relation over the entire measurement period.

Variance explained (r2) for two methods and three calibration periods
4. The Daily Method
The daily method (Reference Vincent and VallonVincent and Vallon, 1997) separates the annual mass balance into three components: winter mass balance, summer snow ablation and summer ice ablation. Because snow and ice albedo are quite different (0.66–0.88 for melting snow and 0.34–0.51 for clean ice), solar melting is less efficient for snow than for ice. For each component, a linear relation is determined by means of a statistical regression with the cumulative winter precipitation, cumulative positive degree-days (PDD) during the snow ablation period, and cumulative PDD during the ice ablation period, respectively. Thus, mean albedo variations between snow and ice are taken into account through both linear relations.
4.1. Accumulation coefficient
Winter precipitation is obtained by cumulating all precipitation between October and May. Correlation between this variable and winter accumulation at Glacier de Sarennes indicates that 56% of the variance is explained. Figure 4 shows the resulting relation (all regression intercepts are set to 0 as no precipitation implies no accumulation).
Statistical relationship between winter accumulation and cumulative winter precipitation over the entire measurement period.

4.2. Ablation coefficients
In the reconstruction, the PDD for the summer period are calculated with the average daily temperatures from Lyon minus 16.5°C (corresponding to a 0.6°C per 100 m temperature gradient), starting on 1 May and ending on 31 October. In that way, the beginning (or ending) of the modelled ablation period is free to vary and depends on the first (or last) occurrence of positive temperatures on the glacier. In practice, as the average daily temperatures of May are often below zero, they seldom contribute to the ablation. The positive temperatures at the beginning of the ablation period are used to melt the winter snow until zero balance is reached. The PDD of the remaining ablation period are then used to melt the ice at a different rate.
The melt rate for snow (Fig. 5) was obtained by a regression between the measured snow ablation and the PDD cumulated over the real period of snowmelting (dates determined by the ground surveys of station 3). The melt rate for ice (Fig. 6) was calculated in a similar manner. The ratio of ice and snow melt rates is 1.40, meaning that the ice melts close to one and a half times faster than the snow on Glacier de Sarennes under similar temperature conditions, as a result of albedo contrasts explained at the beginning of this section.
Statistical relationship between snow ablation and cumulative average temperature over the same period.

Statistical relationship between ice ablation and cumulative average temperature over the same period.

4.3. Corrections
Refreezing is ignored in the model, as the amounts involved on Glacier de Sarennes are very low compared to the mass-balance terms (personal communication from Reference Vincent and VallonC. Vincent, 1999). The summer snow is simulated by counting all daily summer precipitation with a negative temperature as snow, which is then melted at the snowmelt rate.
5. Daily-Method Results
For the calibration period, the simulated snow–ice transition dates agree with the measured ones to within 3 days on average, suggesting that there is no significant bias.
Figures 7 and 8 display the raw reconstruction and the measurements between 1950 and 1998. Figure 7 compares the mass-balance annual variability (deviation from the mean), and Figure 8 the 49 year trends (cumulative mass balance).
Sarennes centred balance since 1950: measured mass balance and the results of the daily relation over the entire period.

Sarennes cumulative net balance since 1950: measured mass balance and mass balance reconstructed by means of the daily relation, using the entire measurement period for the calculation of the daily relation (cf. Fig. 3).

With the daily method, 74% of the variance of the annual mass balance is explained for the 1950–81 period, which is a better result than that produced by the classical method for the same period of time (70%). The difference between the reconstructed and the measured series can be characterized by a standard error (which is the same as standard deviation but performed between two centred series) of 47 cm w.e. This value is lower than the standard deviation of the measurements: σ = 85 cm. The year 1983 was an exceptional one in which both measured accumulation and ablation were unusually high. It is poorly reconstructed (up to 130 cm below the measured value). As a consequence, the standard error for the entire period (1950–98) increases to 60 cm, and the variance explained drops to 55% (see Table 2).
6. Interpretation
6.1. The coefficients
The accumulation/precipitation ratio (2.5) is close to that found with the classical method (2.8). This is well above 1, but it is in agreement with the difference in precipitation we observe between high-altitude glaciated valleys and low-altitude unglaciated ones (personal communication from Reference Vincent and VallonC. Vincent, 1999).
Our melt rate for ice (0.77 cm°C−1) is comparable to the values of around 0.8 cm°C−1 observed by Reference BraithwaiteBraithwaite (1995) at Nordbogletscher and Qamanârssûp sermia, Greenland, and by Reference Braithwaite and ZhangBraithwaite and Zhang (2000) on five Swiss glaciers. Our melt rate for snow (0.55 cm°C−1) is twice as high as Braithwaite observed for Nordbogletscher (0.25 cm°C−1), but is comparable to other values he cites: 0.54 cm°C−1 for Aletschgletscher, Switzerland, and 0.57 cm°C−1 for Sàtujökull, Iceland. Ice from alpine small glaciers is probably loaded with more dust than ice in Greenland, so a higher melt rate is not surprising.
6.2. Firn
Poorly simulated years often follow long near-zero mass-balance periods (e.g. 1977–82). This may be explained by firn persisting from the previous year.
7. Sensitivity Tests
Testing the temporal stability of the method tells us whether we can use it to extrapolate mass balance backwards in time. To do so, we divided the measurement period into two shorter periods centred around 1977. In the following, one time period is used for calibration, and the other as a test period, which gives six different reconstructions based on three different calibration periods: 1950–76, 1977–98 and 1950–98.
The results are shown as cumulative net balance in Figure 9 for the classical method, and in Figure 10 for the daily method. The percentage of explained variance (squared correlation coefficient; see Table 2) between reconstructions and measurements depends strongly on the calibration period (48–69%) for each method. However, the explained variances between the various reconstructions are much less dependent on the calibration period used for the daily method (99%) than for the classical one (59–98%).
Cumulative net mass balance for Glacier de Sarennes: comparison between measurements and three reconstructions obtained using the classical method with different calibration periods.
Cumulative net mass balance for Glacier de Sarennes: comparison between measurements and three reconstructions obtained using the daily method with different calibration periods.

Figures 9 and 10 show that none of the reconstructions properly simulates the general trend in the mass-balance series (60 cm of standard deviation between both reconstructions and the measurements). But we have shown that the daily method does not depend on the chosen calibration period, whereas the classical method does.
8. Volumetric Balance
The loss of mass of the glacier between 1906 and 1981 can be determined by comparing the maps from these two years. The change in volume computed in this manner is then used to check the mass balance determined from the reconstruction method.
Although very carefully made, the 1906 map (Reference Flusin, Jacob and OffnerFlusin and others, 1909) contains errors inherent in the survey practices of 1907: an average error of 10 m in the altitude of the reference summits around the glacier is detected, and horizontal distances between those reference summits show deviations of up to 10% when compared to the 1981 map. The variation of volume between the two maps is obtained by manually drawing similar 100 × 100 m2 gridding over the two maps, and then subtracting the mean altitudes of each cell. On the 1906 map, the gridding takes into account horizontal distortions. The resulting accuracy then equals 10 m in elevation. We obtain a 45 ± 10 m w.e. variation between 1906 and 1981. For the same 1906–50 period, Reference MartinMartin (1978) obtains a 24.6 m w.e. decrease, which is well within the range of uncertainty of our result. With the 1906 and 1981 maps, the annual losses given in Reference Valla and PiedalluValla and Piedallu (1997) lead to a decrease of 44 m, which also agrees well with our result. Such a decrease matches those of other geodetically/photogrammetrically determined secular mass balances of alpine glaciers (Reference Chen and FunkChen and Funk, 1990; Reference Haeberli, Haeberli, Hoelzle and SuterHaeberli, 1998). Over a similar time period (1892–1979), below 3000 m a.s.l. north and south Schneeferner glaciers (0.4 and 0.2 km2) lost 39 and 63 m w.e. Such mass-balance losses are characteristic of small glaciers with hardly any accumulation area.
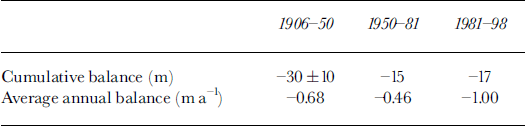
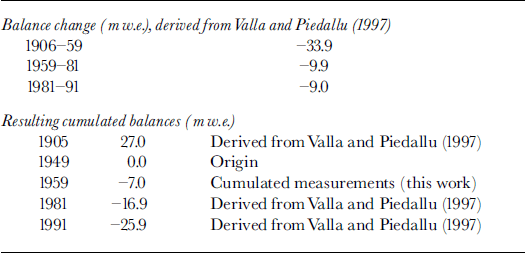
Combined with the cumulative measurements, the volumetric balance obtained for the 1906–81 period makes it possible to calculate the average annual balance for three consecutive periods (Table 3). It shows that the melting rate of Glacier de Sarennes has doubled during the last period.
Melting rates for Glacier de Sarennes during three periods, as obtained from the cumulated measurements for the 1950–81 and 1981–98 periods, and from the volumetric balance for the 1906–50 period combined with the cumulated measurements
9. Reconstruction
The daily method proved better than the classical one at reproducing the interannual variability of the mass-balance series. But the daily-method cumulative balance reconstructed over the 1906–50 period (41 m w.e.) is very different from the 30 m w.e. obtained from the maps combined with the measurements (Table 3). As the volumetric balance is more reliable than any of the statistical methods, we used the maps to derive the 1906–50 trend.
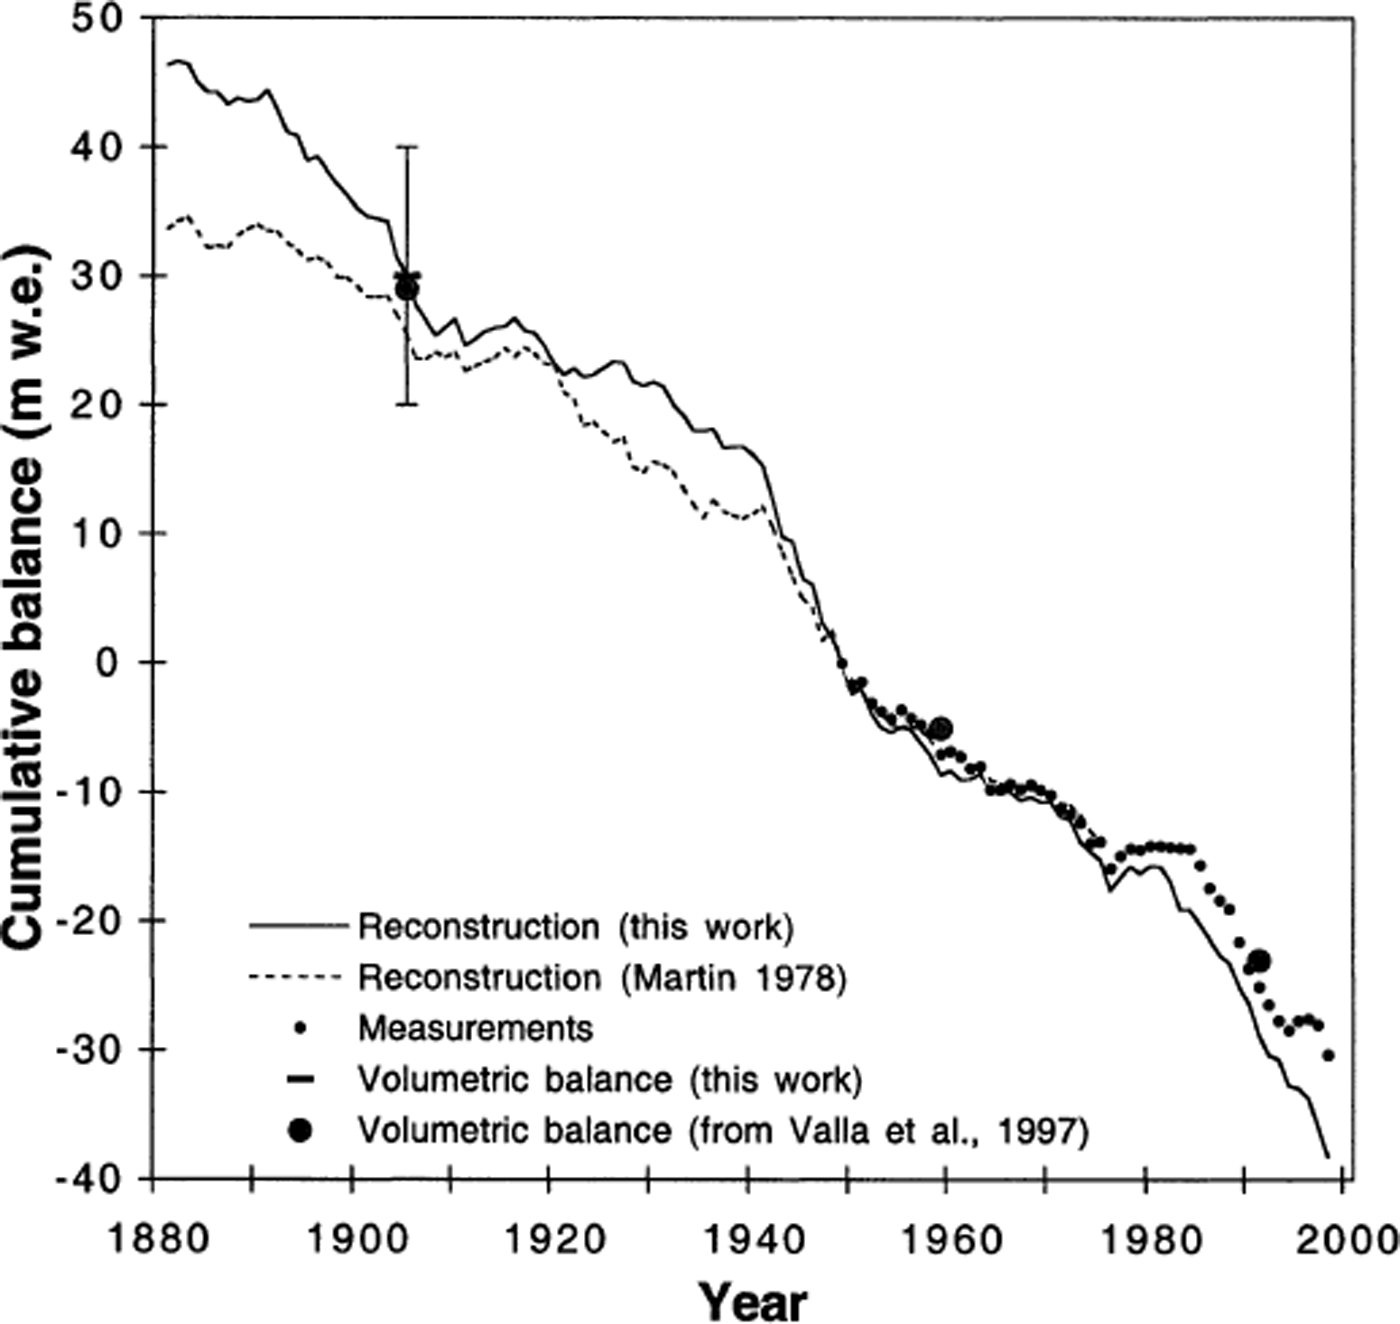
The resulting secular series is given in Figure 11. In this figure, we use the volumetric balance of 1906, 1959 and 1991 (from Reference Valla and PiedalluValla and Piedallu, 1997) as a comparison with our own study (Table 4). The trend prior to 1906 cannot be checked. Furthermore, the use of precipitation data from a more distant and less highly correlated station makes the reconstruction less reliable for that early period.
Cumulative net mass balance for Glacier de Sarennes: two reconstructions since 1881 (one by Reference MartinMartin (1978) and the other from the daily method with trend correction) and measurements since 1950. The zero is set to 1949, and the error bar derived from the 1906–81 maps is specified.
Conversion of the “mean annual loss in water equivalent” of Reference Valla and PiedalluValla and Piedallu (1997) into cumulated balances (m w.e), with the origin set to the year 1949, for comparison purposes in Figure 11
The standard deviation between the two net mass-balance reconstructions (Reference MartinMartin (1978) and the daily one) equals 74 cm w.e. over the entire reconstructed period (1882–1949).
9.1. Comparison with another series
In order to evaluate our reconstruction, we compare it with another series. Other reconstructions exist in the Alps, but they also use meteorological data. The Aletschgletscher series, in Switzerland (Reference MüllerMüller, 1977, Reference Müller1988; Reference HaeberliHaeberli, 1985; Reference Haeberli and MüllerHaeberli and Müller, 1988; Reference Haeberli and HoelzleHaeberli and Hoelzle, 1993), on the other hand, is obtained from the hydrologic balance of the glacier valley, which makes it an independent balance series, rather than just another reconstruction.
The cumulative centred mass balances of Aletschgletscher and Glacier de Sarennes are presented in Figure 12. The two curves differ (as would be expected for two glaciers that have different physical characteristics, and that are some 200 km apart), but the interannual variations are coherent: the correlation between the two mass-balance series is 0.79. The common interannual variations are due to climate variations in the Western Alps, and we expect both reconstructions to be similar, while the long-term trends are strongly influenced by differences in the geometry of the glaciers (see Reference Haeberli, Haeberli, Hoelzle and SuterHaeberli, 1998).
Cumulative deviations from the means of the specific balance of Aletschgletscher and Glacier de Sarennes.

10. Conclusions
The aim of this paper was to update and, if possible, to improve Reference MartinMartin’s (1978) reconstruction of the mass balance of Glacier de Sarennes. This aim has only partially been achieved: reconstructions based on statistical methods such as linear regression cannot produce reliable long-term trends outside of the period for which the relation has been calibrated. An independent measurement, such as that provided by comparing maps, is required. In the case of Glacier de Sarennes, the 1906 map (despite its errors) and the 1981 map give an indication of the main balance trend for the last century.
The difference between the measurements and the reconstruction (60 cm standard error) is almost as high for the daily method as for the classical one. The main advantage of the new method is the stability of deviations from the mean resulting when the calibration period for the regression changes. We conclude that the interannual variations, at least, are better simulated.
Acknowledgements
We would like to thank everyone who collected data from Glacier de Sarennes over such a long period. C. Vincent and M.Vallon kindly offered ideas and criticisms, which have been very useful for the completion of this work. We also thank the Editor and Co-Chief Editor of the Journal of Glaciology, M. R. van den Broeke and M. Sturm, and the two referees, W. Haeberli and M. Funk, who helped to improve the paper. We would like to thank Electricité de France for the hydrological data, Météo-France for the meteorological data and Ph. Bois of the Laboratoire d’Étude des Transferts en Hydrologie et Environnement for his help. This work was part of O. Torinesi’s degree (DEA CPCA); his tenure at the Laboratoire de Glaciologie et Géophysique de l’Environnement was financed by the École Normale Supérieure de Cachan.


