





Introduction
Young adults worldwide are facing the dual problem of increasing prevalence of common mental disorders, such as depression and anxiety, and reduced effectiveness of first-line treatments for these conditions compared to older adults (COVID-19 Mental Disorders Collaborators, 2021; Patel et al., Reference Patel, Saxena, Lund, Kohrt, Kieling, Sunkel and Herrman2023; Saunders et al., Reference Saunders, Suh, Buckman, John, Baou, Pilling and Stringaris2025; Strawn et al., Reference Strawn, Mills, Suresh, Mayes, Gentry, Trivedi and Croarkin2023; Cipriani et al., Reference Cipriani, Furukawa, Salanti, Chaimani, Atkinson, Ogawa and … Geddes2018). These issues are compounded by the fact that depression in young adults (aged 18–25 years old, as defined by the World Health Organization [2024]) remains relatively under-studied. For example, the mean age of participants in the largest meta-analysis of antidepressant efficacy was 44 years (Cipriani et al., Reference Cipriani, Furukawa, Salanti, Chaimani, Atkinson, Ogawa and … Geddes2018), and even in individual-patient data meta-analyses investigating the moderating effect of age on treatment outcomes, the mean age was 42 years (Buckman et al., Reference Buckman, Saunders, Stott, Arundell, O’Driscoll, Davies and Pilling2021b). This gap in the evidence base persists despite recognition that the onset of depression peaks between the ages of 15 and 25 (Solmi et al., Reference Solmi, Radua, Olivola, Croce, Soardo, Salazar de Pablo, Il Shin, Kirkbride, Jones, Kim, Kim, Carvalho, Seeman, Correll and Fusar-Poli2022), and that young adults are less likely to seek treatment (Pettit et al., Reference Pettit, Qureshi, Lee, Stirzaker, Gibson, Henley and Byng2017) and more likely to drop out of treatment once started relative to older adults (Barnett et al., Reference Barnett, Saunders, Buckman, Cardoso, Cirkovic, Leibowitz and Pilling2022).
There is therefore a need for more effective and readily accessible treatments for depression in young people – particularly interventions that they perceive to be ‘for them’ rather than generic ‘one-size fits all’ approaches that may not align with their particular needs (Barnett et al., Reference Barnett, Arundell, Matthews, Saunders and Pilling2021). This is critical, as unaddressed or inadequately treated mental health difficulties in youth often persist into adulthood, contributing to long-term individual and societal difficulties (Layard & Clark, Reference Layard and Clark2015). For example, the likelihood of a chronic course and multiple relapses or recurrences is much higher if depression is not prevented or adequately treated in young people (Buckman et al., Reference Buckman, Underwood, Clarke, Saunders, Hollon, Fearon and Pilling2018; Saunders et al., Reference Saunders, Buckman, Stott, Leibowitz, Aguirre, John and Pilling2021). Young adults, including both university students and those not engaged in education, employment, or training, typically show poorer outcomes from psychological therapies for depression and are more likely to discontinue treatment compared with other age groups (Buckman et al., Reference Buckman, Stott, Main, Antonie, Singh, Naqvi and Saunders2021c). They also report high levels of social isolation and loneliness, as well as difficulties with emotional processing, which are known to be both risk and maintenance factors for depression (Moeller & Seehuus, Reference Moeller and Seehuus2019).
Depression commonly disrupts social functioning and connectedness, which is particularly important for healthy development during adolescence (Jose & Lim, Reference Jose and Lim2014; Viana & Stevens, Reference Viana and Stevens2013). A growing body of literature has highlighted the potential social and mental health benefits of social dance and movement (Delattre et al., Reference Delattre, Applewhite, Buckman, Harmer and Murphy2024; Noetel et al., Reference Noetel, Sanders, Gallardo-Gómez, Taylor, Cruz and Lonsdale2024; Lakes et al., Reference Lakes, Marvin, Rowley, Nicolas, Arastoo, Viray and … Jurnak2016; Shuper Engelhard & Vulcan, Reference Shuper Engelhard and Vulcan2021; Hyvönen, Pylvänäinen, Muotka, & Lappalainen, Reference Hyvönen, Pylvänäinen, Muotka and Lappalainen2020). However, these effects have not yet been systematically investigated in the context of depression, and thus it remains unclear whether social dance could be an effective primary or adjunctive treatment for depression (Delattre et al., Reference Delattre, Applewhite, Buckman, Harmer and Murphy2024). The impetus for the present study was the idea that learning to dance within a group setting could help to reduce loneliness, foster social connectedness and enjoyment, and promote a sense of achievement in young people. Such experiences may provide the types of behavioral and emotional experiences theorized to be central to recovery in cognitive behavioral and behavioral activation treatments for depression (Beck, Rush, Shaw, & Emery, Reference Beck, Rush, Shaw and Emery1979; Lewinsohn, Reference Lewinsohn1975; Martell, Dimidjian, & Hermann-Dunn, Reference Martell, Dimidjian and Hermann-Dunn2010). Additionally, the cost-effectiveness, scalability, and community-based nature of social dance could make it a viable and valuable addition to existing offerings for depression treatment in healthcare settings.
Before undertaking the present study, we conducted a consultation with young adults to explore their interest in a social dance intervention for young people with depression and what form of social dance they might find the most acceptable. Their collective feedback indicated a clear preference for salsa dance, and this was therefore chosen as the intervention for the present study. Accordingly, this study aimed to investigate the potential efficacy of a salsa dance group-based intervention for young people with mild to moderately severe depressive symptoms, compared to a waitlist control, and to investigate putative mechanisms of change. It was hypothesized that participants in the salsa dance condition would experience larger reductions in depressive symptoms compared to those in the waitlist control group.
Methods
Patient and participant involvement
To ensure that the social dance and movement activity selected for the study was acceptable and relevant to the target population, young people with and without lived experience of depression and anxiety from an Oxford-based Youth Advisory Group were consulted through a Patient and Participant Involvement (PPI) process (see Supplementary Materials for additional details). They were provided with videos of different social movement activities and asked to imagine what interests and concerns their peers might have. Based on their feedback, salsa dancing was selected as the study intervention activity.
Participants
Individuals aged 18 to 24 years old at the time of consent who self-reported symptoms of depression were invited to take part in this research. Participants were identified using validated depressive symptom thresholds, reflecting common symptom-based approaches to identifying and treating depression in community, primary care, and youth mental health settings. Those with a Patient Health Questionnaire (PHQ-9) score between 5 and 19 at the time of screening were eligible to participate, so long as they did not self-report a current or recent diagnosis of any psychotic disorder (e.g. bipolar, schizophrenia, schizoaffective disorder), substance use disorder, eating disorder, or personality disorder. Individuals scoring in the severe symptom range on the PHQ-9 (i.e. ≥20) were excluded. Individuals were also not eligible for the study if they self-reported being unfit for light physical exertion, or if they regularly attended partner dance classes/events within the last 6 months. A formal diagnosis of depression, current or past use of antidepressant medication, or current/past engagement in psychological therapies were not inclusion or exclusion criteria.
Design
This study was a randomized controlled trial with a mixed, two-group design. The intervention group was required to attend at least six out of 8 weeks of salsa classes, while the waitlist group followed the same assessment schedule but received the option to participate in the dance classes after a 12-week delay.
Outcome measures
Primary outcome
The primary outcome in this study was change in depressive symptom severity (as assessed by PHQ-9 score) over time – from baseline (T0) to the study endpoint at 12 weeks post-baseline (T3). Clinically meaningful change was operationalized as the minimum clinically important difference (MCID), defined as the smallest reduction in depressive symptoms that matters to patients, and in this case assigned as a −1.7-point change on the PHQ-9, a figure established via a cohort study of 400 patients in UK primary care by Kounali et al. (Reference Kounali, Button, Lewis, Gilbody, Kessler, Araya and … Lewis2022).
Power analysis. An a priori power analysis was performed for the primary comparison (change in PHQ-9 score from pre- to post-intervention vs. waitlist control) for a moderate effect size on the PHQ-9 (Kroenke, Spitzer, & Williams, Reference Kroenke, Spitzer and Williams2001). A power calculation for the sample size necessary to detect a statistically significant difference between the two groups at p < 0.05, power = 0.9, and Cohen’s d = 0.5 was performed using G* Power 3.1 (Faul, Erdfelder, Buchner, & Lang, Reference Faul, Erdfelder, Buchner and Lang2009). The required sample size was n = 91 study completers across both groups. Based on experience recruiting for similar studies, an approximate 35% dropout rate was predicted, and 121 participants were recruited. Analyses were conducted on a per-protocol basis.
Secondary outcomes
Changes in depressive symptom severity (PHQ-9) were also measured at T1 (4 weeks) and T2 (8 weeks) post-baseline. In addition, generalized anxiety, social anxiety symptoms, loneliness, social anhedonia, and daily happiness were measured at T0, T1, T2, and T3, respectively (Table 1).
Standardized questionnaires administered and administration timeline

Table 1. Long description
The table contains five columns: Variable, Assessment tool, References, Scoring description, and Administration timeline.
* Depression: Measured by P H Q 9 (Kroenke et al., 2001). Nine items scored 0 to 3. Higher scores indicate greater severity (5 to 10 mild, 11 to 15 moderate, 16 to 19 moderately severe, 20 plus severe). Administered at Eligibility, T 0 (baseline), T 1 (4 weeks), T 2 (8 weeks), and T 3 (12 weeks).
* Social anxiety: Measured by S A S A (La Greca and Lopez, 1998). 18 items scored 1 to 5. Higher scores indicate more anxiety. Administered at T 0, T 2, and T 3.
* Social anhedonia: Measured by A C I P S (Gooding and Pflum, 2014). 17 items scored 1 to 6. Higher scores correspond to lower social anhedonia. Administered at T 0, T 1, T 2, and T 3.
* Anxiety: Measured by G A D 7 (Spitzer et al., 2006). Seven items scored 0 to 3. Higher scores indicate greater anxiety. Administered at T 0, T 1, T 2, and T 3.
* Loneliness: Measured by U C L A L 3 (O N S, 2018). Three items scored 1 to 3. Higher scores reflect greater loneliness. Administered at T 0, T 1, T 2, and T 3.
* Loneliness (Direct): Measured by U C L A L 1 (Badcock and Lim, 2021). One item scored 1 to 5. Higher scores indicate more loneliness. Administered at T 0, T 1, T 2, and T 3.
* Empathy: Measured by B E S (Jolliffe and Farrington, 2006). 20 items scored 1 to 5. Higher scores indicate greater empathy. Administered at T 0 and T 2.
* Daily happiness: Measured by E M A (Pirla et al., 2023). One item scored 1 to 10. Administered daily from T 0 until T 3.
Exploratory measures
Class experiences. In order to examine whether participants’ experiences of social dance moderated any improvements to their mood, intervention participants completed a short online survey consisting of three Likert-scale questions via their smartphone (or a device from a member of the research team) directly following each dance class, prior to leaving class. These questions were: 1) How much did you enjoy today’s class? 2) How connected do you feel? and 3) How happy do you feel? Scores on these three items were averaged to give a single combined score.
Tasks. Social and emotional processing and social interaction tasks were included as exploratory outcome measures to investigate potential mechanisms of change. These tasks were completed online at T0 (baseline) and T2 (8 weeks later). A full list of tasks and outcomes is available in the Supplementary Materials.
Acceptability of intervention. Following the last study timepoint, intervention participants completed questions regarding the acceptability of the intervention (see Supplementary Materials).
Ethical approval
Ethical approval was obtained from the Central University Research Ethics Committee (CUREC Reference: R85689/RE001). The study was preregistered on ClinicalTrials.gov (ID: NCT05963581). While social dance classes were conducted in person, all data were collected online (or, in the case of the daily mood measures, by text message).
Procedure
Participants were recruited from in and around Oxfordshire, United Kingdom. After reviewing the online participant information sheet and completing preliminary screening (PHQ-9), eligible individuals were contacted by a research team for a phone-based eligibility assessment. Basic demographic information (age, gender, ethnicity) and mental-health specific information (whether participants had seen a health professional regarding their mental health, were taking medication for mental health, and had a diagnosis of depression and/or anxiety) were collected. All participants gave informed consent. Once enrolled, participants were randomly assigned to the experimental or control condition according to a pregenerated Sealed Envelope Ltd (2022) list prepared by a member of the research team and stratified by gender.
In the experimental condition, participants completed 8 weeks of a salsa dancing course in Oxford. Salsa classes were hosted by Oxford-based salsa instructors associated with local dance societies (Oxford University Salsa Society, Linacre College Latin Dance Society, and Teddy Hall Latin Dance Society). Salsa classes were taught by six instructors (three male, three female) of varied nationalities (UK, US, Italy, Romania, Spain) in different combinations. A member of the research team was in attendance at all classes for observation. Salsa classes took place in central Oxford, and participants were able to enter the salsa classes the same way as society members who were not participating in the research, ensuring research participants were indistinguishable from non-study attendees.
Participants assigned to the waitlist control condition completed questionnaires on the same schedule as individuals in the experimental condition and received the same compensation for participating in the study (£100). These participants were offered the opportunity to complete the 8-week salsa course after a 12-week waiting period.
Results
Descriptive statistics
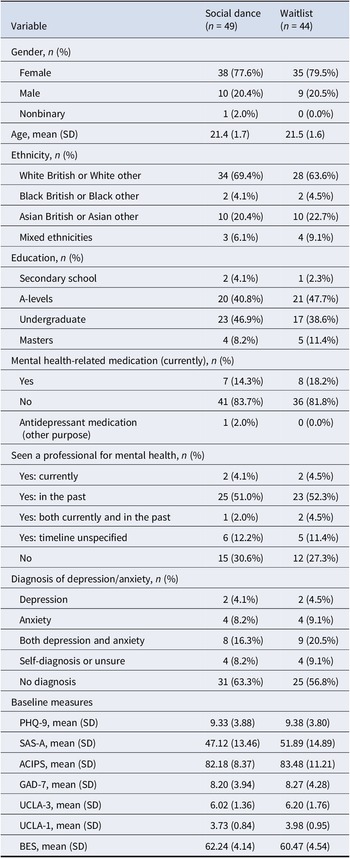
121 participants were enrolled in this study over the course of three waves of data collection (summer, autumn, winter) between July 2023 and February 2024. Forty-nine experimental condition participants and 45 control condition participants completed the study (77.7%) (Figure 1; for dropout reasons provided, see Supplementary Materials). The groups were well-matched on demographic and clinical characteristics. One participant was withdrawn after data collection for study noncompliance, yielding an analyzed sample of 93 participants (19 men, 73 women, 1 nonbinary individual; aged between 18 and 24, M = 21.46, SD = 1.67); see Table 2 for demographics.
Consort flowchart.

Figure 1. Long description
The flowchart begins at the top with Enrollment. 687 individual clicks on the preliminary eligibility screening form led to 90 exclusions for criteria and 476 not included due to non-completion or capacity. 121 participants were recruited and randomized.
Following Allocation, the study splits into two columns: Social Dance (left) and Waitlist (right).
At T 0 (Baseline):
* Social Dance: n = 66. Online assessment includes P H Q-9, G A D-7, U C L A-L, A C I P S, S A S-A, B E S, S E P and S L-Gen Tasks.
* Waitlist: n = 47. Same assessment battery.
Between T 0 and T 1 (4 weeks, 1 Salsa class per week for the dance group):
* Social Dance: n = 53.
* Waitlist: n = 47.
* Assessment: P H Q-9, G A D-7, U C L A-L and A C I P S.
Between T 1 and T 2 (4 weeks, 1 Salsa class per week for the dance group):
* Social Dance: n = 49.
* Waitlist: n = 45.
* Assessment: Full battery as at T 0.
At T 3 (4 weeks after T 2):
* Social Dance: n = 49.
* Waitlist: n = 45.
* Assessment: P H Q-9, G A D-7, U C L A-L, A C I P S, S A S-A.
A central box indicates 18 participants total withdrew from the study during the T 0 to T 2 period.
At the bottom, under Follow-up, 9 participants were excluded for non-completion and 1 for study non-compliance. The final box states 93 participants were included in the final analysis.
A legend in the top-left defines measure initialisms: P H Q-9 (Depression), G A D-7 (Anxiety), S A S-A (Social Anxiety), U C L A-L (Loneliness), B E S (Basic Empathy), A C I P S (Social Anhedonia), S E P Tasks (Social and Emotional Processing), and S L-Gen Task (Social Learning and Generosity Sensitivity).
Demographics of included participants

Table 2. Long description
The table consists of three columns: Variable, Social dance (n = 49), and Waitlist (n = 44).
Gender, n (%):
- Female: 38 (77.6%) in Social dance; 35 (79.5%) in Waitlist.
- Male: 10 (20.4%) in Social dance; 9 (20.5%) in Waitlist.
- Nonbinary: 1 (2.0%) in Social dance; 0 (0.0%) in Waitlist.
Age, mean (S D):
- Social dance: 21.4 (1.7); Waitlist: 21.5 (1.6).
Ethnicity, n (%):
- White British or White other: 34 (69.4%) in Social dance; 28 (63.6%) in Waitlist.
- Black British or Black other: 2 (4.1%) in Social dance; 2 (4.5%) in Waitlist.
- Asian British or Asian other: 10 (20.4%) in Social dance; 10 (22.7%) in Waitlist.
- Mixed ethnicities: 3 (6.1%) in Social dance; 4 (9.1%) in Waitlist.
Education, n (%):
- Secondary school: 2 (4.1%) in Social dance; 1 (2.3%) in Waitlist.
- A-levels: 20 (40.8%) in Social dance; 21 (47.7%) in Waitlist.
- Undergraduate: 23 (46.9%) in Social dance; 17 (38.6%) in Waitlist.
- Masters: 4 (8.2%) in Social dance; 5 (11.4%) in Waitlist.
Mental health-related medication (currently), n (%):
- Yes: 7 (14.3%) in Social dance; 8 (18.2%) in Waitlist.
- No: 41 (83.7%) in Social dance; 36 (81.8%) in Waitlist.
- Antidepressant medication (other purpose): 1 (2.0%) in Social dance; 0 (0.0%) in Waitlist.
Seen a professional for mental health, n (%):
- Yes: currently: 2 (4.1%) in Social dance; 2 (4.5%) in Waitlist.
- Yes: in the past: 25 (51.0%) in Social dance; 23 (52.3%) in Waitlist.
- Yes: both currently and in the past: 1 (2.0%) in Social dance; 2 (4.5%) in Waitlist.
- Yes: timeline unspecified: 6 (12.2%) in Social dance; 5 (11.4%) in Waitlist.
- No: 15 (30.6%) in Social dance; 12 (27.3%) in Waitlist.
Diagnosis of depression/anxiety, n (%):
- Depression: 2 (4.1%) in Social dance; 2 (4.5%) in Waitlist.
- Anxiety: 4 (8.2%) in Social dance; 4 (9.1%) in Waitlist.
- Both depression and anxiety: 8 (16.3%) in Social dance; 9 (20.5%) in Waitlist.
- Self-diagnosis or unsure: 4 (8.2%) in Social dance; 4 (9.1%) in Waitlist.
- No diagnosis: 31 (63.3%) in Social dance; 25 (56.8%) in Waitlist.
Baseline measures, mean (S D):
- P H Q - 9: 9.33 (3.88) in Social dance; 9.38 (3.80) in Waitlist.
- S A S - A: 47.12 (13.46) in Social dance; 51.89 (14.89) in Waitlist.
- A C I P S: 82.18 (8.37) in Social dance; 83.48 (11.21) in Waitlist.
- G A D - 7: 8.20 (3.94) in Social dance; 8.27 (4.28) in Waitlist.
- U C L A - 3: 6.02 (1.36) in Social dance; 6.20 (1.76) in Waitlist.
- U C L A - 1: 3.73 (0.84) in Social dance; 3.98 (0.95) in Waitlist.
- B E S: 62.24 (4.14) in Social dance; 60.47 (4.54) in Waitlist.
Intervention effects
Primary outcome: Depressive symptom severity
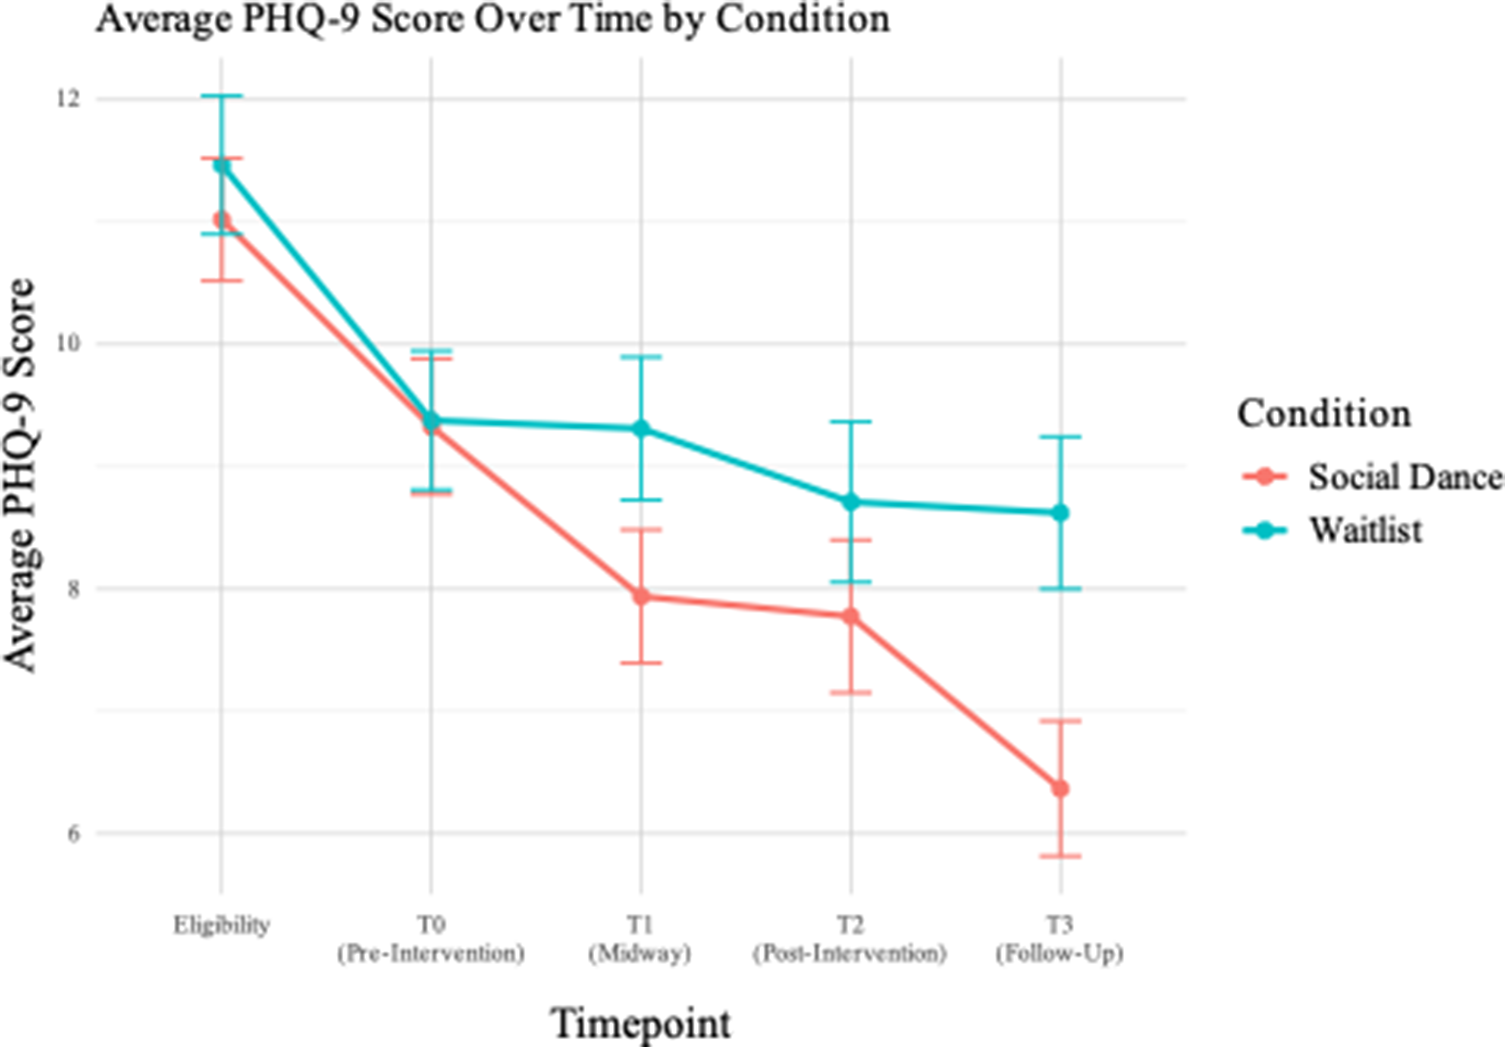
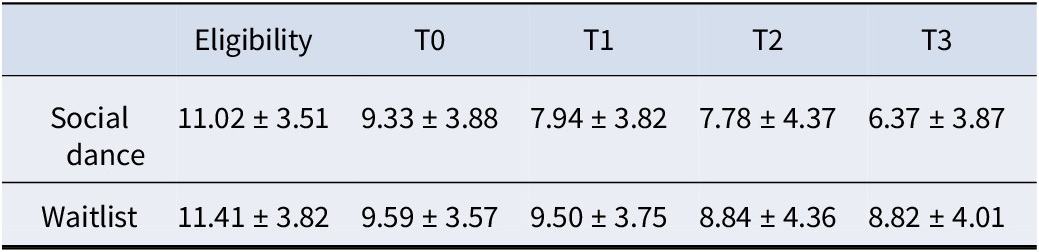
A linear mixed-effects model (LMM) was fitted to examine the effect of condition (social dance vs. waitlist) on PHQ-9 scores over the four timepoints (T0, T1, T2, and T3; Figure 2), with participants included as a random intercept in the model to account for repeated measures. Baseline PHQ-9 scores did not significantly differ between the social dance and waitlist groups (B = 1.15, p = .632). There was evidence of a main effect of time, B = −3.43, at T3 relative to baseline (SE = 0.38, t(364) = −9.04, p < .001), suggesting that PHQ-9 scores decreased over time in both conditions. As predicted, there was evidence of a condition-by-time interaction, B = 1.56, SE = 0.55, t(364) = 2.82, p = .005, suggesting that social dance participants experienced a significantly greater reduction in PHQ-9 score compared to those in the waitlist condition. Standardized estimates showed a moderate-sized interaction effect (β = 0.38, 95% CI[0.11,0.64]). At T3, participants in the social dance group had significantly lower PHQ-9 scores (M = 6.37, SD = 3.87) compared to the waitlist group (M = 8.82, SD = 4.01). This corresponds to a between-group difference in change scores of approximately 2.45 PHQ-9 points, with a large between-group effect size (Cohen’s d = −0.92, 95% CI[−1.53,-0.32]); see Table 3. There was also a large within-group reduction in PHQ-9 scores for the social dance group from T0 to T3 (d = 1.11, 95% CI[0.71,1.52]), while the waitlist group showed a small, nonsignificant change over the same period (d = 0.29, 95% CI[−0.13,0.71]).
Average PHQ-9 score over time by condition. Note: The eligibility timepoint is not reported in the above analyses, which focus on pre-post intervention symptom change (from T0 to T3). n = 93.

Figure 2. Long description
The line graph plots Average P H Q 9 Score on the vertical Y axis, ranging from 6 to 12, against Timepoint on the horizontal X axis.
Two conditions are tracked:
* Social Dance (represented by a red line with circular markers).
* Waitlist (represented by a teal line with circular markers).
Both groups start at Eligibility with high scores around 11. At T 0 (Pre-Intervention), both groups drop to approximately 9.5.
From T 0 to T 3, the trends diverge:
* The Waitlist group shows a gradual, shallow decline, ending at T 3 (Follow-Up) with a score of approximately 8.5.
* The Social Dance group shows a steeper linear decrease, dropping to approximately 8 at T 1 (Midway), 7.8 at T 2 (Post-Intervention), and reaching its lowest point of approximately 6.5 at T 3 (Follow-Up).
Vertical error bars are present at each data point, indicating the range of variance for each measurement.
Mean and standard deviation of PHQ-9 scores by group and timepoint

Table 3. Long description
The table contains two rows of data representing the Social dance group and the Waitlist group. The columns represent five timepoints: Eligibility, T 0, T 1, T 2, and T 3.
* Social dance group scores: Eligibility is 11.02 plus or minus 3.51. T 0 is 9.33 plus or minus 3.88. T 1 is 7.94 plus or minus 3.82. T 2 is 7.78 plus or minus 4.37. T 3 is 6.37 plus or minus 3.87.
* Waitlist group scores: Eligibility is 11.41 plus or minus 3.82. T 0 is 9.59 plus or minus 3.57. T 1 is 9.50 plus or minus 3.75. T 2 is 8.84 plus or minus 4.36. T 3 is 8.82 plus or minus 4.01.
The data shows a steady linear decrease in P H Q 9 scores for the Social dance group, while the Waitlist group shows a less pronounced decline that plateaus between T 1 and T 3.
Secondary outcomes
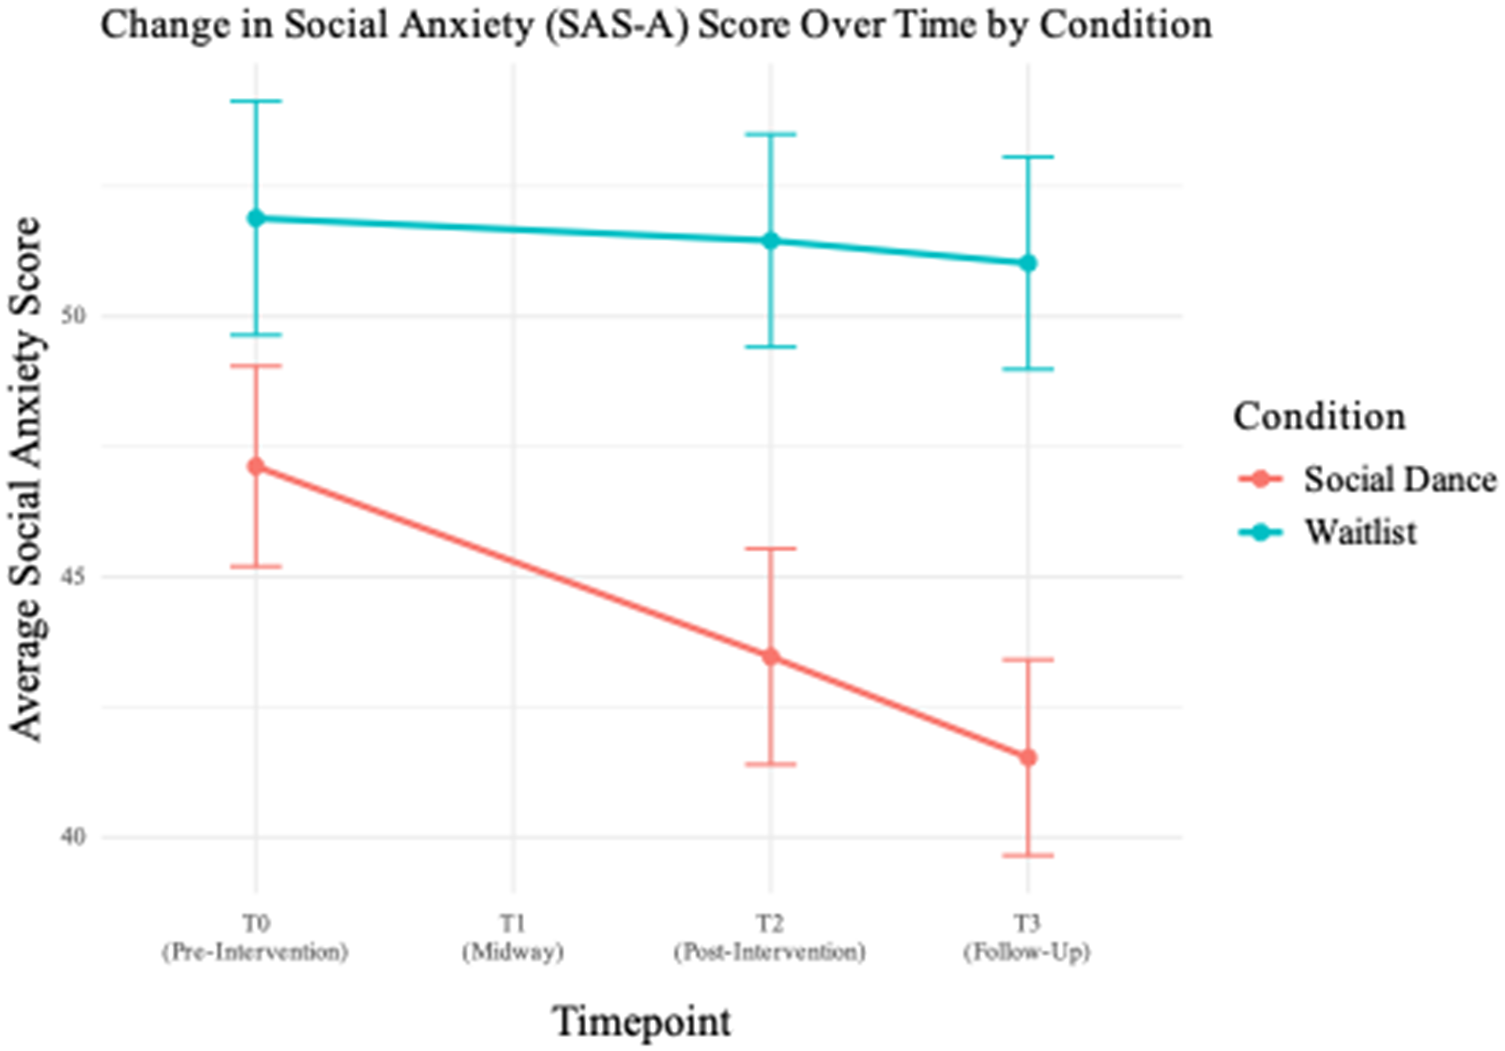
Social anxiety (SAS-A Score). An LMM was fitted to examine the effects of condition and timepoint on SAS-A score, with participants included as a random intercept. Importantly, there was a significant condition by timepoint interaction (B = 4.73, SE = 1.93, t(182) = 2.45, p = .015), indicating that participants in the social dance condition experienced a greater reduction in social anxiety scores from T0 to T3 compared to those in the waitlist condition (Figure 3). The standardized effect for this interaction was moderate (β = 0.33, 95% CI [0.06,0.60]). At T3, the between-group effect size was large (Cohen’s d = −1.44, 95% CI[−2.32,–0.57]), with the social dance group experiencing greater improvements. Within-group effect sizes further supported the differential improvement; in the salsa group, social anxiety scores dropped significantly from T0 to T2 (d = 0.56, 95% CI[0.15,0.96]) and from T0 to T3 (d = 0.85, 95% CI[0.44,1.26]). By contrast, the waitlist group experienced negligible change across timepoints (T0 to T3: d = 0.13, 95% CI[−0.29,0.55]).
Change in SAS-A scores over time by condition. Note: this measure was only administered at baseline (T0), following the salsa classes (T2), and follow-up (T3), e.g. not administered at T1. n = 93.

Figure 3. Long description
The horizontal X axis is labeled Timepoint and includes four markers: T 0 (Pre-Intervention), T 1 (Midway), T 2 (Post-Intervention), and T 3 (Follow-Up). The vertical Y axis is labeled Average Social Anxiety Score and ranges from 40 to 50.
Two lines with error bars represent the conditions:
* The Social Dance group (red line) starts at approximately 47 at T 0, shows a linear decrease to roughly 43.5 at T 2, and continues to decrease to approximately 41.5 at T 3.
* The Waitlist group (teal line) starts higher at approximately 52 at T 0 and remains relatively stable with a very slight downward trend, ending at approximately 51 at T 3.
Data points are missing for both groups at the T 1 Midway marker. The Social Dance group consistently shows lower anxiety scores and a steeper rate of improvement compared to the Waitlist group.
Baseline social anxiety varied widely between participants (random intercept variance = 148.60, SD = 12.19). Mean baseline scores were similar across groups (B = 4.76, SE = 2.88, t(124.14) = 1.66, p = .10).
Social anhedonia (ACIPS Score). Social anhedonia increased in the waitlist but not in the social dance condition, reflecting a significant condition by time interaction (β =−0.42, 95% CI[−0.70,–0.15]). At T3, the waitlist group had lower ACIPS scores than the salsa group (t(273) = −3.03, p = .003; d = 0.64, 95% CI[−0.23, 1.51]). No significant interactions emerged at earlier timepoints. Within the waitlist group, ACIPS scores decreased significantly from T0 to T3 (d = 0.59, 95% CI[0.17, 1.02]), indicating increased social anhedonia over time. In light of this, a mediation analysis was conducted to examine whether the positive impact of social dance on depressive symptoms was mediated by ACIPS. The average causal mediation effect (ACME) was not significant (ACME = 0.02, 95% CI[−0.28, 0.36], p = .839), indicating no evidence of mediation (neither full nor partial). Less than 1% of the total effect was mediated by ACIPS.
Generalized anxiety (GAD) and loneliness (UCLA-L). Both generalized anxiety and loneliness decreased over the study period (generalized anxiety: B = −2.65, SE = 0.58, t(273) = −4.55, p < .001; three-item loneliness: B = −1.22, SE = 0.20, t = −6.04, p < .001; direct loneliness item: B = −0.51, SE = 0.14, t = −3.56, p < .001); however, there was no significant main effect of condition (anxiety: B = 0.07, SE = 0.91, t(186) = 0.08, p = .94; three-item loneliness: B = 0.18, SE = 0.33, t = 0.55, p = .58; direct loneliness item: B = 0.24, SE = 0.20, t = 1.18, p = .24) or condition by time interaction (anxiety: B = 1.31, SE = 0.85, t(273) = 1.55, p = .12; three-item loneliness: B = 0.47, SE = 0.30, t = 1.60, p = .110), suggesting that the social dance participants did not experience different reductions in anxiety or loneliness compared with the waitlist group (see Supplementary Materials). Additionally, random effects showed substantial baseline variability in anxiety (variance = 10.8, SD = 3.29), suggesting that individual differences may have obscured potential intervention effects on anxiety.
Daily happiness. Daily happiness scores were collected from the day after participants completed their T0 assessment until the day they completed their T3 assessment. Data were double-entered for ~44% of records, yielding 98.5% agreement between scores (3523 matching out of 3577 total scores), indicating excellent transfer reliability. To standardize observation windows, data were truncated at Day 84 (end of week 12) (Figure 4).
Daily and weekly happiness scores by condition (n = 49). Note: On the daily happiness plot, shaded areas indicate ± standard error.

Figure 4. Long description
A two-panel figure showing happiness trends.
Left panel: Daily Happiness Scores by Condition. The x-axis represents Day from 0 to 86 and the y-axis represents Mean Happiness Score from 5 to 10. Two lines are plotted. The Social Dance line in red starts near 6 and shows a gradual upward trend with daily fluctuations, ending near 7. The Waitlist line in teal starts near 6 and remains relatively flat with higher volatility, including a sharp spike near day 45, ending near 6. Shaded areas around both lines represent standard error.
Right panel: Weekly Happiness Scores by Condition. The x-axis represents Week from Week 1 to Week 12 and the y-axis represents Mean Happiness Score from 6.0 to 6.5. The Social Dance line in red starts at approximately 6.1 in Week 1 and shows a steady increase to a peak of approximately 6.8 in Week 10 before a slight decline. The Waitlist line in teal starts at 6.0 in Week 1, drops to approximately 5.7 in Week 2, and fluctuates between 5.7 and 6.2 for the remainder of the period. Vertical error bars are present for each weekly data point.
Participants’ raw daily happy mood scores and their averaged weekly happiness scores (from Weeks 1–12) were analyzed by condition. An LMM was fitted to examine the effect of day, condition (salsa vs. waitlist), and their interaction on daily mood ratings. The model included a random intercept for participants (n = 93) and was fit using Restricted/Residual Maximum Likelihood (REML). There was a significant day-by-condition interaction, b = −0.0053, SE = 0.0017, t(6567) = −3.20, p = .0014, indicating that the slope of mood change over days was significantly less steep for the waitlist condition compared to the social dance condition. The week-by-condition interaction was also significant, b = −0.037, SE = 0.012, t(6567) = −3.12, p = .0018, indicating a slower increase in weekly happiness averages for the waitlist group compared to the experimental group. Sensitivity analyses suggested that these results were robust to missing data (see Supplementary Materials).
Exploration of potential mechanisms
Empathy (BES). Empathy did not moderate treatment effects; there was no evidence of moderation in the two-way or three-way interactions of empathy, condition, and time (B = 0.08, SE = 0.17, t(270) = 0.45, p = .65).
Class experiences. Self-reported positive class experience significantly moderated changes in depressive symptoms within the social dance group (B = 1.78, SE = 0.42, t(188) = 4.28, p < .001; see Supplementary Materials). Specifically, individuals reporting more positive class experience had significantly lower PHQ-9 scores at various timepoints compared to those reporting less positive class experience.
Task data. Across exploratory social/emotional processing tasks (see Supplementary Materials), there were no significant condition-by-time interactions. This held (a) in the full sample, and (b) when restricting analysis to individuals with PHQ-9 scores over 10 at baseline (n = 45) and (c) when excluding those who reported taking a medication with antidepressant effects (n = 17), given known antidepressant medication effects on emotional processing.
PHQ-9 by baseline severity
Given the wide range of participants’ PHQ-9 scores (0–19) at baseline (T0), and as baseline PHQ-9 severity largely impacts endpoint scores (Buckman et al., Reference Buckman, Saunders, Cohen, Barnett, Clarke, Ambler and Pilling2021a), we conducted an exploratory analysis to look at the effect of baseline PHQ-9 severity on individuals’ depressive symptom trajectories over time (see Supplementary Materials). There was a significant timepoint × T0 severity interaction (B = 2.96, SE = 0.75, t(364) = 3.96, p < .001), indicating that baseline depression severity influenced symptom change over time. The main effect of T0 severity was also significant (B = −3.82, p < .001), suggesting that participants with lower baseline symptoms consistently reported lower PHQ-9 scores throughout the study. However, the three-way interaction between condition, timepoint, and T0 severity was not significant (B = −1.52, SE = 1.08, t(360) = 1.41, p = .16), indicating that the effect of the salsa intervention did not significantly differ by baseline depression severity. In other words, while baseline PHQ-9 scores were associated with the amount of overall improvement, participation in the social dance intervention was associated with greater symptom improvement regardless of baseline symptom severity.
Acceptability. Salsa participants completed quantitative and qualitative acceptability of intervention measures at T3. Participants responded to 10 Likert-scale acceptability questions, as well as two free-response questions. Overall, acceptability responses were positive; for histograms of responses to each quantitative item, as well as complete free responses, please see Supplementary Materials. Notably, when responding via Likert scale to ‘How acceptable were the salsa classes as part of this research to you?’, the majority of participants selected ‘completely acceptable’, followed by ‘acceptable’, followed by ‘no opinion’ (a minority of participants); no participants reported that the intervention was unacceptable or completely unacceptable. Free text themes included: the value of enthusiastic, friendly and welcoming instructors; the influence of the experience level of other people in the class; motivation to attend; mood improvements after class (with variable durations); a preference for consistent attendees in the classes, giving the opportunity to build trust with other class participants; suggestions for smaller class sizes; occasional discomfort dancing with strangers or individuals of a specific gender; and a preference in some cases to learn a single role (leading or following) initially. Several participants noted other factors that influenced their mental health over the course of the longitudinal intervention (e.g. university term, positive and negative external life events) and made a point to say that they were not sure that the mental health measures accurately reflected this and captured the impact of the intervention in light of their broader context and mental health landscapes.
Discussion
Intervention effects
In this randomized controlled trial, participants in the social dance condition experienced a meaningful reduction in depression symptoms relative to those in the waitlist control condition. Specifically, intervention participants experienced an average within-group reduction of −3.0 points on the PHQ-9, and the between-group difference at the final timepoint was 2.45 points, exceeding the threshold for the MCID. This corresponds to a large standardized effect size (Cohen’s d = −0.92); larger standardized effect sizes are expected in comparisons against waitlist or inactive control conditions, and this context should be considered when interpreting the magnitude of the observed effect. The within-group reduction in PHQ-9 scores for the intervention group (but not the control group) exceeded the NICE criterion for clinically meaningful change (Pilling et al., Reference Pilling, Whittington, Taylor, Kendrick and Group2011). As expected, baseline depression severity impacted individuals’ depression trajectories over time – participants starting with higher PHQ-9 scores remained higher over the course of the study – but irrespective of initial severity, participating in social dance was associated with greater depression symptom improvement compared to the waitlist condition both in those with baseline depression indicative of a probable major depressive episode and in those with sub-threshold symptoms.
The intervention was associated with improvements across multiple secondary outcomes. While both groups experienced improvements over time in social anxiety, generalized anxiety, loneliness, and daily happiness, the intervention group participants experienced significantly greater reductions in social anxiety and a steeper increase in daily happiness than the waitlist group participants.
In terms of the exploratory outcomes, there was some evidence that the waitlist condition participants experienced an increase in social anhedonia over time, and this was not seen in the social dance participants. This may be because social dance helps to preserve or enhance interpersonal enjoyment, which might otherwise diminish over time in individuals with untreated depression in a waitlist context. Although social anhedonia did not mediate the effect of social dance on depression in this sample, there was a large variation of baseline social anhedonia across participants, which may have limited the sensitivity to detect an effect. Future research should further examine the impact of social dance on social anhedonia. If social dance acts by increasing interpersonal pleasure, this mechanism could also help to explain the absence of significant condition × time interactions on social and emotional processing tasks; the active ingredients of social dance may not correspond to the cognitive-emotional constructs typically sensitive to pharmacological interventions (Harmer, Duman, & Cowen, Reference Harmer, Duman and Cowen2017).
Overall, social dance was also found by participants to be acceptable in both qualitative and quantitative self-report acceptability measures.
Limitations
A key challenge in this study and the social dance literature at large is selection bias. Those who opt in to studies like this are likely to already believe that dance interventions will be helpful and enjoyable (Delattre et al., Reference Delattre, Applewhite, Buckman, Harmer and Murphy2024). However, this is unlikely to have been different across randomized conditions, and expectancy is known to be a moderator in other treatments for depression (Constantino et al., Reference Constantino, Arnkoff, Glass, Ametrano and Smith2011; Delgadillo, Moreea, & Lutz, Reference Delgadillo, Moreea and Lutz2016). Further, increasing activities that give one a sense of enjoyment is theorized to be a moderator of change in depression and is therefore a key feature of evidence-based psychological therapies for depression (Beck, Rush, Shaw, & Emery, Reference Beck, Rush, Shaw and Emery1979; Martell, Dimidjian, & Hermann-Dunn, Reference Martell, Dimidjian and Hermann-Dunn2010). As such, there is value in studying the efficacy of an intervention for the subset of the population that would be most likely to benefit from it and choose it as a treatment option. Further selection biases may have arisen due to the setting and locations for recruitment. However, efforts were made to ensure study advertisements were both gender and ethnically neutral by using a cartoon illustration of two brightly colored dancing figures (see Supplementary Materials), by advertising in both university and town locations, and by holding classes on weekday evenings, making them accessible to those working during weekdays. These decisions were made following consultation with the PPI codesign participants with the aim of increasing the potential for real-world utility.
Having a waitlist control condition could inflate relative effects between the intervention and control conditions as intervention participants receive additional attention, social interaction, and expectancy benefits, while those in the waitlist condition could experience demoralization or reduced motivation (Cunningham, Kypri, & McCambridge, Reference Cunningham, Kypri and McCambridge2013; Furukawa et al., Reference Furukawa, Noma, Caldwell, Honyashiki, Shinohara, Imai and Churchill2014). In such designs, comparisons of an active intervention against a waitlist or inactive control often yield larger standardized effect sizes than comparisons against active or placebo controls, and this context is important when interpreting the magnitude of observed effects. Indeed, while large standardized effect sizes were observed in the present study, these should be interpreted with caution, particularly where outcome variability may be restricted due to the PHQ-9 inclusion range (5–19), the relatively homogenous young adult sample, and use of a waitlist control group. At the same time, larger effects are not uncommon in trials comparing active interventions to inactive controls (Furukawa et al., Reference Furukawa, Noma, Caldwell, Honyashiki, Shinohara, Imai and Churchill2014) and should not be considered implausible in this context. To support transparent interpretation, raw PHQ-9 means and standard deviations are reported alongside between-group differences in change scores expressed in clinically interpretable units. Future studies of this nature should include active control conditions.
Regarding attrition, potential intervention effects in those who did not choose to continue the study could not be examined, and analyses were conducted only with participants who had data at all timepoints (on a per-protocol basis). Missing data mechanisms were not formally assessed, and although attrition was modest and largely due to logistical factors (Supplementary Appendix B), the possibility of bias due to non-random missingness cannot be fully excluded. Additionally, while the study’s primary and secondary outcomes were preregistered, model specifications were not included in the preregistration. The primary PHQ-9 analysis and secondary outcomes were prespecified and confirmatory, while class experiences as a moderator, task-based measures, and acceptability of intervention data were exploratory. Accordingly, findings beyond the primary outcome should be interpreted cautiously and viewed as preliminary pending replication, particularly as no formal adjustment for multiple testing was applied to secondary and exploratory analyses.
The logistical necessities and design of the study did not allow the researcher who collected the data to be blind to the conditions of participants. However, data quality checks and exclusion decisions were completed by other members of the research team who were unaware of group allocation to mitigate any potential bias. Regarding analysis, the study was powered for the main effect of the primary outcome, but possibly underpowered for other analyses, especially mediation and interaction effects; future research should include larger sample sizes to better examine secondary and exploratory measures.
Additionally, this study was not conducted with a clinical sample, even though some participants met criteria for a major depressive episode; future research with clinical populations should be conducted. Accordingly, the present findings should be interpreted as evidence for reductions in depressive symptoms, rather than as evidence of treatment efficacy in a population diagnosed via structured clinical interviews. However, the use of validated symptom thresholds reflects common symptom-based approaches to identifying and treating depression in community, primary care, and youth mental health settings, supporting the real-world relevance of the findings.
Lastly, as with many studies of depression and of dance interventions, the sample was predominantly female; it could be that other forms of social movement activities could reach a wider audience with similar benefits for depressive symptomology.
Conclusions
The findings of this study provide one of the first rigorous demonstrations that social dance can improve depression and related symptomology in young people. Given its scalability, low cost, and strong acceptability, social dance merits further investigation in clinical settings (such as the NHS) and as part of wellbeing programs in university and community settings.
Supplementary material
The supplementary material for this article can be found at http://doi.org/10.1017/S0033291726104991.
Acknowledgments
The authors wish to gratefully acknowledge the Oxford University Salsa Society (especially Sekela Ngamilo and Professor Laura Fortunato), the Linacre Latin Dance Society (especially Melissa Marx), and the Teddy Hall Latin Dance Society (especially Dr. Antonin Charret) for facilitating free salsa classes for participants in this research; Dr. Gwyneth Bradbury, Dr. Temitope Ajileye, Paco Perez Infante, Laura Sevillano, Dr. Matei Cirstea, and everyone else who taught salsa classes for this study; all of our participants, for their consistency and dedication to this longitudinal study; our PPI consultants for their time and thoughtfulness, as well as Dr. Alexandra Almeida for facilitating a section of the PPI group; members of the Psychopharmacology and Emotions Research Laboratory (PERL), especially Dr. Andreea Raslescu, Grace Warner (for daily mood data entry and validation assistance), Ella Williams (for EREC validation assistance), Dr. Amy Gillespie, Dr. Riccardo di Giorgi, and Amelia Thornton for data presentation formatting ideas; Dr. K. Sophia Ungermann for her redesign/refinement of the study logo; and Brian Andreas/Kai Skye for the use of his dancer artwork to recruit participants for the study.
Funding statement
The authors wish to gratefully acknowledge the Rachel Conrad Scholarship for the Study of Clinical Depression, the Oxford Medical Sciences Division, and The Clarendon Fund for stipend and course fee funding, as well as support from the NIHR Oxford Health Biomedical Research Centre via a BRC Pump Priming Grant. The views expressed are those of the authors and not necessarily those of the NHS, the NIHR, or the Department of Health.
Competing interests
B.D. conducted this study and also taught some of the salsa classes; she did not receive any financial compensation for teaching. None of the other authors have competing interests to declare.
Ethical standards
The authors assert that all procedures contributing to this work comply with the ethical standards of the relevant national and institutional committees on human experimentation and with the Helsinki Declaration of 1975, as revised in 2008.




 Open access

