


1. Introduction
The role of perceptions and beliefs in consumer decision-making has often taken a backseat to the measurement of consumers’ preferences in the study of food choice. However, a body of literature has begun to emerge in recent years aiming to understand how beliefs interact with preferences in explaining food choice behavior (Costanigro, Deselnicu, and Kroll, Reference Costanigro, Deselnicu and Kroll2015; Costanigro and Onozaka, Reference Costanigro and Onozaka2020; Lusk, Schroeder, and Tonsor, Reference Lusk, Roosen and Bieberstein2014; Malone and Lusk, Reference Malone and Lusk2017, Reference Malone and Lusk2018). For example, products with an organic label are often associated with perceptions of greater healthiness and higher nutritional content, views which do not always align with the scientific evidence (Costanigro, Deselnicu, and Kroll, Reference Costanigro, Deselnicu and Kroll2015; Guilabert and Wood, Reference Guilabert and Wood2012; Smith-Spangler et al., Reference Smith-Spangler, Brandeau, Hunter, Clay Bavinger, Pearson, Eschbach and Sundaram2012). Prior research has identified the need to further examine this issue, showing that subjective beliefs can alter the interpretation of results in choice experiments (CEs) (Costanigro, Deselnicu, and Kroll, Reference Costanigro, Deselnicu and Kroll2015; Costanigro and Onozaka, Reference Costanigro and Onozaka2020; Lusk, Schroeder, and Tonsor, Reference Lusk, Schroeder and Tonsor2014). Whereas previous research has tended to focus on consumers’ beliefs about product types (e.g., chicken versus beef), here, as in Costanigro, Deselnicu, and Kroll (Reference Costanigro, Deselnicu and Kroll2015), we focus specifically on beliefs about different product labels, and we go one step further by showing how one can aggregate beliefs across multiple labels to determine impacts in a model of product choice. Studying how labels influence product beliefs is important given the literature suggesting that labels such as organic can create positive “halos,” affecting a variety of beliefs about product attributes and sensory evaluations even when the underlying products are identical (Apaolaza et al., Reference Apaolaza, Hartmann, Echebarria and Barrutia2017; Lee et al., Reference Lee, Chen, Shimizu, Kniffin and Wansink2013; Schuldt and Schwarz, Reference Schuldt and Schwarz2010).
For our application, we turn to the US retail chicken market. Chicken is the most consumed meat in the United States and has experienced rapid consumption growth in recent decades. Per-capita chicken consumption increased 25% over the past two decades from 1999 to 2019 (USDA World Outlook Board, 2020). In 2019, US consumers ate 1.22 lbs. of chicken for every pound of beef consumed and 1.37 lbs. of chicken for every pound of pork consumed on a boneless retail basis (USDA World Agricultural Outlook Board, 2020). Despite these consumption trends, academic research on consumer demand for chicken significantly lags that for pork and beef.Footnote 1
We elicit consumers’ perceptions of the taste, health, safety, and animal welfare impacts associated with seven different labels placed on chicken breast packages. By varying the presence/absence of labels in a CE related to chicken breast choice, we are able to explore the effect of beliefs on consumer behavior. Moreover, we are able to decompose the utility consumers derive from labels, such as organic, into the impacts resulting from beliefs about taste, health, safety, and animal welfare versus other factors that we cannot explain. In addition, we are able to understand how the effects of the beliefs vary with different information from media outlets. Finally, in a departure from prior research, we seek to study the convergent validity of the findings from the CE by comparing individual-specific estimated utilities for taste, healthy, safety, and animal welfare to the choices in a separate best-worst task, where the participants rated their four most important and least important product characteristics when purchasing chicken.
The relationship between beliefs and food choice is complex. A number of studies have focused on consumer perceptions of various food and beverage products and their effect on willingness to pay (WTP). Many studies have analyzed whether perceptions of a particular attribute increases or decreases WTP for a product (Clark et al., Reference Clark, Stewart, Panzone, Kyriazakis and Frewer2017; Costanigro, Deselnicu, and Kroll, Reference Costanigro, Deselnicu and Kroll2015; Guilabert and Wood, Reference Guilabert and Wood2012; Lusk, Roosen, and Bieberstein, Reference Lusk, Schroeder and Tonsor2014; Lusk, Reference Lusk2018; Napolitano et al., Reference Napolitano, Castellini, Naspetti, Piasentier, Girolami and Braghieri2013; Ortega and Wolf, 2018; Tonsor and Olynk, Reference Tonsor and Olynk2011; Van Loo et al., Reference Van Loo, Caputo, Nayga, Meullenet and Ricke2011). Another strain of literature aims to disentangle beliefs from preferences in influencing choices and attempts to determine which beliefs are predominant in decision-making and ranks their importance (Lister et al., Reference Lister, Tonsor, Brix, Schroeder and Yang2017; Malone and Lusk, Reference Malone and Lusk2017, Reference Malone and Lusk2018).
Healthiness is an attribute that drives consumer decision-making and WTP. Several studies have shown that the presence of an organic label is typically associated with a “healthy” product (Costanigro, Deselnicu, and Kroll, Reference Costanigro, Deselnicu and Kroll2015; Guilabert and Wood, Reference Guilabert and Wood2012; Lusk, Reference Lusk2018; Van Loo et al., Reference Van Loo, Caputo, Nayga, Meullenet and Ricke2011). In some cases, consumer beliefs about organic production may outweigh sensory characteristics of chicken (Napolitano et al., Reference Napolitano, Castellini, Naspetti, Piasentier, Girolami and Braghieri2013). These beliefs are particularly strong when associated with the USDA organic label, where foods with the label are believed to be healthier than products with a standard organic label (Guilabert and Wood, Reference Guilabert and Wood2012; Van Loo et al., Reference Van Loo, Caputo, Nayga, Meullenet and Ricke2011). This association with the organic label can decrease if information is provided that shows contrary evidence to the presupposed belief of healthiness related to organic (Costanigro, Deselnicu, and Kroll, Reference Costanigro, Deselnicu and Kroll2015).
Food safety, especially in the case of adopting new technologies, is of primary importance to consumers (Lusk, Roosen, and Bieberstein, Reference Lusk, Schroeder and Tonsor2014; Lusk and Rozan, Reference Lusk and Rozan2008). This is particularly true of adopting genetically modified (GM) foods, for example, in the United States if a federal GM labeling program was implemented, consumers would believe that the GM food is unsafe and of lower quality than non-GM foods (Lusk and Rozan, Reference Lusk and Rozan2008). In general, human risk aversion and philosophical worldviews are likely to contribute to concerns of new technologies (Lusk, Roosen, and Bieberstein, Reference Lusk, Schroeder and Tonsor2014).
Animal welfare is another attribute that consumers may consider when purchasing food (Clark et al., Reference Clark, Stewart, Panzone, Kyriazakis and Frewer2017; Lusk, Reference Lusk2018; Ortega and Wolf, 2018; Tonsor and Olynk, Reference Tonsor and Olynk2011). Media attention to animal welfare attributes can cause pork and chicken consumers to substitute these products for nonmeat alternatives (Tonsor and Olynk, Reference Tonsor and Olynk2011). Some research indicates animal welfare is not a priority for most chicken consumers, unless additional information about production practices is provided, which consumers generally have little awareness of (Lusk, Reference Lusk2018; Ortega and Wolf, 2018). In general research shows a small premium for a higher perceived animal welfare in meat production (Clark et al., Reference Clark, Stewart, Panzone, Kyriazakis and Frewer2017).
This study builds on the prior literature that seeks to analyze preferences, WTP for foods, or estimate whether a belief is significant in explaining choice of a food item. Similar to a few prior studies, we seek to estimate which beliefs are primary drivers of choice when analyzing food choice (Lister et al., Reference Lister, Tonsor, Brix, Schroeder and Yang2017; Malone and Lusk, Reference Malone and Lusk2017, Reference Malone and Lusk2018). We add to the literature by analyzing the beliefs individuals have about specific individual food labels. It is unclear as to which beliefs are of primary importance. For meats and animal products, some evidence suggests that food safety and freshness are the most important beliefs for consumers (Lister et al., Reference Lister, Tonsor, Brix, Schroeder and Yang2017), while others show that taste is the most important belief in meat selection, over food safety and health (Malone and Lusk, Reference Malone and Lusk2017). We accomplish this by determining the extent to which beliefs affect consumer WTP for labels. For example, “Does a genetically modifided organism (GMO) label primarily alter consumers’ perception of the healthiness, safety, or taste of a food product?” This information is potentially valuable to food manufacturers and retailers seeking to understand how the provision of a label alters consumers’ perceptions of a product. Thus, rather than just understanding whether, say taste is more or less valuable than healthiness, at an aggregate level, this paper shows how the provision of specific labels alters these perceptions. In addition, another contribution of this paper is to use a “food values” question to convergently validate the results, which is done by comparing our individual estimates from a regression model to the corresponding responses to the “food values” task (Lusk and Briggeman, Reference Lusk and Briggeman2009). Prior studies have primarily used “food values” for measurement of attributes and the external validity of food choices and demand, but not the values implied by regression coefficients arising by the inclusion of beliefs in the utility function (Lister et al., Reference Lister, Tonsor, Brix, Schroeder and Yang2017; Lusk, Reference Lusk2011; Lusk and Briggeman, Reference Lusk and Briggeman2009).
2. Methods
2.1. Consumer Sample
This paper makes use of the same CE data in Lusk (Reference Lusk2018) but augments the CE data with data on beliefs and data from a best-worst task. In 2017, a national survey of US chicken consumers was delivered online to a panel maintained by Survey Sampling Inc. To screen for chicken consumers, the initial question was “Do you eat chicken (e.g., breasts, thighs, wings, nuggets, tenders)?”. Three percent of respondents were removed from the analysis as they failed to answer “yes” to this question and were directed to the end of the survey. In total, 2,049 responses were collected. At the end of the survey, the respondents answered demographic questions. The sample demographic characteristics reflected the US Census population in general. The few exceptions are that the sample collected is a bit younger than average and has fewer respondents in the highest income category of $160,000/year or more than does the general population.
2.2. Choice Experiment
The study used a CE method to elicit consumer preferences for labels. CEs are commonly used in meat and general food demand analysis (e.g., Lusk, Roosen, and Fox, Reference Lusk, Roosen and Fox2003; Mennecke et al., Reference Mennecke, Townsend, Hayes and Lonergan2007). The CE used in this study varied the presence or absence of five labels: organic, no antibiotics ever (NAB), no hormones added, slow growth, and non-GMO. In addition, products had one of two popular chicken brands displayed prominently on the packages. Prices of choices varied from $1.99 to $5.99 in $0.50 increments as per price data from the US Bureau of Labor Statistics.
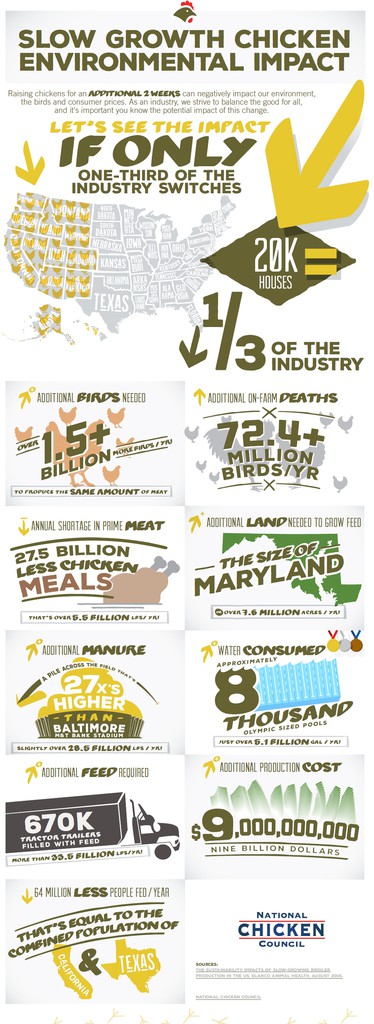
A D-optimal design was created consisting of 12 choice questions using the software Ngene. An image of one of the CE questions is Figure 1. To analyze the effect of information on choices, respondents were randomly assigned to one of three different information treatments. The first (a control) did not provide any additional information. Another treatment (pro-slow growth) was shown two excerpts from news articles from the New York Times (Strom, Reference Strom2017) and the National Public Radio (Charles, Reference Charles2016) which provided information favorable to slow growth chickens. The last (anti-slow growth) showed a graphic of information from the National Chicken Council that was critical of slow growth production practices (National Chicken Council, 2017). See Lusk (Reference Lusk2018) for more details.
Choice experiment.

After the CE was completed, the participants were asked a series of questions pertaining to their beliefs about the aforementioned labels. Respondents were asked “How healthy or unhealthy do you consider chicken sold with each of the labels shown below?”, and then they were shown each of the seven labels/brands, and for each they responded on a scale of 1 = very unhealthy to 5 = very healthy. Other questions were “How tasty or un-tasty do you consider chicken sold with each of the labels shown below?”, “How safe or risky in terms of food safety, do you consider chicken sold with each of the labels shown below?”, and “How high or low a level of chicken animal welfare is associated with each of the labels shown below?”. Each of the questions was answered according to a five-point Likert scale with one being the lowest and five as the highest. An image of the belief questions is seen in Figure 2.
Example belief question.

2.3. Direct Elicitation of Preferences
Respondents were presented with a single variant of a best-worst-type question related to “food values” (Lusk and Briggeman, Reference Lusk and Briggeman2009). In particular, respondents were asked, “How important are the following items to you when deciding whether to buy chicken?”. Thirteen items were shown and respondents had to pick four items and click and drag them into a box labeled “most important” and pick four other items and click and drag them into a box labeled “least important.” Each attribute was listed with a short definition, for example, “Taste, the flavor of food in your mouth.” An image of the food values question is in Figure 3. To be clear, this is not a full best-worst questioning approach as only a single question was asked, where respondents provided a crude ranking of 13 food values: most important, neither most nor least important, or least important.
Food values question.

2.4. Econometric Methods
Our primary objective in this study is to determine the effect of consumer’s beliefs about health, safety, taste, and animal welfare on chicken purchasing and estimated WTP for a label. We use a similar approach to Malone and Lusk (Reference Malone and Lusk2018) who examined how valuable taste is compared to health or safety; our approach differs in that our beliefs related to product labels, and each choice option may have one or more labels. As such we must aggregate beliefs over labels to infer an overall belief about the safety or health of a choice option.
Our analysis is based on the commonly used random utility model. The indirect utility V participant i derives from chicken breast option j in treatment t is
 $$\eqalign{V_{ijt} \, = \, \beta _{tji} + \alpha _{ti} \cdot Price_j + \mathop \sum \limits_{k = 1}^7 \vartheta _{ti}^k \cdot d_j^k + \tau _{1ti} \cdot {\overline {Health} _{ij}} + \tau _{2ti} \cdot {\overline {Taste} _{ij}} \cr \quad + \tau _{3ti} \cdot {\overline {Safety} _{ij}} + \tau _{4ti} \cdot {\overline {Welfare} _{ij}}}$$
In this function, ${\beta _{tj}}$
is an alternative-specific constant indicating the utility of chicken breast j in treatment t relative to the “no purchase” option;
${\beta _{tj}}$
is an alternative-specific constant indicating the utility of chicken breast j in treatment t relative to the “no purchase” option; $Pric{e_j}$
is price of chicken breast package j; αti is the marginal disutility of price;
$Pric{e_j}$
is price of chicken breast package j; αti is the marginal disutility of price; $d_j^k$
represent dummy variables indicating whether option j has the k
th
label present (organic, no antibiotics, no added hormones, slow growth, non-GMO and the brands Tyson versus Perdue);
$d_j^k$
represent dummy variables indicating whether option j has the k
th
label present (organic, no antibiotics, no added hormones, slow growth, non-GMO and the brands Tyson versus Perdue); $\vartheta _t^k$
represents a portion of the utility associated with each label; and,
$\vartheta _t^k$
represents a portion of the utility associated with each label; and, ${\overline {Health} _{ij}}$
,
${\overline {Health} _{ij}}$
, ${\overline {Taste} _{ij}}$
,
${\overline {Taste} _{ij}}$
, ${\overline {Safety} _{ij}}$
, and
${\overline {Safety} _{ij}}$
, and ${\overline {Welfare} _{ij}}$
are individual i’s average belief of the health, taste, safety, and animal welfare of option j, which was obtained from the Likert scale belief questions in Figure 2. The average health belief, for example, of option j is
${\overline {Welfare} _{ij}}$
are individual i’s average belief of the health, taste, safety, and animal welfare of option j, which was obtained from the Likert scale belief questions in Figure 2. The average health belief, for example, of option j is
 $${\overline {Health} _{ij}} = {{\sum\limits_{k = 1}^7 {} d_j^k \cdot Health_i^k} \over {\sum\limits_{k = 1}^7 {} d_j^k}}$$
where the indicator variable for each label is multiplied by the corresponding health belief associated with the label, $Health_i^k$
indicating the individual i’s belief about the healthiness of label k.
$Health_i^k$
indicating the individual i’s belief about the healthiness of label k.
The coefficients ${\tau}$
represent the marginal utilities from changes in perceived health, taste, safety, and animal welfare. Thus, the coefficients represent the consumers’ preferences for health, taste, safety, and animal welfare. Because preferences for and beliefs about, health, taste, safety, and welfare are controlled for in the utility function,
${\tau}$
represent the marginal utilities from changes in perceived health, taste, safety, and animal welfare. Thus, the coefficients represent the consumers’ preferences for health, taste, safety, and animal welfare. Because preferences for and beliefs about, health, taste, safety, and welfare are controlled for in the utility function, $\vartheta _{ti}^k$
reflects the utility derived from label k that cannot be explained by health, taste, safety, and animal welfare. Adding an iid extreme value error term to the aforementioned utility function and assuming all respondents share the same preference parameters results in the multinomial logit (MNL) model, where the probability of choice is given by:
$\vartheta _{ti}^k$
reflects the utility derived from label k that cannot be explained by health, taste, safety, and animal welfare. Adding an iid extreme value error term to the aforementioned utility function and assuming all respondents share the same preference parameters results in the multinomial logit (MNL) model, where the probability of choice is given by:
 $${\rm{Probability}}\left( {i\,{\rm{chooses}}\,j\,{\rm{in}}\,{\rm{treatment}}\,t} \right) = {{{e^{{V_{ijt}}}}} \over {\sum\limits_{k = 1}^k {{e^{{V_{ikt}}}}} }}.$$
To allow for additional heterogeneity in individual preferences, a random parameter logit (RPL) model was also estimated (Train, Reference Train2009). The RPL model was estimated using simulated maximum likelihood with 500 Halton draws assuming all non-price coefficients are normally distributed. The price coefficient was assumed to be a constant term.
WTP for individual i for the presence of label k (versus no label) is
 $$WT{P^k}_i = {{{\vartheta _k} + {\tau _1}\cdot Healt{h_{ik}} + {\tau _2}\cdot Tast{e_{ik}} + {\tau _3}\cdot Safet{y_{ik}} + {\tau _4}\cdot Welfar{e_{ik}}} \over { - {\alpha _t}}}$$
In addition, we obtained so-called individual-specific estimates of each person’s preferences using the estimated parameter distribution as the prior and update these with the individual’s choices (see Train, Reference Train2009). These are parameter means conditional on each individual’s 12 choices, which converge to individual’s preferences as the number of choice questions grows (Sarrias, Reference Sarrias2020). Because the $\alpha $
parameter is a constant term, WTP is normally distributed. The WTP estimates are calculated through a Krinsky and Robb simulation (Krinsky and Robb, Reference Krinsky and Robb1986).
$\alpha $
parameter is a constant term, WTP is normally distributed. The WTP estimates are calculated through a Krinsky and Robb simulation (Krinsky and Robb, Reference Krinsky and Robb1986).
Another key objective of this study is to explore how preferences for, for example, health, from the CE, ${\tau _{i1}},\;$
compare with an alternative measure of preferences of health from our food values ranking. Are people who tend to demonstrate high preferences for safety in the CE also the same ones who tend to indicate safety as one of the most important food values? To explore this matter of convergent validity, we calculate the correlations between the individual-specific preferences for safety, taste, health, and animal welfare and the corresponding responses to the best-worst “food values” question. The food value questions were coded as follows: 1 if the respondent placed the value in the “most important” category, −1 if the value was placed in the “least important” category, and 0 if it was in neither category. In addition to the correlations, we compared the mean
${\tau _{i1}},\;$
compare with an alternative measure of preferences of health from our food values ranking. Are people who tend to demonstrate high preferences for safety in the CE also the same ones who tend to indicate safety as one of the most important food values? To explore this matter of convergent validity, we calculate the correlations between the individual-specific preferences for safety, taste, health, and animal welfare and the corresponding responses to the best-worst “food values” question. The food value questions were coded as follows: 1 if the respondent placed the value in the “most important” category, −1 if the value was placed in the “least important” category, and 0 if it was in neither category. In addition to the correlations, we compared the mean $\;\tau $
’s for people who rated each food value as “most important,” “least important,” or “neither” using an ANOVA test. The mean coefficient values were calculated for each belief value and separated based on their placement in the “food values” category. The ANOVA tested for any significant differences between the belief means by food value placement. This was repeated for each treatment.
$\;\tau $
’s for people who rated each food value as “most important,” “least important,” or “neither” using an ANOVA test. The mean coefficient values were calculated for each belief value and separated based on their placement in the “food values” category. The ANOVA tested for any significant differences between the belief means by food value placement. This was repeated for each treatment.
3. Results
Table 1 reports the findings from the initial MNL models. In the control and the two information treatments, all of the production-related labels (i.e., organic and non-GMO) are positive and significant indicating that the presence of the label increases the utility of the consumer. The introduction of the belief variables into the models decreases the magnitude of utility of the labels due to the beliefs explaining more of the variation in choice. In all of the treatments, the organic label contributes the most to the consumers’ utility when compared to the other labels. The main differences in the models are the information treatments. For all of the treatments, the health belief is the largest contributor of the individual’s utility and is positive and significant in all cases. The differences between treatments are primarily found in the belief variables. Animal welfare is significant and positive in both the pro-slow growth treatment and the anti-slow growth treatment, while being insignificant in the control group. Taste is positive and significant in the control and the pro-slow growth treatment. Safety is positive and significant in the control and the anti-slow growth treatment.
MNL estimates

*Significance at the 5% or 10% level.
**Significance at the 1% level.
Notes: The columns are designated by treatment and the rows are designated by each variable. The coefficient value is displayed first, followed by the standard error. The left columns are the estimates without the beliefs, and the estimates to the right contain the beliefs.
Table 2 shows the results from the RPL. Generally, the results are quite consistent with what was found in the MNL results, but the RPL models have significantly greater model fit when comparing the AIC values. Interestingly, the slow growth label contributes the most utility in the control and pro-slow growth treatments. Consistent with the prior MNL models, the RPL estimates for the labels are positive and significant, though no significant differences occurred in brands other than some significant disutility for Tyson in the pro-slow growth treatment. The primary differences between the models are found once again in the belief variables. Health is positive and significant in all of the treatments and contributes the most to utility. Taste and safety are also positive and significant in all of the information treatments. Animal welfare is not significant in either of the anti-slow growth treatment or the control. The significance of animal welfare in the pro-slow growth treatment is likely attributed to the content of the information the participants received. The individual estimates from the RPL changed some of the significance of the belief variables from the MNL. In the pro-slow growth treatment, the average food safety belief is statistically significant unlike in the MNL. In the anti-slow growth treatment, the RPL shows a few more changes from the MNL than the other treatments. The brands are not significantly different from each other, but the average taste becomes significant and the animal welfare perception is now insignificant.
RPL estimates

*Significance at the 5% or 10% level.
**Significance at the 1% level.
Notes: The columns are designated by treatment and the rows are designated by each variable. The coefficient value is displayed first, followed by the standard error of the coefficient, the estimates for the standard deviations, and the standard errors of the standard deviations.
Table 3 shows the mean WTP values and the subsequent decomposition of the WTP values. The WTP estimates were derived from the Krinsky and Robb simulation from the RPL. In the control group, organic has the highest mean WTP and the lowest WTP is for the slow growth label and the brands. In the pro-slow growth treatment, the slow growth label has the highest WTP, and the lowest are the brands. The anti-slow growth treatment had the lowest values for WTP, and organic was valued the highest, with the slow growth and brand labels having the lowest values.
Decomposition of mean WTP from the RPL

Notes: The decomposition values are the estimated proportions of the mean WTP from the RPL estimates. To state statistical significance, * is significant at the 5% or 10% level and ** is significant at the 1% level.
The decomposition of WTP shows that in the control group, the health belief contributes the most to WTP for each of the labels, which is followed by taste accounting about around a quarter of the of the WTP. Food safety contributes a considerable amount as well. Animal welfare contributes a miniscule amount and some of the variation in WTP remains unexplained by the presence of the label. The health, taste, and safety components are significant in all labels, while animal welfare is not significant for any label in the control. The base utility from the presence of the label is significant for all labels except for the brands. In the pro-slow growth treatment, the health belief contributed the most to consumers’ WTP and is followed by animal welfare. The drastic increase in the contribution of animal welfare is likely due to the positive information treatment. Food safety increases marginally from the control, but the most significant decrease is that the taste perception supplies much less utility. The variables do not account for all of the variation in WTP and some remains unexplained and is accounted for the presence of the label. All of the components of the WTP are significant for the pro-slow growth treatment. In the anti-slow growth treatment, the negative information leads to a substantial drop in the amount animal welfare contributes to WTP resembling the control group. Perceived healthiness is again the most important indicator accounting for close to half of WTP, followed by taste. The contribution to WTP from the food safety belief is a similar value to the other treatments, and some utility remains unexplained by the presence of the label. All of the components are significant with the exception of animal welfare and the base utility from the presence of the label for the brands.
Table 4 shows the correlations between the preference coefficients from the RPL and the responses to the “food values” question to test for convergent validity. In general, the correlations were small, showing a general inability to convergently validate the results. In the control with no information, all of the food values are positively correlated with the corresponding belief value. The taste value is the only one that is significant identifying some convergent validity. In the pro-slow growth treatment, the correlations are insignificant. The anti-slow growth treatment shows some unintuitive significance as the taste values are significantly negatively correlated with each other. The animal welfare values are positively correlated with the coefficients.
Bivariate correlations between preferences in the choice experiment and food values ranking

*Significance at the 5% or 10% level.
**Significance at the 1% level.
Notes: The rows represent the belief values and the columns represent each treatment.
Table 5 show the results from the ANOVA tests for the control group and the anti-slow growth group due to statistical insignificance the correlations for the pro-slow growth group are in the Appendix. The difference in mean preferences from the CE by responses to the “food values” questions were largely insignificant. The control group shows a significant difference in the mean taste variable across the ranking in the “food values” question. This implies that in the control group the preference coefficients for taste were significantly different based on how the respondent answered the “food values” question. This test is another convergent validity check. In the anti-slow growth treatment, some significant differences were detected in the taste and animal welfare values.
Mean preferences from choice experiment by responses to food value questions means crossed with food values – control group

*Significance at the 5% level.
Notes: The rows denote the beliefs and the first three columns show the ranking of the corresponding food value. Column 4 denotes the P value from an ANOVA test.
4. Conclusions
This study shows that several labels are positively valued by consumers of chicken breast. The organic label commanded the highest WTP premium except when people were provided information that opposed slow growth production, where non-GMO had the highest WTP, affirming previous research regarding the “halo” effect of the organic label (Costanigro, Deselnicu, and Kroll, Reference Costanigro, Deselnicu and Kroll2015; Guilabert and Wood, Reference Guilabert and Wood2012). Our study is able to go further by explaining why consumers value organic and other labels. In particular, we find perceptions of health are a primary driver of labels’ values, representing over 50% of each labels WTP premium in some cases.
Contrary to previous studies, our results suggest that health has the largest impact on the WTP, whereas previous studies identify that taste and food safety are the most important beliefs determining WTP for meats (Lister et al., Reference Lister, Tonsor, Brix, Schroeder and Yang2017; Malone and Lusk, Reference Malone and Lusk2017). One possible explanation for this difference is the difference in products; we studied chicken breast alone where these other studies focused on combinations of beef, dairy milk, and chicken breast. The discrepancy in food values between Lister et al., Reference Lister, Tonsor, Brix, Schroeder and Yang2017) and our attribute ranking of chicken breasts may be due to the difference in food values questions, and no presence of Likert scale questions. Moreover, this study focuses on labels rather than overall products, and the particular labels studies here appear to be ones that seemingly promote perceptions of health. A particularly interesting finding was the results for the animal welfare belief and slow growth label. In the treatment that gave positive reporting on slow growth chicken, the WTP for the attribute increased confirming prior work suggesting higher perceptions of animal welfare lead to increased WTP (Ortega and Wolf, 2018), but in other treatments that either presented no additional information or a negative perspective on slow growth chicken, other attributes gave the consumers higher utility (Lister et al., Reference Lister, Tonsor, Brix, Schroeder and Yang2017), and animal welfare perception is not a significant determinant of utility. It seems that unless the consumer is told directly about the potential animal welfare benefits of a specific label or products, it is not a significant determinant of utility or significantly increases their overall WTP.
It is noteworthy that the correlations between the “food values” questions and preferences from the RPL for health, taste, safety, and animal welfare were quite low. The initial hypothesis was that there would be substantial correlation between these questions and the coefficients, especially the relationship between the average beliefs and the related values question, as previous work was able to validate these type of questions (Lusk, Reference Lusk2011). This, however, was not the case. One would expect that if a particular consumer has an especially high perception of taste or health of a product, then these beliefs would be highly correlated as an important attribute when making chicken selections and vice versa. Whether one approach is more “correct” or a better predictor of future purchase behavior is an issue worth of additional investigation. Lusk (Reference Lusk2011) has shown that responses to food values questions (on a survey) are predictive of retail shopping behavior (given by scanner data). At this point, it is unclear what is causing the discrepancy between these two methods of measuring preferences. One approach (the food values) directly elicits preference rankings, whereas the other arrives at preference measures indirectly by including beliefs in a random utility choice model. One possibility is that full implementation of best-worst questioning would provide more precise preference rankings of the issues in question, which might provide to be more correlated with those inferred from the inclusion of beliefs in choice models.
Overall, this study shows that health, taste, and safety beliefs associated with various chicken labels explain a substantial amount of premium consumers are willing to pay. Incorporation of beliefs into the utility model yields insight as to why a specific label is valued higher than another. The information treatments likely affected the ranking of the beliefs, which implies the effectiveness of information campaigns at inducing perceptions of products and labels.
Author Contributions
Conceptualization: Z.T.N. and J.L.L.; Methodology: J.L.L.; Formal Analysis: Z.T.N.; Data Curation: J.L.L.; Writing—Original Draft: Z.T.N.; Writing—Review and Editing: J.L.L.; Supervision: J.L.L.; Funding Acquisition: J.L.L.
Financial Support
This work was supported by the Food Industry Association.
Conflict of Interest
We report no conflicts of interest.
Data Availability Statement
The data are available on request from the authors.
Appendix
Belief variable means, control group

Belief variable means, pro-slow growth group

Mean beliefs, anti-slow growth group


 Open access