


INTRODUCTION
As shown in the Intergovernmental Panel on Climate Change report (IPCC 2013), the global temperature of the Earth’s surface increased by ca. 0.85ºC in the years 1880–2012 AD. The IPCC summarized that human activity is the dominant cause of observed warming since the mid-20th century, and that a significant contribution to this effect came from greenhouse gases emission. The carbon dioxide (CO2) originating from fossil fuel combustion was an important component of these emissions.
Considerable local fossil CO2 emissions might be expected in areas where coal mining is located, usually accompanied by heavy industry and power plants. Usually, these areas are also heavily urbanized, and cities are a net source of atmospheric CO2 (Velasco and Roth Reference Velasco and Roth2010). A dense human population leads to elevated CO2 emissions originating from transport and heating, but also from respiration and waste decay. On the other hand, carbon dioxide emissions are reduced by negative CO2 flux connected with photosynthetic uptake due to plant productivity in the urban environment (Pataki et al. Reference Pataki, Bowling and Ehleringer2003; Vessala et al. 2008; Jasek et al. Reference Jasek, Zimnoch, Gorczyca, Smula and Różański2014).
In addition, for the investigated Upper Silesia area, a considerable CO2 source may be emissions from coal mine shafts, even from abandoned ones left for water pumping purposes (Wrona et al. Reference Wrona, Sułkowski, Rózański and Pach2016a, Reference Wrona, Różański, Pach, Suponik and Popczyk2016b).
Detailed studies of the CO2 budget were performed for the urban environment of Krakow city, located ca. 130 km E from Gliwice by Jasek-Kamińska (Reference Jasek-Kamińska2017; Figure 1). The results showed that in the atmospheric CO2 budget for the years 2012–2014, the net CO2 flux was 8.15 Mt CO2/yr, and 82% of this emission (6.7 Mt CO2/yr) came from fossil fuel combustion due to road traffic, industry, and buildings. The second considerable flux of ca. 1.4 Mt CO2/yr (17%) was emitted by the biosphere, through respiration and organic matter decay. Thus, the remaining CO2 fluxes constituted only ca. 1%.
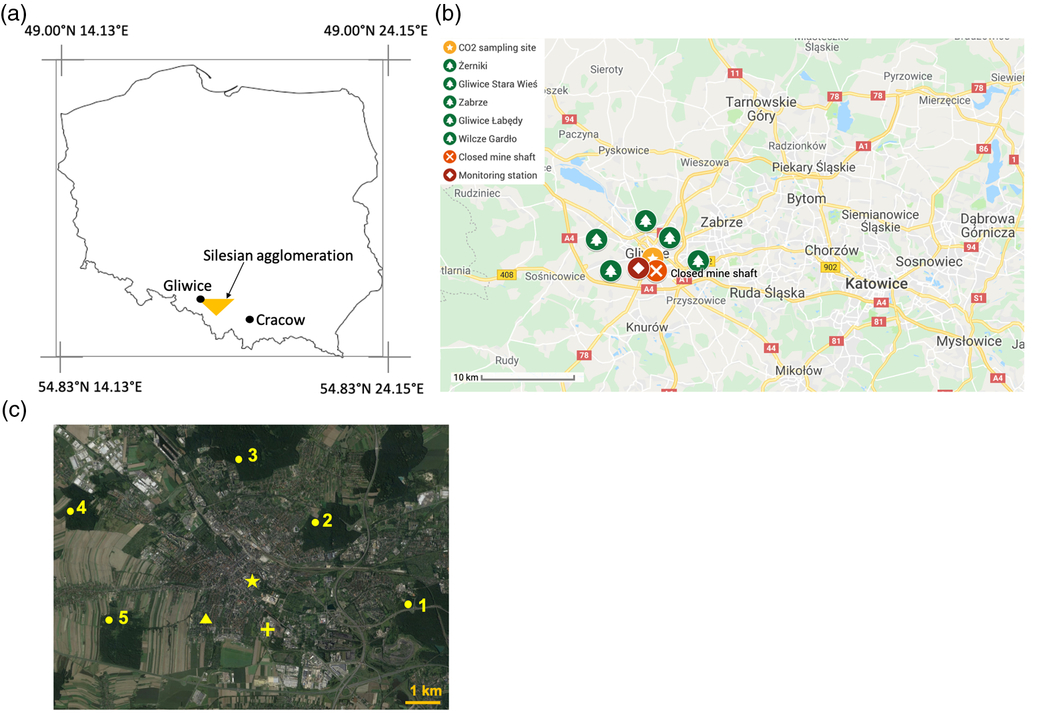
(a) Map of Poland showing the cities for which the carbon isotopic composition of atmospheric CO2 and/or annual tree rings was studied (Gliwice, Krakow, Silesian agglomeration). The tree ring site at Niepołomice Forest is located 20 km E from Krakow. (b) Silesian agglomeration, Gliwice surroundings and sampling sites. (c) Gliwice and locations discussed in this paper: star–atmospheric CO2; cross–closed mine shaft; triangle–air and meteorological monitoring station; Pinus sylvestris L. trees: 1–Zabrze, 2–Żerniki, 3–Gliwice Łabędy, 4–Gliwice Stara Wieś, 5–Gliwice Wilcze Gardło.
Each CO2 flux has its characteristic composition of the three carbon isotopes: 12C, 13C (stable), and 14C (radioactive, called radiocarbon), resulting from the specific source and the fractionation processes during CO2 formation. In particular, fossil fuels contain no 14C, and their burning leads to global depletion of the 14C content in atmospheric CO2. This phenomenon was first observed by Suess (Reference Suess1955) in tree rings and named afterwards as the “Suess effect.” Subsequently, these results were confirmed by many other authors (e.g. Keeling Reference Keeling1973; Tans et al. Reference Tans, de Jong and Mook1979; Stuiver and Quay Reference Stuiver and Quay1981). It can be expected that the amount of CO2 emissions will be reflected in the content of 14C and 13C isotopes in atmospheric CO2. Furthermore, seasonal tree rings built from the photosynthesized CO2 should also record its isotopic composition, although this process is altered by tree physiology.
The radiocarbon content may be expressed as the Δ14C value (‰), which is calculated according to the equation below (van der Plicht and Hogg Reference van der Plicht and Hogg2006):
 $${\Delta ^{14}}C = \left\{ {{F^{14}}C\cdot\,exp\left[ { - {\it\lambda} \left( {{T_i} - 1950} \right)} \right] - 1} \right\}\cdot\,1000 \permil$$
(1)
$${\Delta ^{14}}C = \left\{ {{F^{14}}C\cdot\,exp\left[ { - {\it\lambda} \left( {{T_i} - 1950} \right)} \right] - 1} \right\}\cdot\,1000 \permil$$
(1)
where: F 14C – normalized 14C concentration; λ – decay constant for 14C isotope, equal to 8267 yr–1; T i – calendar year.
The Suess effect may be considered on a global, regional, or local scale. For Europe, the high-Alpine monitoring station Jungfraujoch is considered not to be affected by any local Suess effect. The Δ14C of atmospheric CO2 at Jungfraujoch, commonly used as a background value (Levin et al. Reference Levin, Hammer, Kromer and Meinhardt2008), ranged from +40 to +25‰ in the years 2011–2013 (Hammer and Levin Reference Hammer and Levin2017). Fossil fuel emission may cause a local Δ14C decrease of dozens of permils.
The details about the carbon and radiocarbon mass-balance equations used in the present study follow the recommendations by Levin et al. (Reference Levin, Kromer, Schmidt and Sartorius2003) and Zimnoch et al. (Reference Zimnoch, Florkowski, Necki and Neubert2004) and are provided in the Supplementary Materials. The measure of the local Suess effect is given as a percentage of fossil CO2 (hereafter FFCO2) in the total atmospheric CO2 at a given site. The FFCO2 value is calculated according to the formula:
 $$FFC{O_2} = {{C{O_{2fossil}}} \over {C{O_{2meas}}}} = {{{\Delta ^{14}}{C_{bg}} - {\Delta ^{14}}{C_{meas}}} \over {{\Delta ^{14}}{C_{bg}} + 1000}}\cdot 100\% $$
(2)
$$FFC{O_2} = {{C{O_{2fossil}}} \over {C{O_{2meas}}}} = {{{\Delta ^{14}}{C_{bg}} - {\Delta ^{14}}{C_{meas}}} \over {{\Delta ^{14}}{C_{bg}} + 1000}}\cdot 100\% $$
(2)
where: Δ14 C bg – value for background atmospheric CO2, Δ14 C meas – value for local CO2
Our studies of the fossil CO2 component for the area of Southern Poland were based on carbon isotopic measurements of both atmospheric CO2 and annual tree rings and are reviewed in the Supplementary Materials (Table SM3 and description). Summarizing, the FFCO2 value in the years 1972–2009 ranged from 3 to 6%.
Fossil fuel-derived CO2 is also characterized by a depleted 13C isotope content; therefore, the burning of these fuels results in a decrease in the 13C content of atmospheric CO2 on both a global and local scale (e.g. Pawełczyk and Pazdur Reference Pawełczyk and Pazdur2004). Modern atmospheric CO2 from areas not affected by a local Suess effect has a δ13C value of around –8.5‰ (White et al. Reference White, Vaughn and Michel2015), and the δ13C values of CO2 from fuel combusted in S Poland are much lower, e.g. coal: ca. –24‰, gasoline: ca. –31‰ (Zimnoch et al. Reference Zimnoch, Jelen, Galkowski, Kuc, Necki, Chmura, Gorczyca, Jasek and Różański2012). Similarly, CO2 from biogenic sources is also 13C-depleted (Zimnoch et al. Reference Zimnoch, Florkowski, Necki and Neubert2004).
The Suess effect investigations for Gliwice city and its surroundings (southern Poland) are the subject of the present paper. Our carbon isotopic studies of atmospheric CO2, performed with weekly resolution for a period of two years, are the pioneering studies for this area.
INVESTIGATED SITES
Gliwice City Center—Atmospheric CO2
Gliwice city (50.30°N 18.68°E) is located in the Silesian Uplands in southern Poland (Figure 1). It is a part of a large urban agglomeration called the Silesian Metropolis, which includes 41 cities (the biggest are Katowice, Zabrze, Chorzów, Ruda Śląska, and Świętochłowice). The agglomeration has 2.3 million inhabitants (including 170,000 in Gliwice) and covers an area of 2500 km2. It is also the most industrialized region in Poland, with intensive coal mining and metallurgy present since the 19th century.
The main sources of CO2 emission from human activity in Gliwice are fossil fuel combustion for energy, heating, and road transport. A main transport interchange, where two highways linking N–S and W–E Poland meet, is situated in Gliwice. The yearly amount of anthropogenic CO2 emission in Gliwice was estimated in 2013 to be 0.804 MtCO2/yr, with energy and heating contributing to 0.575 MtCO2/yr and transport producing 0.229 MtCO2/yr (Low Emission Economy Plan for Gliwice 2016).
The emission from a closed coal mine shaft in Gliwice, located ca. 1.4 km SSE from the CO2 sampling point was measured in the years 2014–2016 by Wrona et al. (Reference Wrona, Sułkowski, Rózański and Pach2016a, Reference Wrona, Różański, Pach, Suponik and Popczyk2016b). They reported a highly variable, temperature and wind-speed dependent CO2 emission rate, ranging from 12.7 to 162.3 kgCO2/hr, giving an estimate of 0.11 to 1.42 MtCO2/yr.
The CO2 composition may be influenced by atmospheric mixing due to seasonal variations in wind direction. The direction of winds in the form of a wind rose is presented in Figure SM1. The main wind directions are S, SW, and SE, and some seasonal variability can be noted. Generally, good horizontal air mixing in the N–S direction at all times of the year might be expected.
Gliwice Surroundings—Sites of Trees
Forest or park sites located in the urban agglomeration, ca. 3–6 km from the CO2 sampling point, were selected for the sampling of annual rings from living pine trees (Pinus sylvestris L.; Figure 1). The sites surrounded Gliwice city center from almost all geographical directions, although no suitable site could be found in the southern direction. Unfortunately, there was no suitable tree in the vicinity of CO2 sampling point.
SAMPLING AND METHODS
Atmospheric CO2
Atmospheric air samples were collected on the roof of the university building (Faculty of Civil Engineering, Akademicka 5, 50.290N, 18.678E), about 15 m above the ground (Figure 1). The building is connected to municipal heating installation thus no chimneys emit gases from fossil fuels combustion in the very close vicinity. The sampling site in Gliwice city was the same as in previous studies in the years 1980–1984. However, since then some new high-traffic roads have been built, thus a high CO2 emission from fossil fuel combustion in public transport was expected. A large green park area and also the river Kłodnica, which has banks densely covered by trees, are in the neighborhood.
Atmospheric air samples were always collected on the same day of the week, Wednesday, and at the same time, ca. 10:00 a.m., when the day traffic was expected to be at high but relatively stable level, from 26 January 2011 to 30 January 2013. The PlastiGas bag was filled with air, and then the CO2 was cryogenically separated. Similar method was used e.g. by Berhanu et al. (Reference Berhanu, Szidat, Brunner, Satar, Schanda, Nyfeler, Battaglia, Steinbacher, Hammer and Leuenberger2017), Turnbull et al. (Reference Turnbull, Lehman, Miller, Sparks, Southon and Tans2007), and Graven et al. (Reference Graven, Fischer, Lueker, Jeong, Guilderson, Keeling, Bambha, Brophy, Callahan, Cui, Frankenberg, Gurney, LaFranchi, Lehman, Michelsen, Miller, Newman, Paplawsky, Parazoo, Sloop and Walker2018). For details on the apparatus and methods, see the Supplementary Material (Figure SM2).
Tree Rings
Samples of annual tree rings were taken as cuttings from the outer layers of pine (Pinus Sylvestris L.) trunks. From these sections, the annual rings for the years 2008–2013 were separated, followed by early and late wood separation. From all samples, α-cellulose was extracted by a modified version of Green’s method (Pazdur et al. Reference Pazdur, Korput, Fogtman, Szczepanek, Hałas, Krąpiec and Szychowska-Krąpiec2005).
14C Analysis
The concentrations of 14C isotope in atmospheric CO2 and in the α-cellulose samples of early and late wood were measured by the accelerator mass spectrometry (AMS) technique. The samples were converted to graphite according to procedures described by Piotrowska (Reference Piotrowska2013). Briefly, α-cellulose was combusted in quartz tubes with CuO at 850ºC, and CO2 samples were graphitized by hydrogen reduction in the presence of an Fe catalyst at 630ºC. The 14C concentration in graphite was determined by the Rafter Radiocarbon Laboratory (Lower Hutt, New Zealand) or the DirectAMS Laboratory (Bothell, WA, USA). The NIST Oxalic Acid II standard was used for normalization, and black coal used as a blank material.
Measurement results are reported as Δ14C (‰), which was calculated according to Equation (1). The uncertainties of Δ14C were calculated using the propagation method and are around 1‰ (Table SM1 and SM2). The FFCO2 values were calculated with Equation (2), and their uncertainties were lower than 0.12% (Table SM1 and SM2).
13C Analysis
Analyses were carried out using a continuous-flow IsoPrime IRMS system, used for analysis of light stable isotopes (2H, 13C, 15N, and18O). The stable isotope values are reported in the delta notation (in ‰), relative to the international V-PDB (Vienna Pee Dee Belemnite) standard:
 $${\delta ^{13}}C = \left( {{{{{\left( {{}_{}^{13}C/{}_{}^{12}C} \right)}_{sample}}} \over {{{\left( {{}_{}^{13}C/{}_{}^{12}C} \right)}_{standard}}}} - 1} \right)\cdot1000\%$$
(3)
$${\delta ^{13}}C = \left( {{{{{\left( {{}_{}^{13}C/{}_{}^{12}C} \right)}_{sample}}} \over {{{\left( {{}_{}^{13}C/{}_{}^{12}C} \right)}_{standard}}}} - 1} \right)\cdot1000\%$$
(3)
Before graphitization for 14C AMS measurements, each air CO2 sample was subsampled with a syringe for δ13C determination. The CO2 was then injected directly into the He flow feeding the spectrometer. The uncertainty in this case may only be estimated by the internal IRMS error of 0.1‰.
For each α-cellulose sample, three replicates of 50 mg were weighed into tin capsules. The samples were combusted in a EuroVector elemental analyzer. After passing through chromatographic columns, the CO2 was analyzed for its 13C content. The uncertainty was calculated as the standard deviation of the three results added to the IRMS internal error and was within the range 0.1 to 0.4‰ (see Table SM2).
RESULTS
All measurement results are listed in Tables SM1 (atmospheric CO2) and SM2 (tree rings) in the Supplementary Material (xls file).
Δ14C and δ13C in Atmospheric CO2
Results of the Δ14C and δ13C measurements of atmospheric CO2 in Gliwice are presented in Figure 2b and c. For comparison, Figure 2 also includes the isotope composition of the background CO2. For 14C in the atmospheric CO2, the background station was Jungfraujoch, located in the Alps (Hammer and Levin Reference Hammer and Levin2017). The stable isotope composition of CO2 measured at the Mace Head station (Ireland) represented the marine background CO2 entering the European continent (White et al. Reference White, Vaughn and Michel2015). The same two stations have been used as reference “clean air” sites in previous papers concerning Southern Poland (Kuc et al. Reference Kuc, Różański, Zimnoch, Necki, Chmura and Jeleń2007; Zimnoch et al. Reference Zimnoch, Jelen, Galkowski, Kuc, Necki, Chmura, Gorczyca, Jasek and Różański2012; Pazdur et al. Reference Pazdur, Kuc, Pawełczyk, Piotrowska, Sensuła and Różański2013).
Results of Δ14C and δ13C measurements for the period 26 January 2011–30 January 2013: (a) background CO2: monthly data for Δ14C from Jungfraujoch (Hammer and Levin Reference Hammer and Levin2017); (b, c) atmospheric CO2 in Gliwice; (d) weekly δ13C data from Mace Head (White et al. 2013). (e) Relationship between Δ14C and δ13C in atmospheric CO2 obtained by linear regression. The total number of points is 100. The correlation coefficient between both values is R2 = 0.645. Three points with a distinctly low Δ14C and high δ13C values are marked with full circles on all plots. Once rejected, the correlation coefficient between Δ14C and δ13C is R2 = 0.89. See the last paragraph of “Fossil CO2 Sources” section for discussion.
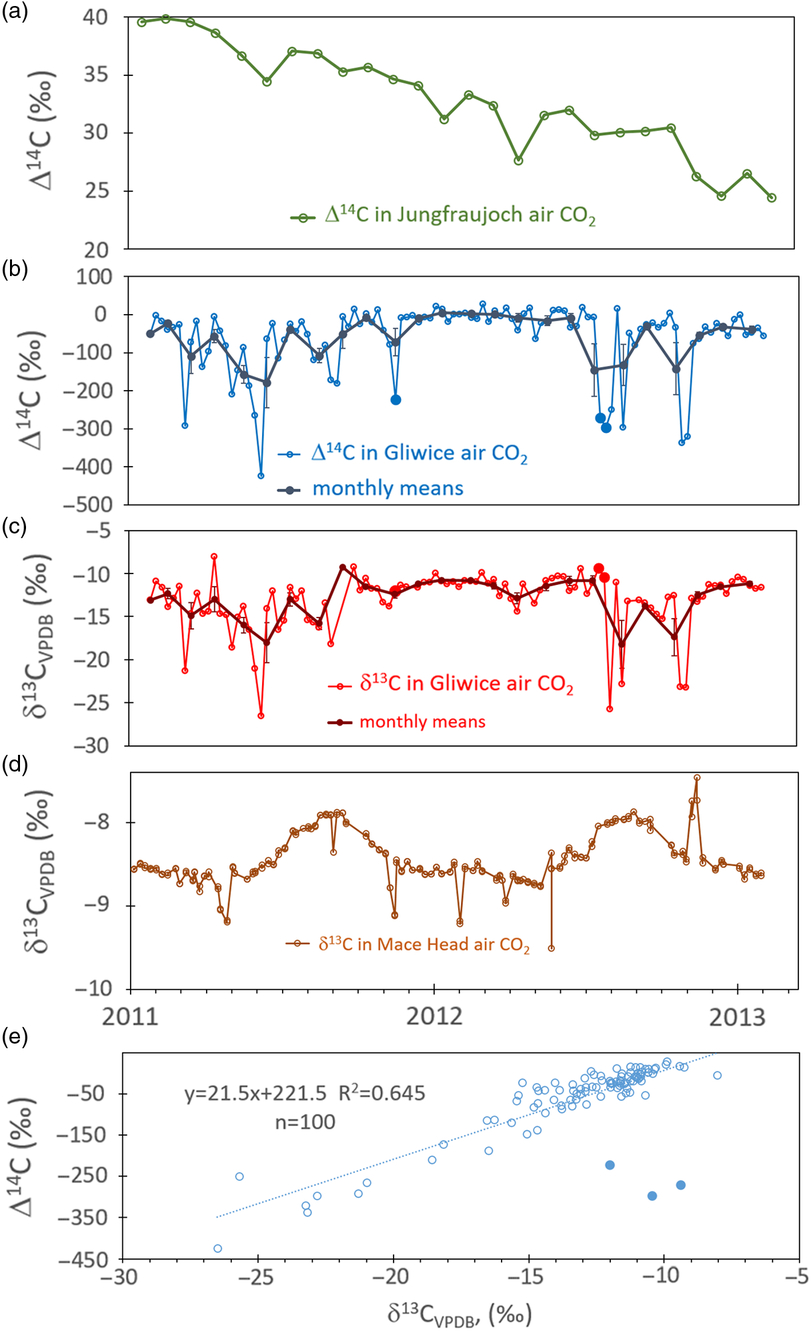
Both the Δ14C and δ13C values for atmospheric CO2 in Gliwice were distinctively lower than the background values. The Δ14C at Jungfraujoch decreased in the given period by ca. 15‰, and seasonal fluctuations of a few permil were visible. The average Δ14C value was +33‰. The average Δ14C of the Gliwice dataset for the whole observation period was –61.2‰, and the variability was much higher, ranging from –424 to +28‰.
Similar scenario was observed for the δ13C values, where the background average was –8.4‰ and spread from –9.5 to –7.5‰ (Figure 2d). For Gliwice, the average δ13C value was –13.2‰, and the range was from –26.5 to –8.0‰ (Figure 2c).
The Δ14C and δ13C values in Gliwice CO2 were significantly correlated (Figure 2e), with a correlation coefficient R2=0.65 for all the measurement results (n=100), while after rejection of three outlying points the R2 increased to 0.89.
Δ14C and δ13C in Tree Rings
In the pine annual tree rings two seasonal layers may be distinguished: early wood (EW) and late wood (LW). For the Gliwice climate zone, the layers are produced in spring and summer, in months when the number of mean daily temperatures above 10°C prevails significantly (Białobok et al. Reference Białobok, Boratynski and Bugała1993). The spring season in this respect includes April, May, and June, and EW is produced during this time. Summer, when LW is produced, includes July, August, September, and October.
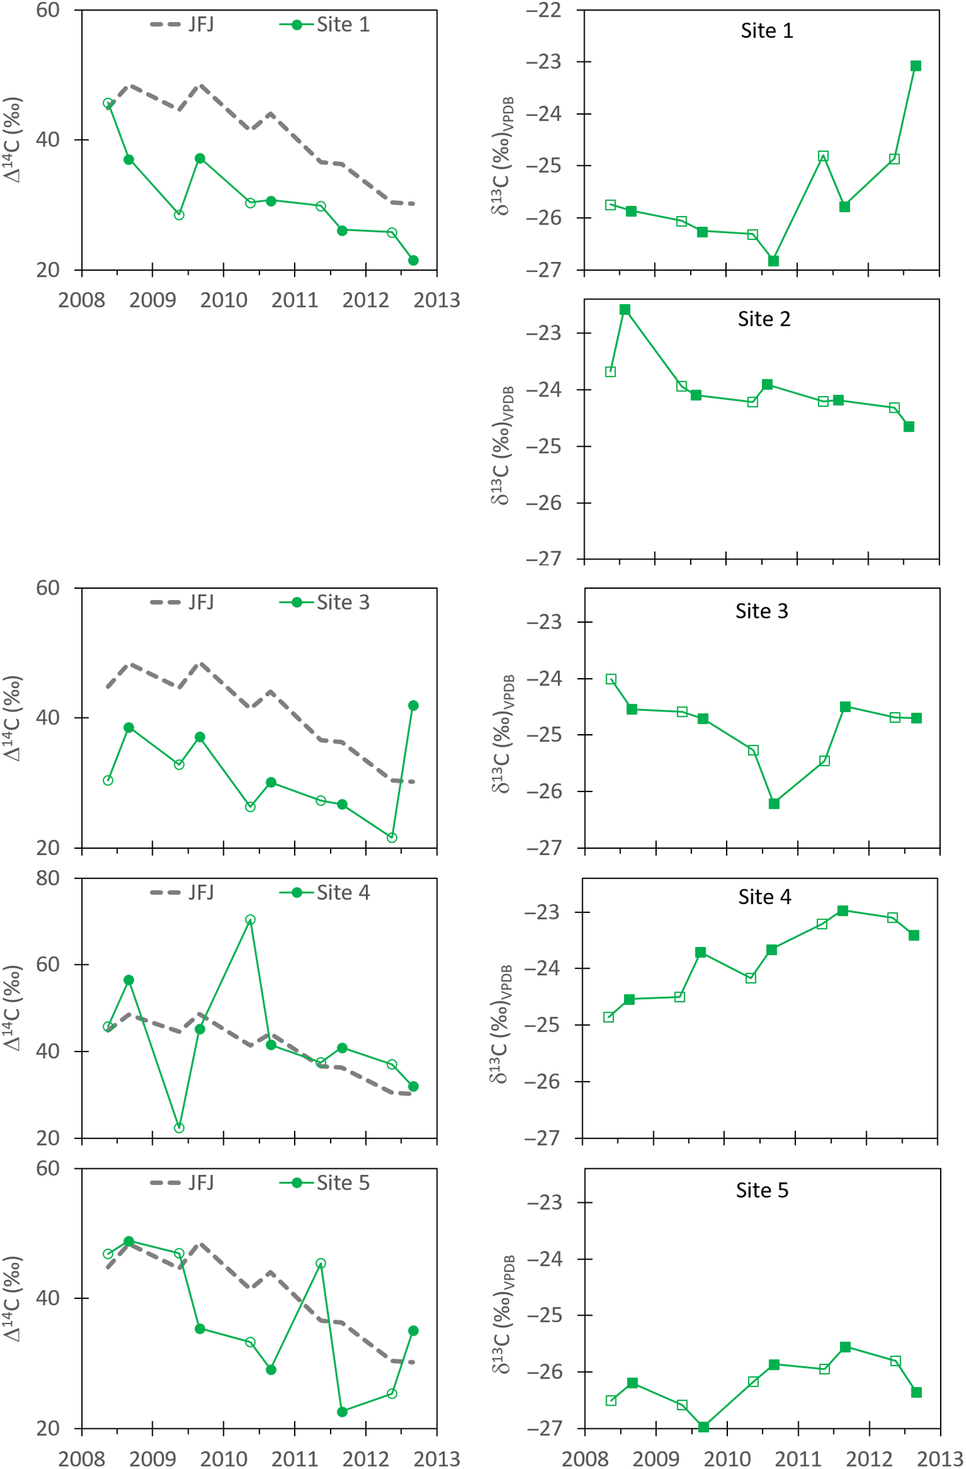
Figure 3 shows variations in Δ14C and δ13C for EW and LW from Pinus sylvestris, for the sites surrounding Gliwice. The measurement period covered 2008 (EW) up to 2012 (LW). In the case of Δ14C, the averages of monthly data for the Jungfraujoch background CO2 station were calculated for the months of EW and LW growth periods. Unfortunately, the Δ14C values were not determined for Site 2.
Results of measurements of Δ14C and δ13C in pine tree rings from 2008 to 2012, from locations around Gliwice city (see Figure 1). No Δ14C measurement have been performed for site 2. Open symbols: early wood (EW), full symbols: late wood (LW).
DISCUSSION
Fossil CO2 Sources
The difference between Δ14C and δ13C measured in Gliwice atmospheric CO2 and “clean air” indicates the existence of a pronounced local Suess effect (see Figure 2a, b). The strong positive correlation of Δ14C and δ13C further confirms the significant portion of fossil carbon in the atmospheric CO2 (see Figure 2e). For determination of FFCO2 (Equation 2), the data for the CO2 background from the Jungfraujoch station (Hammer and Levin Reference Hammer and Levin2017) were used. The values of FFCO2 for Gliwice during the whole measurement period from January 26, 2011 to January 30, 2013 are shown in Figure 4a, and they range from 0.53 to 44.3% (Table SM1).
(a) Fossil carbon component of atmospheric CO2 in Gliwice (FFCO2) and (b) air pollution dataset (Voivodship Inspectorate of Environmental Protection, http://powietrze.katowice.wios.gov.pl/).

The obtained results represent the state of the air at a given short time interval. The observed large fluctuations in the values of FFCO2 may partly result from the methodology of collecting CO2 samples. The composition of one portion of air taken in very short time may be easily influenced by short-term disturbances connected with strictly local phenomena. However, such fluctuation was not the case for the whole measurement period. A very high variability of carbon isotope composition was visible for mid-year periods, from late spring to fall, while for winters the Δ14C stabilized around 0‰ and the δ13C around –12‰. The stabilization of Δ14C and δ13C may be caused by more frequent temperature inversions in winter time, and less variable winter wind direction (Figure SF 1). As a consequence of the Δ14C variability, periods with an escalation of the fossil component in atmospheric CO2 were observed, with the FFCO2 reaching a maximum of ca. 44% (Figure 4a).
However, to draw some general conclusions the average values would be desired. The average FFCO2 for the whole data series was 9.11 ± 0.87%. The statistical uncertainty (0.87%) of our dataset is obviously underestimating the true incertitude connected with spot sampling methodology. Still, the 9.11% is the highest of the values reported so far for Southern Poland (see Table SM3). Only when the 15% of the highest FFCO2 values are excluded, the remaining ones give average 5.83 ± 0.34%, which is in concordance with previously obtained data for Gliwice (Table SM3).
If the current results for Gliwice are to be compared to previously published data, estimation of the absolute fossil CO2 component in ppm is required. Unfortunately, the CO2 concentration is not monitored on a regular basis in any nearby location. The available sporadic measurements allow to estimate the CO2 concentration at the level of 400–420 ppm. The numbers have been reported for a location ca. 700 m WWE from CO2 sampling point, close to high-traffic street, for 15.04.2014 (Mainka et al. Reference Mainka, Zajusz-Zubek, Kozielska and Brągoszewska2015). If such average concentration is assumed for Gliwice air, this gives an estimate of ca. 23–24 ppm of fossil CO2, based on the FFCO2=5.83%. Suess effects of a similar magnitude were reported for other cities in neighboring countries: ca. 26 ppm for Bratislava (Slovakia) in the years 1999–2007 and a similar value in the years 2001–2018 for Praha (Czech Republic) noted by Svetlik et al. (Reference Svetlik, Povinec, Molnár, Vána, Šivo and Bujtás2010); an average of ca. 11 ppm calculated for the years 1986–2007 for Heidelberg, Germany (Levin et al. Reference Levin, Hammer, Kromer and Meinhardt2008); and ca. 20 ppm of fossil carbon contribution during the winter 2008/09 in Debrecen (Hungary) estimated by Molnar et al. (2010). While the estimate of 400–420 ppm might not be the most accurate, it seems highly improbable that the CO2 concentration was lower. Thus, the Gliwice air CO2 seems severely affected by the Suess effect on a regional scale.
The three main sources of fossil CO2 contributing to the local Suess effect in Gliwice (transport, industry, and household heating) also emit air pollutants, which are monitored by the measurement network of the Voivodship Inspectorate of Environmental Protection. The results for the daily concentration of some important air pollutants: sulfur and nitrogen oxides (SO2, NO2, NOx, NO) and suspended dust (PM10, PM2.5) are shown in Figure 4b, along with the FFCO2.
A quantitative analysis was undertaken, and correlation coefficients calculated between Δ14C and δ13C and air pollutants. The coefficients for the whole observation period were insignificant, therefore the series were divided into seasonal subsets. The results are presented in Table 1. Significant correlations between the Δ14C and pollutant concentrations (NO2, NOx, NO, PM2,5, PM10) were found for the winter season, while in the case of δ13C significant correlations were found during both winter (with SO2, NO2, NOx, NO, PM10) and summer (with NOx, NO, PM2,5, PM10). However, there were no correlations between Δ14C, δ13C and pollutants for the fall and spring, with one exception (Δ14C and SO2 concentration during the fall).
Correlations coefficients R between Δ14C, δ13C, and pollutant concentrations (SO2, NO2, NOx, NO, PM2.5, PM10) measured in Gliwice. Abbreviations: (d) – daily average value (m) – value at 10:00 a.m., time of air sample collection. Statistically significant (p<0.05) values are marked by bold font.
Emission of CO2 from industry and car traffic can be regarded as constant during the year. Anthropogenic emission from house heating systems is mainly related to the wintertime and occasionally to cool days during spring and fall. In winter, the wind direction was more stable than during the rest of the year, and winds from the S, SW, and W prevailed (Figure SF1). Therefore, the recorded atmospheric CO2 isotope signal was relatively stable in winter and correlated well with other air pollutant concentrations.
On the contrary, large fluctuations of Δ14C and δ13C could be observed during vegetation periods (spring, summer, and fall). The wind direction is more variable during these seasons (Figure SF 1). An important influence can be introduced by plant respiration and biomass decomposition, which is a variable source of CO2, depending on the weather conditions. Generally, the biogenic component is dominant at night, whereas the anthropogenic component prevails during the day. During vegetation periods, the biogenic CO2 seemed to be influencing the carbon isotopic composition causing an irregular pattern of Δ14C and δ13C values. These findings are in concordance with results obtained for Krakow city (Zimnoch et al. Reference Zimnoch, Florkowski, Necki and Neubert2004).
One more CO2 source with an unexpectedly large contribution was a closed mine shaft in Gliwice. The CO2 emission from there was strongly variable and dependent on the baric conditions and wind direction (Wrona et al. Reference Wrona, Różański, Pach, Suponik and Popczyk2016b). The three outlying points in Figure 2e are exceptional. They are characterized by extremely low Δ14C, indicating the presence of a large fossil CO2 contribution (FFCO2 = ca. 30%). However, the δ13C values of around –10‰ are much closer to “clean air” and contradict this theory. The δ13C values reported for CO2 collected in mines in Upper Silesian Coal Basin by Kotarba (Reference Kotarba2001) and Weniger et al. (Reference Weniger, Franců, Krooss, Bůzek, Hemza and Littke2012) covered a wide interval (–27.2 to –2.9‰), but for certain shafts the δ13C ranged from low minus values to –15‰, and these values would explain the extraordinary carbon isotope composition of the three “outlying” samples. Therefore, we conclude that these three particular samples might have been exceptionally influenced by CO2 from the coal mine shaft. This source of fossil CO2 is likely to be active through the whole year. However, the location of this shaft is 1.4 km SSE from CO2 sampling point, and given the prevailing winter wind direction (S, SW, and W) this source would contribute less to winter CO2 samples.
Suess Effect Record in Tree Rings
For all tree sites, a decreasing trend in Δ14C could be observed (Figure 3). However, the variability of the Δ14C and δ13C in tree rings differed between sites. In particular, the Δ14C values for sites 1 and 3 were systematically lower than the background air by ca. 10‰. In the case of sites 4 and 5, the Δ14C fluctuated around the background values, and sometimes even higher values were obtained for tree rings.
Elevated Δ14C for some of pine rings may have been caused by the presence of biogenic CO2 from the decomposition of older plant material, incorporated into soil organic matter. This matter has a 14C content higher than the contemporary atmosphere and thus may mask the Suess effect (Gorczyca et al. Reference Gorczyca, Kuc and Różański2013). It also suggests that the assumption of Δ14Cbio=Δ14Cmeas in the considered model (see Supplementary Material) is not fulfilled. This effect may likely be variable and time-dependent, as resulting from the local carbon cycling and plant physiology. Similar results were reported for tree rings from woodlands in Upper Silesia by Sensuła et al. (Reference Sensuła, Michczyński, Piotrowska and Wilczyński2018).
The FFCO2 values were calculated for EW and LW tree rings according to Equation (2) and are reported in Table 2. With one exception they did not exceed 1%. Considering the location of tree sites (Figure 1) and wind directions (Figure SM1), sites no 1 and 3 should be expected to be the most affected by the local Suess effect, which was the case. However, this effect was still weakened by an order of magnitude when compared to the air in the city center (see Table 2).
FFCO2 in early wood (EW: April, May, June) and late wood (LW: July, August, September, October). Standard deviations were calculated for averages. The uncertainties of FFCO2 values calculated with Equation (2) were lower than 0.12% (see Table SM2).
The δ13C values in the tree rings ranged from –27 to –23‰ for all sites. For sites 5 and 1 they were slightly lower in relation to the values from contemporary trees assimilating “clean” atmospheric CO2 (ca –25‰). No distinct relationship between LW and EW values could be observed. The δ13C trends were, however, observable as increasing for sites 1, 4, and 5 and decreasing for sites 2 and 3. This effect may have been caused by quick and effective mixing of the air in the studied area due to the characteristic direction and frequency of winds.
The δ13C in tree rings strongly depended on the δ13C in atmospheric CO2, but photosynthesis is affected by climatic factors (temperature, humidity, and sunlight) to a high extent (e.g. Pazdur et al. Reference Pazdur, Nakamura, Pawelczyk, Pawlyta, Piotrowska, Rakowski, Sensula and Szczepanek2007; Sensuła Reference Sensuła2016), and the detailed interpretation is beyond the scope of this paper.
CONCLUSIONS
The obtained results of measurements of the isotopic composition of carbon in atmospheric CO2 showed that the share of the fossil component in the total amount of CO2 in atmospheric air in the center of Gliwice in the years 2011–2013 was ca. 5.8% on average. It is one of the strongest Suess effects reported so far in the CE Europe region.
The typical seasonal changes of FFCO2 associated with the increased combustion of fossil fuels in cool seasons and higher Δ14C in the summer was not clear because of large fluctuations in Δ14C and δ13C values. However, in the winter the Suess effect was stable and caused mainly by fossil fuel combustion, as confirmed by significant correlations with air pollutants.
The fluctuations of Δ14C and δ13C observed during vegetation seasons lead to the conclusion that the disturbances caused by spot sampling may be responsible for the observed large variations. In addition, the biogenic CO2 component should be investigated in order to better describe the CO2 pathways and sources. The assumption of Δ14Cbio = Δ14Cmeas in the carbon mass balance was a rough estimate and caused the value of the emission component (CO2foss) to contain a biogenic component. Unfortunately, the available datasets did not allow us to eliminate this assumption.
The isotopic results indicated the existence of an additional significant CO2 source in the Gliwice air, which was the closed mine shaft independently investigated by Wrona et al. (Reference Wrona, Sułkowski, Rózański and Pach2016a, Reference Wrona, Różański, Pach, Suponik and Popczyk2016b). This source has never been considered in any official municipal documents about the air quality in Gliwice, and definitely needs further investigation.
The results of the measurements of Δ14C and δ13C in tree rings indicated a Suess effect was limited to the built-up area of the city. At a distance of 3–6 km from the city center, the effect, even if identifiable, was recorded in tree rings at a much weaker magnitude. The subsequent project will undoubtedly incorporate trees from the city center and time-integrated CO2 isotopic signal.
The reported research results proved again the usefulness of isotopic methods in the monitoring of the fossil carbon component in atmospheric CO2 and demonstrated that Gliwice city is a significant source of this greenhouse gas.
ACKNOWLEDGMENTS
This research was made within the grant “Isotopic method of monitoring anthropogenic CO2 emission using tree rings for the Upper Silesia region” funded by the National Science Centre allocated on the basis of decision number 0970/B/P01/2010/39. Supported also by Ministry of Science and Higher Education within grants for maintenance of the 14C and Mass Spectrometry Laboratory in the Institute of Physics, Silesian University of Technology in the years 2014–2018.
Supplementary material
To view supplementary material for this article, please visit https://doi.org/10.1017/RDC.2019.92


 Open access