


1. Introduction
Increasing life expectancy and low birth rates characterize the ongoing demographic change in Europe. The resulting aging of the population is expected to peak in 2050 when approximately 30% of the population of the European Union will be 65 or older (Corselli-Nordblad and Strandell, Reference Corselli-Nordblad and Strandell2020). This demographic development poses a challenge to pension systems.
Almost all pension systems in the European Union have been reformed into multi-pillar systems over the past 30 years (Hinrichs, Reference Hinrichs2021)Footnote 1. These systems consist of a first pillar of obligatory pension insurance (or at least the obligation to obtain pension insurance), a second pillar of voluntary pension insurance (with or without employer contributions), and finally a third pillar consisting of a bundle of private forms of saving. If the first pillar of a pension system is insufficient to secure adequate income in retirement, participation in the second pillar becomes essential to ensure long-term financial well-being. Understanding the determinants that motivate individuals to engage in retirement planning is therefore a key concern for policymakers.
Much of the existing literature on retirement planning has focused on individual-level determinants such as socio-demographic characteristics, psychological traits, and financial literacy (Kumar et al., Reference Kumar, Tomar and Verma2019). In contrast, the role of the social environment has received comparatively little empirical attention, despite evidence suggesting its relevance. This study addresses this gap by examining how the behavior of others, referred to as behavioral norms, influences the decision to engage in retirement planning. Behavioral norms reflect the behavior typically shown by others in an individual’s social environment. To better capture this influence, the analysis distinguishes between different sources of behavioral norms, namely strong social ties (e.g., family and friends) and weak social ties (e.g., coworkers). Furthermore, potential gender differences in the role of behavioral norms are explored. Finally, the perceived financial situation of retired parents or grandparents is considered, as such family experiences may serve as important reference points that shape individuals’ decisions regarding their own financial future.
Based on these considerations, we test a set of hypotheses addressing (1) the effects of behavioral norms, with particular attention to variations by gender and tie strength, and (2) the influence of the financial situation of retired parents or grandparents on the ownership of supplementary pension funds.
To empirically examine these and other hypothesized relationships, a survey was developed and conducted in two provinces of Italy where supplementary pension funds (SPFs) constitute the second pillar of the pension system. Italy introduced a multipillar system through a comprehensive reform as early as 1993. The two provinces studied herein have the highest participation rate in supplementary pension funds in Italy. This allows for a study of social norms with a sufficiently large number of respondents enrolled in an SPF. The relationships are tested in a structural equation modeling approach considering relevant determinants and relationships derived from both theory and empirical literature.
The paper is organized as follows. Section 2 outlines the theoretical background of the model. Section 3 describes the characteristics of the study area. Section 4 explains the survey design and statistical methods. Sections 5, 6, and 7 present the results, discuss the findings, and conclude the paper, respectively.
2. Theoretical background
To explain the influence of the social environment on individual decisions and behavior, the theory of planned behavior is commonly used in social psychology and behavioral economics. In this theoretical framework, the central factor in explaining a specific behavior is an individual’s intention to perform the behavior. Intentions represent the motivational factors that drive a behavior and reflect the person’s willingness and determination to engage in the behavior (Ajzen, Reference Ajzen1991). Intention itself is determined by three components: attitudes toward the behavior, subjective norms, and perceived behavioral control. While attitudes refer to the individual’s evaluation of the behavior, subjective norms capture perceived social pressure, and perceived behavioral control reflects beliefs about one’s ability to perform the behavior.
In this study, we use a model that is informed by and adapted from the theory of planned behavior, reflecting both theoretical considerations and the structure of the available data. Notably, our data do not include a direct measure of intention to own a supplementary pension fund. Instead, we use a related but broader measure, awareness of retirement planning, as a conceptual antecedent of behavioral intention. While not equivalent to a concrete intention, it reflects an early stage of behavioral decision makingFootnote 2. In this context, it can serve as a meaningful proxy for behavioral intention.
The following subsections outline the three components of the theory of planned behavior and describe how each is conceptualized in our model.
2.1. Social norms
Social norms are often divided into “subjective norms” and “behavioral norms”. While subjective norms refer to the perceived social pressure to perform or not to perform a behavior (Ajzen, Reference Ajzen1991), behavioral norms refer to the behaviors that others do themselves (White et al., Reference White, Terry and Hogg1994)Footnote 3. Both types of social norms play different roles in shaping behavior. Subjective norms guide behavior through the use of informal social approval or disapproval, essentially encouraging or discouraging actions based on moral considerations. In contrast, behavioral norms influence behavior by providing social information about what is likely to be effective and adaptive in a given context. They convey the message that if people are engaging in a particular behavior, it is probably a wise choice to follow (Cialdini, Reference Cialdini2007). The studies applying the theory of planned behavior to retirement planning have mainly considered the influence of subjective norms. Recent studies confirm the effect of subjective norms on (1) individual retirement account ownership (Magwegwea and Lim, Reference Magwegwea and Lim2021), (2) purchase intentions of financial products for retirement (Nosi et al., (Reference Nosi, D’Agostino, Pagliuca and Pratesi2017; Yeung et al., Reference Yeung, Ho, Lam and Lam2023), and (3) on a more general measure of financial retirement planning behavior (Tomar et al., Reference Tomar, Baker, Kumar and Hoffmann2021). Croy et al. (Reference Croy, Gerrans and Speelman2010) find that subjective norms have the largest effect on retirement saving intentions, while behavioral norms appear to have no effect. In contrast, Bailey et al. (Reference Bailey, Nofsinger and O’Neill2004) find that both types of social norms are important predictors of retirement planning.
In our adapted theory of planned behavior model, the planning decisions of an individual’s social environment are considered as indicators of behavioral norms. Behavioral norms are hypothesized to influence the decision to plan via supplementary pension funds directly through imitation (e.g., Burtless, Reference Burtless and Schaie2006), and indirectly by raising awareness for retirement planning.
H1a: Behavioral norms have a positive direct effect on the ownership of SPFs.
H1b: The relationship between behavioral norms and SPF ownership is mediated by awareness for retirement planning.
The influence of social norms on individual behavior may vary depending on the strength of interpersonal ties. The strength of a tie is defined by the amount of time, emotional intensity, intimacy, and the reciprocal services, that characterize the tie (Granovetter, Reference Granovetter1973). A distinction is typically made between strong and weak social ties. While weak ties are important for the flow of information across groups, strong ties are more influential in decision-making (Brown and Reingen, Reference Brown and Reingen1987). Boer and Westhoff (Reference Boer and Westhoff2006) suggest dividing personal networks into strong and weak ties when examining the effect of social norms. They find that only strong ties influence social norms. Based on the definition of Granovetter (Reference Granovetter1973), family and friends are categorized as strong ties, while coworkers are categorized as weak ties. The majority of studies on the effects of the social environment on financial planning behavior do not separately analyze strong and weak ties. In their operationalization of social norms they primarily focus on the people who are important to the respondent, such as friends and family members. Examples of the effect of strong ties include Griffin et al. (Reference Griffin, Loe and Hesketh2012) and Yeung et al. (Reference Yeung, Ho, Lam and Lam2023), who find positive effects on retirement planning, Zhang et al. (Reference Zhang, Fang, Jacobsen and Marshall2018) on asset allocation, and Anabo and Centeno (Reference Anabo and Centeno2019) on financial product preferences. In addition to the influence of strong ties, research has also shown that social norms among coworkers are an important determinant of retirement saving decisions (Duflo and Saez, Reference Duflo and Saez2002; Gerrans et al., Reference Gerrans, Moulang, Feng and Strydom2018).
Given the evidence that the influence of behavioral norms on individual behavior varies according to the strength of social ties, the planning decisions of the personal social environment are considered separately for family and friends and for coworkers.
H2: The influence of behavioral norms on SPF ownership is stronger when they are based on the behavior of family and friends rather than coworkers.
Drawing on the theory of planned behavior, Griffin et al. (Reference Griffin, Loe and Hesketh2012) identify gender differences in the impact of behavioral norms. They find no effect of behavioral norms for men, while behavioral norms appear to be even more important than subjective norms for women. They hypothesize this gender effect may be explained by women constructing a more interdependent self-construal than men, as proposed by Cross and Madson (Reference Cross and Madson1997). Self-construal refers to the intensity with which individuals define themselves as independent from others or as interdependent with others (Cross, Reference Cross2020). According to the gender difference in self-construal, Flinkenflogel et al. (Reference Flinkenflogel, Novin, Huizinga and Krabbendam2017) argue that women tend to create close relationships, take the perspective of others, and maintain harmony while avoiding conflict. In contrast, men tend to prefer autonomy and emotional detachment from others. Rather than arguing with having an interdependent self-construal, Foels and Tomcho (Reference Foels and Tomcho2009) suggest that women are more likely to view social groups as dyadic relationships, while men are more likely to view their social groups as categorical affiliations. These different perceptions of social groups result in a more intense exchange between group members for women.
Following Griffin et al. (Reference Griffin, Loe and Hesketh2012), the relationship between behavioral norms and pension planning is examined for potential gender-related effects.
H3: The effect of behavioral norms on SPF ownership is stronger for women than for men.
2.2. Attitudes toward SPF ownership
In the theory of planned behavior, attitude refers to an individual’s overall evaluation of performing a specific behavior. In the context of retirement planning, this evaluation can be shaped by both personal dispositions and observed experiences. Prior research suggests that parental economic socialization plays a key role in shaping attitudes toward financial planning for retirement (e.g., Palaci et al., Reference Palaci, Jiménez and Topa2017). This influence can manifest not only through positive role models, but also through the financial situation of retired parents or grandparents, as it provides the context through which individuals consider planning (Robertson-Rose, Reference Robertson-Rose2020). In particular, individuals may learn from the unpleasant financial experiences of older relatives, which can provide strong incentives for planning (Lusardi, Reference Lusardi2003). Similarly, having a parent who was not adequately financially prepared for retirement can motivate to think about planning for retirement (Robertson-Rose, Reference Robertson-Rose2020).
H4a: Experiencing a poor financial situation of retired (grand)parents has a positive direct effect on SPF ownership.
H4b: The relationship between the financial situation of retired (grand)parents and SPF ownership is mediated by awareness for retirement planning.
In addition to learned experiences from older relatives, attitudes toward SPF ownership can also be shaped by personal dispositions, such as financial risk tolerance (Magwegwea and Lim, Reference Magwegwea and Lim2021). Financially risk-tolerant individuals, defined as those who are comfortable risking their current wealth for potential future growth (Gibson et al., Reference Gibson, Michayluk and Van de Venter2013), are more likely to save for retirement (Guiso et al., Reference Guiso, Jappelli and Padula2009; Fornero and Monticone, Reference Fornero and Monticone2011; Magwegwea and Lim, Reference Magwegwea and Lim2021; Park and Martin, Reference Park and Martin2021).
2.3. Perceived behavioral control
Perceived behavioral control captures how individuals assess the ease or difficulty of performing a particular behavior (Ajzen, Reference Ajzen1991). In the present context, this concept is approximated using three indicators that reflect relevant conditions for engaging in financial retirement planning: financial literacy, trust in financial institutions, and an individuals’ perceived financial situation.
The first of these indicators, financial literacy, plays a central role in many studies on retirement planning and financial decision-making more broadly. It has also been used as a proxy for perceived behavioral control by Magwegwea and Lim (Reference Magwegwea and Lim2021), who focus on subjective financial knowledge. Especially since the 2008 financial crisis, the relationship between financial literacy and retirement behavior has received growing attention (Gallego-Losada et al., Reference Gallego-Losada, Montero-Navarro, Rodríguez-Sánchez and González-Torres2022). As Van Rooij et al. note, “[…] a high level of financial knowledge reduces planning costs, i.e., reduces the economic and psychological barriers to acquiring information, doing calculations and developing a plan” (Van Rooij et al., Reference Van Rooij, Lusardi and Alessie(2012), p. 450). Accordingly, financial literacy is positively associated with retirement planning behavior (e.g., Alessie et al., Reference Alessie, Van Rooij and Lusardi2011; Lusardi and Mitchell, Reference Lusardi and Mitchell2011, Reference Lusardi and Mitchell2017; Magwegwea and Lim, Reference Magwegwea and Lim2021).
The second indicator, trust in financial institutions, captures two aspects relevant to retirement planning: (1) whether individuals regard financial institutions as trustworthy sources of information, and (2) whether they trust these institutions to manage their pension capital responsibly. While trust is sometimes viewed as an attitudinal factor, both dimensions can also influence perceived behavioral control. Individuals who lack trust in the information provided may feel inadequately informed to make pension-related decisions, while low trust in financial institutions’ asset management may reduce their sense of control over the outcomes of those decisions. In this sense, institutional trust can affect whether individuals perceive the pension system as a reliable context in which to act. Empirical research supports a positive association between trust in financial institutions and retirement planning behavior (Agnew et al., Reference Agnew, Szykman, Utkus and Young2012; Ricci and Caratelli, Reference Ricci and Caratelli2017; Burke and Hung, Reference Burke and Hung2021).
Having a voluntary pension plan depends not only on actual financial resources, a relationship confirmed in many studies (e.g., Ricci and Caratelli, Reference Ricci and Caratelli2017), but also on how individuals perceive their financial situation. In this study, perceived financial situation is measured as a self-assessed rating of one’s current personal financial standing. Even when objective means are sufficient, feeling financially insecure may reduce individuals’ sense of control and discourage retirement planning. It is therefore interpreted as a control belief within this framework.
2.4. Model
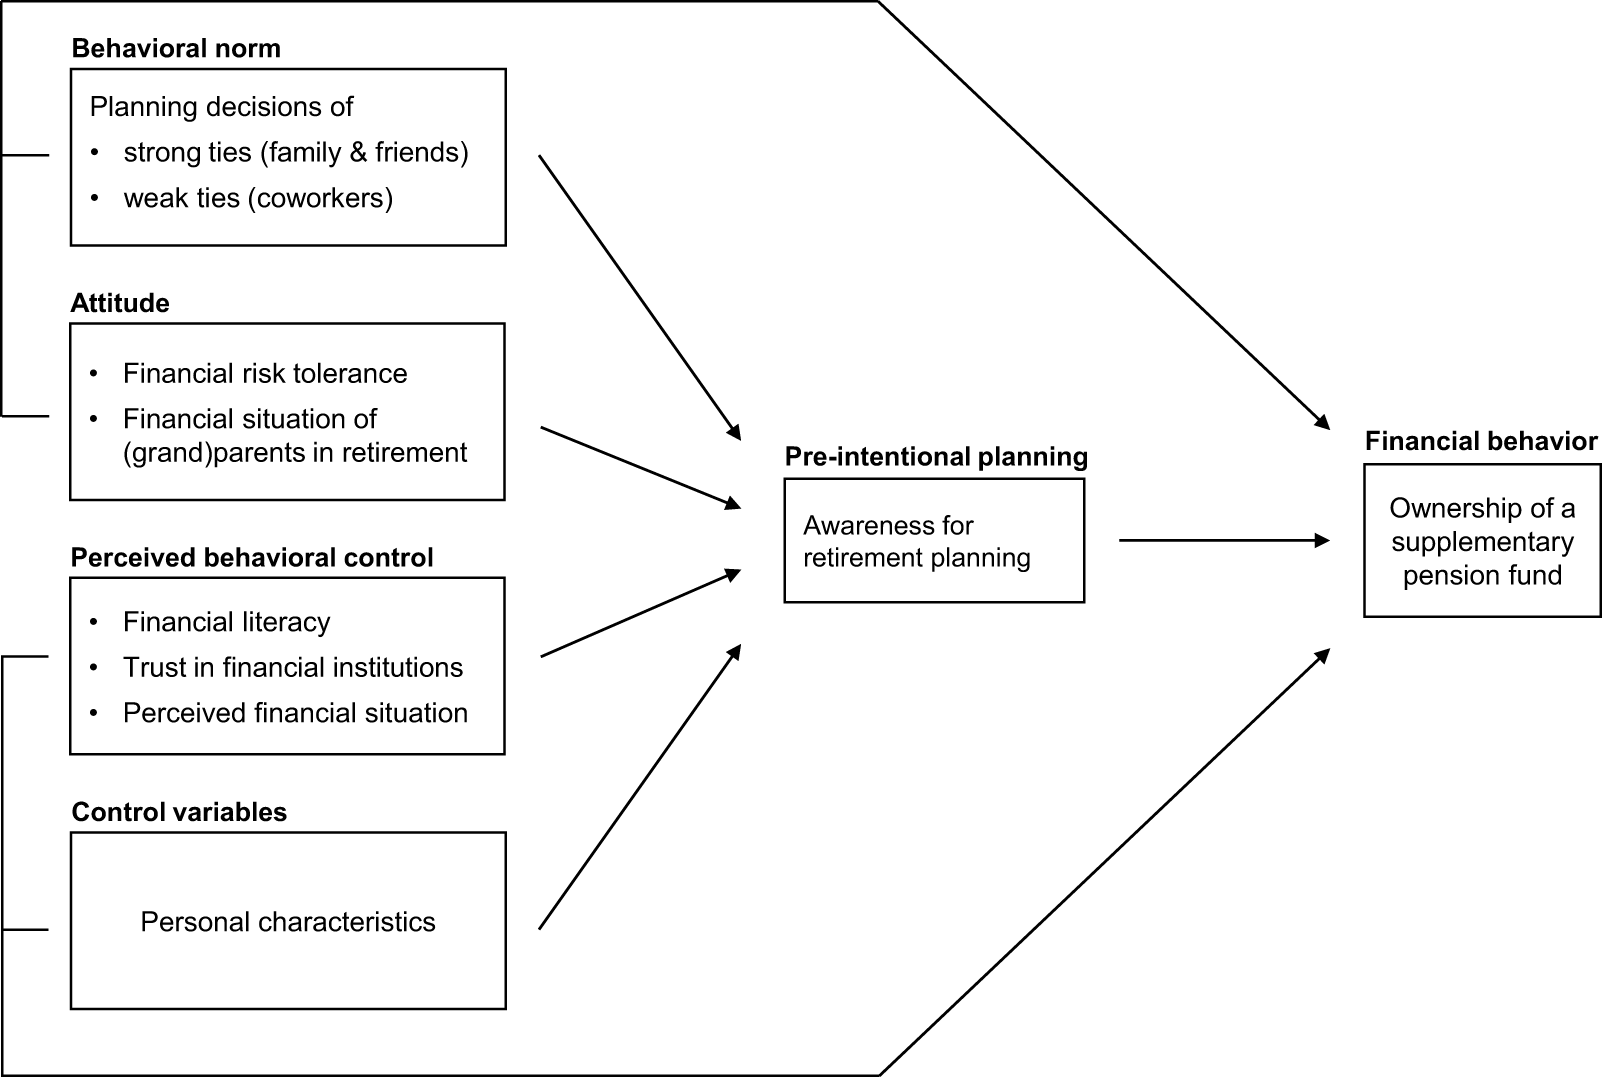
Figure 1 presents the conceptual model used in this study. It outlines the assumed relationships between behavioral norms, attitudinal and control-related aspects, awareness for retirement planning, and the ownership of an SPF. The model includes both indirect pathways through awareness and direct links from the explanatory variables to SPF ownership. This structure reflects the idea that awareness, as a pre-intentional stage of planning, may not fully capture all relevant influences on behavior. First, some individuals may own a supplementary pension fund without consciously reflecting on retirement planning, for instance by following advice, adopting the behavior of others, or participating in automatic enrollment. In such cases, behavior may be shaped by social influence or default mechanisms rather than deliberate planning. Second, individuals who have considered their financial security in retirement may choose other forms of pension provision and therefore not own a supplementary pension fund. Direct effects are therefore included to account for influences that may bypass or follow different pathways than awareness alone.
Conceptual model informed by and adapted from the theory of planned behavior.

Table 1 summarizes the hypotheses on the influence of the personal social environment. The personal characteristics included in the model, along with their empirical evidence on retirement planning behavior, can be found in Table 2. The conceptual model is estimated using a structural equation modeling approach in which all relationships and factors are estimated simultaneously.
Summary of hypotheses on the influence of the personal social environment

Effects in the literature of personal characteristics on SPF ownership. The first column provides the name of the characteristic, the second column shows the significant sign of the association, and the last column shows the references of the results.

Note: Level effects considering differences in the provinces and a possible rural–urban gap are also included.
3. Study area
In Italy, the single-pillar pay-as-you-go system was reformed into a multi-pillar model starting in 1993 with Legislative Decree 124/1993. To compensate for the decline of the first pillar, supplementary defined contribution pensions were introduced as the (occupational) second pillar, with the intention of making them the cornerstone of supplementary pension planning (Jessoula, Reference Jessoula2018). This second pillar includes contractual and open pension funds (SPFs), while the third pillar includes individual retirement pension plans based on life insurance (piani individuali pensionistici di tipo assicurativo – PIPs). Since the Legislative Decree 252/2005 came into effect in 2007, the severance pay of private sector employees (trattamento di fine rapporto – TFR) is automatically transferred into a supplementary pension fund if there is no refusal (silent consent) (Ricci and Caratelli, Reference Ricci and Caratelli2017; Jessoula, Reference Jessoula2018). Despite the intended relevance of SPFs in the reformed system and the silent-consent-transfer of the severance pay, only 34.7% of the Italian workforce planned for their retirement in the form of SPFs and individual pension plans in 2021 (Covip, 2022). There are differences in the distribution of the participation rates across the country. At the regional level, participation rates well above the general average are found in areas where pension provision is complemented by territorial initiatives. This study focuses on the region of Trentino-South Tyrol (Figure 2), which has the highest participation rate in the second and third pillars relative to its workforce (57.5%) (Covip, 2022).
Study area (source: Erich Tasser, Eurac research).

One reason for the high participation rate in this region is the autonomous status of the two constituting provinces. This status allowed the establishment of Pensplan Centrum, a public company owned by the region with the aim of promoting private pension planning through supplementary pension funds.Footnote 4 Another reason could be relatively high level of financial literacy in the northern part of Italy, which is found to influence enrollment in SPFs (Fornero and Monticone, Reference Fornero and Monticone2011). Table 3 provides demographic and economic indicators for Trentino-South Tyrol and Italy. These indicators may also help to explain the higher participation rate in this region. The underlying reasons cannot be answered conclusively in this paper. However, the high participation rate of the population allows for a random sample with a sufficient number of respondents enrolled in an SPF to study behavioral norms.
Regional indicators of 2021 (source: https://www.istat.it)

a Data from 2020; imputed rents not included.
b Contractual and open pension funds (Covip, 2022). It may be the case that some people are enrolled in multiple SPFs.
4. Methods
4.1. Survey
To investigate the determinants of private pension planning, the Institute for Economic Research of the Chamber of Commerce of Bolzano commissioned a survey in Trentino-South Tyrol. The questionnaire, developed on the basis of a comprehensive literature review, was administered by telephone in Italian and German in 2021.
Where possible, established measures from the literature are used to ensure reliable items for key variables. Financial literacy is assessed using four items: three adopted from Lusardi and Mitchell (Reference Lusardi and Mitchell2014), covering calculations involving interest rates, understanding of inflation, and understanding of risk diversification, and a fourth item specific to the pension system in Italy, addressing the tax benefit of transferring the severance pay into an SPF (cf. Table 4). Following Ricci and Caratelli (Reference Ricci and Caratelli2017) and Lusardi and Mitchell (Reference Lusardi and Mitchell2023), the sum of correct answers serves as the measure of financial literacy.
Financial literacy questions

Financial risk tolerance is measured using five items on financial risks, adapted from Weber et al. (Reference Weber, Blais and Betz2002). Trust in financial institutions, including trust in SPFs, the public pension system, banks, and insurance companies, is captured with two items each: one measuring trust in information provided and one measuring trust in the institution’s capital management. The perceived financial situation, as well as trust items referring to information on pension planning or capital management, are measured on a Likert scale, following the format of questions from the World Values Survey Wave 7 (Haerpfer et al., Reference Haerpfer, Inglehart, Moreno, Welzel, Kizilova, Lagos, Norris, Puyana and Puranen2020).
Table 5 lists the items addressing which forms of private pension provision are used within the respondent’s social environment. The effect of behavioral norms is captured through the variables Planning decisions of strong ties and Planning decisions of weak ties, represented by mutually exclusive dummy variables derived from Table 5. Table 6 illustrates the coding of these dummy variables for the example of family and friends (strong ties). In the reference category of these dummy variables, the respondent does not have any information on the pension plans of his or her family members or friends.
Question on private pension plans in the social environment. Which of the following products for private retirement provision are used in your social environment? Please only indicate those that you clearly know about. (Multiple answers possible)

Description of the categories of the dummy coded variable Planning decisions of strong ties

a This includes cases where the respondent knows whether (1) one family member or close friend uses SPFs and other products in their pension plan, (2) multiple family members or friends use SPFs and other products, and (3) some family members or friends use SPFs while others use other products. Due to these cases, the abbreviation Mixed is used.
The financial situation of parents or grandparents who are already retired is surveyed with the question: “When you think about your family members who have already reached retirement age (primarily parents, or if not applicable, grandparents), how would you overall assess their financial situation?” In this single-choice item, the respondent must choose between (i) they struggle to make ends meet, (ii) they have everything they need and a secure income, (iii) the situation of such family members varies greatly, (iv) do not know, and (v) I do not have parents/grandparents of retirement age. For better readability the categories of the variable Financial situation (grand)parents are renamed difficult, secure, different situations, not known, and not applicable.
The variable Awareness is surveyed with the item “Have you ever thought about your financial security after retirement? (Yes/No)”. A detailed description of all items used in the analysis can be found in Table A1 in the Appendix.
4.2. Statistical analysis
The model in Figure 1 is estimated using a generalized structural equation modeling approach. This approach jointly estimates the measurement model, which captures unobserved factors from multiple survey items, and the structural model, which links these factors, observed independent variables, and response variables. The measurement model includes four factors: Financial risk tolerance (five items on willingness to take financial risks), Trust SPF, Trust public pensions, and Trust banks/insurances (each measured by two items on trust in information and trust in pension capital management). Standardized factor loadings indicate how strongly each observed item relates to its factor, and communalities represent the proportion of variance in each item explained by its factor.
The estimation is performed using the Weighted Least Squares Mean and Variance adjusted (WLSMV) estimator, which is robust for binary and ordinal dataFootnote 5. Awareness serves as the binary mediator ( $m$), and SPF ownership is the binary final dependent variable ( $y$). Each observed outcome is assumed to reflect whether an underlying continuous latent response variable ( $m^\ast$ and $y^\ast$) exceeds a certain threshold (seeMuthén, Reference Muthén1984). The path coefficients represent probit estimates, indicating the marginal linear effect of each independent variable on the underlying continuous response ( $m^\ast$ and $y^\ast$). The model in Figure 1 incorporates both direct and indirect relationships. Direct effects are represented by single path coefficients, while the indirect effects require the multiplication of two path coefficients. The total effect of an independent variable is the sum of its direct and indirect effects.Footnote 6
Since coefficients from WLSMV estimation are expressed on a probit scale, their immediate interpretation is limited to their sign and statistical significance. To obtain more intuitive effect sizes, predicted probabilities of SPF ownership are calculated based on the total effects (Muthén and Asparouhov, Reference Muthén and Asparouhov2015). This follows the common practice in econometrics of interpreting probit coefficients through their implied changes in predicted probabilities and by classifying individuals into outcome categories.
The relative importance of each explanatory variable is then evaluated through Monte Carlo simulations, in which changes in individual probabilities are translated into changes in the participation rateFootnote 7. For categorical predictors (Planning decisions of strong ties, Planning decisions of weak ties, Awareness, and Financial situation of (grand)parents), the prevalence of each category is systematically varied while holding all other variables constant. For the continuous factors (Trust SPF, Trust banks/insurances, Trust public pensions) and for the observed variable Financial literacy, values are varied in terms of standard deviations to represent plausible changes in the distribution. In both cases, plausible changes are defined as adjustments not exceeding one-tenth of the variable’s range. This restriction is necessary because the covariance structure is held constant in the simulations. Large changes would imply correlated adjustments in other variables, which are not reflected in this setup.
To reflect estimation uncertainty, simulation intervals are reported for categorical predictors and 95% bootstrapped confidence intervals for continuous predictors. The resulting changes in participation rates are used as measures of relative importance and allow for a comparison of the strength of associations across variables.
To investigate potential gender-related effects of behavioral norms, interaction terms between Planning decisions of strong ties and gender, and between Planning decisions of weak ties and gender, are included in the model. These extended models are compared to the baseline specification using a  $\chi^2$ difference test, which evaluates whether the inclusion of interaction terms yields a statistically significant improvement.Footnote 8.
For evaluating the model fit, the Tucker-Lewis index (TLI), the comparative fit index (CFI), the root mean squared error of approximation (RMSEA), the standardized root mean squared error (SRMR), and the McKelvey & Zavoina coefficient of determination ( $R^2$) are reported (McKelvey and Zavoina, Reference McKelvey and Zavoina1975; Hu and Bentler, Reference Hu and Bentler1999). Model accuracy is evaluated by sensitivity (true positive rate) and specificity (true negative rate). The reliability, or internal consistency, of the factors is tested using McDonald’s $\omega$ coefficient, which is a robust alternative and generalization of Cronbach’s $\alpha$ (Kalkbrenner, Reference Kalkbrenner2023).
The analysis is conducted with the statistical software R (Version 4.5.0) (R Core Team, 2025) using the packages lavaan (Rosseel, Reference Rosseel2012) and semTools (Jorgensen et al., Reference Jorgensen, Pornprasertmanit, Schoemann and Rosseel2022). A significance level of 5% is used.
5. Results
The sample consists of 2,514 respondents. In terms of gender, type of employment, and enrollment rate, the sample is representative of the population in Trentino-South Tyrol. Age is limited to 20–49 years in order to focus on the age groups most affected by previous pension reforms. The sample participation rate of 20.5% is sufficiently close to the population participation rate of actively contributing members of SPFs, which is 22.8% for the corresponding age group (Campregher et al., Reference Campregher, Perkmann and Kleinheinz2022). With regard to awareness, 50.9 percent of all respondents indicate that they have already thought about their financial security after retirement.Footnote 9 There are more respondents with a tertiary degree in the sample than in the population (by 16.5 percentage points)Footnote 10. Table A1 in the Appendix shows a detailed description of all variables, while Table A4 reports the corresponding frequency distributions.
The standardized factor loadings confirm a strong contribution of the factors to their observed indicators (Table A2 in the Appendix). Reliability is further supported by McDonald’s  $\omega$, which ranges from 0.905 to 0.917 for the trust factors and 0.887 for financial risk tolerance, indicating a high level of internal consistency. Model fit indices (TLI, CFI, RMSEA, SRMR) indicate an acceptable overall fit of the model. Based on total effects, the model explains 70.7% of the variance in the latent response variable for SPF ownership and correctly classifies 75.8% of owners (sensitivity) and 93.7% of non-owners (specificity). Model tests do not provide evidence for including the interaction between gender and behavioral norms of strong social ties ( $p = 0.202$). In contrast, the interaction between weak social ties and gender is statistically significant ( $p = 0.00015$).
Figure 3 presents the estimated relationships; for readability, coefficients of personal characteristics are omitted. A complete set of estimates, including all direct effects on SPF ownership and Awareness as well as total effects on SPF ownership, is provided in Table A3 in the Appendix. Figure 4 visualizes marginal effects by translating the total effects into a potential change in the participation rate of the second pillar. In the upper panel, the simulated change in the participation rate is shown for the prevalence of individuals (A) knowing that SPFs are used among family members or friends, (B) knowing that SPFs are used among coworkers, (C) with retired (grand)parents in financial difficulties, and (D) having thought about pension planning. In the lower panel, the computed participation rate is shown for (E) financial literacy and for changes in the factor scores of the three trust dimensions (F–H). To facilitate comparison of the marginal effects, the effects corresponding to an increase of one-tenth of the total range of the respective independent variable are presented in red dashed lines.
Partial results of the structural part. Factors are represented by oval shapes, and observed variables by rectangular shapes. The paths of the personal characteristics are only outlined in this illustration. Their estimates and the full results can be found in Table A2, and Table A3 in the Appendix. Reference categories are in square brackets. McKelvey & Zavoina  $R^2$ is reported. $p \lt 0.001(^{***})$, $p \lt 0.01(^{**})$, $p \lt 0.05(^{*})$, $p \lt 0.1(^+)$.

Comparison of marginal effects on the participation rate across categorical variables (upper panel) and continuous factors/variables (lower panel). In (A), (B), (C), and (D), the expected changes in participation rates (in percentage points) are calculated for given prevalences of attributes in the sample. In the lower panel, the expected changes in participation rates are calculated by increasing or decreasing the respective factor scores of (F), (G), and (H) and the value of the continuous variable (E). The red dashed lines indicate an increase of the prevalences (A–D), factor scores (F–H), or continuous variable (E) by a tenth of their respective ranges. In the upper panel, simulation intervals (minimum, mean, and maximum) are shown, while in the lower panel, 95% bootstrapped confidence intervals are provided.

5.1. Behavioral norms
Behavioral norms of strong ties show a positive association with SPF ownership. For weak social ties, the effect is statistically significant only among women, whereas no effect is observed for men. Both strong and weak ties also increase awareness of retirement planning, whether the social environment relies on SPFs (strong ties) or on other forms of provision (weak ties, in the case of women).
The simulations suggest that behavioral norms of strong ties are associated with an increase of about 2.5 percentage points in the predicted participation rate (for a 10-percentage-point increase in prevalence). This association is larger than that of behavioral norms of weak ties, where the participation rate among women rises by roughly 1 percentage point, while no change is observed for men.
5.2. Attitudes
Perceived financial difficulties of retired parents or grandparents are positively associated with both awareness and SPF ownership. Consistent with this, the simulations indicate an increase of around 1 percentage point in the predicted participation rate (for a 10-percentage-point increase in prevalence). This association is smaller than that of behavioral norms of strong ties but comparable in size to that of behavioral norms of weak ties among women. By contrast, financial risk tolerance is positively linked only to retirement planning awareness and shows no statistically significant total effect on SPF ownership.
5.3. Perceived behavioral control
Regarding perceived behavioral control, financial literacy is positively related to awareness. While its direct effect is not significant, the total effect on SPF ownership reaches statistical significance. The perceived personal financial situation, however, does not show any effect on either awareness or SPF ownership. The three trust dimensions produce heterogeneous results. Trust in SPFs is positively associated with both awareness and SPF ownership. Trust in public pensions is negatively associated with SPF ownership but shows no effect on awareness. Trust in banks and insurance companies are negatively related to both outcomes.
The simulations show that trust in SPFs emerges as the strongest positive predictor, with an estimated increase of about 7 percentage points in the participation rate (for a 10% increase in factor scores). By contrast, trust in public pensions ( $-$2.9 percentage points) and trust in banks and insurances ( $-$0.9 percentage points) are both negatively associated with participation. Financial literacy shows a slightly smaller but still positive effect of around 0.8 percentage points (for a 10% increase in its total range). Overall, the simulations highlight trust in SPFs as the factor most strongly associated with changes in predicted participation rates. Substantial associations are also observed for behavioral norms of strong ties and for trust in public pensions. More moderate associations are found for the perceived financial situation of retired (grand)parents and for behavioral norms of weak ties among women. Finally, trust in banks and insurances as well as financial literacy show comparatively smaller associations with participation rates.
5.4. Awareness for retirement planning
Awareness for retirement planning is positively associated with SPF ownership. However, the simulations indicate that the effect is relatively small on the participation scale in comparison to other predictors.
6. Discussion
The results provide support for both H1a and H1b, suggesting that behavioral norms are linked to SPF ownership in two ways: through individuals aligning their own planning behavior with that of their social environment, and through greater awareness for retirement planning that arises when people observe others’ decisions. One possible interpretation is that individuals imitate the financial planning behavior of others who are perceived to be better informed or more experienced, a mechanism discussed by Burtless (Reference Burtless and Schaie2006) as an alternative to fully rational decision-making. The present study differs from Croy et al. (Reference Croy, Gerrans and Speelman2010), who did not report a significant effect of behavioral norms on retirement saving intentions, but it is consistent with Bailey et al. (Reference Bailey, Nofsinger and O’Neill2004), who found that both subjective and behavioral norms are related to financial planning. The association of behavioral norms with awareness also helps explain why the overall link between awareness and SPF ownership appears relatively modest. Reflecting on retirement security does not necessarily translate into SPF participation alone, as individuals may also consider other saving strategies such as personal pension plans, real estate, or securities. Taken together, the findings highlight the role of behavioral norms both in SPF ownership (H1a) and in fostering awareness (H1b), thereby broadening the range of options individuals take into account when planning for retirement.
Evidence is found for H2, which proposed that the influence of behavioral norms on SPF ownership is stronger for family and friends (strong ties) than for coworkers (weak ties). This pattern is consistent with Brown and Reingen (Reference Brown and Reingen1987), who argued that strong ties play a greater role in decision-making processes, and with Boer and Westhoff (Reference Boer and Westhoff2006), who reported that social norms of strong ties exert more influence than those of weak ties. Although these studies address different contexts, both point to the broader relevance of tie strength in shaping social influence. The present study contributes to this line of reasoning by being the first, to our knowledge, to examine behavioral norms differentiated by tie strength in the domain of retirement planning. Whereas previous research has typically focused either on workplace peers or on family and friends, the present approach considers both simultaneously.
Only partial evidence is found for H3, which predicted that the effect of behavioral norms on SPF ownership would be stronger for women than for men. The analysis reveals gender differences, but these are not uniform across social tie strength. A significant association between behavioral norms and SPF ownership is observed for women in the context of weak ties (coworkers), whereas no gender-specific differences emerge for strong ties (family and friends). This is consistent with Griffin et al. (Reference Griffin, Loe and Hesketh2012) in showing that behavioral norms are associated with retirement planning behavior among women but not among men. At the same time, the two studies differ in the type of ties considered: Griffin et al. (Reference Griffin, Loe and Hesketh2012) assessed behavioral norms with reference to “important others”, which in the present framework correspond more closely to strong ties, whereas the gender-specific association here is observed only for weak ties. One possible interpretation is that gender-related differences in self-construal (Cross and Madson, Reference Cross and Madson1997; Cross, Reference Cross2020) or in the way social groups are perceived (Foels and Tomcho, Reference Foels and Tomcho2009) may play a stronger role in workplace settings, where group dynamics are more salient. Alternatively, the association could reflect occupational patterns, as women are more often employed in jobs involving social interaction and empathy, which may increase sensitivity to workplace norms. Whether these gender-specific patterns reflect broader differences in self-construal, perceptions of social groups, or occupational environments remains an open question for future research.
Consistent with H4a, perceiving a poor financial situation of retired parents or grandparents is associated with a higher likelihood of SPF ownership. Support is also found for H4b, as the analysis indicates that this association operates partly through awareness for retirement planning. In other words, individuals who perceive their parents or grandparents to have experienced financial difficulties are more likely to reflect on their own retirement security, and this awareness is in turn linked to SPF ownership.
Earlier studies already pointed in this direction. Lusardi (Reference Lusardi2003) emphasized that the unpleasant financial experiences of older relatives can provide strong incentives for retirement planning, and Robertson-Rose (Reference Robertson-Rose2020) reported in interviews that individuals attributed their retirement planning to financial difficulties of parents. The present findings extend this line of evidence by demonstrating quantitatively, in a large sample, that perceptions of financial hardship among parents or grandparents are associated with both higher awareness for retirement planning (H4b) and a greater probability of SPF ownership (H4a). These results suggest that adverse financial circumstances within the family can shape attitudes toward retirement planning and encourage planning behavior.
Beyond the hypothesized effects, the analysis highlights the importance of institutional trust and financial literacy. Both can be understood as resources that lower informational and psychological barriers and provide a reliable context for action, thereby enhancing perceived control over retirement planning decisions. Among the predictors, trust in SPFs shows the strongest positive association with SPF ownership, whereas trust in public pensions is negatively related. Next in importance are behavioral norms and perceptions of the financial situation of retired parents and grandparents, followed by weaker associations: a positive link for financial literacy and a negative one for trust in banks and insurance companies. Overall, the evidence indicates that both institutional trust and social dynamics play a central role in shaping retirement planning decisions.
7. Conclusion
This paper employed a comprehensive structural equation model to investigate the factors that influence enrollment in supplementary pension funds, with particular attention to the role of behavioral norms within the social environment. Building on the Theory of Planned Behavior, the study examined how behavioral norms are related to retirement planning, focusing on the strength of social ties and potential gender differences, as well as the financial experiences of retired parents and grandparents. The results indicate that behavioral norms communicated through strong ties, such as family and friends, play an important role in shaping retirement planning behavior, while evidence for weak ties, such as coworkers, is found only among women. In addition, perceiving retired parents or grandparents as having faced financial difficulties is associated with greater awareness of retirement planning and a higher likelihood of participation in supplementary pension funds.
These findings address a gap in the literature, which has predominantly emphasized individual-level determinants while giving less attention to social influences. They also speak directly to the demographic and policy challenges facing European pension systems, which increasingly rely on voluntary participation in the second pillar to ensure adequate retirement income. Taken together, the evidence indicates that the decision to plan for retirement should not be analyzed in isolation from the social environment, and that public policies may benefit from considering these social influences.
Despite these contributions, several limitations should be acknowledged. Awareness of retirement planning was measured with a single indicator and does not capture the depth or intensity of reflection. As a result, the study cannot determine whether more extensive deliberation about retirement planning is linked to a higher likelihood of supplementary pension fund ownership. Moreover, within the framework of the theory of planned behavior, awareness is only an antecedent of the intention to plan via supplementary pension funds, rather than a direct measure of intention. A further limitation concerns the scope of social influences considered. To obtain a more comprehensive understanding of the role of the social environment in retirement planning, future studies should incorporate both subjective norms and behavioral norms simultaneously. Another limitation concerns the measurement of financial literacy. The study relied on an objective measure as a proxy for perceived behavioral control. On average, this may bias the effect downward, since individuals with low objective literacy may still perceive themselves as financially competent and thus engage in planning behaviors. Future research could therefore benefit from including subjective assessments of financial literacy, which may be better suited to capture perceived behavioral control.
Overall, this study highlights the importance of the personal social environment in retirement planning, an aspect that has received limited attention in previous research. Its further consideration offers considerable potential for both advancing theory and informing policies that aim to strengthen participation in the second pillar in the face of demographic change.
Supplementary material
The supplementary material for this article can be found at https://doi.org/10.1017/S1474747225100097.
Appendix
Variable description

a The questions to these variables allowed the option “don’t know”. These values have been reassigned to the category with the best contextual fit. For example, for Trust info banks/insurances, an answer of “don’t know” was coded as 3 on the Likert scale ranging from 1 (no trust) to 5 (complete trust). Altogether 852 observation units had at least one “don’t know”, and approximately 65% of these had just one or two “don’t know” in all 12 variables. For a robustness check, the observation units with “don’t know” were deleted and the SEM was recomputed. The findings remained qualitatively the same and can be found in Table S1 and Table S2 in the Supplementary Material.
Measurement model

Note: Factor loadings are standardized. McDonald’s  $\omega$ is reported based on the measurement model only.
Findings of the SEM with (probit link)

*** 2514 Observations.  $p \lt 0.001 (^{***})$, $p \lt 0.01 (^{**})$, $p \lt 0.05 (^{*})$, $p \lt 0.1(^{+})$. Note: The $\chi^2$ difference test suggests including the interaction of Planning decisions of weak ties and Gender (p = 0.00015). We find that there is no empirical evidence for the interaction between Planning decisions of strong ties and Gender (p = 0.2015); thus, we only consider the interaction between Planning decisions of weak ties and Gender. For the calculation of sensitivity and specificity, the cutoff value is chosen such that the estimated participation rate matches the participation rate in the sample.
Frequency table

a The percentages always refer to the entire sample (2514 observations).
Appendix B. The model
Let  $\mathbf{X}$ be an $(N\times k)$ model matrix, $\mathbf{x}^{\top}_i$ a $(1\times k)$ vector containing the values of $k$ predictor variables for observation unit $i$. Let $\mathbf{m}$ and $\mathbf{y}$ be $(N \times 1)$ binary vectors representing the observed values of the mediator and the dependent variable, respectively, and let $\boldsymbol{\beta}$ and $\boldsymbol{\gamma}$ be $(k \times 1)$ vectors of probit coefficients. The scalar $\alpha$ represents the coefficient of the mediating variable, and $N$ denotes the total number of observations.
 \begin{equation*}
\mathbf{X} =
\begin{bmatrix}
\mathbf{x}^{\top}_1\\
\vdots \\
\mathbf{x}^{\top}_N
\end{bmatrix}
\quad
\mathbf{y} =
\begin{bmatrix}
y_1\\
\vdots \\
y_N
\end{bmatrix}
\quad
\mathbf{m} =
\begin{bmatrix}
m_1\\
\vdots \\
m_N
\end{bmatrix}
\quad
\boldsymbol{\beta} =
\begin{bmatrix}
\beta_1\\
\vdots \\
\beta_k
\end{bmatrix}
\quad
\boldsymbol{\gamma} =
\begin{bmatrix}
\gamma_1\\
\vdots \\
\gamma_k
\end{bmatrix}
\end{equation*}
\begin{equation*}
\mathbf{X} =
\begin{bmatrix}
\mathbf{x}^{\top}_1\\
\vdots \\
\mathbf{x}^{\top}_N
\end{bmatrix}
\quad
\mathbf{y} =
\begin{bmatrix}
y_1\\
\vdots \\
y_N
\end{bmatrix}
\quad
\mathbf{m} =
\begin{bmatrix}
m_1\\
\vdots \\
m_N
\end{bmatrix}
\quad
\boldsymbol{\beta} =
\begin{bmatrix}
\beta_1\\
\vdots \\
\beta_k
\end{bmatrix}
\quad
\boldsymbol{\gamma} =
\begin{bmatrix}
\gamma_1\\
\vdots \\
\gamma_k
\end{bmatrix}
\end{equation*}Analogous to the mediation model with a continuous  $\mathbf{m}$ and a binary $\mathbf{y}$ in Muthén and Asparouhov (Reference Muthén and Asparouhov2015), the model for a binary $\mathbf{m}$ and a binary $\mathbf{y}$ is specified as follows:
 \begin{align*}
\mathbf{y}^\ast &= \alpha \mathbf{m}^\ast + \mathbf{X}\boldsymbol{\beta} - \tau_{y^\ast} + \boldsymbol{\epsilon}_1
\end{align*}
\begin{align*}
\mathbf{y}^\ast &= \alpha \mathbf{m}^\ast + \mathbf{X}\boldsymbol{\beta} - \tau_{y^\ast} + \boldsymbol{\epsilon}_1
\end{align*} \begin{align*}
\mathbf{m}^\ast &= \mathbf{X}\boldsymbol{\gamma} - \tau_{m^\ast} + \boldsymbol{\epsilon}_2,
\end{align*}
\begin{align*}
\mathbf{m}^\ast &= \mathbf{X}\boldsymbol{\gamma} - \tau_{m^\ast} + \boldsymbol{\epsilon}_2,
\end{align*} where  $\mathbf{y}^\ast$ and $\mathbf{m}^\ast$ are continuous latent response variables, $\tau_{y^\ast}$ and $\tau_{m^\ast}$ their respective thresholds, and $\boldsymbol{\epsilon}_1$ and $\boldsymbol{\epsilon}_2$ are error terms. The observed values of $y$ and $m$ are determined by whether their latent counterparts exceed the corresponding thresholds. Substituting Equation (2) in Equation (1) gives:
 \begin{equation*}
\mathbf{y}^\ast = \alpha (\mathbf{X} \boldsymbol{\gamma}-\tau_{m^\ast} ) + \mathbf{X} \boldsymbol{\beta} - \tau_{y^\ast} + \boldsymbol{\epsilon}_1 + \alpha\boldsymbol{\epsilon}_2.
\end{equation*}
\begin{equation*}
\mathbf{y}^\ast = \alpha (\mathbf{X} \boldsymbol{\gamma}-\tau_{m^\ast} ) + \mathbf{X} \boldsymbol{\beta} - \tau_{y^\ast} + \boldsymbol{\epsilon}_1 + \alpha\boldsymbol{\epsilon}_2.
\end{equation*} The latent response variable  $\mathbf{y}^\ast$ follows a normal distribution conditional on $\mathbf{X}$, given by:
 \begin{equation*}
\mathbf{y}^\ast | \mathbf{X} \sim \mathcal{N}(\alpha (\mathbf{X} \boldsymbol{\gamma}-\tau_{m^\ast} ) + \mathbf{X} \boldsymbol{\beta} - \tau_{y^\ast},\; \sigma_1^2 + \alpha^2 \sigma^2_2),
\end{equation*}
\begin{equation*}
\mathbf{y}^\ast | \mathbf{X} \sim \mathcal{N}(\alpha (\mathbf{X} \boldsymbol{\gamma}-\tau_{m^\ast} ) + \mathbf{X} \boldsymbol{\beta} - \tau_{y^\ast},\; \sigma_1^2 + \alpha^2 \sigma^2_2),
\end{equation*}where the parameters  $\sigma_1^2$ and $\sigma_2^2$ represent the variances of the error terms $\boldsymbol{\epsilon}_1$ and $\boldsymbol{\epsilon}_2$, respectively. To identify the model, either the total variance of the latent responses or the residual variance of the latent responses is set to unity (delta vs. theta parameterization; e.g.,Wang, Reference Wang, De Boeck and Yotebieng2023). In our case, the theta parameterization is usedFootnote 11.
Appendix C. Simulation of participation rates
• For categorical variables, we split the model matrix X into the submatrices ${\textbf{A}}_{h\times k}$ and
${\textbf{B}}_{(N-h) \times k}$, where
${\textbf{A}}_{h\times k}$ consists of all
$h$ observation units for which the independent variable of interest (with index
$v$) has the value
$q$. Let
${\textbf{B}}_{(N-h) \times k}$ be the matrix of the remaining observations.
\begin{alignat*}{2}
{\textbf{A}} & = [\mathbf{a}^{\top}_1, ..., \mathbf{a}^{\top}_h]^{\top} && = [\mathbf{x}^{\top}_i] \;\;\;\; \forall i\in \{i=1,...,N\}:x_{iv} = q \\
{\textbf{B}} & = [\mathbf{b}^{\top}_1, ..., \mathbf{b}^{\top}_{N-h}]^{\top} && = [\mathbf{x}^{\top}_i] \;\;\;\; \forall i\in \{i=1,...,N\}:x_{iv} \neq q \\
\end{alignat*}
${\textbf{A}}_{h\times k}$ and
${\textbf{B}}_{(N-h) \times k}$, where
${\textbf{A}}_{h\times k}$ consists of all
$h$ observation units for which the independent variable of interest (with index
$v$) has the value
$q$. Let
${\textbf{B}}_{(N-h) \times k}$ be the matrix of the remaining observations.
\begin{alignat*}{2}
{\textbf{A}} & = [\mathbf{a}^{\top}_1, ..., \mathbf{a}^{\top}_h]^{\top} && = [\mathbf{x}^{\top}_i] \;\;\;\; \forall i\in \{i=1,...,N\}:x_{iv} = q \\
{\textbf{B}} & = [\mathbf{b}^{\top}_1, ..., \mathbf{b}^{\top}_{N-h}]^{\top} && = [\mathbf{x}^{\top}_i] \;\;\;\; \forall i\in \{i=1,...,N\}:x_{iv} \neq q \\
\end{alignat*}• Two scenarios are investigated: One is to estimate the participation rate when the frequency of the value
$q$ is increased in the variable
$v$ (increasing the prevalence), and the other is to estimate the participation rate when the frequency of the value
$q$ is decreased in variable
$v$ (decreasing the prevalence). The first scenario is described below. The second one follows a similar logic and its description is thus omitted.The additional number of observations needed in order to reach a proportion
$p$ of the total sample where the variable with index
$v$ has value
$q$ is
\begin{equation*}
n = \lfloor Np - h \rfloor.
\end{equation*}• Start of the Monte Carlo simulation:
(1) Draw a random sample of size
$n$ without replacement from
$\text{I} = \{1, ..., N-h\}$, the set of indices of observations in matrix B.
\begin{equation*}
\begin{aligned}
\text{S}^{[j]} &= \{s_1, \ldots, s_n | s_1 \in_R \text{I}, ..., s_n \in_R \text{I}\setminus \{s_1,..., s_{n-1}\}\},
\end{aligned}
\end{equation*}where
$\in_R$ means “… chosen uniformly at random from …” and
$j=1,\dots,J$ indicates one iteration of the simulation.(2) Next, B is split into a submatrix
${\textbf{B}}_s^{[j]}$, containing all randomly chosen observations, and a submatrix
${\textbf{B}}_{\text{-}s}^{[j]}$ containing the rest.
\begin{equation*}
\begin{aligned}
{\textbf{B}}_s^{[j]} = & [\mathbf{b}_i^{\top}]_{i \in S^{[j]}}\\
{\textbf{B}}_{\text{-}s}^{[j]} = & [\mathbf{b}_i^{\top}]_{i \notin S^{[j]}}.
\end{aligned}
\end{equation*}(3) Replace for all observations in
${\textbf{B}}_s^{[j]}$ the value of the variable
$v$ with the value
$q$. The new matrix
$\tilde{\textbf{B}}_s^{[j]}$ now contains all updated observations of variable
$v$.
\begin{equation*}
\tilde{\textbf{B}}_s^{[j]} = {\textbf{B}}_s^{[j]}, \; \text{with} \;\; \text{b}_{iv} = q, \; \forall i \in \{1,..., n\}\\
\end{equation*}(4) Create an updated model matrix
$\tilde{\mathbf{X}}^{[j]}$ by combining
$\tilde{\textbf{B}}_s^{[j]}$, the matrix of updated observations with A and
${\textbf{B}}_{\text{-}s}^{[j]}$, the matrices with unaltered observations. The order of observations is arbitrary.
\begin{equation*}\widetilde{\mathbf X}^{\lbrack j\rbrack}=\begin{bmatrix}\textbf{A}\\\widetilde{\textbf{B}}_s^{\lbrack j\rbrack}\\\textbf{B}_{\text{-}s}^{\lbrack j\rbrack}\end{bmatrix}\end{equation*}(5) Calculate the vector of propensity scores
$\boldsymbol{\pi}^{[j]}$ by transforming the predicted probit scores to the probability scale using the CDF of the standard normal distribution
$(\Phi)$.
\begin{equation*}
\boldsymbol{\pi}^{[j]} = \Phi \Biggl( \frac{\hat{\alpha} (\tilde{\mathbf{X}}^{[j]} \hat{\boldsymbol{\gamma}}-\hat{\tau}_{m^\ast} ) + \tilde{\mathbf{X}}^{[j]} \hat{\boldsymbol{\beta}} - \hat{\tau}_{y^\ast}}{\sqrt{\hat{\sigma}^2_1 + \hat{\alpha}^2 \hat{\sigma}^2_2}}\Biggr).
\end{equation*}(6) Prediction of individual enrollment in SPFs: Individuals with a propensity score higher than the cutoff value are assumed to be enrolled in an SPF (
$\text{P}^{[j]}$). The cutoff value is chosen prior to the simulation such that the predicted participation rate of the model is in line with the observed participation rate in the sample.
\begin{equation*}
\text{P}^{[j]} = \{\pi \in \boldsymbol{\pi}^{[j]} | \pi \gt \text{cutoff} \} \\
\end{equation*}(7) Prediction of the participation rate: The participation rate
$\text{PR}^{[j]}$ is the proportion of individuals enrolled in SPFs out of the total number of individuals in the sample.
\begin{equation*}
\text{PR}^{[j]} = \frac{| \text{P}^{[j]}|}{N}.
\end{equation*}(8) Steps 1–7 are repeated
$J$ times.
• Finally, the mean participation rate is calculated and displayed along with the range, i.e., the interval defined by the minimum and maximum of the simulated participation rates.
\begin{equation*}
\text{MPR} = \frac{1}{J} \sum^J_{j=1} \text{PR}^{[j]},
\end{equation*}
\begin{equation*}
\text{range} = [\min\{\text{PR}^{[1]}, ..., \text{PR}^{[J]}\}, \max\{\text{PR}^{[1]}, ..., \text{PR}^{[J]}\}].
\end{equation*}


 Open access