

Studies using functional brain imaging in people with schizophrenia have shown distributed patterns of activity during auditory hallucinations (Reference Shergill, Brammer and WilliamsShergill et al, 2000; Reference McGuire, Shergill and BrammerMcGuire et al, 2001). There are constraints to the approach of using clinical samples, such as confounds of additional symptomatology and medication. Using a proxy for hallucinations such as inner speech (Reference Shergill, Brammer and FukudaShergill et al, 2002) can overcome some confounds but fails to capture the autonomous quality of auditory hallucinations.
Non-clinical isolated psychotic symptoms such as auditory hallucinations may represent part of an extended phenotype of psychosis (Reference Johns, Cannon and SingletonJohns et al, 2004). Predictors of isolated psychotic symptoms resemble those for schizophrenia, such as drug use and urban upbringing (Reference van Os, Hanssen and Bijlvan Os et al, 2000; Reference Johns, Cannon and SingletonJohns et al, 2004). The current study aimed to show that self-reported hallucinatory experiences are (a) accompanied by an information processing bias in a signal detection task, and (b) associated with patterns of cerebral activation similar to those reported for auditory hallucinations in clinical samples.
METHOD
Participants
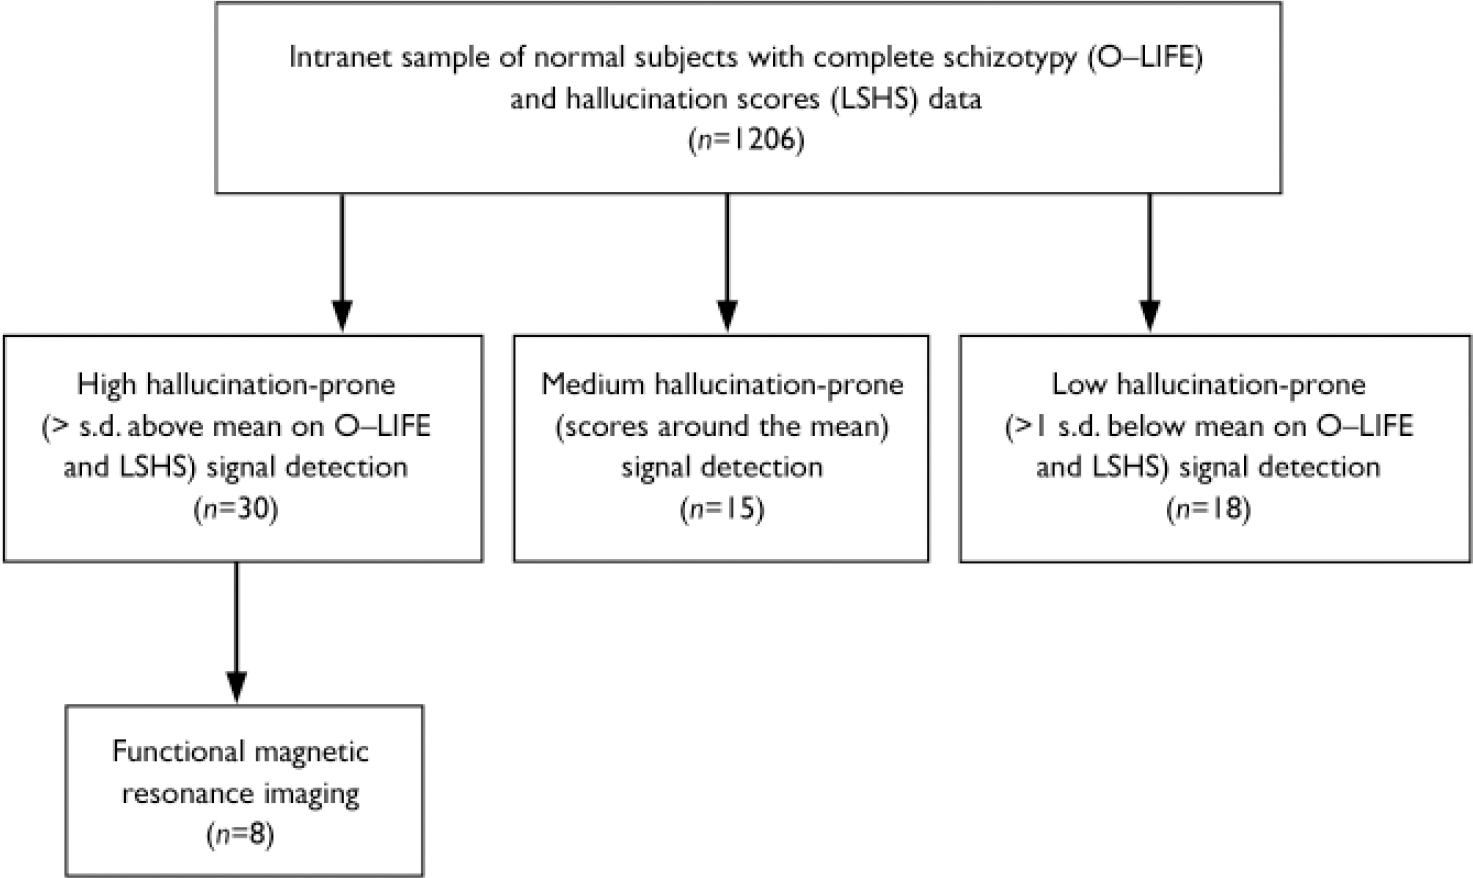
Stage 1 of the study aimed to identify normal participants in the main age of risk for psychosis who were prone to auditory hallucinatory phenomena. One of the most widely used measures of ‘psychosis-proneness’ is schizotypy. A university intranet was used to administer online questionnaires to a sample of students. The questionnaires were (a) the Oxford Liverpool Inventory of Feelings and Experiences (O–LIFE, Reference Mason, Claridge and JacksonMason et al, 1995), a well-validated self-report questionnaire to assess schizotypy, which comprises four subscales (unusual experiences (UE), cognitive disorganisation (CD), introvertive anhedonia (IA), impulsive nonconformity (IN)), and (b) the Launay–Slade Hallucinations Scale (LSHS; Reference Launay and SladeLaunay & Slade, 1981). These questionnaires were made known to students using electronic means (email or a pop-up message). Participants gave their email address to allow the researchers to contact them for later phases of the study (these were kept separately from the data). Responses were securely stored, along with the collection of basic demographic data. A total of 1206 people completed these questionnaires. Participants were not given any incentive to complete the intranet-based questionnaire. Ethical approval from the University of Manchester ethics committee was given and participants gave informed consent.
For the auditory signal detection task (stage 2), 63 participants comprising three subgroups were chosen on the basis they scored highly, around the mean or low on both ‘positive’ schizotypy score and reported hallucinations. This was defined as +/–1 s.d. (or around the mean) on both the unusual experiences sub-scale from the O–LIFE and on the LSHS, since these were thought to be the most sensitive measures of the positive aspects of schizotypy. This gave three subgroups of high, medium and low ‘hallucination proneness’. For these subgroups, scores from the online tests were confirmed by administering the same scales at interview. In addition, participants completed the Schizotypal Personality Questionnaire (SPQ; Reference RaineRaine, 1991). The SPQ measures schizotypal traits using the diagnostic criteria for schizotypal personality disorder from DSM–III–R, which offered the opportunity to validate the dimensional measurement of positive schizotypy (the O–LIFE) against a more clinical profile. Participants also completed a semi-structured interview to assess substance use and the presence or history of major depression or psychotic disorder (Reference Endicott and SpitzerEndicott & Spitzer, 1978).
For the functional imaging experiment (stage 3), 8 participants from the high hallucination prone group, who completed the signal detection paradigm outside the scanner and produced a high number of false alarm responses, underwent a similar paradigm in a functional magnetic resonance imaging (fMRI) scanner. Participants were selected on the basis that they reported a high number of the false alarms outside the scanner and agreed to the scanning study. These were 2 females and 6 males who were psychologically healthy and right-handed. Participants used their preferred hand to respond using the button box.
Auditory signal detection task
The signal detection task was developed to elicit hallucinatory phenomena under ambiguous conditions. The stimulus train delivered over headphones lasted 8 min and each participant completed it three times. It was devised in a computerised audio editing programme. The 8-min period was divided into 8 s-epochs, which comprised 5 s of white noise (unpatterned hissing) and 3 s marked by the absence of the white noise. The fMRI scanner noise was played throughout the 8 min. During 60% of the 5 s-epochs of white noise a 1 s-snippet of androgynous voice was presented in the middle second. A third of the time the voice snippets were clearly audible, while the others were presented at auditory threshold. (Both volumes were previously determined using a ‘hearing test’ completed under the same conditions with different participants of a similar age. It would have been inappropriate to set the threshold for each participant separately for two reasons: (a) it would have sensitised the participants to the paradigm and altered their threshold; and, (b) signal detection analysis assumes that every participant hears the same stimuli, which would not have been the case with individual thresholds.) Participants listened to the paradigm through standard stereo headphones. Participants responded either ‘Yes’ or ‘No’ by pressing one of two buttons with their preferred hand when the white noise stopped to indicate whether they had perceived a voice. The speed with which participants responded was also recorded.
Functional magnetic resonance image acquisition
A 1.5 T Phillips scanner, with a TR of 2.98 s and a TE of 40 ms was used. In total, 38 brain slices were acquired and 160 brain volumes were taken; slice thickness was 3.5mm. Transverse slice acquisition was used and slices were acquired contiguously.
Each participant completed the signal detection paradigm three times while in the scanner. The stimuli were delivered through plastic tubing leading to headphones, and amplified appropriately. (A participant was placed in the scanner and played the stimuli at varying volume levels in order to determine the volume that made the clearly audible and threshold voices appropriately difficult to detect. The results from this pilot work are not reported here.)
The signal detection paradigm was similar to that completed outside the scanner with two amendments. First, the white noise epochs were decreased to 3 s to increase the number of white noise epochs, increasing the opportunities for participants to experience false alarms. Second, the periods marked by the absence of white noise varied between 3 and 6 s to randomise slice acquisition.
Statistical and image analysis
For the signal detection experiment, four pieces of information were determined for each participant:
-
(a) Hits: a positive response when a voice was present (either at the clearly audible or threshold volume)
-
(b) Correct rejections: a negative response when a voice was not present
-
(c) Misses: a negative response when a voice was presented
-
(d) False alarms: a positive response when a voice was not present (the phenomena under study).
From the relationship between the hits and false alarms two measures can be calculated: d′ (d prime) and B″ (or β). The d′ value is a measure of sensitivity to the detection of the voice: a d′ of zero indicates zero sensitivity to detecting a true signal, whereas increasingly positive values indicate more sensitivity for detecting signals. The β value indicates the degree to which each participant has a bias towards responding ‘Yes’. It varies between −1 and +1 and values below +1 indicate a lax criterion (i.e. being more likely to respond positively in the absence of a true stimulus). The formula used to calculate B″ was as follows:
For the fMRI experiment, an event-related approach was taken to the analysis. The primary events of interest were the false alarms, since it was thought these were indicative of non-clinical auditory hallucinations. The analysis was performed in Statistical Parametric Mapping 2 (Wellcome Trust Department of Cognitive Neurology, University College, London). The standard pre-processing procedures of realignment, normalising and smoothing were performed. Two subtractions were completed:
-
(a) False alarms minus correct rejections: to examine the areas activated by hallucination-like phenomena with white noise removed
-
(b) False alarms minus hits: to examine any areas activated by hallucination-like phenomena in addition to areas activated by hearing a voice which was present.
Contrast images were produced for each participant and placed into a random effects analysis. A one-sample t-test was used. Z scores above 3.09 were taken to be significant (approximating to a P=0.001 level of uncorrected significance). The voxel level approach and the uncorrected significance levels were used since a descriptive approach was taken to the data. Talairach & Tournoux's (Reference Talairach and Tournoux1988) atlas was used. Schmahmann et al (Reference Schmahmann, Doyon and McDonald1999) was used to determine the structural localisation of the cerebellum activation.
RESULTS
On-line assessments
There were 1206 respondents (35% male, mean age of 22.5 years, (s.d.=6.2). Three schizotypy sub-scales were normally distributed, all had means similar to those previously reported: unusual experiences: 10.26 (6.59); cognitive disorganisation: 12.92 (5.72); introvertive anhedonia (not normally distributed): 13.87 (2.72); impulsive nonconformity: 11.85 (3.17). Some respondents positively endorsed hallucination-like phenomena items from the LSHS (e.g. 19.5% had heard a voice speaking their thoughts aloud; 10.4% had been troubled by hearing voices in their head). The O–LIFE total score correlated with the LSHS total (Pearson's r=0.68, P<0.0001).
Participants completed the O–LIFE again when interviewed. The LSHS and O–LIFE unusual experiences sub-scale both showed good test–retest reliability, with Pearson's correlations of 0.76 (P<0.001) and 0.65 (P>0.001) respectively. Participants also completed the SPQ, which has three dimensions: cognitive perceptual, disorganised and interpersonal. Pearson's correlations between the SPQ dimensions, the O–LIFE sub-scales and the LSHS varied between 0.21 and 0.70 (all P<0.05). The introvertive anhedonia sub-scale did not correlate with any SPQ dimensions.
The signal detection task was completed by 63 participants (49% were male, mean age 23.9 years (s.d.=8.6)). The participants in the high schizotypy (‘high hallucination prone’; n=30), mean (‘medium hallucination prone’; n=15), and low schizotypy (‘low/non-hallucination score’, n=18) groups (see Fig. 1) did not differ on gender, age, university attended (χ2=1.36, d.f.=2, NS), or handedness (χ2=2.81, d.f.=2, NS). The majority of the sample (72%) reported smoking cannabis at least once in their lifetime. Other recreational drugs reported were (listed according to frequency, with a reporting rate of at least 10%): cocaine (19%), ecstasy (19%), lysergic acid diethylamide (13%) and amphetamine (11%).
Signal detection task
Sensitivity
The d′ parameter is a measure of sensitivity of the participant's ability to detect the signals presented. The results for the mean and low groups were similar to each other; consequently they were merged to produce a control group (n=33) to compare with the high hallucination prone group (n=30). Using independent t-tests there were no group differences on d′ for the 3 trials. For the high hallucination prone group the means (s.d.s) were: trial 1: 1.64 (0.60), trial 2: 2.10 (0.81), trial 3: 2.10 (0.78). For the rest of the sample the means (s.d.s) were: trial 1: 1.86 (0.76), trial 2: 2.15 (0.63), trial 3: 2.25 (0.60).
Decision-making bias
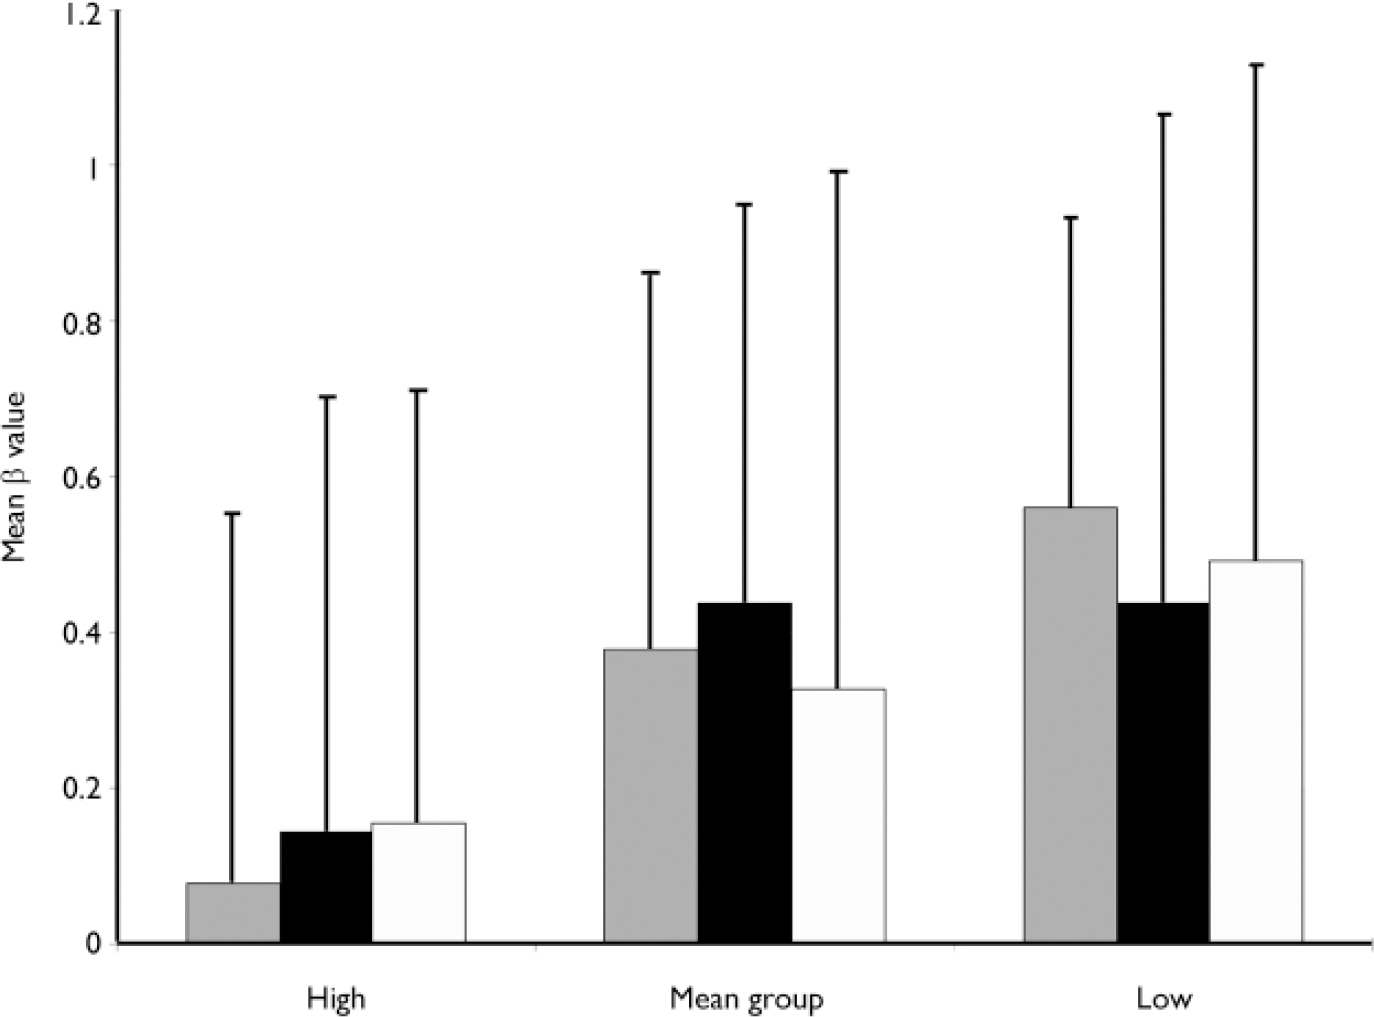
The measure of bias indicates the tendency to respond positively, even in the absence of external stimulus (false alarm). The data for the three groups of participants (3 levels of between subjects) over the three repeated trials (3-levels of within subjects) were entered into a repeated measures analysis of covariance (ANCOVA) (see Fig. 2). There was no effect of trial repetition (F=0.056, d.f.=1, NS), nor was there an interaction between group and trial repetition (F=0.702, d.f.=2, NS). There was a significant main effect of hallucination proneness group (F=3.84, d.f.=2, 60, P=0.027) with the high group scoring significantly lower than the low group in preplanned least squares difference analysis (mean difference −0.37, P=0.01). This indicates the high hallucination prone group responded positively more frequently regardless of whether a voice was present, i.e. they reported more false alarms.
Participant flows in schizotypy assessments, signal detection and imaging.
Effects of drug use on false alarms
The high hallucination prone group were more likely to have smoked cannabis than the low or mean groups (χ=7.10, d.f.=2, P=0.029). The effect of hallucination proneness group and cannabis use on total false alarms was investigated using a one-way ANOVA. There was a significant main effect of group (F(2,53)=3.07, P=0.03) but there was no significant main effect of having smoked cannabis (F(1,53)=0.50, NS) nor a significant interaction between having smoked cannabis and hallucination proneness group (F(2,53)=1.08, NS) on the rates of false alarms.
Means and standard deviations of the β value for the three groups of participants over the three repeated trials of the signal detection paradigm. ░, B″1; ▪, B″2; □, B″3. The β value measures the bias to respond positively in the absence of a true stimulus, with a score of 1.0 meaning a bias not to respond (conservative), and a score of 0.0 a bias to respond (liberal).
Reaction time
The speed of responding was recorded. There were complete data for 30 high hallucination prone, 14 mean scoring and 15 low hallucination prone participants. Response times from the three repetitions were placed in a repeated measures ANOVA with schizotypy group as an independent variable. There were no significant main effects for trial repetition (F=2.95, d.f.=1, NS) or proneness group (F=2.70, d.f.=2, NS). However, there was a significant interaction between response time and participant group (F=4.03, d.f.=2, P=0.02). High hallucination prone participants accelerated their response times across the three trials, unlike participants in the other groups. For the high group mean reaction times (s.d.) were: repeat 1: 0.14 (0.07), repeat 2: 0.13 (0.07), repeat 3: 0.11 (0.06). For the mean group mean reaction times were: repeat 1: 0.12 (0.05), repeat 2: 0.12 (0.06), repeat 3: 0.12 (0.06). Mean reaction times for the non-prone group were: repeat 1: 0.08 (0.04), repeat 2: 0.10 (0.08), repeat 3: 0.09 (0.03).
Functional magnetic resonance imaging
Functional magnetic resonance data were acquired during the signal detection task for 8 high hallucination prone participants.
(a) False alarms minus correct rejections
This subtraction revealed brain areas of activation associated with false alarms, with the influence of white noise removed. It was intended to reveal the brain areas activated by hallucination-like phenomena. The results in Table 1 (see also Fig. DS1 in the data supplement of the online version of this paper) show that there were four discrete areas of activation: the right middle temporal gyrus, bilateral fusiform gyrus and the right putamen.
Brain regions, Brodmann's area, Talairach coordinates, Z score and cluster size

| Brain region | Left (L)/Right (R) | Brodmann's Area | Talairach coordinates (x, y, z) | Z score | Cluster size | ||
|---|---|---|---|---|---|---|---|
| Subtraction: false alarms minus correct rejections | |||||||
| Middle temporal gyrus | R | 21 | 56 | -1 | -25 | 3.24 | 20 |
| Fusiform | L | 20 | -50 | -13 | -22 | 3.36 | 12 |
| Fusiform | R | 37 | 39 | -33 | -14 | 2.85 | 13 |
| Putamen | R | N/A | 18 | 11 | -3 | 3.48 | 41 |
| Subtraction: false alarms minus hits | |||||||
| Superior frontal gyrus | R | 10 | 18 | 43 | -5 | 3.71 | 19 |
| Superior frontal gyrus | L | 9 | -9 | 48 | 36 | 3.35 | 10 |
| Middle frontal gyrus | L | 8 | -39 | 22 | 40 | 3.77 | 69 |
| Cingulate gyrus | R | 30 | 6 | -54 | 19 | 3.60 | 32 |
| Superior temporal gyrus | L | 38 | -48 | -13 | -22 | 3.90 | 22 |
| Superior temporal gyrus | L | 38 | -30 | 16 | -24 | 3.50 | 18 |
| Middle temporal gyrus | L | 21 | -56 | -36 | -11 | 3.21 | 14 |
| Cerebellum | R | Lobule IX | 33 | -80 | -26 | 3.17 | 24 |
(b) False alarms minus hits
This subtraction revealed areas activated during false alarms which were in addition to those activated when a voice was present. The results in Table 1 (see also Fig. DS2 in the data supplement of the online version of this paper) show that two clusters in the right superior frontal gyrus, the right middle frontal gyrus, the left cingulate gyrus, bilateral superior temporal gyrus the left middle temporal and the left cerebellum.
DISCUSSION
The aim of this study was to characterise and validate the non-clinical hallucination-like experiences reported in community surveys. We used the intranet to recruit a large sample of normal participants. Subgroups were identified on the basis of self-reported hallucinatory experiences and positive schizotypy score. Scores were validated at interview. We hypothesised that people reporting such experiences would show a response bias in a signal detection experiment. The reasons behind using the signal detection task were both practical and theoretically based. The paradigm has previously been used to examine proneness to hallucinations (e.g. Reference Bentall and SladeBentall & Slade, 1985) with some success. The signal detection task allowed proneness to false perceptions to be measured objectively. Additionally, since the stimuli in the task were required to be ambiguous (to increase the difficulty) the scanning environment did not compromise the validity of the results.
The results showed that ‘highly hallucination-prone’ participants reported more false perceptions of voices in conditions of stimulus ambiguity in the signal detection task. The data showed this to arise from a decisional bias, and not simply a decreased sensitivity, when compared to non-hallucination prone participants, replicating the results of Bentall & Slade (Reference Bentall and Slade1985) and Rankin & O'Carroll (Reference Rankin and O'Carroll1995). Ishigaki & Tanner (Reference Ishigaki and Tanner1999) agreed that decisional bias distinguished patients with schizophrenia from healthy controls, although they found a co-existing low sensitivity to detecting signals. Importantly, the data showed that distribution of the false alarms in the sample was highly positively skewed, indicating that only a small number of the high schizotypes reported a large number of false alarms. This suggests that it requires more than high schizotypy scores for participants to be prone to false perceptions. From the current study it was not possible to determine what the additional factors may be.
A finding which was not part of the original hypothesis was that the reaction (or decision-making) time in the high hallucination prone group became faster over repetitions of the experiment when compared to the other two groups, suggesting that these subjects became increasingly confident in the interpretation of their perceptual experiences, correct or not. This increase in reaction time in the high hallucination prone group suggests a ‘jumping-to-conclusions’ style of thinking associated with delusional ideation (Reference Garety, Hemsley and WesselyGarety et al, 1991).
In the fMRI study a control group of either low or mean scoring schizotypes were not included in the imaging tasks since these groups do not produce false alarms. The distribution of the false alarms was highly positively skewed and only a small number of the high schizotypes reported a large number of false alarms. This in itself is of interest since it suggests that it requires more than high schizotypy scores for participants to be prone to false perceptions. However, from the current study it was not possible to determine what the additional factors may be. Participants were asked to respond only when they heard a voice, and the areas which were activated (see below) seem to suggest it is speech that was being processed during the false alarms.
Functional magnetic resonance imaging was used to reveal areas of the brain mediated during the false alarm events, when subjects were erroneously hearing a voice. The false alarms versus correct rejections subtraction aimed to reveal areas activated during auditory hallucinations with background white noise, compared to white noise alone. Participants were asked to respond only when they heard a voice and the areas which were activated seem to suggest it is speech which was being processed during the false alarms. The subtraction revealed activations in the right middle temporal gyrus, the right and left fusiform and the putamen. In previous studies, the middle temporal gyrus has been reported to be associated with auditory hallucinations in clinical samples (Reference Lennox, Park and JonesLennox et al, 1999) when compared to rest. There is some suggestion the fusiform may be involved in the production of mental imagery (Reference Wise, Howard and MummeryWise et al, 2000). The putamen has a preferential activation for speech and its content (Reference Friederici, Ruschemeyer and HahneFriederici et al, 2003).
The false alarms versus hits subtraction highlighted areas activated during auditory hallucinations compared to detecting real speech. This subtraction would remove any areas activated by attending to speech since in both situations speech is being processed. It revealed activations in the right superior frontal gyrus, the left and right middle frontal gyrus, the left cingulate gyrus, the left and right superior temporal gyrus and the left cerebellum. Previous studies have shown that the middle frontal gyrus has preferential activation for natural speech (Reference Benson, Whalen and RichardsonBenson et al, 2001). The cingulate has been reported to be involved in a network for the recognition and processes of language. The superior temporal gyrus has been implicated in previous studies comparing auditory hallucinations to rest (Reference Lennox, Park and JonesLennox et al, 1999) during varying rates of inner speech in controls (Reference Shergill, Brammer and FukudaShergill et al, 2002). The cerebellum has been reported in a recent study in subtractions comparing certain to uncertain decision making (Reference Blackwood, Ffytche and SimmonsBlackwood et al, 2004). The authors suggest that the cerebellum is involved in making probabilistic decisions under ambiguous circumstances. This explanation appears applicable to the current paradigm.
Taken together, the behavioural and imaging results suggest our signal detection task confirms that a cognitive bias underlies proneness to non-clinical auditory hallucinations and that these experiences are mediated by similar areas of activation to those found in auditory hallucinations and inner speech in patients with schizophrenia. This is particularly the case for the temporal lobe and fusiform activations. The task which elicited the cerebellum activation in the Blackwood et al (Reference Blackwood, Ffytche and Simmons2004) study was the Beads task, used to examine a ‘jumping-to-conclusions’ style of thinking which may underpin delusion formation (Reference Garety, Hemsley and WesselyGarety et al, 1991). One model of how unusual perceptual experiences progress to full auditory hallucinations and secondary delusions is via a cognitive style involving an over-readiness to form judgements from ambiguous information (‘jumping to conclusions’) (Reference Garety, Kuipers and FowlerGarety et al, 2001), elicited by the Beads task. The cerebellar activation in the current study may reflect this mechanism, shown behaviourally in the decreasing reaction time over trials, which was confined to the hallucination-prone group.
The study design has limitations. First, although web-based ascertainment of participants is efficient, the resulting sample is not likely to be representative of the population at large. However, this was not necessary to test the main hypotheses of the study which involved within-group comparisons. Second, the role of alcohol and street drug use may be important. We collected data on this, particularly cannabis use, which are reported elsewhere (Reference Barkus, Stirling and HopkinsBarkus et al, 2006). Third, it remains open to question whether the phenomenology of the hallucinatory experiences elicited in this study are a truly valid model of those found in psychotic disorders. The experiences were the false perceptions of single words during artificial conditions of ambiguity, in the context of manufactured expectation. Although we suggest that this reflects a cognitive bias important in all hallucinatory experience, it is clearly not phenomenologically identical to the spontaneous experience of complex voice hearing which characterises schizophrenia. Direct comparison with patients with schizophrenia during a signal detection task may clarify these issues.
Acknowledgements
This project was funded by the Stanley Medical Research Institute and the Mason Medical Research Foundation.


eLetters
No eLetters have been published for this article.