

INTRODUCTION
Influenza virus, a member of the family Orthomyxoviridae, is the causative agent of influenza and produces symptoms such as fever, nasal catarrh, cough, sore throat, and difficulty in breathing. Influenza A(H1N1)pdm09 (A(H1N1)pdm09) was first detected in Mexico in April 2009 and gradually invaded the whole globe, leading to a pandemic. This virus was detected in India in May 2009. Cases were reported from almost all parts of the country. More than 100 thousand cases were confirmed by laboratories across the country and over 7700 deaths were reported [1,Reference Murhekar and Mehendale2]. The global case fatality rate was <0·5% [Reference Dawood3]; however, a few states in India reported high case fatality rates [Reference Murhekar and Mehendale2]. Three waves of influenza were reported in the country during the pandemic period, in which 20 604 cases and more than 1750 deaths were recorded by the end of 2010 [1]. After 2010, several Indian states reported resurgences of A(H1N1)pdm09, first in 2012–13, which resulted in 10 294 cases and 1097 deaths [Reference Mishra4]. During the recent outbreak in 2015, more than 39 000 cases resulting in over 2500 deaths were recorded [Reference Cousins5]. Influenza activity differs in the northern and southern hemispheres. In temperate regions of both hemispheres, influenza activity peaks during the respective winter months. Influenza cases are generally reported during monsoon and post-monsoon seasons in the study area [Reference Chadha6]; however, the recent outbreak in 2015 occurred during the winter season.
The genome of the influenza A virus consists of eight segments of RNA, and the hemagglutinin (HA) gene encodes the HA1 and HA2 proteins. These proteins are responsible for binding of the virus to the host cell. The estimated mutation rate of the HA gene is 6·7 × 10−3 substitutions per site per year [Reference Lofgren7]. Since 2009, HAs from A(H1N1)pdm09 have gradually evolved, with changes in antigenic sites. Genetic characterization of the A(H1N1)pdm09 virus from different countries has revealed that the virus is divided in to eight clades, and viruses belonging to clade-7 and clade-6 dominated during the pandemic and post-pandemic periods, respectively [8]. Phylogenetic studies of the virus utilizing the HA fragment have shown that circulating strains in India belong to clades-1 [Reference Sharma9] 5, 6 and 7, and clade-7 predominated [Reference Potdar10] during the pandemic period. However, in 2014–2015, viruses belonging to clade-6B were reported [Reference Parida11, Reference Takashita12]. HA is also known to play a crucial role in viral pathogenesis, and amino acid K163Q [Reference Linderman13] and/or D222N/G substitutions [Reference Vazquez-Perez14, Reference Ruggiero15] have been linked with increased virulence. The emergence of virulent strains of same pandemic influenza virus is well known [Reference Mytton16]. The high mutation rate in HA led to the intra-host evolution and generation of quasi-species, which may be responsible for the increased severity [Reference Lauring and Andino17, Reference Resende18]. Position D222 in HA of this virus defines the receptor-binding specificity. A change in the amino acid at this position leads to a change in viral tropism by switching its affinity toward cells in the lower respiratory tract (with a sialic acid α 2, 3 linkage) than cells in the upper respiratory tract (with a sialic acid α 2, 6 linkage) [Reference Chutinimitkul19]. This shift in affinity is associated with a significant increase in the severity of the disease and fatality rate in the pandemic and post-pandemic influenza seasons [Reference Ruggiero15, Reference Resende18, Reference Goka20, Reference Melidou21].
The virology laboratory at the National Institute for Research in Tribal Health (NIRTH), Jabalpur, India is the premier laboratory providing diagnoses and conducting molecular characterizations of viruses circulating in central India. The NIRTH has been tasked with diagnosing influenza for the state of Madhya Pradesh (MP) since 2009. A high fatality rate (14%) among confirmed cases (more than double the national percentage) was reported in MP during the upsurge of 2015 [22]. This study evaluates the possible role of D222N/G/X mutations in the 2015 A(H1N1)pdm09 upsurge and attempts to understand its molecular and epidemiological trends.
METHODS
Study area
Geographically, MP is the second largest state in India and is located in the central part of the country (Fig. 1). According to the 2011 census, the state has a population of approximately 72 million, comprising 6% of the country's total population. In this region, the rainy season occurs from July to October, with an average annual rainfall of approximately 1300 mm, and the temperature decreases to 0 °C in some areas during the winter season (November to February) [23].
(A) Map of India highlighting the state of Madhya Pradesh. (B) Madhya Pradesh and its districts are shown in gray scale, according to the areas where the influenza A H1N1 pandemic was detected using real time RT-PCR. The most affected districts are marked using a gray scale and the occurrence of deaths is marked with dots. Coordinates of MP: 23°10′N 77°13′E/23·17°N 77·21°E/23·17; 77·21.

Samples and diagnosis
According to Ministry of Health and Family Welfare, Government of India guidelines, patients with an influenza-like illness (ILI) were classified into three main categories: patients with mild ILI symptoms, such as a mild fever along with cough/sore throat with or without body ache, headache, diarrhea and vomiting (category-A); patients with moderate ILI symptoms, including a high fever, and risk factors, such as old age (>60 years), chronic liver, and lung disorders, etc. (category-B); and patients with severe ILI symptoms who were admitted to the hospital due to breathlessness, chest pain, drowsiness, a decrease in blood pressure, or blood-stained sputum (category-C). Throat swabs or nasopharyngeal swabs from patients in category-C were referred for diagnosis by the clinician. Samples were transported in virus transport medium by properly maintaining the cold chain, according to the guidelines [24]. The period of this study was from January to May 2015, i.e. at the end of the winter season and beginning of the spring season. Influenza virus was detected using real-time RT–PCR (qRT–PCR) according to the WHO-recommended protocol developed by the Centers for Disease Control and Prevention (CDC) [25], and the results were typically reported within 24 h. Samples were stored at an ultra-low temperature (−70 °C) until further analysis.
Genetic characterization
The HA gene of the virus from 60 positive cases with a high viral RNA load (cycle threshold value <30) were subjected to amplification to identify the genetic lineage and characterize the molecular changes in circulating strains of A(H1N1)pdm09. The complete HA gene was sequenced in seven samples and the HA1 and HA2 regions were partially sequenced in 40 samples, corresponding to amino acid positions 89–396 (H1 numbering) [Reference Nobusawa26]. For amplification of the HA gene, the WHO-recommended sequencing protocol was performed using a high-fidelity one-step RT-PCR kit (Invitrogen, Carlsbad, California, USA; Cat. No. 12574-035) [27]. Thirteen samples were not sequenced satisfactorily.
We aimed to obtain sequences from approximately 10% of the non-surviving patients (n = 228) and compared them with an equal number of sequences from age- and sex-matched survivors to evaluate the role of mixed infections in clinical outcomes.
PCR products showing two peaks in sequencing data at base 715/716 were gel-purified and cloned using the TA cloning kit (pGEM®-T Easy Vector Systems, Promega, Madison, Wisconsin, USA; Cat No: A1360) according to the manufacturer's protocol to establish virus quasi-species. The obtained clones were subjected to colony PCR. Clones were also sequenced with the WHO A(H1N1)pdm09 sequencing protocol using Big Dye terminator (Cycle Sequencing Kit V 3.1, Cat No. 4337456, Applied Biosystems Ind., Foster City, California, USA) on ABI 3130 DNA analyzer (Applied Biosystems, California, USA).
Phylogenetic analysis
The dataset for the phylogenetic analysis was created with 47 HA sequences obtained in this study and the representative reference sequences (n = 32) from clade-1 to clade-7 that are available either at the National Center for Biotechnology Information (NCBI) (https://www.ncbi.nlm.nih.gov/genome/viruses/variation/flu/) or the Global Initiative on Sharing All Influenza Data (GISAID) (http://platform.gisaid.org) EpiFlu™ database. Fragments of the samples targeted for complete HA gene amplification were concatenated to obtain complete HA gene sequences. The generated dataset was assembled with the help of the ClustalW program within Molecular Evolutionary Genomic Analyzer (version 5.05) (MEGA) [Reference Kumar28] and translated into the respective amino acids to identify polymorphisms compared with the sequence of the vaccine-representative strain of the virus (A/California/07/2009). All sequences reported in this study were submitted to the NCBI database GenBank.
The Phylogeny tool of MEGA was used to generate the phylogenetic tree using the Neighbor-joining method (NJ) based on the p-distance model for the computation of evolutionary distances with 1000 bootstrap replicates. The phylogenetic tree was rooted with vaccine-representative sequence, which fell outside all clades and was used as the basis for comparison. Further grouping was confirmed by marking the reported clade-specific amino acid changes.
Statistical analysis
Demographic, clinical, and other supplementary information was primarily analyzed using a spreadsheet (MS Excel 2007, Microsoft, USA) and further statistical analyses were performed using SPSS 20 (IBM, USA). Different statistical tests were used to identify associations and to compare rates, ratios, and prevalences. The χ 2 test was used to assess gender-specific differences in A(H1N1)pdm09 positivity and deaths among different age groups. It was also used to study the linear associations of age with A(H1N1)pdm09 positivity and deaths. The Z-test was used to compare the positivity and fatality rates in two age groups. Odds ratio (OR) and risk ratio (RR) were also computed to compare the frequencies of different signs and symptoms among A(H1N1)pdm09-positive cases and suspected cases.
RESULTS AND DISCUSSION
Our study describes molecular and epidemiological aspects of A(H1N1)pdm09 in central India during an upsurge in 2015.
Epidemiological and clinical findings
Beginning in January 2015, an upsurge in ILI cases was noted in MP, India, with a peak between of February 13 to March 5. The case detection level started to decline afterwards, and no case was detected after the first week of May. Of the 3625 tested samples, 1607 (44·3%) patients were positive for A(H1N1)pdm09, of which 228 died. In contrast, only 17 sporadic A(H1N1)pdm09 cases were detected in 2014. Samples were referred from 37 districts of MP (Fig. 1), and A(H1N1)pdm09 positivity was recorded in samples from 34 districts. The maximum number of cases (1232/1607) and fatalities (n = 189) were recorded from the western region of MP. Major cities, i.e. Indore (102 deaths of 393 cases), Bhopal (43 deaths of 317 cases), Jabalpur (29 deaths of 220 cases), Ujjain (27 deaths of 123 cases), and Dewas (0 death of 176 cases), contributed approximately 76% of A(H1N1pdm09)-positive samples, possibly because of industrialization and their connectivity with other metropolitan cities in the country, leading to a considerable migrant population. The availability of specialty hospitals in these cities and referrals of patients from adjoining areas might have resulted in the increased incidence. Although samples were obtained from all age groups (ranging from an age of 1 month to 90 years), the mean ages for male and female patients were 34·3 (±21·8) and 36·1 (±19·1) years, respectively. The maximum number of samples (894) and a high percentage of positivity (51·7%) and large number of deaths (80) were recorded in the age group of 30–44 years. A greater number of A(H1N1)pdm09-positive cases (844/1844) and fatalities were observed among females, but the difference in fatality was not significant (χ 2 = 0·47, P = 0·493) (Table 1). The age distribution curve showed increasing positivity (χ 2 = 9·1; P = 0·003) and mortality (χ 2 = 28·5; P < 0·0001) with age. Notably, the fatality rate was significantly lower (1·8%, 4/221) among children (0–14 years) than in adolescent and adult patients (16·1%, 222/1373). These findings are consistent with previous studies [Reference Gurav29–Reference Falagas33], where children aged <14 years were least affected than patients in other age groups during the post-pandemic period. Infection rates are generally higher in children during the pandemic phase [Reference Gurav29,Reference Fowler30]. Therefore, they develop immunity and are protected during the post-pandemic period. However, in a study from northern MP, significantly lower positivity rates were reported (38%, P < 0·005), and the above-mentioned trend was not observed [Reference Parida11]. This difference in the findings from two investigations within the same state (MP) and the same time period highlights the need for region-specific monitoring of influenza at the community level.
Age distribution of tested, positive, and fatal cases of influenza A(H1N1)pdm09 in Madhya Pradesh, India

M, male; F, female.
a Ages of 36 cases, including 13 positive cases and two deaths, were missing from the clinical records.
Trend χ 2 for age = 9·1, with P = 0·003; trend χ 2 for deaths = 28·5, with P < 0·0001.
Since all samples were collected from patients with ILI, symptoms such as fever (90·3%), cough (96·0%), sore throat (81·8%), nasal catarrh (61·4%), difficulty in breathing, (74%) and bronchitis/pneumonia (36·7%) were commonly observed in suspected cases, whereas the percentage of these symptoms, including fever (92·6%), cough (97·1%), sore throat (81·8%), nasal catarrh (61·6%), difficulty in breathing (77·0%), and pneumonia (44%), increased in confirmed A(H1N1)pdm09 cases. No significant differences were observed in various symptoms between suspected and laboratory-confirmed A(H1N1)pdm09 cases; however, the frequency of pneumonia was significantly higher (8%) in the laboratory-confirmed cases (OR = 1·59; 95% CI 1·42–1·78, P < 0·0001). Pneumonia was reported to be a major cause of hospitalization and death in patients with A(H1N1)pdm09 [Reference Woo34], and we also noticed significantly higher occurrence of pneumonia among positive patients. Early clinical diagnosis and prompt treatment using an antiviral drug helps to salvage the patient [Reference Mata-Marin35]. Second, available vaccines can also be used to prevent infections, but vaccines are not widely used in India and are only recommended for health care workers and high-risk populations [Reference Murhekar and Mehendale2, Reference Koul and Bali36].
Genetic characterization
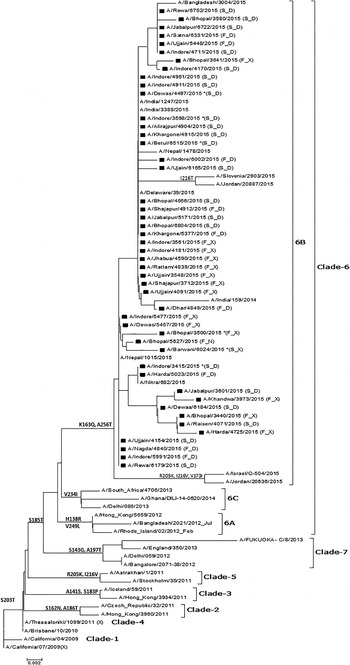
Of the 60 selected samples, 47 (24 from non-survivors and 23 from survivors) samples were successfully sequenced (GenBank Accession Nos. – KT241019 to KT241021; KT426698; KT369727 to KT369729; KT936477 to KT936493; and KT946852 to KT946867). The analysis of the sequence of the complete HA gene in seven samples revealed 98% identity and 21 changes at the amino acid level compared with the vaccine-representative sequence (Supplementary Table S1). Two changes were detected in the signal peptide region of HA (Y10H in KT241019, and A13T in KT241020, KT241021, KT369727, and KT369729). Fourteen changes (P83S, S84N, D97N, N125S, N129D, K283E, I295V, I321V, L365Q, I372V, E374K, S451N, E491G, and E499K) were identified when seven complete HA sequences were compared. Furthermore, four changes (K163Q, A256T, S185T, and S203T) were noted when dataset comprised of complete and partial sequences (amino acids 137–264) was examined. K163Q and A256T mutations are the characteristic markers of clade-6 subgroup 6B (Fig. 2).
Phylogenetic tree for the partial HA gene of influenza A(H1N1)pdm09. The region of HA used to construct the tree corresponds to bases 409–792. The tree topology and evolutionary distances were computed using the Neighbor-joining method and the p-distance method, respectively. The scale bar represents the evolutionary distance. Strains from this study are marked with a solid square (■). Strains representing a known genotype are indicated by a bracket on the right. GenBank Accession Nos. for seven complete and 40 partial sequences from the study are: KT241019 to KT241021; KT426698; KT369727 to KT369729; KT936477 to KT936493; and KT946852 to KT946867. *(F_D) – Fatal case with D at position 222 in HA; (F_X) – fatal case with a dual peak at position 222 in HA; (S_D) – surviving patient with D at position 222 in HA; (S_X) – surviving patient with a dual peak at position 222 in HA.
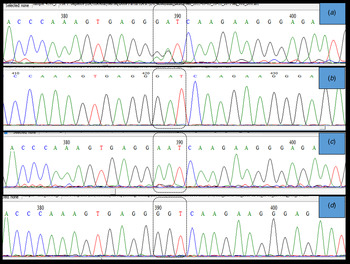
Importantly, two clear electropherogram peaks were observed at position 715 and/or 716 of the HA gene open reading frame (amino acid position 222) (Fig. 3a ). This codon encodes amino acid D (aspartic acid) in the A(H1N1)pdm09 A/California 04/2009 strain. Two electropherogram peaks, i.e. mixed bases at the nucleotide sequences coding for either GAT (aspartic acid), AAT (asparagine), or GGT (glycine), were detected in both forward and reverse sequences. However, when these samples were cloned to confirm the presence of a mixed infection, a single peak at position 715 and/or 716 of the HA gene was observed, which confirmed that these samples had a mixed population (quasi-species) of wild type and mutant viruses. Thus, based on the variations detected at amino acid 222, we identified at least three types of influenza virus infections. The first infection was from a wild type virus, i.e. D222, the second was from virus with a mutation, i.e. D222N, and the third was from a mixed population of both wild type and mutant viruses (Fig. 3).
Sanger sequencing electropherogram showing the sequence of the HA gene at nucleotides 715–717, i.e. amino acid 222 of the HA gene ORF (H1 numbering) labeled in the dotted block. (a) shows dual peaks at the first two bases when the sample was directly sequenced. (b) shows a single peak for the wild type sequence (D(GAT)), (c) shows a single peak (N(AAT)), and (d) shows single peak (G-(GGT)) at position 222 when PCR products from samples with two bases were cloned and sequenced. The peaks were confirmed in both sense and antisense templates of the particular sequence.
Of the 24 samples from non-surviving patients, one contained a D222N mutation (GenBank Accession No. KT946867), whereas mixed virus infections were observed in 14 samples (58·33%). In contrast, only one (4·3%) sample from the 23 surviving patients had a mixed infection. Patients with the mixed infection had a 13-fold greater risk of death (RR 13·4, 95% CI 9·1–93·9, P = 0. 009). As the passage of virus during isolation may lead to a change in the genome, clinical samples are preferred to viral isolates for the molecular analysis of the RNA viruses; but this method has an inherent limitation that all desired samples may not give a reportable-quality sequence. Thus, of the 60 selected samples, we could satisfactorily generate seven complete and 40 partial HA gene sequences.
A large number of polymorphism was observed in the currently circulating A(H1N1)pdm09 virus, with more than 20 changes in HA gene. The changes observed in this study are known to have clinical and epidemiological significance. The K163Q mutation that was detected in all sequences in this study is known to be associated with escape from neutralizing antibodies, particularly among middle-aged adults in the USA [Reference Linderman13]. Studies determining whether this drift has resulted in a re-infection with A(H1N1)pdm09 or infection despite prior vaccination will be interesting. The detection of two peaks at nucleotides 715 and/or 716 (amino acid D222) indicate an infection by a quasi-species, which has also been reported in previous studies [Reference Oliveira37] using pyrosequencing [Reference Selleri38] and next-generation sequencing results [Reference Vazquez-Perez14,Reference Kilander39] to confirm the findings from Sanger sequencing results. Sanger sequencing is a good indicator of mixed infections, if the site-specific mutations are known. However, we cloned the PCR products using TA cloning to confirm our findings, and since only one DNA fragment is cloned per plasmid, we detected single peak at nucleotides 715 and/or 716 (Fig. 3d ), indicating infection with a quasi-species virus. The quasi-species virus has not been reported in this region, and study findings indicate that this virus is undergoing evolution. Close monitoring of the virus in the near future will be important, as the mutation at D222 to either N or G has been reported to be associated with increased viremia, severe pneumonia, and increased disease severity due to acquired dual-receptor specificity [Reference Vazquez-Perez14, Reference Chutinimitkul19, Reference Kilander39].
Notably, we detected nine D, one N, and 14 mixed virus sequences at amino acid position 222 in fatal cases, whereas only one mixed infection was detected at this site in non-fatal cases. This finding underlines the importance of infection with a quasi-species virus and the associated clinical outcomes. In a recent study from the northern region of MP, Parida et al. [Reference Parida11] reported the detection of H275Y mutation in the neuraminidase gene responsible for antiviral resistance along with other changes, but no mutation was observed at amino acid D222. To the best of our knowledge, this report is the first to show the relation between severity and polymorphism during the 2015 upsurge.
The HA evolutionary tree of 47 HA sequences from this study, which was generated using the NJ method, showed that all sequences collected from different geographical areas over a period of 5 months clustered into clade-6B with strong bootstrap support and contained signature K163Q and A256T mutations.
In summary, based on the findings of this study, further in-depth research using virus isolation and molecular characterization of other genes is essential to obtain a better understanding of viral evolution and antiviral resistance. Studies based on treatment-seeking behaviors would help to identify the factors responsible for high mortality in addition to the virulence of the virus. Because this study was a laboratory-based study, it has limitations, such as the limited number of data points regarding the underlying clinical conditions and body mass indices of the patients. More than 95% of our samples were throat swabs and might have resulted in a lower number of D222N/G variants, as the mutant virus is generally detected in lung aspirates and deeper areas of the respiratory tract. Nonetheless, A(H1N1)pdm09 had an age-specific trend in positivity and severity in central India. According to the results of the molecular studies, the circulating virus belonged to clade-6B and infection with the quasi-species virus caused more severe disease outcomes than infection with a single type of virus. A year-round molecular surveillance program will help in designing better intervention strategies. We also suggest that strategies to create awareness, promote vaccination in the community, and encourage patients with ILI to visit health facilities should be implemented, as early diagnosis and prompt treatment can prevent further complications and reduce the disease burden and mortality.
SUPPLEMENTARY MATERIAL
The supplementary material for this article can be found at https://doi.org/10.1017/S0950268817001595.
ACKNOWLEDGEMENTS
The authors are grateful to the Directorate of Health Services, Govt. of Madhya Pradesh, India for providing mortality data. The authors thank the Influenza Group, National Institute of Virology, Pune for their support in providing reagents for diagnosis and Dr V. A. Potdar, NIV, Pune for her help in the sequence analysis. The assistance from Dr Kuldeep Sharma, Scientist-I, NIRTH, Jabalpur with the cloning experiments is also recognized. The authors thank Dr Varima Bokare for her assistance with editing and improving the manuscript. The assistance of Mr Bhagwati Sharan Sharma, Mrs Ruchi Pathak, Mr Ritesh Dwivedi, and Mr Neelesh Mehra in virus diagnosis is also acknowledged.
This work was supported by the Indian Council of Medical Research http://www.icmr.nic.in/ DHR, MoH&FW, Govt. of India under the project ‘Establishment of Virology Laboratory’ (Grant No. VIR/43/2011-ECD-I) and Directorate of Health Services Govt. of MP for the procurement of reagents kits, etc., for diagnosis. The funders had no role in the study design, data collection and analysis, preparation of the manuscript or decision to publish.
DECLARATION OF INTEREST
None.
ETHICAL STANDARDS
Authors assert that all procedures contributing to this work comply with the ethical standards of the Institute Ethical Committee and received clearance from this committee.


