


1. Introduction
The nature of dark matter remains mysterious, even though studies of galaxies and the Cosmic Microwave background radiation suggest it makes up 26% of the cosmic mass-energy density and 84% of the density of normal matter in the present-day Universe (Planck Collaboration et al. Reference Planck Collaboration2020). However, precise knowledge of its phase-space distribution, its self-interaction, and its coupling to normal matter is important for understanding the formation and subsequent evolution of galaxies.
Whilst macroscopic scenarios such as Primordial Black Holes (Niikura et al. Reference Niikura2019) or massive compact halo objects (Tisserand et al. Reference Tisserand2007) remain possible dark matter candidates, the available parameter space is small, and most modern experiments have focused on attempted detection of Weakly Interacting Massive Particles (WIMPs), which are cold, dissipationless non-standard particles (Jungman, Kamionkowski, & Griest Reference Jungman, Kamionkowski and Griest1996). However, attempts to detect WIMPs have also so far failed, resulting in renewed exploration of other dark matter particle candidates, particularly Light Dark Matter (LDM) (Bœhm, Fayet, & Silk Reference Bœhm, Fayet and Silk2004; Knapen, Lin, & Zurek Reference Knapen, Lin and Zurek2017) and axions (Peccei & Quinn Reference Peccei and Quinn1977; Khatiwada et al. Reference Khatiwada2021), though many other dark matter candidates have been suggested, including sterile neutrinos (Adhikari et al. Reference Adhikari2017), Kaluza-Klein particles (Servant & Tait Reference Servant and Tait2003), Strongly Interacting Massive Particles (SIMPs) (Hochberg et al. Reference Hochberg, Kuflik, Murayama, Volansky and Wacker2015), and Fuzzy Dark Matter (Hui et al. Reference Hui, Ostriker, Tremaine and Witten2017). For comprehensive reviews of the dark matter problem, particle candidates and detection schemes, see Bergström (Reference Bergström1998), Garrett & Dūda (Reference Garrett and Dūda2011) and Bertone & Hooper (Reference Bertone and Hooper2018).
Astronomical searches for the electromagnetic signature of dark matter through their decay or annihilation products (particularly WIMPs, LDM and axions) have been conducted at many wavelengths from $\gamma$
-rays to the radio regime, and over size scales from the magnetospheres of individual pulsars (a few 10’s of km) to the largest virialised structures in the Universe—clusters of galaxies.
$\gamma$
-rays to the radio regime, and over size scales from the magnetospheres of individual pulsars (a few 10’s of km) to the largest virialised structures in the Universe—clusters of galaxies.
Searches at the high energies (0.1–100 TeV) with the High Energy Stereoscopic System have been used to constrain the cross-section of self-annihilating WIMPS in the Galactic Centre and nearby dwarf galaxies (Abdallah et al. Reference Abdallah2018, Reference Abdallah2021). Such searches are sensitive to mono-energetic photon annihilation products arising from the $\chi\chi\rightarrow \gamma\gamma$
annihilation channel as well as to the
$\chi\chi\rightarrow \gamma\gamma$
annihilation channel as well as to the $\gamma$
-ray continuum resulting from a wide range of other
$\gamma$
-ray continuum resulting from a wide range of other $(W^+W^-$
,
$(W^+W^-$
, $Z^+Z^-$
,
$Z^+Z^-$
, $b\bar{b}$
,
$b\bar{b}$
, $t\bar{t}$
,
$t\bar{t}$
, $e^+e^-$
,
$e^+e^-$
, $\unicode{x03BC}^+\unicode{x03BC}^-$
and
$\unicode{x03BC}^+\unicode{x03BC}^-$
and $\tau^+\tau^-)$
annihilation channels available in Supersymmetric Standard Models (see Bergström, Ullio, & Buckley Reference Bergström, Ullio and Buckley1998). At lower energies (0.1–300 GeV), Fermi-LAT
$\tau^+\tau^-)$
annihilation channels available in Supersymmetric Standard Models (see Bergström, Ullio, & Buckley Reference Bergström, Ullio and Buckley1998). At lower energies (0.1–300 GeV), Fermi-LAT $\gamma$
-ray observations of the Galactic Centre, galaxies and clusters of galaxies have similarly been used to constrain the annihilation cross-section of lower-mass WIMPs (Bringmann & Weniger Reference Bringmann and Weniger2012; Ackermann et al. Reference Ackermann2015, Reference Ackermann2017; Thorpe-Morgan et al. Reference Thorpe-Morgan, Malyshev, Stegen, Santangelo and Jochum2021). For the Galactic Centre, annihilation cross-section upper limits in the range
$\gamma$
-ray observations of the Galactic Centre, galaxies and clusters of galaxies have similarly been used to constrain the annihilation cross-section of lower-mass WIMPs (Bringmann & Weniger Reference Bringmann and Weniger2012; Ackermann et al. Reference Ackermann2015, Reference Ackermann2017; Thorpe-Morgan et al. Reference Thorpe-Morgan, Malyshev, Stegen, Santangelo and Jochum2021). For the Galactic Centre, annihilation cross-section upper limits in the range $\langle\sigma v\rangle<10^{-26}$
to
$\langle\sigma v\rangle<10^{-26}$
to $10^{-25} \mathrm{cm}^3 \mathrm{s}^{-1}$
in the mass range
$10^{-25} \mathrm{cm}^3 \mathrm{s}^{-1}$
in the mass range $10\, \mathrm{GeV} < m_{\chi}c^2 < 50$
TeV are typical. The Cherenkov Telescope Array should improve on these limits in certain mass ranges (Silverwood et al. Reference Silverwood, Weniger, Scott and Bertone2015).
$10\, \mathrm{GeV} < m_{\chi}c^2 < 50$
TeV are typical. The Cherenkov Telescope Array should improve on these limits in certain mass ranges (Silverwood et al. Reference Silverwood, Weniger, Scott and Bertone2015).
Radio observations are also sensitive to WIMP GeV annihilation products due to the synchrotron radiation emitted by the acceleration of charged particles (e.g. protons, electrons and their anti-particles) in pre-existing magnetic fields (Borriello, Cuoco, & Miele Reference Borriello, Cuoco and Miele2009). Observations of nearby galaxies have resulted in similarly useful annihilation cross-section limits of around $\langle\sigma v\rangle<10^{-26}$
to
$\langle\sigma v\rangle<10^{-26}$
to $10^{-25} \mathrm{cm}^3 \mathrm{s}^{-1}$
in the mass range
$10^{-25} \mathrm{cm}^3 \mathrm{s}^{-1}$
in the mass range $1{-}1000\, \mathrm{GeV c}^{-2}$
(Regis, Richter, & Colafrancesco Reference Regis, Richter and Colafrancesco2017; Cook et al. Reference Cook2020; Basu et al. Reference Basu, Roy, Choudhuri, Datta and Sarkar2021), though with a dependence on other parameters such as magnetic field strength, diffusion coefficients and equipartition (Colafrancesco, Profumo, & Ullio Reference Colafrancesco, Profumo and Ullio2006). Future radio observations, including with the Square Kilometre Array, are expected to substantially improve on these limits (Storm et al. Reference Storm, Jeltema, Splettstoesser and Profumo2017; Chen, Sming Tsai, & Yuan Reference Chen, Sming Tsai and Yuan2021b).
$1{-}1000\, \mathrm{GeV c}^{-2}$
(Regis, Richter, & Colafrancesco Reference Regis, Richter and Colafrancesco2017; Cook et al. Reference Cook2020; Basu et al. Reference Basu, Roy, Choudhuri, Datta and Sarkar2021), though with a dependence on other parameters such as magnetic field strength, diffusion coefficients and equipartition (Colafrancesco, Profumo, & Ullio Reference Colafrancesco, Profumo and Ullio2006). Future radio observations, including with the Square Kilometre Array, are expected to substantially improve on these limits (Storm et al. Reference Storm, Jeltema, Splettstoesser and Profumo2017; Chen, Sming Tsai, & Yuan Reference Chen, Sming Tsai and Yuan2021b).
Self-annihilating LDM particles in the $1{-}1000 \mathrm{MeV\, c}^{-2}$
mass range can produce lower-energy
$1{-}1000 \mathrm{MeV\, c}^{-2}$
mass range can produce lower-energy $\gamma$
-rays, including from the
$\gamma$
-rays, including from the $e^+e^-$
annihilation line at 511 keV. Although this line is strongly detected in the Galactic Centre (Johnson & Haymes 1973; Leventhal, MacCallum, & Stang Reference Leventhal, MacCallum and Stang1978; Siegert et al. Reference Siegert2016a), its origin is unclear as other
$e^+e^-$
annihilation line at 511 keV. Although this line is strongly detected in the Galactic Centre (Johnson & Haymes 1973; Leventhal, MacCallum, & Stang Reference Leventhal, MacCallum and Stang1978; Siegert et al. Reference Siegert2016a), its origin is unclear as other $e^+$
production channels exist, including pair production around pulsars (Jones Reference Jones1979) and
$e^+$
production channels exist, including pair production around pulsars (Jones Reference Jones1979) and $\beta^+$
decay in supernovae (Crocker et al. Reference Crocker2017; Siegert et al. Reference Siegert2022b). Observations of nearby galaxies have not yet revealed any significant 511 keV detections, but have nevertheless resulted in excellent cross-section limits, especially for low mass LDM particles. For example, for
$\beta^+$
decay in supernovae (Crocker et al. Reference Crocker2017; Siegert et al. Reference Siegert2022b). Observations of nearby galaxies have not yet revealed any significant 511 keV detections, but have nevertheless resulted in excellent cross-section limits, especially for low mass LDM particles. For example, for $m_{\chi}\sim 1 \mathrm{MeV\, c}^{-2}$
, Siegert et al. (Reference Siegert2022a) deduce a limit of
$m_{\chi}\sim 1 \mathrm{MeV\, c}^{-2}$
, Siegert et al. (Reference Siegert2022a) deduce a limit of $\langle\sigma v\rangle< 5\times 10^{-28} \mathrm{cm}^3 \mathrm{s}^{-1}$
for the dwarf galaxy Reticulum II (Ret II).
$\langle\sigma v\rangle< 5\times 10^{-28} \mathrm{cm}^3 \mathrm{s}^{-1}$
for the dwarf galaxy Reticulum II (Ret II).
Axions, if they exist, are likely to have a mass in the range $1{-}1000\, \unicode{x03BC} \mathrm{eV c}^{-2}$
which puts their energy range firmly in the radio regime. Via the Primakoff effect (Kelley & Quinn Reference Kelley and Quinn2017; Millar et al. Reference Millar, Baum, Lawson and Marsh2021), axions can convert into a photon in a strong magnetic field. Recent observations, including those of the magnetar PSR J1745-2900 by Darling (Reference Darling2020), have found no narrow spectral features which could be attributed to axion conversion. Laboratory measurements (Khatiwada et al. Reference Khatiwada2021) and further radio observations with sensitive telescopes at radio-quiet sites (Wang, Bi, & Yin Reference Wang, Bi and Yin2021) are likely to make major improvements in sensitivity and mass range in the near future.
$1{-}1000\, \unicode{x03BC} \mathrm{eV c}^{-2}$
which puts their energy range firmly in the radio regime. Via the Primakoff effect (Kelley & Quinn Reference Kelley and Quinn2017; Millar et al. Reference Millar, Baum, Lawson and Marsh2021), axions can convert into a photon in a strong magnetic field. Recent observations, including those of the magnetar PSR J1745-2900 by Darling (Reference Darling2020), have found no narrow spectral features which could be attributed to axion conversion. Laboratory measurements (Khatiwada et al. Reference Khatiwada2021) and further radio observations with sensitive telescopes at radio-quiet sites (Wang, Bi, & Yin Reference Wang, Bi and Yin2021) are likely to make major improvements in sensitivity and mass range in the near future.
The most likely places to observe electromagnetic signatures of dark matter are in dense dark matter cores, which are predicted to occur in the nuclei of galaxies, and should have size scales in the range 0.1 to 5 kpc (Lazar et al. 2020). Thus searches have concentrated on objects such as the Galactic Centre (Siegert et al. Reference Siegert2016a; Reynolds et al. Reference Reynolds2017), the Large Magellanic Cloud (LMC; Siffert et al. 2011) and nearby dwarf galaxies (Siegert et al. Reference Siegert2016b, Reference Siegert2022a; Albert et al. Reference Albert2017; Cook et al. Reference Cook2020; Abdallah et al. Reference Abdallah2021). The dwarf galaxies have the advantage of being more dark matter-dominated, with fewer sources of strong emission which arise from particle acceleration from other astrophysical processes such as star formation, supernovae and massive black holes. For example, the strong detection of the 511 keV annihilation line in the Milky Way may have a nucleosynthetic origin, rather than a dark matter origin (Siegert et al. Reference Siegert2022b). However, a disadvantage is that their distances (typically 20–500 kpc) are mostly larger than for the Milky Way or LMC, leading to weaker signal strength predictions.
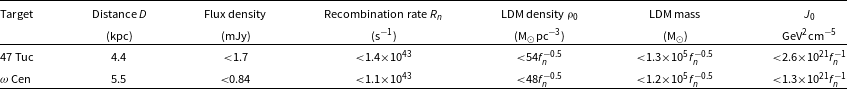
Another avenue are the much closer giant globular clusters 47 Tucanae (47 Tuc) and Omega Centauri $(\omega$
Cen), also known as NGC 5139. These objects have distances of 4.4 and 5.5 kpc, respectively (Chen et al. Reference Chen, Richer, Caiazzo and Heyl2018; Del Principe et al. Reference Del Principe2006) and may be the nucleated remnants of ancient tidally-stripped dwarf galaxies (Peebles Reference Peebles1984; Norris et al. Reference Norris, Freeman and Mighell1996; Hilker & Richtler Reference Hilker and Richtler2000; Bekki & Norris Reference Bekki and Norris2006; Lee et al. Reference Lee, Kang, Lee and Lee2009; McKenzie & Bekki Reference McKenzie and Bekki2021) and therefore in possible possession of a dark matter core. Various authors have suggested the role that dark matter may play in explaining their velocity dispersion profiles (e.g. Peñarrubia et al. Reference Peñarrubia, Varri, Breen, Ferguson and Sánchez-Janssen2017). Evans, Strigari, & Zivick (Reference Evans, Strigari and Zivick2022) have used GAIA, HST and spectroscopic data to infer strong evidence for a non-luminous component in
$(\omega$
Cen), also known as NGC 5139. These objects have distances of 4.4 and 5.5 kpc, respectively (Chen et al. Reference Chen, Richer, Caiazzo and Heyl2018; Del Principe et al. Reference Del Principe2006) and may be the nucleated remnants of ancient tidally-stripped dwarf galaxies (Peebles Reference Peebles1984; Norris et al. Reference Norris, Freeman and Mighell1996; Hilker & Richtler Reference Hilker and Richtler2000; Bekki & Norris Reference Bekki and Norris2006; Lee et al. Reference Lee, Kang, Lee and Lee2009; McKenzie & Bekki Reference McKenzie and Bekki2021) and therefore in possible possession of a dark matter core. Various authors have suggested the role that dark matter may play in explaining their velocity dispersion profiles (e.g. Peñarrubia et al. Reference Peñarrubia, Varri, Breen, Ferguson and Sánchez-Janssen2017). Evans, Strigari, & Zivick (Reference Evans, Strigari and Zivick2022) have used GAIA, HST and spectroscopic data to infer strong evidence for a non-luminous component in $\omega$
Cen, with a mass contained within the half-light radius of up to
$\omega$
Cen, with a mass contained within the half-light radius of up to $10^6\, \mathrm{M}_{\odot}$
. No 511 keV radiation has been detected from these clusters (Knödlseder et al. Reference Knödlseder2005), though observations with Fermi-LAT have detected strong
$10^6\, \mathrm{M}_{\odot}$
. No 511 keV radiation has been detected from these clusters (Knödlseder et al. Reference Knödlseder2005), though observations with Fermi-LAT have detected strong $\gamma$
-ray continuum (Abdo et al. Reference Abdo2010). Due to the poor angular resolution of
$\gamma$
-ray continuum (Abdo et al. Reference Abdo2010). Due to the poor angular resolution of $\gamma$
-ray telescopes, the source of the emission is not clear—it is consistent with models of the annihilation of massive dark matter particles (Gaskins Reference Gaskins2016; Brown et al. Reference Brown2019; Wirth, Bekki, & Hayashi Reference Wirth, Bekki and Hayashi2020), but could also arise from a population of old millisecond pulsars which is known to exist in these clusters (Abdo et al. Reference Abdo2010; Reynoso-Cordova et al. Reference Reynoso-Cordova2019). There are 25 known millisecond pulsars in 47 Tuc (Freire et al. Reference Freire2017) and 5 in
$\gamma$
-ray telescopes, the source of the emission is not clear—it is consistent with models of the annihilation of massive dark matter particles (Gaskins Reference Gaskins2016; Brown et al. Reference Brown2019; Wirth, Bekki, & Hayashi Reference Wirth, Bekki and Hayashi2020), but could also arise from a population of old millisecond pulsars which is known to exist in these clusters (Abdo et al. Reference Abdo2010; Reynoso-Cordova et al. Reference Reynoso-Cordova2019). There are 25 known millisecond pulsars in 47 Tuc (Freire et al. Reference Freire2017) and 5 in $\omega$
Cen (Dai et al. Reference Dai2020), plus a number of unidentified X-ray sources with similar properties to millisecond pulsars (Bhattacharya et al. Reference Bhattacharya2017; Henleywillis et al. Reference Henleywillis2018).
$\omega$
Cen (Dai et al. Reference Dai2020), plus a number of unidentified X-ray sources with similar properties to millisecond pulsars (Bhattacharya et al. Reference Bhattacharya2017; Henleywillis et al. Reference Henleywillis2018).
Wirth et al. (Reference Wirth, Bekki and Hayashi2020) used high-resolution computer simulations to model the evolution of nucleated dwarf galaxies near the Milky Way and found that they can transform into globular clusters similar to $\omega$
Cen. Their simulated nuclei were found to have central dark matter densities of 0.1 to several
$\omega$
Cen. Their simulated nuclei were found to have central dark matter densities of 0.1 to several $\mathrm{M}_{\odot} \mathrm{pc}^{-3}$
. Wirth et al. (Reference Wirth, Bekki and Hayashi2020) were able to match the predicted
$\mathrm{M}_{\odot} \mathrm{pc}^{-3}$
. Wirth et al. (Reference Wirth, Bekki and Hayashi2020) were able to match the predicted $\gamma$
-ray spectrum (assuming dark matter annihilation via the
$\gamma$
-ray spectrum (assuming dark matter annihilation via the $b\bar{b}$
channel) of one of their simulated clusters with that observed by Fermi-LAT for
$b\bar{b}$
channel) of one of their simulated clusters with that observed by Fermi-LAT for $\omega$
Cen using an annihilation cross-section
$\omega$
Cen using an annihilation cross-section $\langle\sigma v\rangle = 5 \times 10^{-28} \mathrm{cm}^3 \mathrm{s}^{-1}$
.
$\langle\sigma v\rangle = 5 \times 10^{-28} \mathrm{cm}^3 \mathrm{s}^{-1}$
.
Whether or not the $\gamma$
-ray detections of 47 Tuc and
$\gamma$
-ray detections of 47 Tuc and $\omega$
Cen represent the signature of dark matter annihilation, they at least give an upper limit to the dark matter annihilation rate, under the assumption that their cores really do contain dark matter. This applies to scenarios of WIMP annihilation, as explored by Wirth et al. (Reference Wirth, Bekki and Hayashi2020), as well as annihilation of LDM and other candidate dark matter particles.
$\omega$
Cen represent the signature of dark matter annihilation, they at least give an upper limit to the dark matter annihilation rate, under the assumption that their cores really do contain dark matter. This applies to scenarios of WIMP annihilation, as explored by Wirth et al. (Reference Wirth, Bekki and Hayashi2020), as well as annihilation of LDM and other candidate dark matter particles.
In this paper, we introduce a search for signatures of $e^+e^-$
pair production resulting from the annihilation of LDM particles in these globular clusters by using observations of positronium (Ps) radio recombination lines. Radio observations have the advantage of potentially much higher angular resolution than
$e^+e^-$
pair production resulting from the annihilation of LDM particles in these globular clusters by using observations of positronium (Ps) radio recombination lines. Radio observations have the advantage of potentially much higher angular resolution than $\gamma$
-ray observations, and therefore the potential to discriminate between different astrophysical origins. Furthermore, spectral-line observations also have the potential to reduce confusion with diffuse and/or compact sources of emission in the foreground and background.
$\gamma$
-ray observations, and therefore the potential to discriminate between different astrophysical origins. Furthermore, spectral-line observations also have the potential to reduce confusion with diffuse and/or compact sources of emission in the foreground and background.
The existence of copious amounts of Ps atoms is undisputed in the centre and plane of the Milky Way. As already mentioned, the $\gamma$
-ray annihilation line at 511 keV is strongly detected and has been known for many decades, with detailed inspection of the continuum (Siegert et al. Reference Siegert2016a) suggesting that the line mostly arises from Ps annihilation, rather than direct
$\gamma$
-ray annihilation line at 511 keV is strongly detected and has been known for many decades, with detailed inspection of the continuum (Siegert et al. Reference Siegert2016a) suggesting that the line mostly arises from Ps annihilation, rather than direct $e^+e^-$
annihilation. Corresponding radio searches for Ps recombination lines towards the Galactic Centre have been conducted by Anantharamaiah et al. (Reference Anantharamaiah1989) and Reynolds et al. (Reference Reynolds2017). The search by Reynolds et al. (Reference Reynolds2017) was more sensitive to the diffuse emission expected from dark matter annihilation and stellar populations. They established a 3-
$e^+e^-$
annihilation. Corresponding radio searches for Ps recombination lines towards the Galactic Centre have been conducted by Anantharamaiah et al. (Reference Anantharamaiah1989) and Reynolds et al. (Reference Reynolds2017). The search by Reynolds et al. (Reference Reynolds2017) was more sensitive to the diffuse emission expected from dark matter annihilation and stellar populations. They established a 3- $\sigma$
upper limit to the brightness temperature of any Ps recombination line emission of
$\sigma$
upper limit to the brightness temperature of any Ps recombination line emission of $T_B < 0.09\ \mathrm{K}$
. Due to the strong synchrotron continuum background and factors discussed later, this limit is still well above the rate measured by
$T_B < 0.09\ \mathrm{K}$
. Due to the strong synchrotron continuum background and factors discussed later, this limit is still well above the rate measured by $\gamma$
-ray observations of
$\gamma$
-ray observations of $2 \times 10^{43} \mathrm{s}^{-1}$
(Siegert et al. Reference Siegert2016a).
$2 \times 10^{43} \mathrm{s}^{-1}$
(Siegert et al. Reference Siegert2016a).
In this paper, Section 2 summarises the expected characteristics of Ps recombination lines in the astrophysical context; Section 3 describes the details of the new globular cluster observations and the instrument details; Section 4 describes the data analysis, calibration, stacking methodology and results; Section 5 discusses the results and their implications for the LDM self-annihilating dark matter content of the clusters; and Section 6 provides a summary and a few comments about future research directions.
2. Positronium (Ps) recombination
Ps atoms, which consist of an electron $(e^-)$
and a positron
$(e^-)$
and a positron $(e^+)$
, can be formed from an
$(e^+)$
, can be formed from an $e^-/e^+/$
hydrogen (H) plasma once energy losses in the interstellar medium have reduced the gas temperature to
$e^-/e^+/$
hydrogen (H) plasma once energy losses in the interstellar medium have reduced the gas temperature to $T_k < 10^6\ \mathrm{K}$
(Burdyuzha & Kauts Reference Burdyuzha and Kauts1994). At these temperatures, Ps can form from recombination of electrons and positrons, or by charge exchange of positrons with H and other atoms and molecules with the relative formation rates being extremely sensitive to temperature and density (Bussard, Ramaty, & Drachman Reference Bussard, Ramaty and Drachman1979). Below
$T_k < 10^6\ \mathrm{K}$
(Burdyuzha & Kauts Reference Burdyuzha and Kauts1994). At these temperatures, Ps can form from recombination of electrons and positrons, or by charge exchange of positrons with H and other atoms and molecules with the relative formation rates being extremely sensitive to temperature and density (Bussard, Ramaty, & Drachman Reference Bussard, Ramaty and Drachman1979). Below $10^4\ \mathrm{K}$
, radiative recombination becomes dominant, leading to the greater possibility of the formation of Ps atoms in excited states (Wallyn et al. Reference Wallyn, Mahoney, Durouchoux and Chapuis1996). The key ingredient for this paper is that once Ps atoms are formed in an excited electronic state, energy loss will proceed by a cascade of emission of hydrogenic-like recombination lines, followed by rapid annihilation near the ground state.
$10^4\ \mathrm{K}$
, radiative recombination becomes dominant, leading to the greater possibility of the formation of Ps atoms in excited states (Wallyn et al. Reference Wallyn, Mahoney, Durouchoux and Chapuis1996). The key ingredient for this paper is that once Ps atoms are formed in an excited electronic state, energy loss will proceed by a cascade of emission of hydrogenic-like recombination lines, followed by rapid annihilation near the ground state.
Ps annihilation is very rapid, with a timescale of $1.25\times10^{-10} n^3$
s for para-Ps and
$1.25\times10^{-10} n^3$
s for para-Ps and $1.33\times 10^{-7} n^3$
s for ortho-Ps (Burdyuzha, Kauts, & Wallyn Reference Burdyuzha, Kauts and Wallyn1996), where n is the principal quantum number. Selection rules only allow for annihilation in angular momentum
$1.33\times 10^{-7} n^3$
s for ortho-Ps (Burdyuzha, Kauts, & Wallyn Reference Burdyuzha, Kauts and Wallyn1996), where n is the principal quantum number. Selection rules only allow for annihilation in angular momentum $\ell=0$
states, which will depopulate low-n energy levels, especially for the shorter-life para-Ps species, but will not depopulate higher levels, each of which also has n angular momentum states
$\ell=0$
states, which will depopulate low-n energy levels, especially for the shorter-life para-Ps species, but will not depopulate higher levels, each of which also has n angular momentum states $\ell=0,1,...,n-1$
.
$\ell=0,1,...,n-1$
.
As laboratory measurements have shown (Canter, Mills, & Berko Reference Canter, Mills and Berko1975), the Ps recombination spectrum is analogous to the hydrogen spectrum in Galactic HII regions, which is dominated by $\mathrm{Ly}\alpha$
at ultraviolet wavelengths,
$\mathrm{Ly}\alpha$
at ultraviolet wavelengths, $\mathrm{H}\alpha$
and
$\mathrm{H}\alpha$
and $\mathrm{H}\beta$
in the optical and high-order recombination lines at radio wavelengths. Ps line intensities are similar to those of hydrogen (Wallyn et al. Reference Wallyn, Mahoney, Durouchoux and Chapuis1996).
$\mathrm{H}\beta$
in the optical and high-order recombination lines at radio wavelengths. Ps line intensities are similar to those of hydrogen (Wallyn et al. Reference Wallyn, Mahoney, Durouchoux and Chapuis1996).
The general Rydberg formula for the rest frequency of recombination lines from hydrogenic-like atoms is:
 \begin{equation}\nu = \mathrm{c}RZ^2\left(\frac{1}{n_1^2}-\frac{1}{n_2^2}\right) ,\end{equation}
where c is the velocity of light, R is the Rydberg constant, Z is the atomic charge, $n_1$
is the principal quantum number of the lower energy level, and
$n_1$
is the principal quantum number of the lower energy level, and $n_2$
is the principal quantum number of the upper energy level.
$n_2$
is the principal quantum number of the upper energy level.
The nomenclature for Ps recombination lines follows standard practice for electronic radio frequency transitions (Lilley & Palmer Reference Lilley and Palmer1968), where a line is labelled by the chemical element followed by the principal quantum number of the lower energy level of the transition. The change in level $\Delta n=n_2-n_1=1,2,$
… is denoted by Greek letters
$\Delta n=n_2-n_1=1,2,$
… is denoted by Greek letters $\alpha$
,
$\alpha$
, $\beta$
,…, so that
$\beta$
,…, so that $\mathrm{Ps}93\alpha$
represents a transition from principle electronic quantum number
$\mathrm{Ps}93\alpha$
represents a transition from principle electronic quantum number $n_2=94$
to
$n_2=94$
to $n_1=93$
. Missing Greek letters are usually taken to imply
$n_1=93$
. Missing Greek letters are usually taken to imply $\Delta n =1$
.
$\Delta n =1$
.
The Rydberg constant for Ps is $R_{Ps} = m_e e^4/(16\epsilon_0^2 h^3 c) = 5.48686578 \times 10^6 \mathrm{m}^{-1}$
, where
$R_{Ps} = m_e e^4/(16\epsilon_0^2 h^3 c) = 5.48686578 \times 10^6 \mathrm{m}^{-1}$
, where $m_e$
and e are the electronic mass and charge respectively,
$m_e$
and e are the electronic mass and charge respectively, $\epsilon_0$
is the permittivity of free space and h is the Planck constant. Thus
$\epsilon_0$
is the permittivity of free space and h is the Planck constant. Thus $R_{Ps}$
is approximately half the value of
$R_{Ps}$
is approximately half the value of $R_H$
, corresponding to the ratio of the respective reduced masses of Ps and H. Therefore Ps recombination lines for a given level will have approximately half the frequency (and half the transition probability) of the corresponding H lines. As an example, the rest frequency of
$R_H$
, corresponding to the ratio of the respective reduced masses of Ps and H. Therefore Ps recombination lines for a given level will have approximately half the frequency (and half the transition probability) of the corresponding H lines. As an example, the rest frequency of $\mathrm{Ps}93\alpha$
is 4024.99 MHz.
$\mathrm{Ps}93\alpha$
is 4024.99 MHz.
Line shapes and widths in the astrophysical context depend on numerous parameters such as temperature, velocity dispersion, pressure, transition probability, and optical depth. For hydrogen radio recombination lines in the warm, diffuse interstellar medium, Gaussian broadening by a combination of temperature and velocity dispersion are usually dominant. However, being a light atom, Ps lines are expected to be dominated by thermal broadening. The usual formula for line-of-sight non-relativistic thermal broadening in frequency is:
 \begin{equation}\Delta \nu = \nu \sqrt{\frac{2\mathrm{k}T}{m \mathrm{c}^2}} ,\end{equation}
where $\nu$
is the line frequency, k is the Bolzmann constant, T is temperature and m is the mass of the chemical species. The thermal linewidths of Ps lines are therefore expected to be
$\nu$
is the line frequency, k is the Bolzmann constant, T is temperature and m is the mass of the chemical species. The thermal linewidths of Ps lines are therefore expected to be $\sqrt{m_H/2m_e} \approx 30.3$
times broader than those of hydrogen lines. For an electron temperature
$\sqrt{m_H/2m_e} \approx 30.3$
times broader than those of hydrogen lines. For an electron temperature $T_e = 5\times 10^3\ \mathrm{K}$
, the expected Ps frequency dispersion is
$T_e = 5\times 10^3\ \mathrm{K}$
, the expected Ps frequency dispersion is $\Delta \nu = 3.69$
MHz for a
$\Delta \nu = 3.69$
MHz for a $\mathrm{Ps}93\alpha$
line at rest, or a FWHP linewidth of 8.69 MHz. The corresponding thermal velocity dispersion is
$\mathrm{Ps}93\alpha$
line at rest, or a FWHP linewidth of 8.69 MHz. The corresponding thermal velocity dispersion is $\sigma_v = 275\, \mathrm{km\, s}^{-1}$
.
$\sigma_v = 275\, \mathrm{km\, s}^{-1}$
.
The recombination line brightness spectrum is normally a function of optical depth, radiation field, density, volume, temperature (including the effect of any spatial variations within the beam) and thermodynamic equilibrium (Peters, Longmore, & Dullemond Reference Peters, Longmore and Dullemond2012). For radio recombination lines (large n), the spontaneous emission rate $A_{n+1,n}$
, is less than the typical collision frequency
$A_{n+1,n}$
, is less than the typical collision frequency $C_n$
in the diffuse ISM. For example,
$C_n$
in the diffuse ISM. For example, $A_{94,93}(\mathrm{Ps93}\alpha)\approx 0.4 \mathrm{s}^{-1}$
, and the corresponding
$A_{94,93}(\mathrm{Ps93}\alpha)\approx 0.4 \mathrm{s}^{-1}$
, and the corresponding $\Delta n=1$
cascade time is
$\Delta n=1$
cascade time is $\Sigma_{n=1}^{93} A^{-1}_{n+1,n} \approx 40$
s. This compares to Ps collision frequency of
$\Sigma_{n=1}^{93} A^{-1}_{n+1,n} \approx 40$
s. This compares to Ps collision frequency of ${\sim}10^{-8} n^4 \mathrm{s}^{-1}$
at a temperature of
${\sim}10^{-8} n^4 \mathrm{s}^{-1}$
at a temperature of $5\times 10^3\ \mathrm{K}$
and density of
$5\times 10^3\ \mathrm{K}$
and density of $1 \mathrm{cm}^{-3}$
(with substantially lower densities expected for an LDM
$1 \mathrm{cm}^{-3}$
(with substantially lower densities expected for an LDM $e^+e^-$
plasma). So line emission cannot be maintained by low-n Ps collisions in the low-density ISM as is the case for the
$e^+e^-$
plasma). So line emission cannot be maintained by low-n Ps collisions in the low-density ISM as is the case for the $\lambda$
21-cm line.
$\lambda$
21-cm line.
An example 300-s Stokes I total power spectrum taken toward 47 Tuc on 2020 October 22 at UT 13:54. The spectrum is smoothed in frequency by 32 channels to a resolution of 125 kHz and shows the locations of major RFI signals. The off-scale maximum RFI signal is $2.5\times10^6$
Jy at 762 MHz. The low-level structure in the spectrum in the regions free from RFI reflects the bandpass responses of the individual 128-MHz sub-bands.
$2.5\times10^6$
Jy at 762 MHz. The low-level structure in the spectrum in the regions free from RFI reflects the bandpass responses of the individual 128-MHz sub-bands.

Line emission could arise from stimulated emission and absorption. In fact, this is the normal situation for radio recombination lines (Gordon & Sorochenko Reference Gordon and Sorochenko2002). However, such emission relies on the region being illuminated by continuum radiation. This can arise from synchrotron emission or thermal free-free emission at the frequencies considered here. But, given the low densities expected and the fact there is no evidence for strong diffuse radio continuum emission in 47 Tuc and $\omega$
Cen, this is unlikely to be the case here.
$\omega$
Cen, this is unlikely to be the case here.
As previously noted (Anantharamaiah et al. Reference Anantharamaiah1989, Reference Anantharamaiah, Dwarakanath, Morris, Goss and Radhakrishnan1993; Reynolds et al. Reference Reynolds2017), the main emission source is therefore likely to be the radiative recombination cascade that immediately follows the formation of a Ps atom. The intensity spectrum will reflect the distribution of energy levels following Ps formation, which depends sensitively on temperature. Burdyuzha et al. (Reference Burdyuzha, Kauts and Wallyn1996) cite $P(n)\propto n^{\alpha}$
with
$P(n)\propto n^{\alpha}$
with $\alpha=-1$
at low temperature and
$\alpha=-1$
at low temperature and $\alpha=-3$
at extremely high temperatures, with the detailed calculation of Wallyn et al. (Reference Wallyn, Mahoney, Durouchoux and Chapuis1996) suggesting
$\alpha=-3$
at extremely high temperatures, with the detailed calculation of Wallyn et al. (Reference Wallyn, Mahoney, Durouchoux and Chapuis1996) suggesting $\alpha\approx -2$
at 5000 K (very different from the Saha collisional index
$\alpha\approx -2$
at 5000 K (very different from the Saha collisional index $\alpha=2$
). Recombination will then proceed via the more probable
$\alpha=2$
). Recombination will then proceed via the more probable $\Delta n=1$
transitions, so that every large n state will give rise to
$\Delta n=1$
transitions, so that every large n state will give rise to $\Delta n=1$
transitions at most lower energy levels. A reasonable approximation, and an upper limit to the
$\Delta n=1$
transitions at most lower energy levels. A reasonable approximation, and an upper limit to the $\Delta n=1$
photon emission spectrum is therefore
$\Delta n=1$
photon emission spectrum is therefore $I_{\gamma}(n)\propto n^{\alpha+1}$
, rather than the
$I_{\gamma}(n)\propto n^{\alpha+1}$
, rather than the $n^0$
spectrum assumed previously (Anantharamaiah et al. Reference Anantharamaiah1989, Reference Anantharamaiah, Dwarakanath, Morris, Goss and Radhakrishnan1993; Reynolds et al. Reference Reynolds2017).Footnote a For
$n^0$
spectrum assumed previously (Anantharamaiah et al. Reference Anantharamaiah1989, Reference Anantharamaiah, Dwarakanath, Morris, Goss and Radhakrishnan1993; Reynolds et al. Reference Reynolds2017).Footnote a For $T=5000\ \mathrm{K}$
and
$T=5000\ \mathrm{K}$
and $\alpha=-2$
, the
$\alpha=-2$
, the $\Delta n=1$
photon spectrum will be approximated by
$\Delta n=1$
photon spectrum will be approximated by $I_{\gamma}(n)\propto n^{-1}$
, corresponding to a flux spectrum
$I_{\gamma}(n)\propto n^{-1}$
, corresponding to a flux spectrum $I_{\nu}(n)\propto \nu^{4/3}$
(from Equation (1)) and a peak flux density spectrum
$I_{\nu}(n)\propto \nu^{4/3}$
(from Equation (1)) and a peak flux density spectrum $S_{\nu}\propto \nu^{1/3}$
(from Equation (2)).
$S_{\nu}\propto \nu^{1/3}$
(from Equation (2)).
In addition to uncertainties in $\alpha$
, there are a number of other factors which may affect Ps recombination line intensities:
$\alpha$
, there are a number of other factors which may affect Ps recombination line intensities:
-
1. Direct annihilation: detailed inspection of the Ps $\gamma$
-ray annihilation spectrum of the Galactic Centre suggests that virtually all
$e^+$
annihilation is via the Ps atomic state, rather than direct annihilation (Siegert et al. Reference Siegert2016a). Nevertheless, at temperatures above 20000 K, the latter is important (Wallyn et al. Reference Wallyn, Mahoney, Durouchoux and Chapuis1996).
$\gamma$
-ray annihilation spectrum of the Galactic Centre suggests that virtually all
$e^+$
annihilation is via the Ps atomic state, rather than direct annihilation (Siegert et al. Reference Siegert2016a). Nevertheless, at temperatures above 20000 K, the latter is important (Wallyn et al. Reference Wallyn, Mahoney, Durouchoux and Chapuis1996). -
2. Charge exchange: if H or He atoms are present, formation of Ps by charge exchange (Guessoum, Jean, & Gillard Reference Guessoum, Jean and Gillard2005) will reduce the recombination line intensities, as the Ps atoms will be preferentially created in low-n states (Wallyn et al. Reference Wallyn, Mahoney, Durouchoux and Chapuis1996). This is again likely to be an important factor only at higher temperatures
$({>}5000\ \mathrm{K})$
, and is highly dependent on the
$e^+/\textrm{H}$
abundance. -
3. Dust: Guessoum et al. (Reference Guessoum, Jean and Gillard2010) point out that
$e^+$
annihilation on small dust grains can non-negligibly reduce the Ps fraction in the warm ionised interstellar medium. -
4. Higher-order lines: recombination lines with
$\Delta n>1$
weaken as
$\Delta n^2$
(Gordon & Sorochenko Reference Gordon and Sorochenko2002), but provide a non-negligible contribution to radiative energy loss. Fine and hyperfine transitions are similarly weak (Wallyn et al. Reference Wallyn, Mahoney, Durouchoux and Chapuis1996).


For the purposes of later analysis, we shall characterise the ratio of the $\Delta n=1$
recombination line photon rate to the ortho+para annihilation rate by
$\Delta n=1$
recombination line photon rate to the ortho+para annihilation rate by $f_n=R_n/R_p$
. As discussed above, the main contribution to
$f_n=R_n/R_p$
. As discussed above, the main contribution to $f_n$
is likely to be the
$f_n$
is likely to be the $\mathrm{Ps}n\alpha/\mathrm{Ps}1\alpha$
photon ratio of
$\mathrm{Ps}n\alpha/\mathrm{Ps}1\alpha$
photon ratio of ${\sim} n^{-1}$
. However, since the value of
${\sim} n^{-1}$
. However, since the value of $f_n$
is uncertain, we include it as a variable in later calculations.
$f_n$
is uncertain, we include it as a variable in later calculations.
3. Observations
We obtained data from the 64-m Parkes radio telescope (Murriyang) in NSW, Australia using the ultra-wide-bandwidth low-frequency receiver (UWL) (Hobbs et al. Reference Hobbs2020). This receiver allowed us to survey with a higher sensitivity and over a wider instantaneous bandwidth (0.704–4.032 GHz) than previously possible with this telescope. The system equivalent flux density $S_{\mathrm{sys}}$
, was measured to be approximately 34 Jy at 2 GHz, but rises at both low and high frequency (Hobbs et al. Reference Hobbs2020).
$S_{\mathrm{sys}}$
, was measured to be approximately 34 Jy at 2 GHz, but rises at both low and high frequency (Hobbs et al. Reference Hobbs2020).
The radio frequency interference (RFI) environment at Parkes is challenging compared to the new radio-quiet zones such as the Murchison Radio Astronomy Observatory. Figure 1 shows an example total power spectrum. About 4% of the band contains RFI at extreme levels (more than double $S_{\mathrm{sys}}$
), and around 20% of the band contains residual RFI, after bandpass calibration, in excess of 1% of
$S_{\mathrm{sys}}$
), and around 20% of the band contains residual RFI, after bandpass calibration, in excess of 1% of $S_{\mathrm{sys}}$
, a level which still makes the data unusable (theoretical sensitivity is exceeded in a matter of seconds). Hobbs et al. (Reference Hobbs2020) cite a similar unusable fraction (24%) over the whole band.
$S_{\mathrm{sys}}$
, a level which still makes the data unusable (theoretical sensitivity is exceeded in a matter of seconds). Hobbs et al. (Reference Hobbs2020) cite a similar unusable fraction (24%) over the whole band.
Example waterfall plot (time v frequency) for (top) 47 Tuc and (bottom) $\omega$
Cen where the intensity in the calibrated (quotient) Stokes I spectra is displayed as a function of time and frequency for sub-band 10 for a 300-s observation taken on UT 13:54 on 2020 October 22 and UT 13:34 on 2021 February 6, respectively. Channel number is shown on the top axis. The feature at 2048 MHz is an instrumental artefact. The features at 1984 and 2112 MHz are band edge artefacts. RFI can be seen in the ranges 2015–2034 MHz and 2070–2071 MHz. The rest-frame frequencies for three hydrogen recombination lines
$\omega$
Cen where the intensity in the calibrated (quotient) Stokes I spectra is displayed as a function of time and frequency for sub-band 10 for a 300-s observation taken on UT 13:54 on 2020 October 22 and UT 13:34 on 2021 February 6, respectively. Channel number is shown on the top axis. The feature at 2048 MHz is an instrumental artefact. The features at 1984 and 2112 MHz are band edge artefacts. RFI can be seen in the ranges 2015–2034 MHz and 2070–2071 MHz. The rest-frame frequencies for three hydrogen recombination lines $(\mathrm{H}146,147,148 \alpha$
at 2091.54,2049.29,2008.16 MHz, respectively) and two Ps recombination lines
$(\mathrm{H}146,147,148 \alpha$
at 2091.54,2049.29,2008.16 MHz, respectively) and two Ps recombination lines $(\mathrm{Ps}116,117\alpha$
at 2080.72,2028.04 MHz, respectively) lie within the frequency range displayed. The intensity range is –1 to 1 Jy.
$(\mathrm{Ps}116,117\alpha$
at 2080.72,2028.04 MHz, respectively) lie within the frequency range displayed. The intensity range is –1 to 1 Jy.

The observations were free from the 1 MHz beamformer artefacts present in previous Parkes observations (Reynolds et al. Reference Reynolds2017), but did suffer from filter artefacts due to the division of the band into sub-bands, each of width 128 MHz (see below, and Figures 1 and 2). For pulsar processing, Hobbs et al. (Reference Hobbs2020) remove a further 260 MHz (8%) of the total bandwidth due to sub-band edge effects.
To cover the full frequency range, there were 26 sub-bands each containing 32768 channels of width 3.9 kHz, corresponding to a velocity resolution of $0.5\, \mathrm{km\, s}^{-1}$
at 2.3 GHz. Given the expected broad Ps linewidths, Doppler tracking was not enabled during the observations.
$0.5\, \mathrm{km\, s}^{-1}$
at 2.3 GHz. Given the expected broad Ps linewidths, Doppler tracking was not enabled during the observations.
We observed the globular clusters 47 Tuc and $\omega$
Cen over ten separate days (see Table 1), obtaining 24.6 h of data for 47 Tuc and 20.3 h of data for
$\omega$
Cen over ten separate days (see Table 1), obtaining 24.6 h of data for 47 Tuc and 20.3 h of data for $\omega$
Cen. The observations were mostly at night. We also observed the continuum calibrator sources listed in Table 1 to calibrate the flux density scale using on-off spectra. The (frequency-dependent) difference in power detected by the telescope between calibrator (on) and reference (off) positions was compared with the receiver noise power (reference position) and with an internal calibration noise diode signal. Over the elevation and time range for our daily observations, the receiver gain was remarkably stable so the noise diode was eventually powered off for most of our observations. As the noise diode and receiver noise spectra were not identical, this led to a slight improvement in bandpass calibration with little discernible change in calibration accuracy.
$\omega$
Cen. The observations were mostly at night. We also observed the continuum calibrator sources listed in Table 1 to calibrate the flux density scale using on-off spectra. The (frequency-dependent) difference in power detected by the telescope between calibrator (on) and reference (off) positions was compared with the receiver noise power (reference position) and with an internal calibration noise diode signal. Over the elevation and time range for our daily observations, the receiver gain was remarkably stable so the noise diode was eventually powered off for most of our observations. As the noise diode and receiver noise spectra were not identical, this led to a slight improvement in bandpass calibration with little discernible change in calibration accuracy.
The globular cluster observations were made at RA (J2000) $00^\mathrm{h}24^\mathrm{m}05.36^{\mathrm{s}}$
, Dec (J2000)
$00^\mathrm{h}24^\mathrm{m}05.36^{\mathrm{s}}$
, Dec (J2000) $-72^{\circ}04^{\prime}53.2^{\prime\prime}$
for 47 Tuc, and RA (J2000)
$-72^{\circ}04^{\prime}53.2^{\prime\prime}$
for 47 Tuc, and RA (J2000) $13^\mathrm{h}26^\mathrm{m}45.89^{\mathrm{s}}$
, Dec (J2000)
$13^\mathrm{h}26^\mathrm{m}45.89^{\mathrm{s}}$
, Dec (J2000) $-47^{\circ}28^{\prime}36.7^{\prime\prime}$
for
$-47^{\circ}28^{\prime}36.7^{\prime\prime}$
for $\omega$
Cen. The reference observations were made at an RA which was higher that the target RA by
$\omega$
Cen. The reference observations were made at an RA which was higher that the target RA by $5^\mathrm{m}$
for 47 Tuc and
$5^\mathrm{m}$
for 47 Tuc and $3.5^\mathrm{m}$
for
$3.5^\mathrm{m}$
for $\omega$
Cen. Since the telescope beamwidth varies from 5′ to 26′ over the observed frequency range (Hobbs et al. Reference Hobbs2020), this ensured that the reference positions were more than a beamwidth away from the target for all but the very lowest frequencies (which were in any case not used in subsequent analysis due to RFI). On- and off-source observations each lasted 300 s for 47 Tuc and 180 s for
$\omega$
Cen. Since the telescope beamwidth varies from 5′ to 26′ over the observed frequency range (Hobbs et al. Reference Hobbs2020), this ensured that the reference positions were more than a beamwidth away from the target for all but the very lowest frequencies (which were in any case not used in subsequent analysis due to RFI). On- and off-source observations each lasted 300 s for 47 Tuc and 180 s for $\omega$
Cen. Spectra were dumped every 1 s into an hdf5 format data file. Both linear (X and Y) polarisations were recorded as well as the cross-product
$\omega$
Cen. Spectra were dumped every 1 s into an hdf5 format data file. Both linear (X and Y) polarisations were recorded as well as the cross-product $XY^*$
.
$XY^*$
.
Hydra A has a 1 GHz flux density of 58.5 Jy and a spectral index $\alpha=-0.91$ $(S_{\nu}\propto \nu^{\alpha})$
(Baars et al. Reference Baars, Genzel, Pauliny-Toth and Witzel1977). B0407-658 has a 1 GHz flux density of 21.8 Jy and
$(S_{\nu}\propto \nu^{\alpha})$
(Baars et al. Reference Baars, Genzel, Pauliny-Toth and Witzel1977). B0407-658 has a 1 GHz flux density of 21.8 Jy and $\alpha=-1.28$
. B1934-638 has a 1 GHz flux density of 14.8 Jy and a spectral index and curvature given by Reynolds (Reference Reynolds1994).
$\alpha=-1.28$
. B1934-638 has a 1 GHz flux density of 14.8 Jy and a spectral index and curvature given by Reynolds (Reference Reynolds1994).
4. Analysis and results
The data were averaged in time across each observation (300 s for 47 Tuc and 180 s for $\omega$
Cen), and averaged in frequency by 8 channels to a resolution of 31 kHz. Bandpass calibration was achieved by forming an on-off quotient spectrum, scaled by the frequency-dependent system temperature in Jy as measured for the reference spectrum. The frequency-dependence of the system temperature was accounted for, although it was assumed to be constant across each 128 MHz sub-band. Example waterfall plots are shown in Figure 2. Data away from the RFI regions were satisfactory in quality. The data for
$\omega$
Cen), and averaged in frequency by 8 channels to a resolution of 31 kHz. Bandpass calibration was achieved by forming an on-off quotient spectrum, scaled by the frequency-dependent system temperature in Jy as measured for the reference spectrum. The frequency-dependence of the system temperature was accounted for, although it was assumed to be constant across each 128 MHz sub-band. Example waterfall plots are shown in Figure 2. Data away from the RFI regions were satisfactory in quality. The data for $\omega$
Cen were of slightly higher quality (flatter spectral baselines), reflecting the smaller time and angular separation of the source and reference observations.
$\omega$
Cen were of slightly higher quality (flatter spectral baselines), reflecting the smaller time and angular separation of the source and reference observations.
Observations dates, integration time (on and off source), target globular cluster, calibrator and noise diode details.

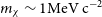
A list of $\mathrm{Psn}\alpha$
recombination lines that were able to be median-stacked for the two Globular clusters. Other line locations were not stacked due to the proximity of band edges or RFI, or poor spectral baselines. The rest-frame transition frequencies are given by Equation (1).
$\mathrm{Psn}\alpha$
recombination lines that were able to be median-stacked for the two Globular clusters. Other line locations were not stacked due to the proximity of band edges or RFI, or poor spectral baselines. The rest-frame transition frequencies are given by Equation (1). $\mathrm{Ps}93\alpha$
lies at 4024.99 MHz;
$\mathrm{Ps}93\alpha$
lies at 4024.99 MHz; $\mathrm{Ps}135\alpha$
lies at 1322.42 MHz.
$\mathrm{Ps}135\alpha$
lies at 1322.42 MHz.
Sub-bands where the measured calibration was not consistent with neighbouring sub-bands were dropped (SB8, 9 and 11). This was due to time-variable RFI affecting the calibration. The data for each cluster were then median-averaged in time. The frequency range around the predicted position for each $\mathrm{Psn}\alpha$
line was then inspected visually. The principal quantum numbers of lines which were too close to sub-band edges, or too close to RFI were then noted, and this data was excluded from further analysis. The remainder of the data were then combined again, but this time using a weighted median across both time and quantum number. That is, all data for a given frequency offset from each
$\mathrm{Psn}\alpha$
line was then inspected visually. The principal quantum numbers of lines which were too close to sub-band edges, or too close to RFI were then noted, and this data was excluded from further analysis. The remainder of the data were then combined again, but this time using a weighted median across both time and quantum number. That is, all data for a given frequency offset from each $\mathrm{Psn}\alpha$
line and at all times were median-averaged. There are
$\mathrm{Psn}\alpha$
line and at all times were median-averaged. There are $73\ \mathrm{Psn}\alpha$
recombination lines within the frequency range of the UWL receiver. After the above exclusions, 20 Ps recombination lines were available for 47 Tuc, and 26 lines for
$73\ \mathrm{Psn}\alpha$
recombination lines within the frequency range of the UWL receiver. After the above exclusions, 20 Ps recombination lines were available for 47 Tuc, and 26 lines for $\omega$
Cen (see Table 2).
$\omega$
Cen (see Table 2).
This robust method of data combination proved to be more effective than simple averaging or clipped averaging. The method is a robust version of the spectral stacking methods employed for $\lambda$
21-cm HI and HI/HII recombination line observations (Delhaize et al. Reference Delhaize, Meyer, Staveley-Smith and Boyle2013; Emig et al. Reference Emig2019; Chen et al. Reference Chen2021a). As with those methods, spectra were stacked in rest-frame velocity space rather than frequency space, as the predicted width of the Ps lines varies by a factor of 3 across the frequency range of the lines listed in Table 2. This was achieved by linearly re-sampling all spectra (scipy.interpolate.interp1d) (Virtanen et al. Reference Virtanen2020). Following the reasoning in Section 2, the spectra extracted around each
$\lambda$
21-cm HI and HI/HII recombination line observations (Delhaize et al. Reference Delhaize, Meyer, Staveley-Smith and Boyle2013; Emig et al. Reference Emig2019; Chen et al. Reference Chen2021a). As with those methods, spectra were stacked in rest-frame velocity space rather than frequency space, as the predicted width of the Ps lines varies by a factor of 3 across the frequency range of the lines listed in Table 2. This was achieved by linearly re-sampling all spectra (scipy.interpolate.interp1d) (Virtanen et al. Reference Virtanen2020). Following the reasoning in Section 2, the spectra extracted around each $\mathrm{Ps}\alpha$
line frequency were also scaled by
$\mathrm{Ps}\alpha$
line frequency were also scaled by $\nu_n^{-1/3}$
relative to the central
$\nu_n^{-1/3}$
relative to the central $\mathrm{Ps}\alpha$
line frequency
$\mathrm{Ps}\alpha$
line frequency $(\mathrm{Ps}113\alpha$
or
$(\mathrm{Ps}113\alpha$
or $\mathrm{Ps}114\alpha$
) to account for the increase in flux density with frequency expected for a low-density recombination cascade. Finally, to account for the variable noise levels at different times and frequencies (due to changes in RFI, receiver noise, amplitude scaling, frequency smoothing), the median absolute deviation (MAD) of the individual spectra in the central 32 MHz around each
$\mathrm{Ps}114\alpha$
) to account for the increase in flux density with frequency expected for a low-density recombination cascade. Finally, to account for the variable noise levels at different times and frequencies (due to changes in RFI, receiver noise, amplitude scaling, frequency smoothing), the median absolute deviation (MAD) of the individual spectra in the central 32 MHz around each $\mathrm{Ps}\alpha$
line frequency was calculated. The inverse square of the MAD was used as weight estimator.
$\mathrm{Ps}\alpha$
line frequency was calculated. The inverse square of the MAD was used as weight estimator.
The weighted median averaging process also helped to suppress two particular instrumental ripple artefacts: (a) a 5.7 MHz standing wave, common to the Parkes telescope (Reynolds et al. Reference Reynolds2017), but higher with the UWL than other receivers; and (b) a ${\sim}64$
MHz ripple arising from the UWL 128-MHz sub-band filters. These artefacts manifest themselves in the calibrated spectra when there are small changes in receiver gain or changes in continuum flux and spectral index between source and reference positions.
${\sim}64$
MHz ripple arising from the UWL 128-MHz sub-band filters. These artefacts manifest themselves in the calibrated spectra when there are small changes in receiver gain or changes in continuum flux and spectral index between source and reference positions.
The final weighted median-stacked spectra for 47 Tuc and $\omega$
Cen are shown in Figure 3. The spectra have been smoothed to a frequency resolution of 1 MHz to more closely match the expected linewidths, and fitted with polynomials of order 3 and 1, respectively, in order to remove any residual bandpass response. The product of the number of lines stacked and the on+off source integration time is 489 and 528 h, respectively. No clear detections are made at the expected frequency offset for the stacked spectra or for the individual recombination lines. The rms of the central 50% of the spectra shown in Figure 3 is 0.56 and 0.28 mJy (the rms for data without
$\omega$
Cen are shown in Figure 3. The spectra have been smoothed to a frequency resolution of 1 MHz to more closely match the expected linewidths, and fitted with polynomials of order 3 and 1, respectively, in order to remove any residual bandpass response. The product of the number of lines stacked and the on+off source integration time is 489 and 528 h, respectively. No clear detections are made at the expected frequency offset for the stacked spectra or for the individual recombination lines. The rms of the central 50% of the spectra shown in Figure 3 is 0.56 and 0.28 mJy (the rms for data without $\nu_n^{-1/3}$
scaling was slightly better). Corresponding 3-
$\nu_n^{-1/3}$
scaling was slightly better). Corresponding 3- $\sigma$
upper limits on the stacked spectra are 1.7 and 0.84 mJy for 47 Tuc and
$\sigma$
upper limits on the stacked spectra are 1.7 and 0.84 mJy for 47 Tuc and $\omega$
Cen, respectively. These limits were confirmed by injecting fake signals with a velocity dispersion of
$\omega$
Cen, respectively. These limits were confirmed by injecting fake signals with a velocity dispersion of $275\, \mathrm{km\, s}^{-1}$
at the corresponding
$275\, \mathrm{km\, s}^{-1}$
at the corresponding $\mathrm{Psn}\alpha$
line frequency into the individual, pre-stacked data. The fake signal injection also served to verify the data reduction pipeline. Corresponding stacked spectra at the frequencies of H recombination lines detection were also made, with no detection.
$\mathrm{Psn}\alpha$
line frequency into the individual, pre-stacked data. The fake signal injection also served to verify the data reduction pipeline. Corresponding stacked spectra at the frequencies of H recombination lines detection were also made, with no detection.
Stacked spectrum across all observations and all useful $\mathrm{Psn}\alpha$
lines (see Table 2) for (top) 47 Tuc and (bottom)
$\mathrm{Psn}\alpha$
lines (see Table 2) for (top) 47 Tuc and (bottom) $\omega$
Cen, smoothed to a frequency resolution of 1 MHz. The frequency scale is relative to zero redshift (negative frequencies correspond to redshifted emission) at reference central frequencies of 2723.61 MHz
$\omega$
Cen, smoothed to a frequency resolution of 1 MHz. The frequency scale is relative to zero redshift (negative frequencies correspond to redshifted emission) at reference central frequencies of 2723.61 MHz $(\mathrm{Ps}106\alpha)$
for 47 Tuc and 2648.31 MHz
$(\mathrm{Ps}106\alpha)$
for 47 Tuc and 2648.31 MHz $(\mathrm{Ps}107\alpha)$
for
$(\mathrm{Ps}107\alpha)$
for $\omega$
Cen. The expected line locations are marked with the vertical dashed lines and the expected FWHP linewidths are marked by the orange bands.
$\omega$
Cen. The expected line locations are marked with the vertical dashed lines and the expected FWHP linewidths are marked by the orange bands.

3- $\sigma$
upper limits for 47 Tuc and
$\sigma$
upper limits for 47 Tuc and $\omega$
Cen at the assumed distances for the flux density, Ps recombination rate, rms density, mass and J-factor due to self-annihilating light dark matter (LDM). A Doppler-broadened velocity dispersion of
$\omega$
Cen at the assumed distances for the flux density, Ps recombination rate, rms density, mass and J-factor due to self-annihilating light dark matter (LDM). A Doppler-broadened velocity dispersion of $275\, \mathrm{km\, s}^{-1}$
is assumed. The flux density and rate limits apply to all Ps recombination line emission at the cluster recession velocity within the frequency range considered and within the (frequency-dependent) Parkes beam. The rms density and mass limits refer to LDM within the scale radius
$275\, \mathrm{km\, s}^{-1}$
is assumed. The flux density and rate limits apply to all Ps recombination line emission at the cluster recession velocity within the frequency range considered and within the (frequency-dependent) Parkes beam. The rms density and mass limits refer to LDM within the scale radius $r_s$
, assumed to be 10 pc, for an NFW-like profile. The J-factor is the integral of
$r_s$
, assumed to be 10 pc, for an NFW-like profile. The J-factor is the integral of $\unicode{x03C1}^2$
along the line of site and across the solid angle subtended by the cluster out to the projected scale radius. A particle mass of
$\unicode{x03C1}^2$
along the line of site and across the solid angle subtended by the cluster out to the projected scale radius. A particle mass of $1 \mathrm{MeV\, c}^{-2}$
and an annihilation cross-section
$1 \mathrm{MeV\, c}^{-2}$
and an annihilation cross-section $\langle\sigma v\rangle = 3\times 10^{-29} \mathrm{cm}^3 \mathrm{s}^{-1}$
are assumed.
$\langle\sigma v\rangle = 3\times 10^{-29} \mathrm{cm}^3 \mathrm{s}^{-1}$
are assumed. $f_n$
is the ratio of the recombination rate to the annihilation rate. Scaling for other values is given in Equation 5 for density and mass, and in Equation (7) for the J-factor.
$f_n$
is the ratio of the recombination rate to the annihilation rate. Scaling for other values is given in Equation 5 for density and mass, and in Equation (7) for the J-factor.
5. Discussion
The rms noise in the final spectra for 47 Tuc and $\omega$
Cen shown in Figure 3 is an order of magnitude higher than expected from the radiometer equation: 280–560
$\omega$
Cen shown in Figure 3 is an order of magnitude higher than expected from the radiometer equation: 280–560 $\unicode{x03BC}$
Jy versus
$\unicode{x03BC}$
Jy versus $40\,\unicode{x03BC}$
Jy expected for the given integration time, receiver noise temperature, number of polarisations, number of stacked lines, final spectral resolution (1 MHz), and observing technique (on-off). This seems mainly due to a combination of RFI, standing waves and receiver bandpass calibration. Despite the RFI, the spectral rms is
$40\,\unicode{x03BC}$
Jy expected for the given integration time, receiver noise temperature, number of polarisations, number of stacked lines, final spectral resolution (1 MHz), and observing technique (on-off). This seems mainly due to a combination of RFI, standing waves and receiver bandpass calibration. Despite the RFI, the spectral rms is $10^{10}$
times lower than the (continuously present) RFI maximum at 762 MHz (Figure 1), an impressive spectral dynamic range. The 3-
$10^{10}$
times lower than the (continuously present) RFI maximum at 762 MHz (Figure 1), an impressive spectral dynamic range. The 3- $\sigma$
flux density limit for
$\sigma$
flux density limit for $\omega$
Cen is also over two orders of magnitude better than the Galactic Centre measurement of Reynolds et al. (Reference Reynolds2017).
$\omega$
Cen is also over two orders of magnitude better than the Galactic Centre measurement of Reynolds et al. (Reference Reynolds2017).
The heliocentric radial velocities for 47 Tuc and $\omega$
Cen are
$\omega$
Cen are $-18\, \mathrm{km\, s}^{-1}$
and
$-18\, \mathrm{km\, s}^{-1}$
and $232\, \mathrm{km\, s}^{-1}$
, respectively (Harris Reference Harris1996). Correcting for the telescope velocity at the time of observation, these correspond to topocentric radial velocities of
$232\, \mathrm{km\, s}^{-1}$
, respectively (Harris Reference Harris1996). Correcting for the telescope velocity at the time of observation, these correspond to topocentric radial velocities of $-5$
and
$-5$
and $211\, \mathrm{km\, s}^{-1}$
, respectively. In turn, these correspond to the frequency offsets (for their respective reference frequencies of 2723.61 and 2648.31 MHz) of 0.05 MHz and
$211\, \mathrm{km\, s}^{-1}$
, respectively. In turn, these correspond to the frequency offsets (for their respective reference frequencies of 2723.61 and 2648.31 MHz) of 0.05 MHz and $-1.86$
MHz, as shown by the dashed vertical lines in Figure 3. For a gas temperature of
$-1.86$
MHz, as shown by the dashed vertical lines in Figure 3. For a gas temperature of $5\times 10^3\ \mathrm{K}$
, the expected Ps thermal velocity dispersion is
$5\times 10^3\ \mathrm{K}$
, the expected Ps thermal velocity dispersion is ${\sim}275\, \mathrm{km\, s}^{-1}$
, corresponding to a FWHP linewidth of 5.8 MHz at 2.7 GHz, shown by the vertical orange bands in Figure 3.
${\sim}275\, \mathrm{km\, s}^{-1}$
, corresponding to a FWHP linewidth of 5.8 MHz at 2.7 GHz, shown by the vertical orange bands in Figure 3.
Upper limits to the recombination line flux density and the corresponding recombination rates are listed in Table 3. The 3- $\sigma$
recombination rate upper limits vary from
$\sigma$
recombination rate upper limits vary from $R_n=1.1$
to
$R_n=1.1$
to $1.4\times10^{43} \mathrm{s}^{-1}$
, with the closer distance of 47 Tuc slightly compensating for the somewhat poorer flux density limits. These limits are 210–270 times better than recent radio recombination rate limits obtained for the Galactic Centre (Reynolds et al. Reference Reynolds2017).
$1.4\times10^{43} \mathrm{s}^{-1}$
, with the closer distance of 47 Tuc slightly compensating for the somewhat poorer flux density limits. These limits are 210–270 times better than recent radio recombination rate limits obtained for the Galactic Centre (Reynolds et al. Reference Reynolds2017).
However, these limits are still poorer than the point-source limits established from INTEGRAL/SPI all-sky maps in unconfused regions away from the Galactic Plane. For $\omega$
Cen, Knödlseder et al. (Reference Knödlseder2005) quote a 511-keV point-source upper limit of
$\omega$
Cen, Knödlseder et al. (Reference Knödlseder2005) quote a 511-keV point-source upper limit of $1.7\times 10^{-3}$
photons
$1.7\times 10^{-3}$
photons $\mathrm{cm}^{-2} \mathrm{s}^{-1}$
. At the distance quoted in Table 3, this corresponds to a Ps-only annihilation rate limit of
$\mathrm{cm}^{-2} \mathrm{s}^{-1}$
. At the distance quoted in Table 3, this corresponds to a Ps-only annihilation rate limit of $1.2\times 10^{42} \mathrm{s}^{-1}$
(counting only 2-photon emission from para-Ps), which is a factor of 10 better than our recombination rate limit.
$1.2\times 10^{42} \mathrm{s}^{-1}$
(counting only 2-photon emission from para-Ps), which is a factor of 10 better than our recombination rate limit.
The radio and $\gamma$
-ray limits can be translated into limits on the presence of self-annihilating dark matter. However, the limits depend sensitively on the density profile of any dark matter present. This in turn depends on: (a) the extent of baryonic feedback which can smooth the central density cusp (Benítez-Llambay et al. 2019); and (b) the mass of the central black hole which can give rise to dark matter density spikes (Fortes et al. Reference Fortes, Miranda, Stecker and Wuensche2020). For a pure NFW dark matter profile (Navarro, Frenk, & White Reference Navarro, Frenk and White1996), the density profile is parameterised by:
$\gamma$
-ray limits can be translated into limits on the presence of self-annihilating dark matter. However, the limits depend sensitively on the density profile of any dark matter present. This in turn depends on: (a) the extent of baryonic feedback which can smooth the central density cusp (Benítez-Llambay et al. 2019); and (b) the mass of the central black hole which can give rise to dark matter density spikes (Fortes et al. Reference Fortes, Miranda, Stecker and Wuensche2020). For a pure NFW dark matter profile (Navarro, Frenk, & White Reference Navarro, Frenk and White1996), the density profile is parameterised by:
 \begin{equation}\unicode{x03C1}(r) = \unicode{x03C1}_{0} \left( \frac{r}{r_s} \right) ^{-1} \left( 1+ \frac{r}{r_s} \right)^{-2} .\end{equation}
The corresponding annihilation rate, volume-integrated to radius $r_m$
, is:
$r_m$
, is:
 \begin{equation} R_P(r_m) = \frac{4\pi}{3} \unicode{x03C1}_{\circ}^2 m_{{\text{X}}}^{-2} \langle\sigma v\rangle r_s^3 \left(1-\frac{r_s^3}{(r_s+r_m)^3}\right),\end{equation}
where $m_{\text{X}}$
is the particle mass and
$m_{\text{X}}$
is the particle mass and $\langle\sigma v\rangle$
is the annihilation cross-section. Below the scale radius
$\langle\sigma v\rangle$
is the annihilation cross-section. Below the scale radius $r_s$
, the integrated annihilation scales as r, with equal signal contribution from all spherical shells. But this flattens off near the scale radius, with the rate within the scale radius being given by
$r_s$
, the integrated annihilation scales as r, with equal signal contribution from all spherical shells. But this flattens off near the scale radius, with the rate within the scale radius being given by $R_p(r_s) = (7\pi/6) \unicode{x03C1}_{\circ}^2 m_{{\text{X}}}^{-2} \langle\sigma v\rangle r_s^3$
. The density for self-annihilating dark matter within can be further parameterised as:
$R_p(r_s) = (7\pi/6) \unicode{x03C1}_{\circ}^2 m_{{\text{X}}}^{-2} \langle\sigma v\rangle r_s^3$
. The density for self-annihilating dark matter within can be further parameterised as:
 \begin{equation}\begin{aligned}\left( \frac{\unicode{x03C1}_{0}}{\mathrm{M}_{\odot} \, \mathrm{pc}^{-3}} \right) =\, &46.4 \left( \frac{m_{{\text{X}}}}{1\, \mathrm{MeV\, c^{-2}}} \right) \left( \frac{\langle\sigma v\rangle}{3.10^{-29}\, \mathrm{cm}^3 \, {\mathrm{s}}^{-1}} \right)^{-0.5} \\ & \times \left( \frac{r_s}{10 \, \mathrm{pc}} \right)^{-1.5} \left( \frac{R_p}{10^{43} \, {\mathrm{s}^{-1}}} \right)^{0.5}.\end{aligned}\end{equation}
For a scale radius of $r_s=10\ \mathrm{pc}$
, which approximately corresponds to the effective optical radii of the two clusters (Gascoigne & Burr Reference Gascoigne and Burr1956), and an annihilation cross-section of
$r_s=10\ \mathrm{pc}$
, which approximately corresponds to the effective optical radii of the two clusters (Gascoigne & Burr Reference Gascoigne and Burr1956), and an annihilation cross-section of $\langle\sigma v\rangle=3\times 10^{-29} \mathrm{cm}^3 \mathrm{s}^{-1}$
, the corresponding density upper limits shown in Table 3 are 54
$\langle\sigma v\rangle=3\times 10^{-29} \mathrm{cm}^3 \mathrm{s}^{-1}$
, the corresponding density upper limits shown in Table 3 are 54 $f_n^{-0.5}$ $\left(m_\chi/\mathrm{MeV\, c}^{-2}\right)$ $\mathrm{M}_{\odot} \mathrm{pc}^{-3}$ $\big(2.1f_n^{-0.5}$ $\left(m_\chi/\mathrm{MeV\, c}^{-2}\right)$
TeV
$\left(m_\chi/\mathrm{MeV\, c}^{-2}\right)$
TeV $\mathrm{cm}^{-3}\big)$
and 48
$\mathrm{cm}^{-3}\big)$
and 48 $f_n^{-0.5}$ $\left(m_\chi/\mathrm{MeV\, c}^{-2}\right)$ $\mathrm{M}_{\odot} \mathrm{pc}^{-3}$ $\big(1.8\,f_n^{-0.5}$ $\big(m_\chi/\mathrm{MeV\, c}^{-2}\big)$
TeV
$\big(m_\chi/\mathrm{MeV\, c}^{-2}\big)$
TeV $\mathrm{cm}^{-3}$
) for 47 Tuc and
$\mathrm{cm}^{-3}$
) for 47 Tuc and $\omega$
Cen, respectively. The total self-annihilating LDM mass within the scale radius is
$\omega$
Cen, respectively. The total self-annihilating LDM mass within the scale radius is ${<}1.3\times 10^5 f_n^{-0.5}$ $(m_\chi/\mathrm{MeV\, c}^{-2})$ $\mathrm{M}_{\odot}$
and
$\mathrm{M}_{\odot}$
and ${<}1.2\times 10^5 f_n^{-0.5}$ $\big(m_\chi/\mathrm{MeV\, c}^{-2}\big)$ $\mathrm{M}_{\odot}$
for 47 Tuc and
$\mathrm{M}_{\odot}$
for 47 Tuc and $\omega$
Cen, respectively.
$\omega$
Cen, respectively.
The fiducial annihilation cross-section of $\langle\sigma v\rangle=3\times 10^{-29} \mathrm{cm}^3 \mathrm{s}^{-1}$
is chosen, following the arguments presented by Bartels, Gaggero, & Weniger (Reference Bartels, Gaggero and Weniger2017) for LDM thermal relics, to be three orders of magnitude smaller than the canonical WIMP value cited by Jungman et al. (Reference Jungman, Kamionkowski and Griest1996). It is also beneath the upper limit established for the nearby dwarf galaxy Reticulum II (Ret II) for all values of
$\langle\sigma v\rangle=3\times 10^{-29} \mathrm{cm}^3 \mathrm{s}^{-1}$
is chosen, following the arguments presented by Bartels, Gaggero, & Weniger (Reference Bartels, Gaggero and Weniger2017) for LDM thermal relics, to be three orders of magnitude smaller than the canonical WIMP value cited by Jungman et al. (Reference Jungman, Kamionkowski and Griest1996). It is also beneath the upper limit established for the nearby dwarf galaxy Reticulum II (Ret II) for all values of $m_{\chi}$
(Siegert et al. Reference Siegert2022a)—see Figure 4 for context. We will later discuss the implications for
$m_{\chi}$
(Siegert et al. Reference Siegert2022a)—see Figure 4 for context. We will later discuss the implications for $\langle\sigma v\rangle$
if dynamical estimates of the dark matter content of the clusters are used instead.
$\langle\sigma v\rangle$
if dynamical estimates of the dark matter content of the clusters are used instead.
Upper limits to the annihilation cross-section $\langle\sigma v\rangle$
, as a function of dark matter particle mass
$\langle\sigma v\rangle$
, as a function of dark matter particle mass $m_{\chi}$
. The solid blue and red lines (labelled Psn) are the recombination upper limits for 47 Tuc and
$m_{\chi}$
. The solid blue and red lines (labelled Psn) are the recombination upper limits for 47 Tuc and $\omega$
Cen, respectively, and assume a recombination/annihilation ratio
$\omega$
Cen, respectively, and assume a recombination/annihilation ratio $f_n\approx0.01$
and a central dark matter fraction of 5%. The green line (labelled Ps
$f_n\approx0.01$
and a central dark matter fraction of 5%. The green line (labelled Ps $\gamma\gamma$
) is the annihilation rate upper limit for
$\gamma\gamma$
) is the annihilation rate upper limit for $\omega$
Cen calculated from the INTEGRAL/SPI measurements of Knödlseder et al. (Reference Knödlseder2005), using the same dark matter fraction. The black dashed line is the Ps annihilation limit for Ret II (Siegert et al. Reference Siegert2022a); the cyan dashed line is from Planck 2015/18 CMB anisotropy (Slatyer Reference Slatyer2016; Kawasaki et al. Reference Kawasaki, Nakatsuka, Nakayama and Sekiguchi2021); the solid pink line is from Voyager (Boudaud, Lavalle, & Salati Reference Boudaud, Lavalle and Salati2017); the solid brown line is from the combined COMPTEL/INTEGRAL diffuse background (Essig et al. Reference Essig, Kuflik, McDermott, Volansky and Zurek2013). The horizontal orange and grey dashed lines are the canonical WIMP cross-section (Jungman et al. Reference Jungman, Kamionkowski and Griest1996) and the reference LDM thermal relic cross-section (see text), respectively.
$\omega$
Cen calculated from the INTEGRAL/SPI measurements of Knödlseder et al. (Reference Knödlseder2005), using the same dark matter fraction. The black dashed line is the Ps annihilation limit for Ret II (Siegert et al. Reference Siegert2022a); the cyan dashed line is from Planck 2015/18 CMB anisotropy (Slatyer Reference Slatyer2016; Kawasaki et al. Reference Kawasaki, Nakatsuka, Nakayama and Sekiguchi2021); the solid pink line is from Voyager (Boudaud, Lavalle, & Salati Reference Boudaud, Lavalle and Salati2017); the solid brown line is from the combined COMPTEL/INTEGRAL diffuse background (Essig et al. Reference Essig, Kuflik, McDermott, Volansky and Zurek2013). The horizontal orange and grey dashed lines are the canonical WIMP cross-section (Jungman et al. Reference Jungman, Kamionkowski and Griest1996) and the reference LDM thermal relic cross-section (see text), respectively.

For the smaller particle masses that we are most sensitive to (and the ones requiring least energy loss for Ps production), $m_\chi \approx 1\,\mathrm{MeV\, c}^{-2}$
, and assuming
$m_\chi \approx 1\,\mathrm{MeV\, c}^{-2}$
, and assuming $f_n\approx 0.01$
for
$f_n\approx 0.01$
for $n=106$
, these limits correspond to 1.0 times the quoted stellar mass for 47 Tuc of
$n=106$
, these limits correspond to 1.0 times the quoted stellar mass for 47 Tuc of $1.3\times 10^6 \mathrm{M}_{\odot}$
(Heyl et al. Reference Heyl2017) and 0.27 times the quoted stellar mass for
$1.3\times 10^6 \mathrm{M}_{\odot}$
(Heyl et al. Reference Heyl2017) and 0.27 times the quoted stellar mass for $\omega$
Cen of
$\omega$
Cen of $4.5\times 10^6 \mathrm{M}_{\odot}$
(D’Souza & Rix Reference D’Souza and Rix2013). For
$4.5\times 10^6 \mathrm{M}_{\odot}$
(D’Souza & Rix Reference D’Souza and Rix2013). For $\omega$
Cen, the
$\omega$
Cen, the $\gamma$
-ray limits (Knödlseder et al. Reference Knödlseder2005) give an even tighter upper limit to the LDM self-annihilating mass of 1% of the stellar mass.
$\gamma$
-ray limits (Knödlseder et al. Reference Knödlseder2005) give an even tighter upper limit to the LDM self-annihilating mass of 1% of the stellar mass.
The stripped dwarf galaxy simulations of Wirth et al. (Reference Wirth, Bekki and Hayashi2020) suggest that the expected density of dark matter could be an order of magnitude beneath our limit as a result of matter re-distribution near pericentric passage. Such interactions will evolve the dark matter profile shapes such that they are no longer NFW, even if they started out as NFW. However, some of their models (e.g. S2) still retain substantial dark matter out to radii of ${\sim}100\ \mathrm{pc}$
, and therefore have dark matter masses higher than our limits in Table 3.
${\sim}100\ \mathrm{pc}$
, and therefore have dark matter masses higher than our limits in Table 3.
The commonly-quoted astrophysical J-factor (Charbonnier et al. Reference Charbonnier2011) is defined as:
 \begin{equation} J = \int \int \unicode{x03C1}^2(x,\Omega) dx d\Omega ,\end{equation}
where x is the position along the line-of-sight and $\Omega$
is the two-dimensional angular coordinate. For our fiducial NFW profile, the integral over all directions is
$\Omega$
is the two-dimensional angular coordinate. For our fiducial NFW profile, the integral over all directions is $J = (4\pi/3) r_s^3 \unicode{x03C1}_0^2/D^2$
, where D is the cluster distance. The majority of the double integral (92%) is enclosed within the solid angle defined by the projected scale radius
$J = (4\pi/3) r_s^3 \unicode{x03C1}_0^2/D^2$
, where D is the cluster distance. The majority of the double integral (92%) is enclosed within the solid angle defined by the projected scale radius $r_s$
. Hence:
$r_s$
. Hence:
 \begin{equation}\begin{aligned} \left( \frac{J_{0}}{\mathrm{M^2_{\odot}} \, \mathrm{pc}^{-5}} \right) =\, & 0.33 \left( \frac{m_{{\text{X}}}}{1\, \mathrm{MeV\, c^{-2}}} \right)^2 \left( \frac{\langle\sigma v\rangle}{3.10^{-29}\, \mathrm{cm}^3 \, {\mathrm{s}}^{-1}} \right)^{-1} \\ & \times \left( \frac{D}{5 \, \mathrm{kpc}} \right)^{-2} \left( \frac{R_p}{10^{43} \, {\mathrm{s}^{-1}}} \right),\end{aligned}\end{equation}
which, for $m_{{\text{X}}}=1\, \mathrm{MeV\, c}^{-2}$
and
$m_{{\text{X}}}=1\, \mathrm{MeV\, c}^{-2}$
and $\langle\sigma v\rangle = 3\times 10^{-29} \mathrm{cm}^3 {\mathrm{s}}^{-1}$
, results in upper limits of
$\langle\sigma v\rangle = 3\times 10^{-29} \mathrm{cm}^3 {\mathrm{s}}^{-1}$
, results in upper limits of $0.58 f_n^{-1} \mathrm{M}^2_{\odot} \mathrm{pc}^{-5}$ $(2.6\times10^{21}f_n^{-1}\, \mathrm{GeV}^2 \mathrm{cm}^{-5})$
for 47 Tuc and
$(2.6\times10^{21}f_n^{-1}\, \mathrm{GeV}^2 \mathrm{cm}^{-5})$
for 47 Tuc and $0.29 f_n^{-1} \mathrm{M}^2_{\odot} \mathrm{pc}^{-5}$ $(1.3\times10^{21} f_n^{-1}\, \mathrm{GeV}^2 \mathrm{cm}^{-5})$
for
$(1.3\times10^{21} f_n^{-1}\, \mathrm{GeV}^2 \mathrm{cm}^{-5})$
for $\omega$
Cen. Since
$\omega$
Cen. Since $R_p \propto D^2$
, the distance-dependence in Equation (7) disappears.
$R_p \propto D^2$
, the distance-dependence in Equation (7) disappears.
Our upper limits are based on an NFW profile with a scale radius $r_s=10\ \mathrm{pc}$
. Other authors have considered more generic dark matter distributions (e.g. Evans, Sanders, & Geringer-Sameth Reference Evans, Sanders and Geringer-Sameth2016) but, given the ongoing tidal interactions with the Galaxy, it is unknown which of these distributions might be more realistic. In particular, for a given mass, less cuspy models, which may be more consistent with observations of low-mass galaxies (Oh et al. Reference Oh, de Blok, Brinks, Walter and Kennicutt2011), result in fairly similar outcomes. Examination of Equation (4) shows that, even for a uniform sphere with density
$r_s=10\ \mathrm{pc}$
. Other authors have considered more generic dark matter distributions (e.g. Evans, Sanders, & Geringer-Sameth Reference Evans, Sanders and Geringer-Sameth2016) but, given the ongoing tidal interactions with the Galaxy, it is unknown which of these distributions might be more realistic. In particular, for a given mass, less cuspy models, which may be more consistent with observations of low-mass galaxies (Oh et al. Reference Oh, de Blok, Brinks, Walter and Kennicutt2011), result in fairly similar outcomes. Examination of Equation (4) shows that, even for a uniform sphere with density $\unicode{x03C1}_0$
, similar limits would result. More importantly, the FWHP beamwidth of the Parkes telescope (Hobbs et al. Reference Hobbs2020) ranges from
$\unicode{x03C1}_0$
, similar limits would result. More importantly, the FWHP beamwidth of the Parkes telescope (Hobbs et al. Reference Hobbs2020) ranges from $0.11^{\circ}$
at the rest frequency of
$0.11^{\circ}$
at the rest frequency of $\mathrm{Ps}93\alpha$
(4024.99 MHz) to
$\mathrm{Ps}93\alpha$
(4024.99 MHz) to $0.27^{\circ}$
at the rest frequency of
$0.27^{\circ}$
at the rest frequency of $\mathrm{Ps}135\alpha$
(1322.42 MHz), beyond which we have no sensitivity to Ps recombinations. However, this beamwidth, which corresponds to 10–23 pc at the average distance of 47 Tuc and
$\mathrm{Ps}135\alpha$
(1322.42 MHz), beyond which we have no sensitivity to Ps recombinations. However, this beamwidth, which corresponds to 10–23 pc at the average distance of 47 Tuc and $\omega$
Cen, is conveniently similar to, or slightly greater than, the effective radii of the clusters. If the dark matter is more concentrated, then the mass upper limits in Table 3 are overestimated, and need to be reduced by a factor of
$\omega$
Cen, is conveniently similar to, or slightly greater than, the effective radii of the clusters. If the dark matter is more concentrated, then the mass upper limits in Table 3 are overestimated, and need to be reduced by a factor of $(r_s/10 \mathrm{pc})^{-3/2}$
. But if more extended, our mass limits are underestimated and refer only to the mass contained within the Parkes beam. In principal, a very extended distribution
$(r_s/10 \mathrm{pc})^{-3/2}$
. But if more extended, our mass limits are underestimated and refer only to the mass contained within the Parkes beam. In principal, a very extended distribution $({>}30\ \mathrm{pc}$
for 47 Tuc;
$({>}30\ \mathrm{pc}$
for 47 Tuc; ${>}60\ \mathrm{pc}$
for
${>}60\ \mathrm{pc}$
for $\omega$
Cen) could result in signal cancellation in the reference (off-source) integration, but overall, the Parkes beam is well suited to the current experiment. It is much more useful for localisation than the INTEGRAL/SPI resolution of
$\omega$
Cen) could result in signal cancellation in the reference (off-source) integration, but overall, the Parkes beam is well suited to the current experiment. It is much more useful for localisation than the INTEGRAL/SPI resolution of $2.5^{\circ}$
(Winkler et al. Reference Winkler2003), and has higher brightness sensitivity than current radio interferometers.
$2.5^{\circ}$
(Winkler et al. Reference Winkler2003), and has higher brightness sensitivity than current radio interferometers.
LDM particles heavier than 1 MeV (up to 1 GeV) result in fewer annihilations, and poorer limits on dark matter density. On the other hand, Cosmic Microwave Background observational limits on the annihilation cross-section $\langle\sigma v\rangle$
via the
$\langle\sigma v\rangle$
via the $\chi\chi\rightarrow e^+e^-$
channel are also less severe by several orders of magnitude (Slatyer Reference Slatyer2016; Bartels et al. Reference Bartels, Gaggero and Weniger2017; Dutra et al. Reference Dutra2018; Kawasaki et al. Reference Kawasaki, Nakatsuka, Nakayama and Sekiguchi2021, see Figure 4).
$\chi\chi\rightarrow e^+e^-$
channel are also less severe by several orders of magnitude (Slatyer Reference Slatyer2016; Bartels et al. Reference Bartels, Gaggero and Weniger2017; Dutra et al. Reference Dutra2018; Kawasaki et al. Reference Kawasaki, Nakatsuka, Nakayama and Sekiguchi2021, see Figure 4).
As discussed in Section 2, the limits presented in Table 3 are also only relevant where $e^+e^-$
annihilation occurs via the Ps channel, which requires low energies and low temperatures, and therefore energy loss within the interstellar medium (ISM). Without such moderation, the favoured process is direct annihilation. For future work, this favours observations of nearby dark matter-rich galaxies which have an ISM but which are without an active nucleus or active star-forming regions. The class of dwarf galaxies around the Milky Way satisfy some of these criteria. In particular, the ultra-faint dwarf galaxy Ret II, discovered by the Dark Energy Survey team (Bechtol et al. Reference Bechtol2015), stands out as a good candidate. Observations and numerical simulations demonstrate that Ret II must contain a large amount of dark matter (Simon et al. Reference Simon2015; Armstrong, Bekki, & Ludlow Reference Armstrong, Bekki and Ludlow2020). Fermi-LAT has detected
$e^+e^-$
annihilation occurs via the Ps channel, which requires low energies and low temperatures, and therefore energy loss within the interstellar medium (ISM). Without such moderation, the favoured process is direct annihilation. For future work, this favours observations of nearby dark matter-rich galaxies which have an ISM but which are without an active nucleus or active star-forming regions. The class of dwarf galaxies around the Milky Way satisfy some of these criteria. In particular, the ultra-faint dwarf galaxy Ret II, discovered by the Dark Energy Survey team (Bechtol et al. Reference Bechtol2015), stands out as a good candidate. Observations and numerical simulations demonstrate that Ret II must contain a large amount of dark matter (Simon et al. Reference Simon2015; Armstrong, Bekki, & Ludlow Reference Armstrong, Bekki and Ludlow2020). Fermi-LAT has detected $\gamma$
-ray emission (Hooper & Linden Reference Hooper and Linden2015) which may originate from the annihilation of dark matter particles (Regis, Richter, & Colafrancesco Reference Regis, Richter and Colafrancesco2017) since the low stellar density environment of Ret II makes it a less-ideal environment than globular clusters to host re-cycled millisecond pulsars. Although initial analysis of INTEGRAL/SPI data suggested the presence of a 511 keV annihilation line at a significance of 3.1
$\gamma$
-ray emission (Hooper & Linden Reference Hooper and Linden2015) which may originate from the annihilation of dark matter particles (Regis, Richter, & Colafrancesco Reference Regis, Richter and Colafrancesco2017) since the low stellar density environment of Ret II makes it a less-ideal environment than globular clusters to host re-cycled millisecond pulsars. Although initial analysis of INTEGRAL/SPI data suggested the presence of a 511 keV annihilation line at a significance of 3.1 $\sigma$
(Siegert et al. Reference Siegert2016b), this has since been retracted (Siegert et al. Reference Siegert2022a). The challenge with dwarf galaxies is their much lower J-factors. For example, Siegert et al. (Reference Siegert2022a) quote a range of
$\sigma$
(Siegert et al. Reference Siegert2016b), this has since been retracted (Siegert et al. Reference Siegert2022a). The challenge with dwarf galaxies is their much lower J-factors. For example, Siegert et al. (Reference Siegert2022a) quote a range of $0.2{-}3.7\times10^{19}\, \mathrm{GeV}^2 \mathrm{cm}^{-5}$
for Ret II, whereas Evans et al. (Reference Evans, Strigari and Zivick2022) derive a probable range
$0.2{-}3.7\times10^{19}\, \mathrm{GeV}^2 \mathrm{cm}^{-5}$
for Ret II, whereas Evans et al. (Reference Evans, Strigari and Zivick2022) derive a probable range $10^{22-24}\, \mathrm{GeV}^2 \mathrm{cm}^{-5}$
for
$10^{22-24}\, \mathrm{GeV}^2 \mathrm{cm}^{-5}$
for $\omega$
Cen, similar to the upper limit from Equation (7) of
$\omega$
Cen, similar to the upper limit from Equation (7) of $1.3\times 10^{23}\, \mathrm{GeV}^2 \mathrm{cm}^{-5}$
for
$1.3\times 10^{23}\, \mathrm{GeV}^2 \mathrm{cm}^{-5}$
for $f_n=0.01$
,
$f_n=0.01$
, $m_{{\text{X}}}=1\, \mathrm{MeV\, c}^{-2}$
and
$m_{{\text{X}}}=1\, \mathrm{MeV\, c}^{-2}$
and $\langle\sigma v\rangle = 3\times 10^{-29} \mathrm{cm}^3 {\mathrm{s}}^{-1}$
.
$\langle\sigma v\rangle = 3\times 10^{-29} \mathrm{cm}^3 {\mathrm{s}}^{-1}$
.
A corollary of our upper limit to the self-annihilating LDM mass for the two clusters is that, if the LDM mass is to be dynamically significant (i.e. similar to the stellar mass), then the annihilation cross-section $\langle\sigma v\rangle < 3.1\times 10^{-31} f_n^{-1}\ (\mathrm{m}_\chi/1 \mathrm{MeV\, c}^{-2})^2 \mathrm{cm}^3 \mathrm{s}^{-1}$
for 47 Tuc and
$\langle\sigma v\rangle < 3.1\times 10^{-31} f_n^{-1}\ (\mathrm{m}_\chi/1 \mathrm{MeV\, c}^{-2})^2 \mathrm{cm}^3 \mathrm{s}^{-1}$
for 47 Tuc and ${<} 2.0\times 10^{-32} f_n^{-1}\ (\mathrm{m}_\chi/1 \mathrm{MeV\, c}^{-2})^2 \mathrm{cm}^3 \mathrm{s}^{-1}$
for
${<} 2.0\times 10^{-32} f_n^{-1}\ (\mathrm{m}_\chi/1 \mathrm{MeV\, c}^{-2})^2 \mathrm{cm}^3 \mathrm{s}^{-1}$
for $\omega$
Cen. More realistic estimates from observations and numerical simulations suggest lower dark matter masses, and therefore less-constrained cross-sections. The GAIA, HST and spectroscopic data analysed by Evans et al. (Reference Evans, Strigari and Zivick2022) suggest a half-light dark mass of
$\omega$
Cen. More realistic estimates from observations and numerical simulations suggest lower dark matter masses, and therefore less-constrained cross-sections. The GAIA, HST and spectroscopic data analysed by Evans et al. (Reference Evans, Strigari and Zivick2022) suggest a half-light dark mass of ${<}10^6 \mathrm{M}_{\odot}$
for
${<}10^6 \mathrm{M}_{\odot}$
for $\omega$
Cen. However, analysis of observations is also affected by the treatment of high-velocity stars (Lane et al. Reference Lane2010; Claydon et al. Reference Claydon, Gieles, Varri, Heggie and Zocchi2019). The majority of the simulations by Wirth et al. (Reference Wirth, Bekki and Hayashi2020) suggest central dark matter fractions in the range 0.01 to 0.1. Adopting a dark matter fraction of 0.05 for both clusters (i.e.
$\omega$
Cen. However, analysis of observations is also affected by the treatment of high-velocity stars (Lane et al. Reference Lane2010; Claydon et al. Reference Claydon, Gieles, Varri, Heggie and Zocchi2019). The majority of the simulations by Wirth et al. (Reference Wirth, Bekki and Hayashi2020) suggest central dark matter fractions in the range 0.01 to 0.1. Adopting a dark matter fraction of 0.05 for both clusters (i.e. $\mathrm{M}_{\mathrm{dark}}=6.5\times10^4 \mathrm{M}_{\odot}$
and
$\mathrm{M}_{\mathrm{dark}}=6.5\times10^4 \mathrm{M}_{\odot}$
and $2.2\times10^5 \mathrm{M}_{\odot}$
for 47 Tuc and
$2.2\times10^5 \mathrm{M}_{\odot}$
for 47 Tuc and $\omega$
Cen, respectively), more realistic estimates for the annihilation cross-section are
$\omega$
Cen, respectively), more realistic estimates for the annihilation cross-section are $\langle\sigma v\rangle <1.2\times 10^{-28} f_n^{-1}\ (\mathrm{m}_\chi/1 \mathrm{MeV\, c}^{-2})^2 \mathrm{cm}^3 \mathrm{s}^{-1}$
for 47 Tuc and
$\langle\sigma v\rangle <1.2\times 10^{-28} f_n^{-1}\ (\mathrm{m}_\chi/1 \mathrm{MeV\, c}^{-2})^2 \mathrm{cm}^3 \mathrm{s}^{-1}$
for 47 Tuc and ${<}7.9\times 10^{-30} f_n^{-1}\ (\mathrm{m}_\chi/1 \mathrm{MeV\, c}^{-2})^2 \mathrm{cm}^3 \mathrm{s}^{-1}$
for
${<}7.9\times 10^{-30} f_n^{-1}\ (\mathrm{m}_\chi/1 \mathrm{MeV\, c}^{-2})^2 \mathrm{cm}^3 \mathrm{s}^{-1}$
for $\omega$
Cen. For
$\omega$
Cen. For $\omega$
Cen, the existing
$\omega$
Cen, the existing $\gamma$
-ray limits (Knödlseder et al. Reference Knödlseder2005) give a cross-section limit of
$\gamma$
-ray limits (Knödlseder et al. Reference Knödlseder2005) give a cross-section limit of $\langle\sigma v\rangle < 8.6\times 10^{-31}\ (\mathrm{m}_\chi/1 \mathrm{MeV\, c}^{-2})^2 \mathrm{cm}^3 \mathrm{s}^{-1}$
. These results are shown in Figure 4.
$\langle\sigma v\rangle < 8.6\times 10^{-31}\ (\mathrm{m}_\chi/1 \mathrm{MeV\, c}^{-2})^2 \mathrm{cm}^3 \mathrm{s}^{-1}$
. These results are shown in Figure 4.
For $f_n\approx0.01$
, the cross-section limit derived from Ps recombination for
$f_n\approx0.01$
, the cross-section limit derived from Ps recombination for $\omega$
Cen is similar to the
$\omega$
Cen is similar to the $\gamma$
-ray limit for Ret II (Siegert et al. Reference Siegert2022a), also shown in Figure 4. However, the cross-section limit derived from Ps annihilation in
$\gamma$
-ray limit for Ret II (Siegert et al. Reference Siegert2022a), also shown in Figure 4. However, the cross-section limit derived from Ps annihilation in $\omega$
Cen is over 2 orders of magnitude tighter, by virtue of the vastly larger J-factor for globular clusters compared with even nearby dwarf galaxies. Between 0.5 and 2 MeV the limits improve on those obtained for the same annihilation channel from CMB anisotropy results (Slatyer Reference Slatyer2016; Kawasaki et al. Reference Kawasaki, Nakatsuka, Nakayama and Sekiguchi2021), as also shown in Figure 4.
$\omega$
Cen is over 2 orders of magnitude tighter, by virtue of the vastly larger J-factor for globular clusters compared with even nearby dwarf galaxies. Between 0.5 and 2 MeV the limits improve on those obtained for the same annihilation channel from CMB anisotropy results (Slatyer Reference Slatyer2016; Kawasaki et al. Reference Kawasaki, Nakatsuka, Nakayama and Sekiguchi2021), as also shown in Figure 4.
Finally, as already noted, whilst the radio recombination limits presented in Table 3 are useful, they are an order of magnitude poorer than theoretically possible with the observing time that was available, and possibly 2 orders of magnitude less sensitive (in terms of annihilation sensitivity) than the best $\gamma$
-ray observations. The reasons for this are the limitations in our ability to perform spectral calibration in the presence of several effects: (a) differing power levels in the target and references fields; (b) a telescope standing wave with a fundamental of 5.7 MHz which is too close to the width of the lines we are trying to detect (see Section 4); (c) ubiquitous radio frequency interference; and (d) the sub-division of the spectrum into 128-MHz sub-bands which created a large-amplitude 64-MHz pseudo-periodicity.
$\gamma$
-ray observations. The reasons for this are the limitations in our ability to perform spectral calibration in the presence of several effects: (a) differing power levels in the target and references fields; (b) a telescope standing wave with a fundamental of 5.7 MHz which is too close to the width of the lines we are trying to detect (see Section 4); (c) ubiquitous radio frequency interference; and (d) the sub-division of the spectrum into 128-MHz sub-bands which created a large-amplitude 64-MHz pseudo-periodicity.
Reynolds et al. (Reference Reynolds2017) have shown that phased array feeds have the advantage of a wider field of view and almost complete elimination of the standing wave. It is therefore possible that, with a combination of the cryogenic phased array feed currently under construction for the Parkes telescope and more accurate observational and calibration techniques, sensitivity to broad lines can be improved by at least an order of magnitude. Larger telescopes such as FAST, or SKA precursor telescopes on radio-quiet sites, may provide alternative avenues for exploration. If achievable, radio recombination line observations may be a useful alternative to $\gamma$
-ray spectroscopy when greater angular resolution is required. Greater sensitivity should also be possible using high-surface brightness sensitivity spectroscopic observations of lower-n lines in the optical to THz regimes.
$\gamma$
-ray spectroscopy when greater angular resolution is required. Greater sensitivity should also be possible using high-surface brightness sensitivity spectroscopic observations of lower-n lines in the optical to THz regimes.
6. Summary and future work
We have obtained observations with the 64-m Parkes telescope (Murriyang) of the Galactic globular clusters 47 Tuc and $\omega$
Cen in order to measure the amplitude of any positronium (Ps) recombination line radiation, predicted to arise in some Light Dark Matter (LDM) models where the particles self-annihilate.
$\omega$
Cen in order to measure the amplitude of any positronium (Ps) recombination line radiation, predicted to arise in some Light Dark Matter (LDM) models where the particles self-annihilate.
Upper limits to the recombination rates of ${\sim}10^{43} \mathrm{s}^{-1}$
were obtained for both clusters. Using modest values for the likely annihilation cross-section
${\sim}10^{43} \mathrm{s}^{-1}$
were obtained for both clusters. Using modest values for the likely annihilation cross-section $(\langle\sigma v\rangle=3\times 10^{-29} \mathrm{cm}^3 \mathrm{s}^{-1})$
, upper limits to the rms dark matter density and mass of
$(\langle\sigma v\rangle=3\times 10^{-29} \mathrm{cm}^3 \mathrm{s}^{-1})$
, upper limits to the rms dark matter density and mass of ${\sim}50 f_n^{-0.5}$ $(\mathrm{m}_\chi/\mathrm{MeV\, c}^{-2})$ $\mathrm{M}_{\odot} \mathrm{pc}^{-3}$
and
$\mathrm{M}_{\odot} \mathrm{pc}^{-3}$
and ${\sim}1.2\times10^5 f_n^{-0.5}$ $(\mathrm{m}_\chi/\mathrm{MeV\, c}^{-2})$ $\mathrm{M}_{\odot}$
were obtained, respectively. For
$\mathrm{M}_{\odot}$
were obtained, respectively. For $\omega$
Cen, this corresponds to a limit on the self-annihilating light dark matter mass of
$\omega$
Cen, this corresponds to a limit on the self-annihilating light dark matter mass of ${<}30$
% of the stellar mass, assuming a recombination/annihilation ratio,
${<}30$
% of the stellar mass, assuming a recombination/annihilation ratio, $f_n\approx 0.01$
, and a particle mass of
$f_n\approx 0.01$
, and a particle mass of $1\mathrm{MeV\, c}^{-2}$
. Archival INTEGRAL/SPI observations suggest an even smaller limit,
$1\mathrm{MeV\, c}^{-2}$
. Archival INTEGRAL/SPI observations suggest an even smaller limit, ${<}1$
% of the stellar mass.
${<}1$
% of the stellar mass.
Flipping the problem around and using available dynamical models and observational data which suggest a plausible dark-to-luminous ratio of 5% within the half-light radius of the clusters, we can alternatively derive a dark matter annihilation cross-section $\langle\sigma v\rangle <7.9\times 10^{-30} f_n^{-1}\ (\mathrm{m}_\chi/\mathrm{MeV\, c}^{-2})^2 \mathrm{cm}^3 \mathrm{s}^{-1}$
for
$\langle\sigma v\rangle <7.9\times 10^{-30} f_n^{-1}\ (\mathrm{m}_\chi/\mathrm{MeV\, c}^{-2})^2 \mathrm{cm}^3 \mathrm{s}^{-1}$
for $\omega$
Cen from our new recombination results, and
$\omega$
Cen from our new recombination results, and $\langle\sigma v\rangle < 8.6\times 10^{-31}\ (\mathrm{m}_\chi/\mathrm{MeV\, c}^{-2})^2 \mathrm{cm}^3 \mathrm{s}^{-1}$
from an analysis of archival
$\langle\sigma v\rangle < 8.6\times 10^{-31}\ (\mathrm{m}_\chi/\mathrm{MeV\, c}^{-2})^2 \mathrm{cm}^3 \mathrm{s}^{-1}$
from an analysis of archival $\gamma$
-ray limits (Knödlseder et al. Reference Knödlseder2005). The former limits are similar to the recent
$\gamma$
-ray limits (Knödlseder et al. Reference Knödlseder2005). The former limits are similar to the recent $\gamma$
-ray limits derived for Reticulum II (Siegert et al. Reference Siegert2022a) and, for MeV-scale dark matter, the latter limits are stronger than those derived from CMB anisotropies (Slatyer Reference Slatyer2016; Kawasaki et al. Reference Kawasaki, Nakatsuka, Nakayama and Sekiguchi2021).
$\gamma$
-ray limits derived for Reticulum II (Siegert et al. Reference Siegert2022a) and, for MeV-scale dark matter, the latter limits are stronger than those derived from CMB anisotropies (Slatyer Reference Slatyer2016; Kawasaki et al. Reference Kawasaki, Nakatsuka, Nakayama and Sekiguchi2021).
The recombination limits were possible by using the capability of a new ultra-wide-bandwidth low-frequency receiver which enabled sensitive, simultaneous observations over 0.704–4.032 GHz, a frequency range which contains $73\ \mathrm{Psn}\alpha$
recombination lines, though limitations caused by radio frequency interference and coarse filter artefacts only allowed us to stack only a third of these lines simultaneously.
$73\ \mathrm{Psn}\alpha$
recombination lines, though limitations caused by radio frequency interference and coarse filter artefacts only allowed us to stack only a third of these lines simultaneously.
Directions for further radio spectral-line observations include observations of nearby dark matter-dominated dwarf galaxies, particularly those around the Milky Way that have an interstellar medium for moderation of $e^+$
particles. Reticulum II (Bechtol et al. Reference Bechtol2015) is one such candidate. It is preferable to investigate sources without sources of emission associated with strong star formation or black hole activity. Nevertheless, the presence of black holes will produce dark matter density spikes that can substantially boost signal.
$e^+$
particles. Reticulum II (Bechtol et al. Reference Bechtol2015) is one such candidate. It is preferable to investigate sources without sources of emission associated with strong star formation or black hole activity. Nevertheless, the presence of black holes will produce dark matter density spikes that can substantially boost signal.
Thermal recombination lines are usually stronger at higher frequencies, so further investigation at millimetre, THz or even infrared wavebands may be fruitful, as long as high-surface brightness sensitivity is available. Due to better spatial resolution, these may complement $\gamma$
-ray searches. Although low predicted values for the recombination/annihilation ratio disfavours the chances of Ps line detection at radio wavelengths, it is always possible that maser activity due to inverted populations, or absorption against background radiation could boost recombination line strengths by orders of magnitude.
$\gamma$
-ray searches. Although low predicted values for the recombination/annihilation ratio disfavours the chances of Ps line detection at radio wavelengths, it is always possible that maser activity due to inverted populations, or absorption against background radiation could boost recombination line strengths by orders of magnitude.
Acknowledgement
Thanks to the anonymous referee for their helpful comments, and thanks to Ella Wang, Tristan Reynolds, Jonghwan Rhee, Ron Ekers and Roland Crocker who contributed to an earlier precursor project. The Parkes radio telescope is part of the Australia Telescope National Facility which is funded by the Australian Government for operation as a National Facility managed by CSIRO. We acknowledge the Wiradjuri people as the traditional owners of the Observatory site. Parts of this research were supported by the Australian Research Council Centre of Excellence for All Sky Astrophysics in 3 Dimensions (ASTRO 3D), through project number CE170100013.


 Open access