

1. Introduction
Given the growth of Hispanics in the general and older populations, improving financial planning for retirement among Hispanic adults is becoming an increasingly important area of research. Hispanics represented 18 percent of the total population in 2016, and it is projected that by 2060 Hispanics will represent 27 percent (Vespa et al., Reference Vespa, Armstrong and Medina2020). From 2030 to 2060, the Hispanic proportion of the labor force will increase from 22 to 30 percent (Toosi, Reference Toosi2016). Furthermore, among the population 65 years or older, Hispanics will increase from 8 percent in 2020 to 21 percent in 2060 (Administration for Community Living, 2021). Thus, based on these statistics, it is evident that Hispanics represent a large share of the working-age population, who must prepare for retirement, and who will be a large share of the retired population in the future.
Improving knowledge of financial planning for retirement can have a substantial impact on the general well-being of future retired populations. The ICanRetire-Hispanic Segment Experience (ICR-H) digital program sought to improve knowledge of financial planning for retirement and motivate participants to take specific actions to improve retirement preparedness. We contribute to the literature and efforts to improve retirement preparedness among Hispanic workers, a segment of the population that is lagging behind in relation to retirement knowledge and savings.
Our intervention focuses on Hispanic workers who have access to a retirement saving plan through an employer. There are three main contributions to this work. First, to our knowledge, this is among the first digital educational programs on retirement preparedness designed to address the informational needs and cultural context of Hispanic workers.
Second, we evaluate the impact of the digital program on retirement knowledge using the Retirement Knowledge Scale (RKS), which is a reliable and valid measure of retirement knowledge for English- and Spanish-speaking adults in the United States (Blanco and Hays, Reference Blanco and Hays2024). The RKS was designed to measure retirement knowledge in three dimensions of financial planning for retirement: reflection about retirement plans, engagement with information on retirement preparedness, and evaluation of retirement preparedness. We also evaluate the impact of our program on self-reported measures of retirement saving and specific actions taken to financially prepare for retirement.
Third, we provide an analysis of the impact of, and engagement with, the ICR-H digital program among Hispanic and White participants, analyzed separately. The analysis of participants’ experience with our digital program by different ethnic groups is an important contribution to determine the feasibility of implementing retirement preparedness digital programs that are tailored for specific racial and ethnic group at a larger scale.
To evaluate this program, we use a randomized controlled trial (RCT) approach and recruited participants through the Understanding America Study (UAS) Internet panel. We compare the impact of our program among participants in the treatment and control groups, using a Complier Average Causal Effect (CACE) framework with an instrumental variable (IV) approach because we have cases of partial or no compliance among participants in the treatment group. We employ an IV estimation with continuous treatment intensity to estimate the impact of our program on outcome variables related to retirement knowledge, saving, actions, and conversations. We evaluate the interaction of participants with ICR-H digital program (to which the treatment group was exposed to) in comparison to the online materials provided on Capital Group website (the control group was provided this link at the start of the study).
We found that the ICR-H program led to an increase in retirement knowledge among the treatment group compared to the control group. The program had a positive impact on retirement knowledge, specific to how retirement accounts work and the different types of retirement accounts. When we estimated our model for the Hispanic and White participants separately, we found that these results were driven by Hispanic participants. However, when we controlled for the initial value of the dependent variable related to retirement knowledge, most results are no longer significant. The only result robust to the inclusion of initial values of the dependent variables is the impact of our program on engagement with printed materials on information about financial planning for retirement among Hispanic participants. These findings suggest that while the intervention improved retirement knowledge overall, much of this effect reflects baseline differences.
Regarding the impact of our program on retirement savings, and program’s impact heterogeneity, we have several relevant findings. First, we do not observe a significant impact on retirement saving for the full sample or for the Hispanic and White subsamples. Second, among Hispanic participants, our program had a significantly more positive effect on the monthly percentage of household income saved for retirement (measured as the percentage-point change between baseline and follow-up) among those aged 50 and older compared to younger participants. Third, for the full sample and White subsample, the program had a significantly more positive effect on retirement savings using the same measure among high-income participants compared to low-/mid-income participants. Fourth, we find that our program is associated with higher probability of increasing retirement savings at follow-up for White participants with lower levels of financial literacy compared to those with higher levels of financial literacy.
We also found that our digital program had a statistically significant positive impact on specific actions related to retirement preparedness, such as participants checking their own retirement saving plan online. For Hispanic participants, we find that our program led to thinking how much you need to save for retirement. We found that those in the treatment group were more likely to interact with online material about retirement preparedness than those in the control group during the 8-week period of our program. We also found similar program experiences with educational material for Hispanic and White participants who were in the treatment group and were exposed to the ICR-H intervention.
The remainder of this paper is organized as follows. We provide next a brief literature review on retirement preparedness and educational intervention focused to improve retirement preparedness among Hispanic adults in the United States. We then describe the ICR-H digital program, present the data and methodology, elaborate on the results of our analysis, and provide a conclusion and discussion of our findings and their applications for stakeholders.
2. Literature review
2.1. Retirement preparedness among Hispanic adults
Most adults in the United States are underprepared for retirement, where Hispanic adults lag White adults in retirement preparation. According to the 2024 Survey of Household and Economic Decision-making, while 68 percent of White adults reported having a retirement saving account, only 46 percent did so among Hispanic adults. The same survey shows also that among White adults, 41 percent felt that their retirement savings were on track, but only 23 percent of Hispanic adults thought so (Federal Reserve, 2025). Similarly, according to the 2020 Survey of Income and Program Participation, Hispanic adults lag behind White adults in retirement account ownership. Among Hispanic adults, only 28 percent own a retirement account, a lower proportion than that for any other racial or ethnic group, and much lower than what observe among White adults (54% of White adults have such an account, Hoffman et al., Reference Hoffman, Klee and Sullivan2022).
Preparation for retirement also differs by income level, with implications for the financial well-being of the Hispanic population in older ages. In the last decade, according to data from the Survey of Consumer Finances, at least 80 percent of those in the top half of the income distribution had a retirement plan, compared to 40 percent of those in the bottom half, with little change in those numbers over time (Bhutta et al., Reference Bhutta, Bricker, Chang, Dettling, Goodman, Hsu, Moore, Reber, Volz and Windle2020). The same data show that the before-tax median income for Hispanic adults in 2019 represented 60 percent of White adults. Ethnic differences in retirement preparedness related to saving are marked in the United States, as we observe Hispanic adults are more likely to fall in the bottom half of the income distribution, in comparison to White adults. Regarding financial knowledge, and in knowledge specific to retirement, Hispanic adults lag White adults (Lusardi, Reference Lusardi2005; Richman et al., Reference Richman, Sun, Sena and Chun2015; Lusardi and Mitchell, Reference Lusardi and Mitchell2023; Blanco and Hays, Reference Blanco and Hays2023, Reference Blanco and Hays2024; Blanco et al., Reference Blanco, Garcia, Gulbins and Gutierrez2024, Reference Blanco, Choi and Hays2025).
To improve retirement preparedness among Hispanic adults in the United States, two important areas must be addressed: access to retirement saving plans and knowledge related to financial planning for retirement. Financial knowledge is associated with better financial decisions, which in turn leads to higher wealth accumulation, retirement preparedness, and financial well-being in retirement (Lusardi and Mitchell, Reference Lusardi and Mitchell2011; Carter and Skimmyhorn, Reference Carter and Skimmyhorn2018). In fact, there is evidence of a causal relationship between financial knowledge and retirement planning, with those having higher levels of financial knowledge showing better retirement preparedness (Lusardi and Mitchell, Reference Lusardi and Mitchell2017; Angrisani et al., Reference Angrisani, Burke, Lusardi and Mottola2020).
Hispanic adults in the United States, in comparison to other racial and ethnic groups, face specific barriers to financial planning and saving for retirement from the supply and demand side that are unique to them. From the demand side, there are behavioral barriers related to language, social norms, and culture. Acquiring financial knowledge can be costly for low-income populations, and this cost is higher when educational materials are not linguistically and culturally tailored to meet the informational needs of Hispanic adults (Lusardi et al., Reference Lusardi, Michaud and Mitchell2017; Blanco et al., Reference Blanco, Duru and Mangione2020). Family experiences, religiosity, and denial of retirement are associated with low levels of retirement preparedness among Hispanic older adults (Blanco et al., Reference Blanco, Aguila, Gongora and Duru2017).
Social networks influence retirement preparedness, with Hispanic older adults showing lower levels of retirement knowledge and being less likely than White older adults to talk to family, friends, and a financial professional about retirement preparedness (Blanco et al., Reference Blanco, Choi and Hays2025). Furthermore, Hispanic adults in the United States distrust financial institutions to a greater extent than other racial and ethnic groups (Blanco et al., Reference Blanco, Ponce, Gongora and Duru2015; Barcellos and Zamarro, Reference Barcellos and Zamarro2021). Distrust of financial institutions is associated with lower levels of participation in retirement saving plans offered by financial institutions.
Barriers to financial planning for retirement on the supply side are also prevalent for Hispanic adults in the United States. They are related to access to retirement saving accounts by an employer or through a state-sponsored retirement plan. Geography influences access to retirement savings, where only 15 states have active state-sponsored retirement plans (ADP, 2025). In fact, Hispanic workers are less likely than White workers to have access to an employer-sponsored retirement account (Francis and Weller, Reference Francis and Weller2021; Weller et al., Reference Weller, Francis and Tolson2024). Another important geographic difference that leads to different incentives for saving for retirement is that states have different asset limits for participation in government programs and differ by whether they exclude retirement accounts from the asset test for benefit programs (Chen and Lerman, Reference Chen and Lerman2005; Burnside and Fairbanks, Reference Burnside and Fairbanks2023; Roll et al., Reference Roll, Despard and Zhang2025). The lack of flexibility in using retirement saving plans for emergencies without a penalty can discourage participation in such programs among households who have tight budget constraints and variable income (Goda et al., Reference Goda, Jones and Ramnath2022; Goodman et al., Reference Goodman, Hahn and Greig2025).
We also recognize that Hispanic adults represent a heterogeneous group in the United States, with differences in access to retirement knowledge and networks based on the country of origin. Further research on retirement preparedness among Hispanic workers who have migrated from different countries in Latin America is warranted to understand better supply and demand side barriers to retirement saving and planning.
2.2. Educational programs to improve retirement preparedness among Hispanic adults
Educational interventions and nudges to improve retirement knowledge and preparedness in the United States have proven to be effective (Duflo and Saez, Reference Duflo and Saez2003; Lusardi et al., Reference Lusardi, Keller and Keller2009; Collins and Urban, Reference Collins and Urban2016; Clark et al., Reference Clark, Hammond, Morrill and Khalaf2017; Kaiser et al., Reference Kaiser, Lusardi, Menkhoff and Urban2022). While there is extensive work on interventions on retirement preparedness in the United States, interventions that focus on digital educational programs and that are tailored to different racial, ethnic, or gender groups are scant.
We searched the literature and found three digital interventions that aim at improving retirement preparedness in the United States. Collins and Urban (Reference Collins and Urban2016) evaluated an online educational intervention among employees in 45 credit unions in Wisconsin. They found that after 1 month there was a 6 percentage-point increase in retirement savings among those who received the intervention. Similarly, Goda et al. (Reference Goda, Levy, Flaherty Manchester, Sojourner, Tasoff and Xiao2023) implemented an educational intervention involving an online retirement calculator. They found that the online calculator was helpful in retirement preparation, but that the impact of the intervention was larger for individuals with higher levels of financial knowledge. Clark et al. (Reference Clark, Lin, Lusardi, Mitchell and Sticha2025) evaluated a digital financial educational program among middle-aged and older adults in the UAS focused on three topics related to retirement saving: compound interest, risk diversification, and inflation. They found that the program led to improvements on financial knowledge, but no impact on financial behavior at 8 months.
Viceisza et al. (Reference Viceisza, Calhoun and Lee2023) documented differences in engaging and acquiring retirement knowledge among racial and ethnic groups. Efforts to address racial and ethnic differences in retirement planning and preparedness must address these differences in retirement knowledge. We searched the literature for specific educational programs in retirement preparedness tailored to meet the needs of Hispanic adults and found two.
Blanco et al. (Reference Blanco, Duru and Mangione2020) conducted a community-based RCT to promote retirement saving and knowledge among Hispanics through an in-person class. The YoPlaneoMiRetiro (‘I plan my retirement’) program sought to have participants open a myRA (my Retirement Account), a government-sponsored retirement savings account that worked as a Roth Individual Retirement Account. Blanco et al. (Reference Blanco, Duru and Mangione2020) found that the educational program was effective in increasing myRA program participation, as well as knowledge about retirement preparedness.
There is also a digital program on retirement preparedness that was tailored to meet the informational needs of Black and Hispanic workers led by Blanco and Viceisza (Reference Blanco and Viceisza2023). Their primary goal was to design and pilot a digital outreach program intended to improve retirement knowledge and preparedness among low-to-moderate income Black and Hispanic workers. Blanco and Viceisza (Reference Blanco and Viceisza2023) study the impact of such intervention, focusing on workers who are less likely to have access to a retirement account through an employer.
3. ICR-H program
3.1. Program background and design
The ICR-H digital program was tailored to meet the informational needs of Hispanic workers while accounting their cultural context and influences. The ICR-H program curriculum and materials were designed by the Capital Group team based on their market research and two proprietary studies specific to Hispanic adults’ experiences related to retirement preparedness (Capital Group, 2022a, 2022b). The ICR-H program materials design was informed by previous interventions and experiments to increase retirement knowledge among this group (Blanco et al., Reference Blanco, Duru and Mangione2020; Blanco and Rodriguez, Reference Blanco and Rodriguez2020). The ICR-H digital approach design was also informed by a digital program in financial capability that was specifically tailored to Hispanic adults (Blanco et al., Reference Blanco, Hernandez, Thames, Chen and Serido2023). Additionally, the ICR-H program was tailored to meet the informational needs of workers who are more likely to have access to a retirement account through their employer.
To learn more of the unique needs, motivations, and behaviors of Hispanic adults toward retirement planning, Capital Group (2022a) conducted an ethnographic study taking a mixed-methods approach. For this exploratory study, there was an extensive review of the literature and data were collected among an online community of 45 consumers, 10 virtual interviews, and 8 in-depth, in-home, activity-centric discussions about retirement preparedness. Capital Group (2022b) also conducted a pilot study to test the material developed for ICR-H through an online survey among 480 Hispanic adults 25–64 years old. This initial evaluation showed that the curricula developed for the ICR-H digital program had positive impacts toward retirement plan enrollment.Footnote 1
The ICR-H program materials design was also validated and informed by previous interventions and experiments to increase retirement knowledge among this group (Blanco et al., Reference Blanco, Duru and Mangione2020; Blanco and Rodriguez, Reference Blanco and Rodriguez2020). To illustrate how the program material and activities were tailored to the target population, we discuss here the first video in the program about ‘Emily’s’ experience. Emily, a working Hispanic woman, shared in the video how lost she felt about retirement saving plans at her first job. She also shared an important barrier she had to overcome: the feeling that she did not have enough money to save for retirement. This video emphasized how saving toward retirement helped Emily to save on tax payments and to take advantage of employer matches. Emily also shared in the video that she was happy with her retirement saving plan and the savings she had accumulated. Emily’s video was centered on the message of peer influence, with a focus on injunctive norms. Focusing on injunctive social norms in this context means providing a message of ‘what should be done’ for retirement savings and ‘what is the social reward’ from saving for retirement (Blanco and Rodriguez, Reference Blanco and Rodriguez2020).
3.2. Program structure and activities
ICR-H program was an 8-week digital program, where participants received one text message and one email at the beginning of the week inviting them to complete specific activities online (with a reminder message/email in mid-week to complete program activities). Participants were asked to read information, watch short videos, complete a quiz that debunks myths on the topic of retirement, use a retirement calculator, and use a discussion guide provided at the end of program to start conversations with family members about financial planning for retirement. In Supplementary Appendix 1, we provide screenshots of examples of the text messages and emails. Supplementary Appendix 2 includes the outline of the program curriculum and an example of a screenshot of the digital experience for the first week.Footnote 2
Activities for our digital learning experience were interactive, simple, and short. Participants were expected to spend 3–5 minutes per week reviewing the material. The ICR-H program structure was similar to the digital financial education program Mind Your Money (Blanco et al., Reference Blanco, Hernandez, Thames, Chen and Serido2023). Participants received a text message and an email that included a link to the material for that specific week. Our digital experience allowed participants to move to other weeks once they landed in the assigned material for a specific week. Participants could also explore the icanretire.com website further once they landed in the digital experience we provided for the program. Participants had flexibility in completing program activities, including the freedom to complete different weeks, without being forced to complete unfinished material from previous weeks.
The weekly message with the topic of the week and the link to the digital experience was sent by text and email each Tuesday. Emails provided information of the weekly material and the link where participants should access the digital experience for the assigned activity of the week. Participants also received a reminder to complete program activities on Thursday. At the end of the fourth week, we sent participants a nudge message by text and email that congratulated them for being part of the program (message included in the Supplementary Appendix 1). This message also encouraged them to gather information about their retirement saving plans and evaluate if they could increase their contributions to their retirement saving plan, noting ‘Saving a little more today can grow into a lot more when you retire.’
4. Data and methodology
4.1. Recruitment
We evaluated the ICR-H digital program with an RCT approach and recruited participants through the UAS Internet panel. We assigned participants randomly to the treatment and control groups, where these groups received different messaging and information. We recruited Hispanic and White adults in the UAS with the purpose to evaluate the effect of our program among Hispanic adults and relative to White adults. We conducted a screening survey and recruited among participants who were currently working and had access to an employer-provided retirement savings plan (inclusion criteria). We excluded participants who did not have access to such a plan through their employer because their informational and motivational needs differed from those of participants who did.
We conducted our screening survey in March 2023, and participants completed consent and initial survey between April 19 and May 14, 2023. Our 8-week digital program took place from May 15 to July 9, 2023. Participants completed the follow-up survey at the end of program between July 10 and July 23, 2023. Our study was approved by the Institutional Review Board at Pepperdine University (IRB protocol # 23-01-2076). Our RCT was also registered in the American Economic Association (AEA) RCT registry (AEARCTR-0011338).
Figure 1 presents the flow diagram for our program evaluation as an RCT. We screened a total of 818 UAS participants, of whom 324 were Hispanic adults and 494 were White adults. Based on our inclusion criteria, we invited 264 Hispanic adults and 293 White adults to participate in our study (557 participants in total). Of those invited to participate, 337 gave consent and completed our baseline survey. Of these 337 participants, we had to drop 1 participant from the control group who had access to the program material through a treatment group member in the same household. Altogether, we had 336 participants at baseline, 166 in the treatment group and 170 in the control group.
ICanRetire-Hispanic segment intervention flow diagram.

Figure 1 Long description
The flowchart outlines the process of participant selection and intervention in a study. It begins with ′Completed screening survey′ with 818 total participants, including 324 Hispanic and 494 White adults. From these, 261 were excluded for not meeting inclusion criteria. ′Invited to participate′ includes 557 participants, 264 Hispanic and 293 White. One participant was excluded for having access to intervention materials. The ′Baseline′ consists of 336 participants. The ′Treatment′ group has 166 participants, 89 Hispanic and 77 White, receiving an 8-week digital program. The ′Control′ group has 170 participants, 86 Hispanic and 84 White, with no intervention. At ′Follow up′, the ′Treatment′ group has 148 participants, 77 Hispanic and 71 White, completing the survey. The ′Control′ group has 158 participants, 76 Hispanic and 82 White, completing the survey without intervention.
At the conclusion of the 8-week program, we had 306 participants completing the follow-up survey: 148 in the treatment group and 158 in the control group. Among those who completed the follow-up survey, our responses were evenly distributed among Hispanic and White adults. We had a high completion rate for our follow-up survey, with 89 percent for the treatment group and 93 percent for the control group. Among Hispanic participants, completion rates were 87 and 88 percent for the treatment and control groups, respectively. Among White participants, completion rates were 92 and 98 percent for the treatment and control groups, respectively. We include in the Supplementary Appendix 3 our baseline survey and added questions in the follow-up survey for our program experience outcomes of interest (survey routing format).
4.2 Digital intervention evaluation design and outcomes
Participants were assigned randomly to the treatment and control groups using Stata, where we stratified among Hispanic and White participants. To evaluate the effectiveness of the program, we provided the treatment group with the ICR-H 8-week digital program as a guided learning experience. Treatment group participants received weekly messages via text and email inviting them to complete program material.
The control group only had access to information on retirement preparedness taking a ‘business as usual’ approach. Control group participants only received one initial message sent via email and text inviting them to explore the ICanRetire website. The message to the control group stated, ‘Thanks for your participation in the ICanRetire program! We invite you to explore the ICanRetire website to learn more about retirement HERE: icanretire.com. Thanks, ICanRetire Team.’ The control group received a link to the main ICanRetire website but did not have access to the tailored material shared with the treatment group or receive weekly messages to complete learning activities.
The ICR-H digital program guided treatment participants through the learning process about retirement preparedness and covered information relevant to Hispanic adults, addressing their informational needs and cultural context. In our analysis, we compare what the program taught participants to what they might have themselves learned online without a guided digital program like ICR-H that was created for Hispanic workers.Footnote 3 Evaluating our program this way provides insights on how employers could incorporate a structured digital program to improve retirement knowledge and preparedness among their employees, but particularly among Hispanic employees.
We provided treatment participants with the specific link that would take them to the material of the week, and participants were able to explore other materials once they were in the program website. Because participants in the treatment group had flexibility in completing weekly activities, their completion rates for program activities varied. Participants were not forced to complete the previous week activities in order to complete the specific week activity that they were invited to complete (i.e., partial compliance). We were able to track the activities participants completed online, and therefore, were also able to evaluate our program in the context of partial compliance and participants’ experience with online material.
We evaluated the impact of our program on different outcomes that can be grouped in three categories: (1) the RKS, (2) self-reported retirement savings, and (3) specific actions related to retirement preparedness. Our evaluation of the impact of our program was conducted for the full sample and for Hispanic and White participants separately.
We used the RKS, designed by Blanco and Hays (Reference Blanco and Hays2024), to measure changes in retirement knowledge. The RKS consists of 10 questions that assess three aspects of financial planning for retirement: reflection about retirement plans, engagement with information on retirement preparedness, and evaluation of retirement preparedness. We evaluate the impact of our program on the overall scale, the subscales, and each component of the scale.
We also evaluated whether the participants showed an increase on what they were saving for retirement. Following the structure of the retirement saving questions from the Health and Retirement Study, we had some participants providing information of how much they save for retirement as a percentage of income and others expressed as total amount annually, monthly, or biweekly. Using these data, we constructed two variables. First, we constructed a dummy variable equal to 1 if there is an increase in retirement saving either expressed as the percentage of income or as an amount between baseline and follow-up survey. Second, we constructed a retirement saving variable expressed as the percentage of household income saved monthly. For this variable, we used the percentage provided by participants and calculated the amount saved per month as percentage of household income provided in baseline survey for those who provided an amount (biweekly or annual amount saved). Thus, this adjusted variable includes the percentage of income saved for all available observations.
We also collected information on actions taken to improve retirement preparedness, asking participants about whether they took 10 specific actions or talked to someone about financial planning for retirement. Here, we evaluate the impact of the program on each individual action. We also evaluate how participants might have talked about retirement preparedness, comparing the treatment and control groups at the end of the program. Data about specific actions are collected in the follow-up survey, so that we are able to track whether participants took any of those actions in the previous 8 weeks during the duration of the study. Please refer to Table A1 in the Supplementary Appendix 4 for a description of all variables used in our analysis.
4.3. Program experience outcomes
To assess program’s impact on participants’ interactions with online information, we evaluated the difference in the number of times a participant reviewed information on the website (control) or completed a program activity online (treatment) at least one time per week (i.e., average number of weeks a participant reviewed information related to retirement preparedness online). Recall that participants in the control group received one initial message in week 1 with a link to the general website only, and participants in the treatment group received weekly invitations and reminders to complete ICR-H program activities for 8 weeks.
We tracked participants’ program experience in the general website and in the tailored digital experience. We were also able to track participants’ clicks on links in text and emails and their interaction with the material online. We also tracked whether participants in the treatment group completed each weekly activity on the website. We evaluated outcomes specific to participants’ program experience, such as engagement with the program and usefulness and familiarity with the information covered in the weekly activities. We have a special interested on evaluating whether program experiences among Hispanic and White participants are similar or different.
We asked treatment group respondents specific questions for each weekly activity, including whether they recalled completing the weekly activity and the usefulness of the material covered. To avoid biased results given by participants, we compared participants’ responses regarding weekly activity completion with program records and evaluated responses on material usefulness only for whom claimed activity completion was confirmed. Given program flexibility, we considered a participant to have completed an activity if we observe that the participant clicked on the weekly material on the website. We also collected specific statistics on completion of activities, such as whether participants watched any of the videos completely, 75 percent of it, or 50 percent of it.
4.4. Estimation strategy for program impact evaluation
Given our RCT approach, where treatment noncompliance and partial compliance are present, we evaluated the impact of our program taking a CACE approach, with an IV. The CACE or Local Average Treatment Effect from Imbens and Angrist (Reference Imbens and Angrist1994) assigns participants to four strata based on assignment and compliance. With this approach, we used the treatment assignment as an instrument with a two-stage least squares (2SLS) to get CACE estimates. The CACE estimation approach is preferred over the Per-Protocol analysis that will exclude participants who did not comply with the study protocol. We designed the program as an 8-week program, and if we would have taken a Per-Protocol analysis approach, we would have to keep only those who completed the program in its entirety. This would create biased results and also reduce our sample significantly.
Papazoglou et al. (Reference Papazoglou, Waddingham and Young2025) show that the IV estimator is less biased, in comparison to the Per-Protocol estimator, when participants with better conditions always received the treatment and participants with worse conditions always receive the control, or vice versa. In Supplementary Appendix 4, Table A2, we present the means of the retirement knowledge and saving-related variables for the treatment and control groups for the full sample, and for Hispanic and White participants separately. In Supplementary Appendix Table A2, we observe that our data meet the condition for IV estimator to be less biased, in comparison to the Per-Protocol analysis, because the treatment group shows higher levels of the RKS than the control group for the full sample.
Using a CACE framework with an IV approach, we estimated our model for the retirement knowledge, savings, actions, and conversations outcome variables. Participants in the control group – except for one individual who was excluded from the analysis due to access to program activities – were not exposed to the treatment. In the treatment group, compliance varied. Participants in the treatment group received a text message that invited them to complete a specific weekly activity, but they were not required to complete activities from previous weeks to complete an activity from the current week. Additionally, once participants reached the digital experience online, they were able to explore other weekly activities. Since we tracked participants’ interactions with ICR-H digital experience, we constructed a compliance variable ranging from 0 to 1. We assigned values based on the number of completed activities as follows: 0–1 activities: 0; 2–3 activities: 0.25; 4–5 activities: 0.5; 6–7 activities: 0.75; and 8 activities: 1.
We implement a 2SLS regression for our IV estimation. In the first stage, we regress the compliance variable on the assigned treatment indicator. In the second stage, we estimate the impact of predicted compliance on the dependent variable measured in period 2, controlling for individual characteristics, such as race/ethnicity, gender, age, citizenship, US birthplace, coupled household status (married or living with a partner), educational attainment, household income, hours worked per week, and full-time employment status.
4.5. Model specification for program impact evaluation
Following Papazoglou et al. (Reference Papazoglou, Waddingham and Young2025), the following equations represent the two regression models we estimated for the CACE framework, where we take an IV estimation approach with continuous treatment intensity:
 \begin{equation}{\hat D_i} = {\text{ }}{\hat \alpha _o} + {\alpha _1}{Z_i}\end{equation}
 \begin{equation}{Y_i} = {\hat \beta _o} + {\hat \beta _1}{\hat D_l} + \sum\nolimits_{j = 1}^J {{\gamma _j}} {X_{ij}} + { \in _i} \cdot \end{equation}
 In Equation (1),  ${\hat D_i}$ denotes the treatment receipt variable, which accounts for program compliance (values assigned based on the number of program activities completed, such as 0, 0.25, 0.5, 0.75, and 1) in period 2 for participant i. This variable is regressed on ${Z_i}$, which denotes the treatment assignment variable (equal to 1 if participant is in the treatment group, 0 otherwise). In Equation (2), ${Y_i}$ denotes the primary outcome, and ${\hat \beta _1}$ denotes the coefficient of interest that captures the impact of program, because we regressed on the predicted treatment receipt value represented by ${\hat D_i}$. In Equation (2), ${\gamma _j}$ represents the individual-specific observed characteristics controlled for in the estimation by including the control variables ${X_{ij}}$. In Equation (2), ${ \in _i}$ represents the error term for participant i.
For our estimations using the levels of the RKS, its subscales, and items, we estimated, for robustness, our model with the baseline value of the dependent variable as an independent variable. This approach helps us account for significant differences between the treatment and control groups at baseline as shown in Table A2 (Supplementary Appendix). For all other dependent variables, we do not see a need to include their initial values as independent variables, given their definitions. ‘Retirement savings increase, dummy’ is a dummy variable equal to 1 if we observe an increase in retirement savings, 0 otherwise. ‘Retirement savings increase, percentage’ is a variable that denotes the percentage-point difference in retirement savings expressed as a percentage of income between the baseline and follow-up. The dependent variables related to actions/conversations are dummies equal to 1 if the participant took a specific action or had a conversation in the last 8 weeks, expressed in the follow-up survey.
We used Cohen’s approach to evaluate the effect size of the impact of our program. We calculate Cohen’s d statistic in Stata for all estimations where our intervention has a statistically significant effect, at least at the 5 percent level. Following the guidelines suggested by Cohen (Reference Cohen1988), the standardized effect size of d = 0.2 is considered small, d = 0.5 is considered medium, and d = 0.8 is considered large.
We also analyzed the impact of our program in the context of heterogeneity related to income, age, and initial levels of financial literacy and retirement knowledge. We conducted this analysis of heterogenous impacts of the program on retirement savings by interacting our treatment variable with variables that account for these differences.
To account for income heterogeneity, we created a high-income dummy equal to 1 if the participant had a household income $100,000 or above, equal to 0 otherwise. To evaluate heterogeneity by age, we constructed three dummy variables that accounted for different age-groups: (1) under 40 years old, (2) 40–49 years old, and (3) 50 years or older. We also evaluate heterogeneity in the program’s impact on retirement savings by gender, but find nonsignificant differences across gender groups (results not included for the purpose of space).
To evaluate heterogeneity in the program’s impact on financial literacy, we follow Goda et al.’s (Reference Goda, Levy, Flaherty Manchester, Sojourner, Tasoff and Xiao2023) approach. We construct the Financial Literacy Score (FLS) using the three big questions on financial literacy. Given that the effect of financial literacy on retirement saving is likely not continuous, we estimated our model with an interaction term between the treatment variable and a high-FLS dummy variable that equals to 1 if the FLS is above or equal to the median, 0 otherwise. We also interact our treatment variable with the RKS, and estimated our model with an interaction term between the treatment variable and a high-RKS dummy variable equal to 1 if RKS is above or equal to the median, 0 otherwise.
4.6. Program experience evaluation approach
We evaluated differences between the treatment and control groups on the average number of weeks that participants visited the website/digital experience at least once per week during program duration (8-week period) conducting a two-sided t-test, for the full sample and for Hispanic and White participants separately. We also evaluated differences between the control and treatment groups on their perceptions of the usefulness and familiarity of the program information, retirement confidence and knowledge, and taking an action for all participants and ethnic subgroups.
We conducted an analysis with data from the treatment group about their perceptions of usefulness of weekly material, where we were able to check if their answer on whether they completed a specific weekly activity matched our records in the program website. Given the nature of our intervention, which was tailored to meet the informational needs of Hispanic workers, we also evaluated whether there were differences between Hispanic and White participants in program engagement and experience.
4.7. Summary statistics
Table 1 shows summary statistics for sociodemographic characteristics for the full sample, as well as for the treatment and control groups separately. We compared the characteristics of the treatment and control groups using t-tests. We found no statistically significant difference at the 5 percent level for any of sociodemographic variables among the treatment and control groups.Footnote 4 We also provide in Table 1 summary statistics for sociodemographic characteristics between the control and treatment groups for Hispanic and White participants, separately. There were no statistically significant differences in sociodemographic characteristics between the treatment and control groups among Hispanic participants. Among White participants, those in the treatment group were more likely to have more than a college degree than those in the control group.
Characteristics for control and treatment groups for full sample and by race/ethnicity, percentages, and means

Table 1 Long description
The table compares baseline demographic, education, employment, work hours, and income characteristics for treatment versus control groups in the full sample and separately for Hispanic and White participants. In the full sample, most characteristics are closely matched: 62 percent female, average age about 44, 96 percent US citizens, 82 percent born in the United States, and 70 percent in coupled households. Education in the full sample is similar across groups, with a modest imbalance where the treatment group has more than college education (30 percent) than the control group (21 percent). Employment is nearly universal at 98 percent, with most working full time (92 percent) and averaging about 41 hours per week; treatment and control differences are small. Income is concentrated at 100,000 dollars or more (about half of participants) with similar distributions between treatment and control overall. Within the Hispanic sample, treatment and control are also similar; the largest visible difference is coupled households (67 percent treatment versus 77 percent control), while education, employment, hours, and income are otherwise close. Within the White sample, the clearest imbalance is education: more than college is higher in treatment (44 percent) than control (24 percent), alongside a shift away from the 60,000 to 99,999 income group in treatment (18 percent) compared with control (30 percent). Reported differences are accompanied by p-values from two-sided tests, so small percentage-point gaps may not indicate meaningful imbalance.
Notes: We conducted a two-sided t-test to determine whether there are statistically significant differences between the treatment and control groups for the different samples. Please refer to Table A1 in the Supplementary Appendix for variables’ full description. ‘p/w’ denotes per week.
We checked whether there were statistically significant differences between those that completed the follow-up survey and those that did not, and we included estimates in the Supplementary Appendix 4, Table A3. The only significant differences shown in the Supplementary Appendix Table A3 were that completers of the follow-up survey were more likely to be older and Hispanic. Among Hispanic participants, those who completed the follow-up survey were more likely to have completed high school, in comparison to those who did not complete follow-up survey. Among White participants, those who completed the follow-up survey were older than those who did not.
We had a small percentage of attrition for completion of the follow-up survey for the full sample (9%), where the attrition rate was higher for Hispanic participants in comparison to White participants (13% vs 5%). We also compared sociodemographic characteristics of White and Hispanic participants that completed the follow-up survey and include these estimates in the Supplementary Appendix Table A3. Among those who completed the follow-up survey, White participants, in comparison to Hispanic participants, were older, more likely to be born in the United States, show higher levels of educational attainment and income, and work more hours.
In Supplementary Appendix 4, Table A4 shows the means (and standard deviations) of the retirement knowledge and saving-related variables at baseline. For all but one of these variables (attending a workshop or class), Hispanic participants scored lower than White participants at baseline, and the differences were statistically significant.
5. Results
5.1. ICR-H program impact evaluation
5.1.1. Retirement knowledge
In Table 2, we present the IV estimates for the treatment coefficients when using the RKS (RKS-Total), subscales, and 10 items as dependent variables. The ICR-H program had a positive and statistically significant impact on the RKS-Total for the full sample. The program’s positive impact on RKS-Total is driven by improvements in the RKS evaluation subscale, particularly in knowledge of how retirement accounts work and the different types of retirement accounts. We also observe that the program had a positive impact on the RKS item that measures reading-related information to retirement from a printed source.
IV estimates for primary outcomes related to retirement preparedness knowledge
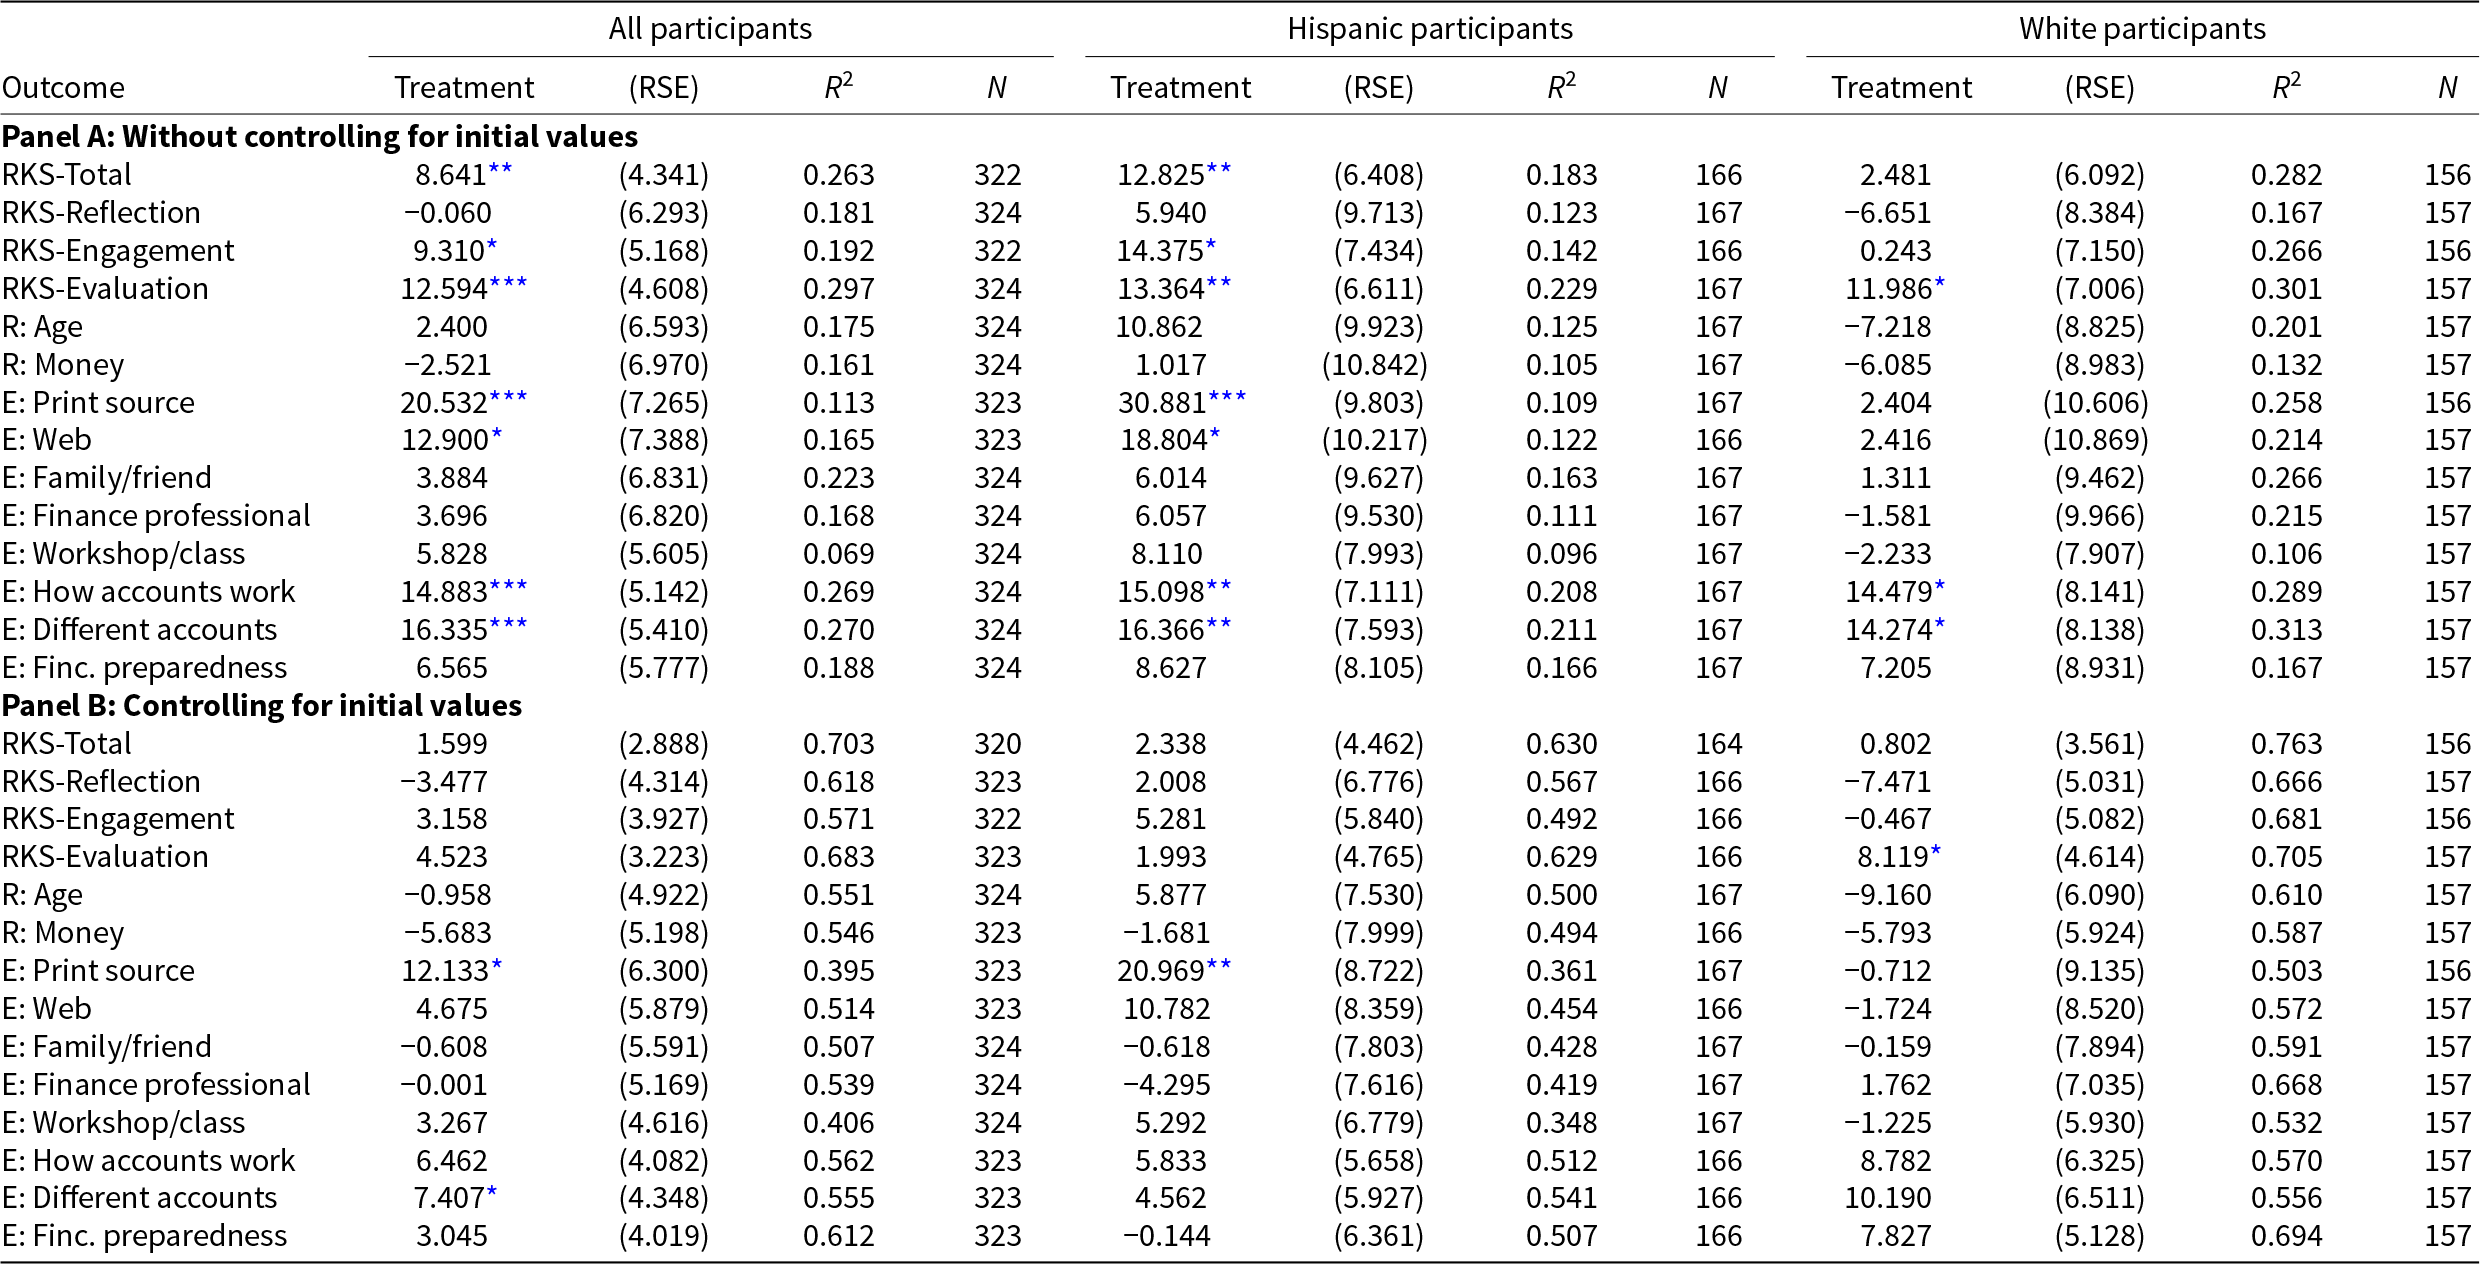
Table 2 Long description
The table reports instrumental-variables treatment effects on retirement preparedness knowledge outcomes for all participants and separately for Hispanic and White participants, with robust standard errors, model fit, and sample sizes. Panel A (no baseline outcome control) shows significant gains in the overall knowledge score for all participants (about 8.6 points) and Hispanic participants (about 12.8 points), while the White subgroup estimate is small and not statistically significant. In Panel A, engagement-related outcomes drive many gains: print sources and web sources increase strongly for Hispanics (about 30.9 and 18.8 points), and understanding how accounts work and different account types rises for all groups (roughly 14 to 16 points, often statistically significant). Evaluation also increases in Panel A for all participants and both subgroups (about 12 to 13 points for all and Hispanics, about 12 points for Whites). Reflection outcomes such as age and money items show little consistent change and are generally not statistically significant. Panel B (with baseline outcome control) shows much smaller and mostly non-significant treatment effects across outcomes, with the main exception of evaluation for White participants (about 8.1 points) and a smaller positive effect for print sources among all participants and Hispanics. Model fit is substantially higher in Panel B than Panel A, consistent with baseline outcomes explaining much of the variation. Interpretation should emphasize that apparent impacts in Panel A attenuate after accounting for initial outcome levels, and subgroup differences are based on smaller samples.
Notes: We estimate the IV model with the CACE approach. We included the following control variables: female, age, US citizen, born in the United States, coupled household, college and/or associate degree, higher than college degree, income groups ($35,000–$59,999, $60,000–$99,999, $100,000 or more), work full time, and hours worked per week. Panel A specifications do not control for lagged dependent variables, and Panel B specifications control for the lagged dependent variable, which is statistically significant in all models. Please refer to Table A1 in the Supplementary Appendix for variables’ full description. RKS = Retirement Knowledge Scale. ‘R’ denotes items related to the Reflection dimension. ‘E’ denotes items related to the Engagement dimension.
Robust standard errors in parentheses. Statistical significance denoted at* p<0.10, ** p<0.05, *** p<0.01.
When we estimate the impact of the ICR-H program separately for Hispanic and White participants, we observe that the program’s impact appears to be driven by its effect on Hispanic participants. We do not observe any significant impact of the program when we estimate our model for the different dependent variables among White participants only. The IV estimates in Table 2 for the Hispanic sample show the same results we observe for the full sample regarding significance, but of greater magnitude.
To assess the robustness of these program effects, we estimate our model using the same dependent variables, including the value of the dependent variable at baseline (initial value). Table 2 shows our model estimates with initial values of the dependent variable in Panel B. Interestingly, most of the significant effects in Panel A disappear when we control for initial values of the dependent variables. When we control for initial levels of the RKS-related variables, we found that our program has a robust, significant effect on engagement with printed materials among Hispanic participants, with an impact of medium effect size (Cohen’s d = 0.61).
Summarizing the impact of our program on the retirement knowledge-related variables, we observe that our intervention appears to be more effective among Hispanic participants (Panel A), as we expected. Nonetheless, our findings from Panel B show that these results were driven by reaching participants with lower baseline retirement knowledge. A relevant, robust, and significant effect of our program is that Hispanic participants were more engaged with printed sources on retirement planning.
5.1.2. Retirement savings
We also asked participants at baseline and follow-up surveys if they were saving for retirement and how much were they saving. As discussed before, this is a self-reported measure, where we use a variable that captures any increase on retirement saving as dummy variable equal to 1 if there is an increase between baseline and follow-up values (Ret. Sav. Inc. Dum), 0 otherwise, and a variable that captures the percentage difference, between baseline and follow-up, of the continuous variable that denotes percentage of household income saved for retirement monthly (Ret. Sav. Inc. %).
We present results for the IV treatment coefficients for the impact of program on retirement savings in Table 3 (Panel A). We observe that our program had no impact on retirement savings on either measure for the full sample and also when we estimate the model for Hispanic and White participants separately.
IV estimates for outcomes related to retirement saving
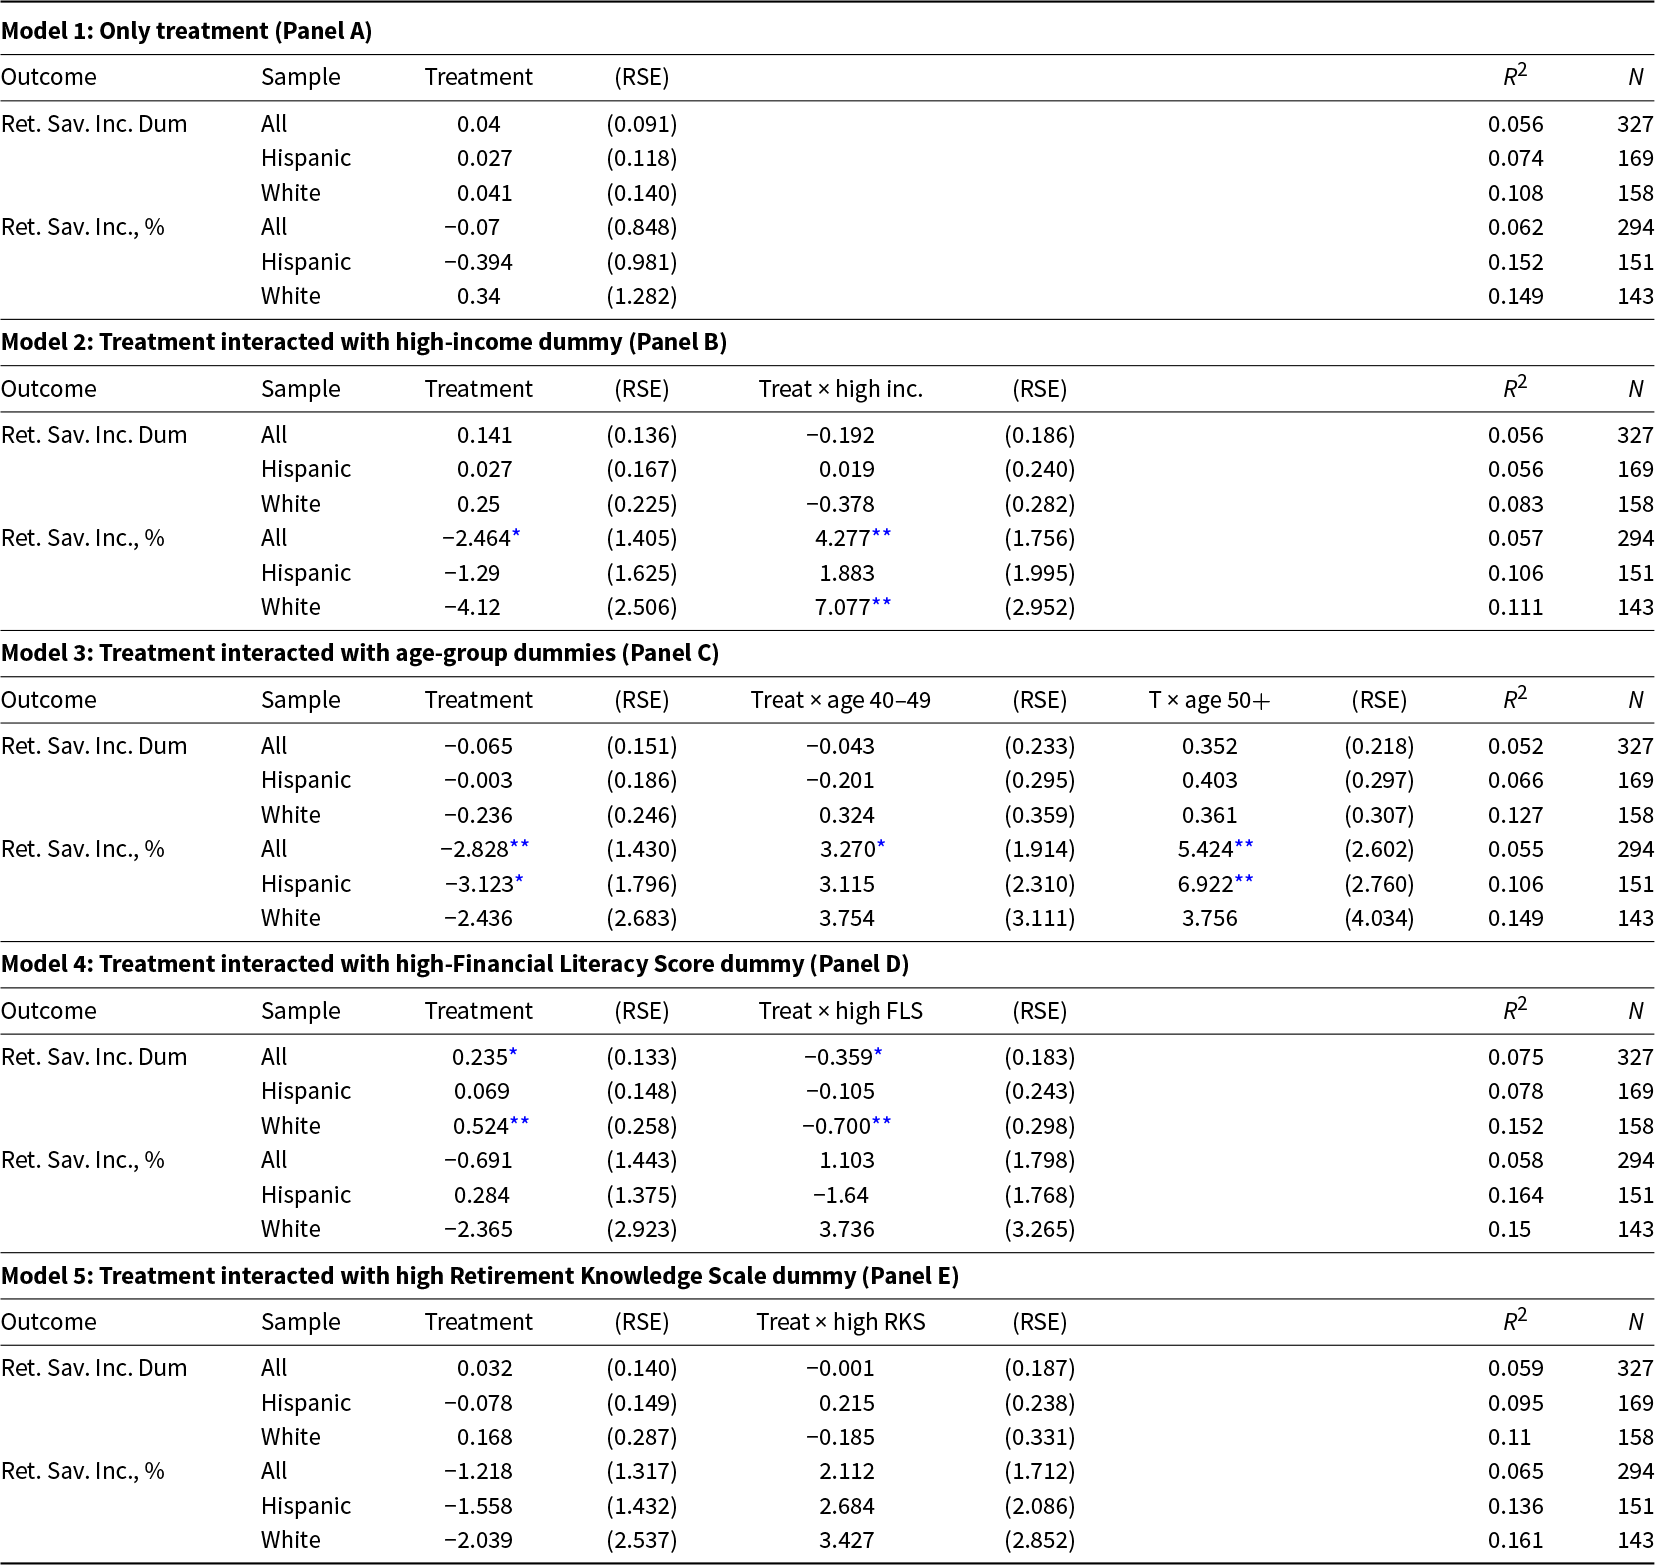
Table 3 Long description
Instrumental-variables estimates report how a treatment relates to two outcomes: whether retirement saving increased at all, and the percent change in income saved for retirement, shown for all participants and separately for Hispanic and White samples. In the model with only treatment, effects are near zero for both outcomes across groups, with small changes and large uncertainty. When treatment is interacted with high income, the percent-saved outcome shows a negative main treatment effect for the full sample but a significant positive interaction for high-income participants; the same positive interaction is significant for White participants, while Hispanic estimates are not statistically clear. With age interactions, the percent-saved outcome shows a significant negative main treatment effect and significant positive interactions for older age groups in the full sample; for Hispanics, the oldest age interaction is significant, while White age interactions are not statistically clear. For the binary increase outcome, most estimates are not statistically clear, except in the financial-literacy interaction model where the treatment is positive for the full sample and White participants, paired with a significant negative interaction for high financial literacy, suggesting smaller gains among those with higher literacy. Interactions with retirement knowledge do not show statistically clear effects for either outcome. Model fit values are low to moderate and sample sizes are about 327 for the binary outcome and about 294 for the percent outcome, so results should be interpreted with caution.
Notes: Robust standard errors (RSE) in parenthesis. We estimate the IV model with the CACE approach, and two dependent variables, the retirement saving increase dummy (Ret. Sav. Inc. Dum), constructed as a dummy variable equal to 1 if there is any increase on retirement savings, 0 otherwise, and the retirement saving increase expressed in percentage (Ret. Sav. Inc. %) was constructed as the percentage difference, between baseline and follow-up, of the continuous variable that denotes percentage of household income saved for retirement monthly. We included the following control variables: female, age, US citizen, born in the United States, coupled household, college and/or associate degree, higher than college degree, income groups ($35,000–$59,999, $60,000–$99,999, $100,000 or more), work full time, and hours worked per week. Please note that we do not include the continuous variable of income and age when we include the dummies for income levels and age-groups in our models. Please refer to Table A1 in the Supplementary Appendix for variables’ full description. T = Treatment.
Statistical significance denoted at * p<0.10, ** p<0.05, *** p<0.01.
We evaluate whether there is a heterogeneous effect of our program based on sociodemographic, FLS, and RKS variables and present the estimates of our treatment variable and interaction terms of treatment variable with variables of interest to evaluate heterogeneity. In Table A5 of the Supplementary Appendix, we present the marginal effects calculated for these models that explore heterogeneous program effects and Cohen’s d estimates for effect size evaluation. Please note that we calculate marginal effects and Cohen’s d statistics only when we observe a significant effect for our program treatment interacted with the variable of interest.Footnote 5
In Panel B in Table 3, we present the estimates when we interact our treatment variable with the high-income dummy. When we use the dependent variable that denotes the percentage difference on retirement saving, we observe that our program had significantly more positive impact among participants with higher income compared to low-/mid-income participants for both, the full sample and White subsample. When estimating the marginal effect, it seems that results are driven by White participants, where we observe that there is a significant difference on the impact of our program between high- and low-/mid-income White participants (difference 7.077, see Panel A in Table A5 in the Supplementary Appendix). We observe that the marginal effect of our program for high-income White participants was 2.957 percentage points, which is an effect of medium magnitude (Cohen’s d = 0.606). We do not observe heterogenous effect by income groups of our program on Hispanic participants.
In Panel C in Table 3, we present the estimates when we interact our treatment variable with different age-group dummies. Estimates of our model that uses the retirement saving variable expressed as a percentage change show that the impact of our program is positive and larger for participants in the age-group of 50 years and older for the full sample and for the sample that includes only Hispanics, in comparison to other age-groups. Surprisingly, we find a negative significant effect of our program on the percentage difference of retirement savings between baseline and follow-up for the age-group of 39 years old and younger for the full sample, but not for the Hispanic sample.
Table A5 (Supplementary Appendix, Panel B) shows the marginal effect of our program by different age-groups and the magnitude of the impact of our program in the context of the Cohen’s d. Estimates show that there is a significant difference in treatment effects between participants aged 50 and older and those under 40 of 5.4 and 6.9 percentage points for the full and Hispanic samples, respectively. In relation to the effect size of our program’s impact on Hispanic participants by different age-groups, we observe a positive program’s impact of large magnitude among older Hispanic participants (50 and older, Cohen’s d = 1.072) and negative program’s impact of large magnitude as well among younger Hispanic participants (under 40, Cohen’s d = 0.881). We do not observe age heterogeneity of our program’s impact among White participants.
In Table 3, Panel D presents the estimates of our treatment interacted with the FLS (dummy equal to 1 if FLS is equal or above median, zero otherwise). We found no significant heterogeneous effect of our program in relation to financial literacy for the full sample and for the Hispanic sample for any of the dependent variables related to retirement saving. When we estimate the marginal effect of our program among White participants with different levels of financial literacy (Table A5 in the Supplementary Appendix), we find that our program had a significant positive impact of large magnitude for participants with lower levels of financial literacy (Cohen’s d = 1.084).
In Table 3, Panel E, we present the estimates for our treatment interacted with the RKS (dummy equal to 1 if RKS is equal or above median, zero otherwise). We find no statistically signficant effects for the full sample or when we dissgragate by race/ethcnicity.
5.1.3. Retirement actions and conversations
Table 4 presents the IV estimates for the variables that capture actions and conversations related to retirement preparedness, and Table A6 in the Supplementary Appendix presents the Cohen’s d for those coefficients that are statistically significant in Table 4 at least at the 5 percent level. Data for these actions were only collected in the follow-up survey, where our analysis here captures whether participants took these specific actions during the duration of the 8-week program. Table 4 shows that for a measure of the total amount of actions taken (0–11 value), the program had a positive impact for the full sample of a medium magnitude (Cohen’s d = 0.553). For the full sample, we also observe that the program had a positive impact on checking own retirement savings plan online of a small magnitude (Cohen’s d = 0.388) and other actions of medium magnitude (Cohen’s d = 0.543). For other actions, participants could select ‘other’ as an option if that was an action that was not included in the list of 10 actions.
IV estimates for outcomes related to retirement preparedness actions and conversations
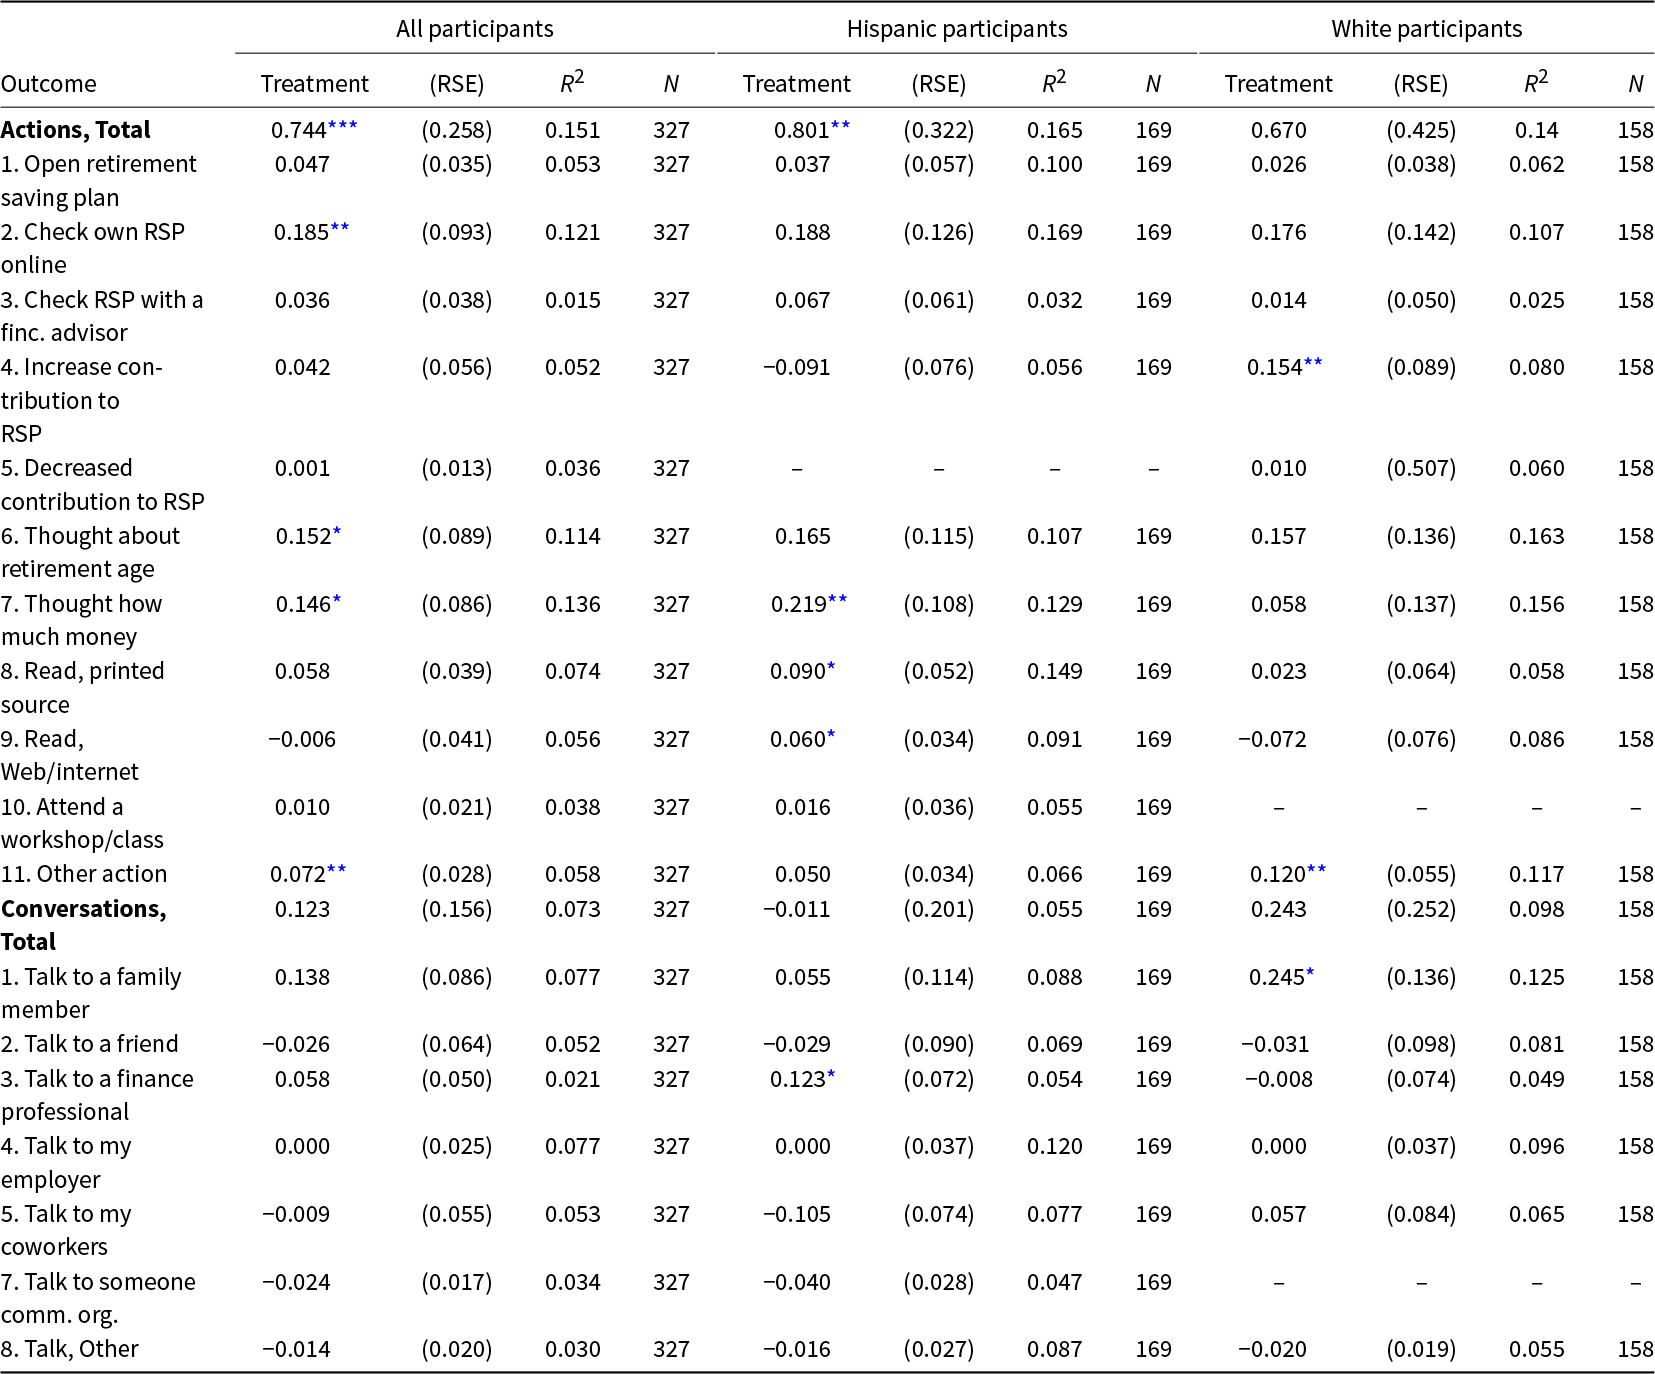
Table 4 Long description
The table reports instrumental-variables treatment estimates for retirement-preparedness actions and conversations, shown for all participants, Hispanic participants, and White participants, with standard errors, model fit, and sample sizes. The clearest pattern is an increase in the total actions index for all participants and for Hispanic participants; the White-participant total actions estimate is positive but not statistically reliable. For specific actions, checking one’s retirement saving plan online increases for the full sample, with similar-sized estimates in both racial and ethnic subgroups. Thinking about how much money is needed for retirement increases for the full sample and more strongly for Hispanic participants, while the estimate for White participants is smaller and not statistically reliable. White participants show an increase in raising contributions to a retirement saving plan and in the “other action” category, while Hispanic participants show increases in reading printed sources and web sources. Conversation outcomes show no statistically reliable change in the total conversations index across groups; the only notable subgroup results are more talking with a family member among White participants and more talking with a finance professional among Hispanic participants. Some rows are missing for certain groups because no one in that subgroup reported the behavior, so those outcomes cannot be compared for that subgroup. Overall, the treatment effects are concentrated in action-taking rather than conversations, and most individual binary outcomes have wide uncertainty.
Notes: We estimate the IV model with the CACE approach, with dependent variables related to actions and conversations related to retirement preparedness (Actions and Conversations total are continuous variables, all other variables are dummies equal to 1 if taking an action or having a conversation, 0 otherwise). None of Hispanic participants chose the action ‘Decreased contribution to RSP’ and none of White participants chose the actions ‘Attend a workshop/class’ and ‘Talk to someone comm. org’. We included the following control variables: female, age, US citizen, born in the United States, coupled household, college and/or associate degree, higher than college degree, income groups ($35,000–$59,999, $60,000–$99,999, $100,000 or more), work full time, and hours worked per week. Please refer to Table A1 in the Supplementary Appendix for variables’ full description. RSP = Retirement saving plan, finc. = financial, comm. = community, org. = organization.
Robust standard errors (RSE) in parenthesis. Statistical significance denoted at * p<0.10, ** p<0.05, *** p<0.01.
Table 4 also presents the estimates of the impact of program for Hispanic and White participants separately. We observe that Hispanic participants in the treatment group, in comparison to the control group, were more likely to take an action (medium size effect, Cohen’s d = 0.679) and thought about how much to save for retirement (medium size effect, Cohen’s d = 0.572). For White participants in the treatment group, in comparison to the control group, we only see that there were more likely to take ‘other’ action (medium size effect, Cohen’s d = 0.769).
Table A7 (in the Supplementary Appendix) shows variables related to actions and conversations on retirement preparedness for the full sample and for the different ethnic groups separately collected at the 8-week follow-up. Hispanic participants, in comparison to White participants, are less likely to take an action. The specific actions that Hispanic participants were less likely to take, in comparison to White participants, were reflecting about retirement age and how much money to save for retirement and checking the internet for retirement-related information.
5.2. ICR-H program experience evaluation
5.2.1. Program online interaction
We evaluated whether the program influenced participants’ engagement with online information, examining the number of times participants interacted with material online at least once a week during the duration of program. Table 5 shows statistically significant differences between the treatment and control groups, both in the overall sample and among Hispanic and White subsamples. Those in the treatment group, in comparison to the control group, were more likely to check material online at least once a week for 4 weeks on average. We observe a difference on the mean average of times participants visited online website or material during the 8 weeks between the treatment and control groups of 4.36 times.
Average number of weeks that participants visited the website/digital experience
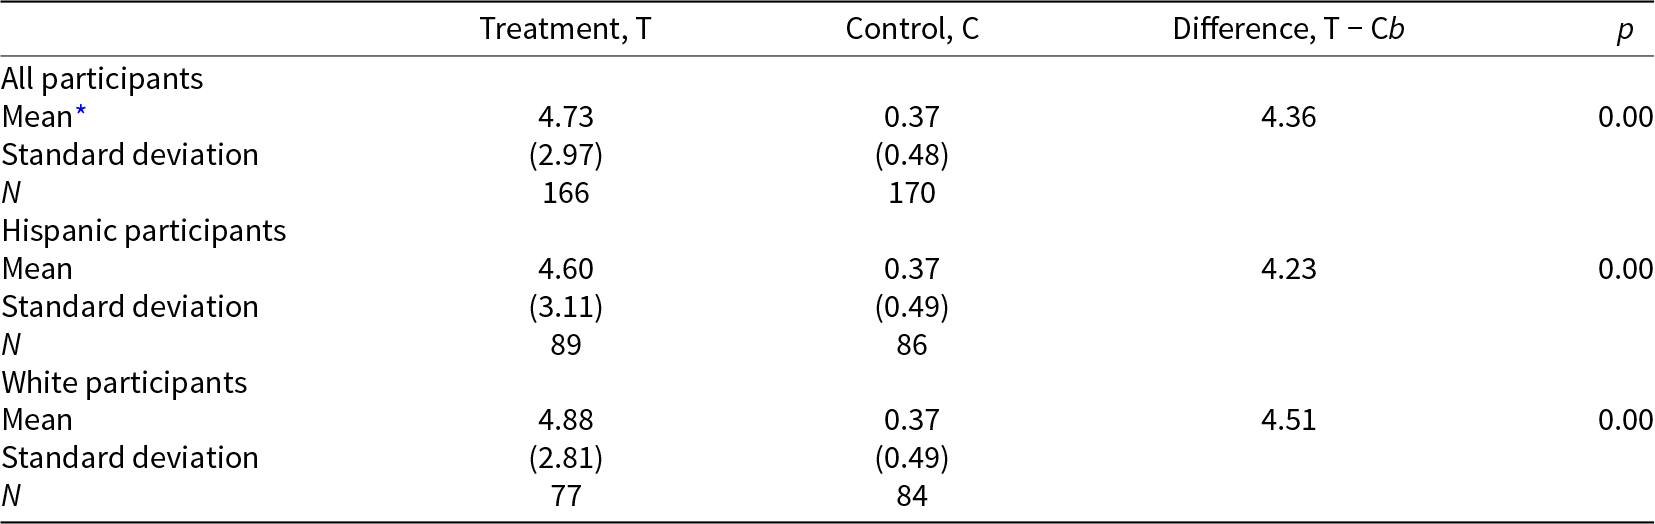
Table 5 Long description
The table reports the average number of weeks, out of an eight-week program, in which participants visited the website at least once per week, comparing treatment and control groups. For all participants, the treatment group averaged 4.73 weeks versus 0.37 weeks for the control group, a difference of 4.36 weeks with a p-value of 0.00. Variation was larger in the treatment group, with standard deviations of 2.97 for treatment and 0.48 for control; sample sizes were 166 and 170. Among Hispanic participants, the treatment mean was 4.60 weeks and the control mean was 0.37 weeks, a 4.23-week difference with a p-value of 0.00; standard deviations were 3.11 and 0.49, with 89 and 86 participants. Among White participants, the treatment mean was 4.88 weeks and the control mean was 0.37 weeks, a 4.51-week difference with a p-value of 0.00; standard deviations were 2.81 and 0.49, with 77 and 84 participants. Across all samples, controls show very low engagement while treatment participants report roughly four to five weeks of weekly visits. The p-values indicate the treatment-control differences are statistically significant, but they do not describe the size of practical impact beyond the reported averages.
Notes: *Mean estimated counting as website visit if participant visited website/digital experience at least once per week during program duration (8-week period). We conducted a two-sided t-test to determine whether there are statistically significant differences between the treatment and control groups for the different samples.
In Table 6, we show the total and unique link clicks recorded in our online tracking system in a weekly basis for the duration of the program. In week 1, when both the treatment and control groups received information, 55 percent of participants went online.Footnote 6 Among those in the treatment group, 80 percent clicked on the digital experience as well in week 2. Between weeks 3 and 6, the proportion of those in the treatment group clicking to review the material was between 63 and 58 percent, with this proportion decreasing to 51 percent by weeks 7 and 8. The control group only went online to the main website on week 1, when they received the invitation to check the general website. Table 6 shows that 57–65 percent of program clicks were from a mobile device.
Unique and total clicks by device and as percentage of treatment groups
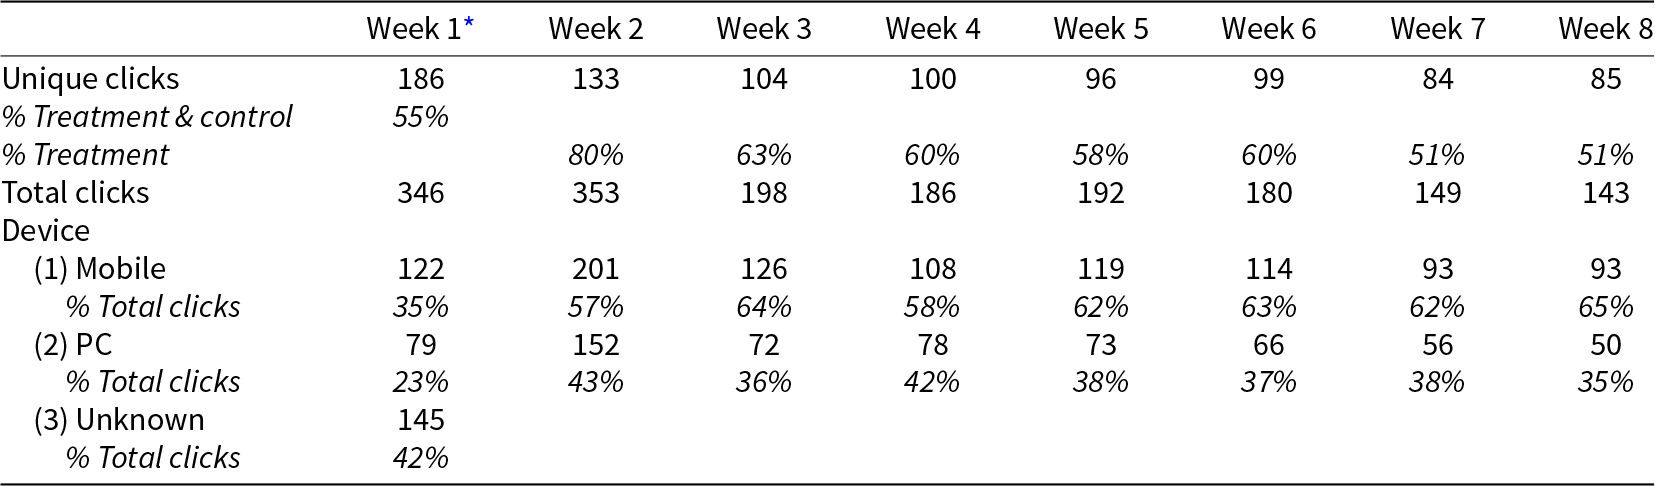
Table 6 Long description
Weekly click activity is reported across eight weeks, including unique clicks, total clicks, and total clicks by device type. Unique clicks decline from 186 in week 1 to the mid 80s by weeks 7 and 8, while total clicks rise from 346 in week 1 to a peak of 353 in week 2, then trend downward to 143 by week 8. From week 2 through week 8, mobile accounts for the majority of total clicks, ranging from 57 percent in week 2 to 65 percent in week 8, while PC makes up the remainder, ranging from 43 percent down to 35 percent. In week 1, device tracking includes a large unknown category at 145 clicks, representing 42 percent of total clicks, alongside 122 mobile clicks and 79 PC clicks. Treatment share is reported as 80 percent in week 2 and then declines to 51 percent by weeks 7 and 8; week 1 instead reports a combined treatment and control percentage of 55 percent. Interpret week 1 cautiously because both groups received a link and some device data could not be tracked, which likely contributes to the unknown device category.
Notes: *Please note that in week 1 we provided both groups, treatment and control, with a message that invited them to check information about retirement preparedness online. The control group got the link to the general website, and the treatment group to the tailored digital experience. We also were unable to track device in week 1 for some clicks due to some technical issues.
5.2.2. Usefulness, familiarity, confidence, knowledge, and taking an action
We asked participants to indicate on a 4-point scale how useful they found the material, their familiarity with it, and their confidence in and knowledge of retirement planning. Table 7 summarizes these results. We observed significant differences between the treatment group, which received weekly material, and the control group, which only had main website access, for all participants and for Hispanic and White participants separately. Among the full sample, those in the treatment group, in comparison to the control group, found the material to be more useful, reported higher levels of familiarity with the material, higher levels of knowledge of and confidence in retirement planning, and greater likelihood to take an action related to retirement preparedness.
Usefulness, familiarity, retirement confidence and knowledge, and taking an action
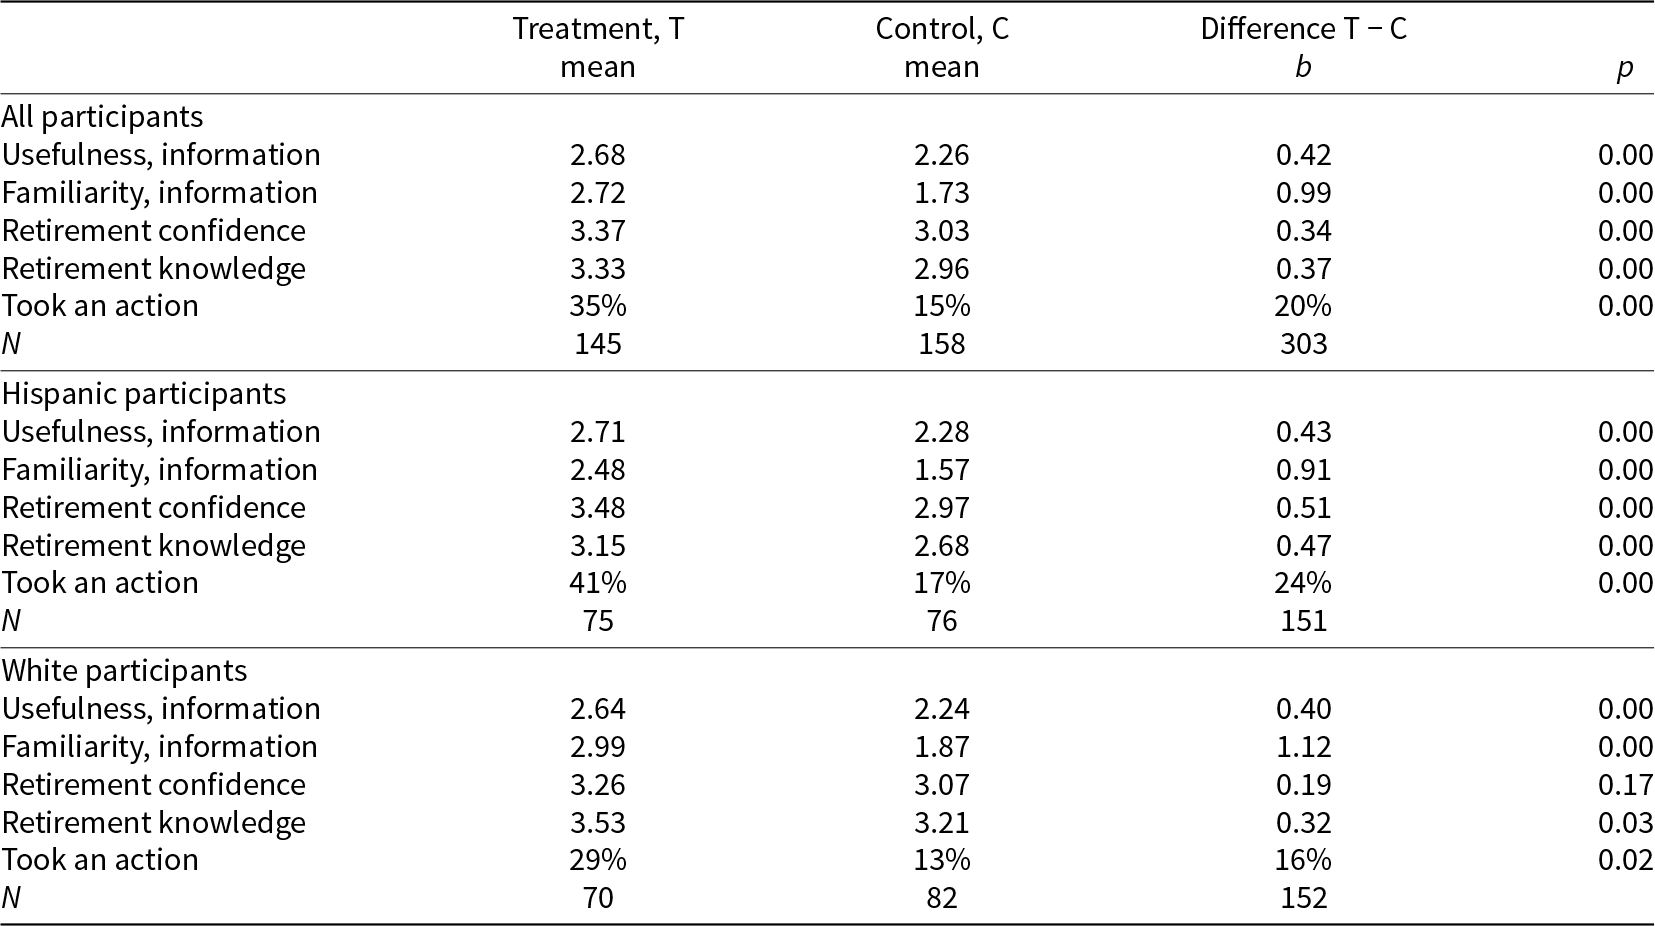
Table 7 Long description
The table compares average ratings and action-taking between a treatment group and a control group for all participants, Hispanic participants, and White participants. Outcomes include perceived usefulness of the information, familiarity with the information, retirement confidence, retirement knowledge, and whether the participant took an action. For all participants, treatment averages exceed control on usefulness (2.68 vs 2.26), familiarity (2.72 vs 1.73), confidence (3.37 vs 3.03), and knowledge (3.33 vs 2.96), and action-taking is higher (35 percent vs 15 percent); all differences have p-values reported as 0.00. Among Hispanic participants, treatment is higher on all measures, including action-taking (41 percent vs 17 percent), with p-values reported as 0.00. Among White participants, treatment is higher on usefulness (2.64 vs 2.24), familiarity (2.99 vs 1.87), knowledge (3.53 vs 3.21), and action-taking (29 percent vs 13 percent), while the confidence difference is smaller and not statistically significant (p 0.17). Sample sizes are 145 treatment and 158 control overall, 75 and 76 for Hispanic participants, and 70 and 82 for White participants. Differences are based on a two-sided t-test, and p-values indicate statistical significance but do not convey effect size or practical importance.
Notes: Data collected in follow-up survey among the treatment and control groups. We conducted a two-sided t-test to determine whether there are statistically significant differences between the treatment and control groups for the different samples. Please refer to Table A1 in the Supplementary Appendix for variables’ full description.
These significant differences between the treatment and control groups for the full sample are also consistent when we separate groups by ethnicity. Among Hispanic participants, we observe that those in the treatment group behaved the same way as the full sample. Among White participants, the only difference observed from full sample results is that there is no statistically significant difference in relation to retirement confidence between the treatment and control groups.
5.2.3. Weekly material interaction and usefulness
We evaluated all participants’ interaction with the program material and differences between Hispanic and White participants, where Table 8 summarizes these results. Table 8 shows that all treatment group participants on average completed five weekly program activities, visited weekly activities 12 times, and spent 11 minutes total on the activities. Aggregating all 14 program activities offered in our program, we found participants completed 7 activities on average, and that 48 percent of participants completed at least half the activities. We found that interaction with material and completion of activities was similar for Hispanic and White participants. The only differences we found were that White participants were more likely to play videos and to complete at least 75 percent of the videos, in comparison to Hispanic participants.
Interaction with online material for treatment group

Table 8 Long description
Engagement metrics on an online education platform are summarized for treatment participants who completed follow-up, shown for all participants and separately for Hispanic and White participants. Most overall activity and time measures are similar across groups: weekly activity once per week is 4.60 for Hispanic and 4.88 for White, and total weekly time is 10.70 for Hispanic and 11.35 for White. The clearest differences are in video engagement, where White participants show higher use. White participants average 1.79 video plays out of three versus 1.25 for Hispanic participants, and this difference is statistically significant with a p-value of 0.01. White participants also reach 75 percent completion more often, averaging 1.09 videos versus 0.70 for Hispanic participants, with a statistically significant p-value of 0.02. Other video completion thresholds (50 percent and 100 percent) and extra activities (flip cards, quizzes, discussion guides, and total extra activities) show smaller differences that are not statistically significant. Overall completion is similar: total activities completed are 6.35 for Hispanic and 7.04 for White, and program completion of at least half is 52 percent for Hispanic and 56 percent for White. Sample sizes are 166 total, with 89 Hispanic participants and 77 White participants, and results reflect only those who completed follow-up.
Notes: Data tracked among treatment participants in the online platform for educational experience. We include data here among those participants in treatment that completed follow-up survey only. We conducted a two-sided t-test to determine whether there are statistically significant differences between the treatment and control groups for the different samples. Please refer to Table A1 in the Supplementary Appendix for variables’ full description.
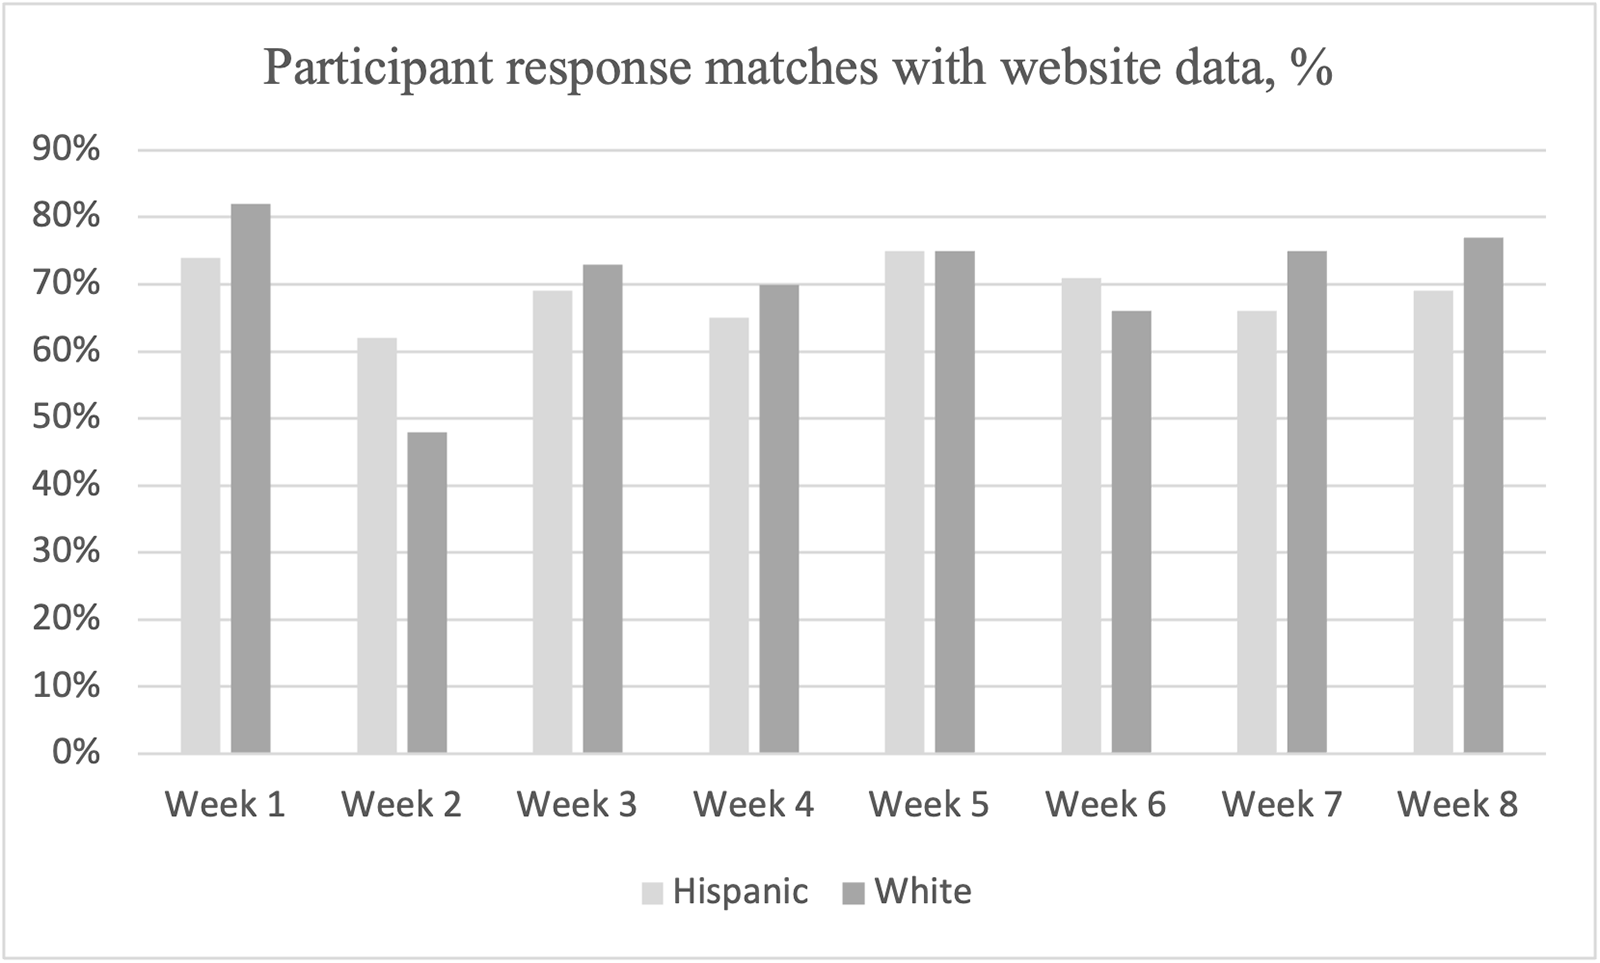
We also collected information about the usefulness of the material for each week. We described the material for each week and asked participants if they recalled completing it. We then matched the participant answer to the data we collected from the website. Figure 2 shows the percentage of participants whose answers matched our website records on completion (i.e., matching rates). None of the weekly differences in matching rates between Hispanic and White participants were statistically significant. We found matching rates by week among Hispanic participants between 62 and 75 percent and among White participants between 48 and 82 percent.
Program completion matching of participant response and website data*.
Among those who completed the material according to our records, we also calculated the percentage who found it moderately or extremely useful (i.e., who gave the material a usefulness rating of 3 or 4). Figure 3 shows that among Hispanic participants, 84 percent found the week 3 material, on target date funds, to be useful. Among White participants, 74 percent thought the week 2 material, on the importance of early retirement planning, to be useful, but only 56 percent of Hispanic participants did. The only significant difference at least at the 5 percent level between Hispanic and White participants is on the usefulness of week 8, which provided guidance on how to have a conversation with family members about retirement planning. While 68 percent of Hispanics thought the week 8 material was extremely/moderately useful, only 43 percent of White participants thought it that way.
Usefulness of weekly material*.

6. Conclusion and discussion
Our work here provides evidence on how a tailored program for Hispanic adults might be a way to move forward on addressing their informational and motivational needs for retirement planning. Our analysis shows that the approach of offering a tailored program to the racial/ethnic group that has the higher knowledge and participation needs does not adversely impact retirement planning by workers of other races or ethnicities. Our program evaluation found that the experience of Hispanic and White participants was similar, where knowledge gains are more evident for Hispanic participants. This finding is relevant as it provides evidence of the possibility to address differences in financial knowledge between minority and White adults more effectively with informational and culturally tailored programs.
Our findings here align with the findings of Collins and Urban (Reference Collins and Urban2016) and Clark et al. (Reference Clark, Lin, Lusardi, Mitchell and Sticha2025) on the positive impact of a digital program on financial knowledge related to retirement preparedness, measured with the RKS, subscales, and items. While the program’s impact on retirement knowledge was more pronounced among Hispanic participants, when we control for baseline values, the gains seem to be partly driven by reaching participants with lower initial retirement knowledge. Interestingly, we find a robust significant effect of our program among Hispanic participants on engagement with printed material related to retirement preparedness (only outcome that remained significant after controlling for initial values). This finding is related to Viceisza et al.’s (Reference Viceisza, Calhoun and Lee2023) observation that adults from different racial/ethnic groups engage with retirement information differently. This brings attention to the need to tailor outreach to group-specific preferences. Thus, our results suggest that digital financial education programs targeting Hispanic adults may benefit by complementing a digital material with printed materials.
One relevant finding from our study relates to the heterogeneous impact of our program on self-reported measures of retirement saving among Hispanic participants by age-groups. Our program had a significantly larger positive impact for Hispanic participants aged 50 and older on the percentage-point change in monthly household income saved for retirement, compared to younger groups. This finding aligns with Blanco and Rodriguez’s (Reference Blanco and Rodriguez2020) Facebook experiment, in which older Hispanic women were more likely to engage with online information on retirement preparedness than younger women. This finding is relevant for policymakers because it suggests that targeting Hispanic workers aged 50 years and older with culturally tailored digital interventions may be an effective strategy for improving retirement preparedness among this group during a critical age window before retirement. Further research is needed to understand why younger Hispanic participants did not show similar gains and how we can adapt interventions to reach this age-group more effectively. Engaging young adult Hispanic workers is crucial, as increasing retirement saving earlier in life allows more time for compound growth, leading to significantly greater wealth accumulation by retirement for this group.
We also observe that among White participants, those with lower levels of FLS were significantly more likely to increase retirement savings. This is in the opposite direction from Goda et al.’s (Reference Goda, Levy, Flaherty Manchester, Sojourner, Tasoff and Xiao2023) finding that the effects of their intervention, based on a retirement calculator, were greater for those with higher levels of financial knowledge. It is important to note that we do not observe a heterogenous impact among Hispanic participants by baseline levels of financial literacy or retirement knowledge. Similarly, when examining the impact of our program by income groups, we found a significantly larger effect only for White participants in the high-income group compared to low-/mid-income participants; no such effect is observed for Hispanic participants. In some ways, these findings are encouraging from an equity perspective since they suggest that a digital intervention like ours is unlikely to widen gaps in retirement saving between Hispanics with low and high levels of financial literacy, retirement knowledge, or income. Thus, we provide evidence for policymakers that culturally tailored programs like ours can be implemented among Hispanic communities without a concern that it will only benefit those with higher financial knowledge and economic resources.
Our study has some limitations. First, we rely primarily on self-reported data regarding retirement planning and saving. Given that data on retirement saving percentages and amounts are self-reported, we are cautious about our findings here. We find this part of analysis useful for future interventions that can be conducted in a larger scale and in collaboration with financial institutions and employers, so that we can actually track changes on retirement saving before and after intervention. Collaborating with financial institutions to verify whether specific changes were actually made in retirement savings behavior could provide further insights of the impact of digital programs on retirement preparedness that are tailored to minority groups. Such an evaluation could be conducted as an RCT with a wait-list control group to ensure that all employees will benefit from the program.
Second, we have a relatively small sample, which is likely to have influence on the power of our analysis. Conducting an analysis like this at a larger scale and in collaboration with an employer will be the next step to evaluate how informational/culturally tailored digital financial programs can be an effective tool to address racial/ethnic gaps in financial knowledge and well-being, especially improving financial knowledge and planning for retirement.
Third, we acknowledge that our analysis includes a large segment of the population with respect to age. Our inclusion criteria were that participants were currently working, had access to an employer retirement account, and were 18–65 years old. Because the average age among our participants was 44, our results are not specific to early career adults, who have more tenuous labor market attachment than older workers. We conducted an analysis of the heterogeneous impact of our program by age-groups, but future research that stratifies by age and focuses on specific age cohorts (early-career, mid-career, and near-retirement workers) is warranted to better understand the challenges and opportunities toward increasing retirement preparedness among different age-groups and life stages.
Fourth, there is likely to be some sensitivity on racial/ethnic issues as we move forward in implementing informational and culturally tailored financial education programs. We find that in our intervention, most participants had a positive experience with the program, but this might be different in other contexts or settings. Thus, further research on how individuals are likely to respond to culturally tailored financial education programs is warranted.
Overall, our ICR-H program evaluation suggests that digital programs designed to meet the informational needs of Hispanic workers and consider the cultural context are likely to improve the financial well-being of this group. The improvement of retirement preparedness among minorities through culturally tailored digital educational programs may help reduce the racial/ethnic differences in retirement preparedness in older ages. Our study provides evidence that a culturally tailored digital approach to retirement preparedness can be effective. Our work also offers methodological guidance for researchers and practitioners on how to develop, evaluate, and implement digital financial education programs. Researchers can get insights from our analysis on how to evaluate digital financial education programs, what data should be collected, and how these data should be analyzed to determine whether these programs have a positive impact on retirement preparedness, especially among racial/ethnic groups who currently lag behind in this area.
Our analysis of the impact of the ICR-H digital program provided evidence on the feasibility of cross-sector collaborations to improve retirement preparedness among minority workers. Financial institutions could partner with employers to offer digital programs that meet the informational needs and are tailored to take into consideration the cultural context and influences of a diverse workforce. In such collaborations, academic institutions can play a key role in helping with the design, evaluation, and implementation stages of such digital programs.
Supplementary material
The supplementary material for this article can be found at https://doi.org/10.1017/S1474747226100158.
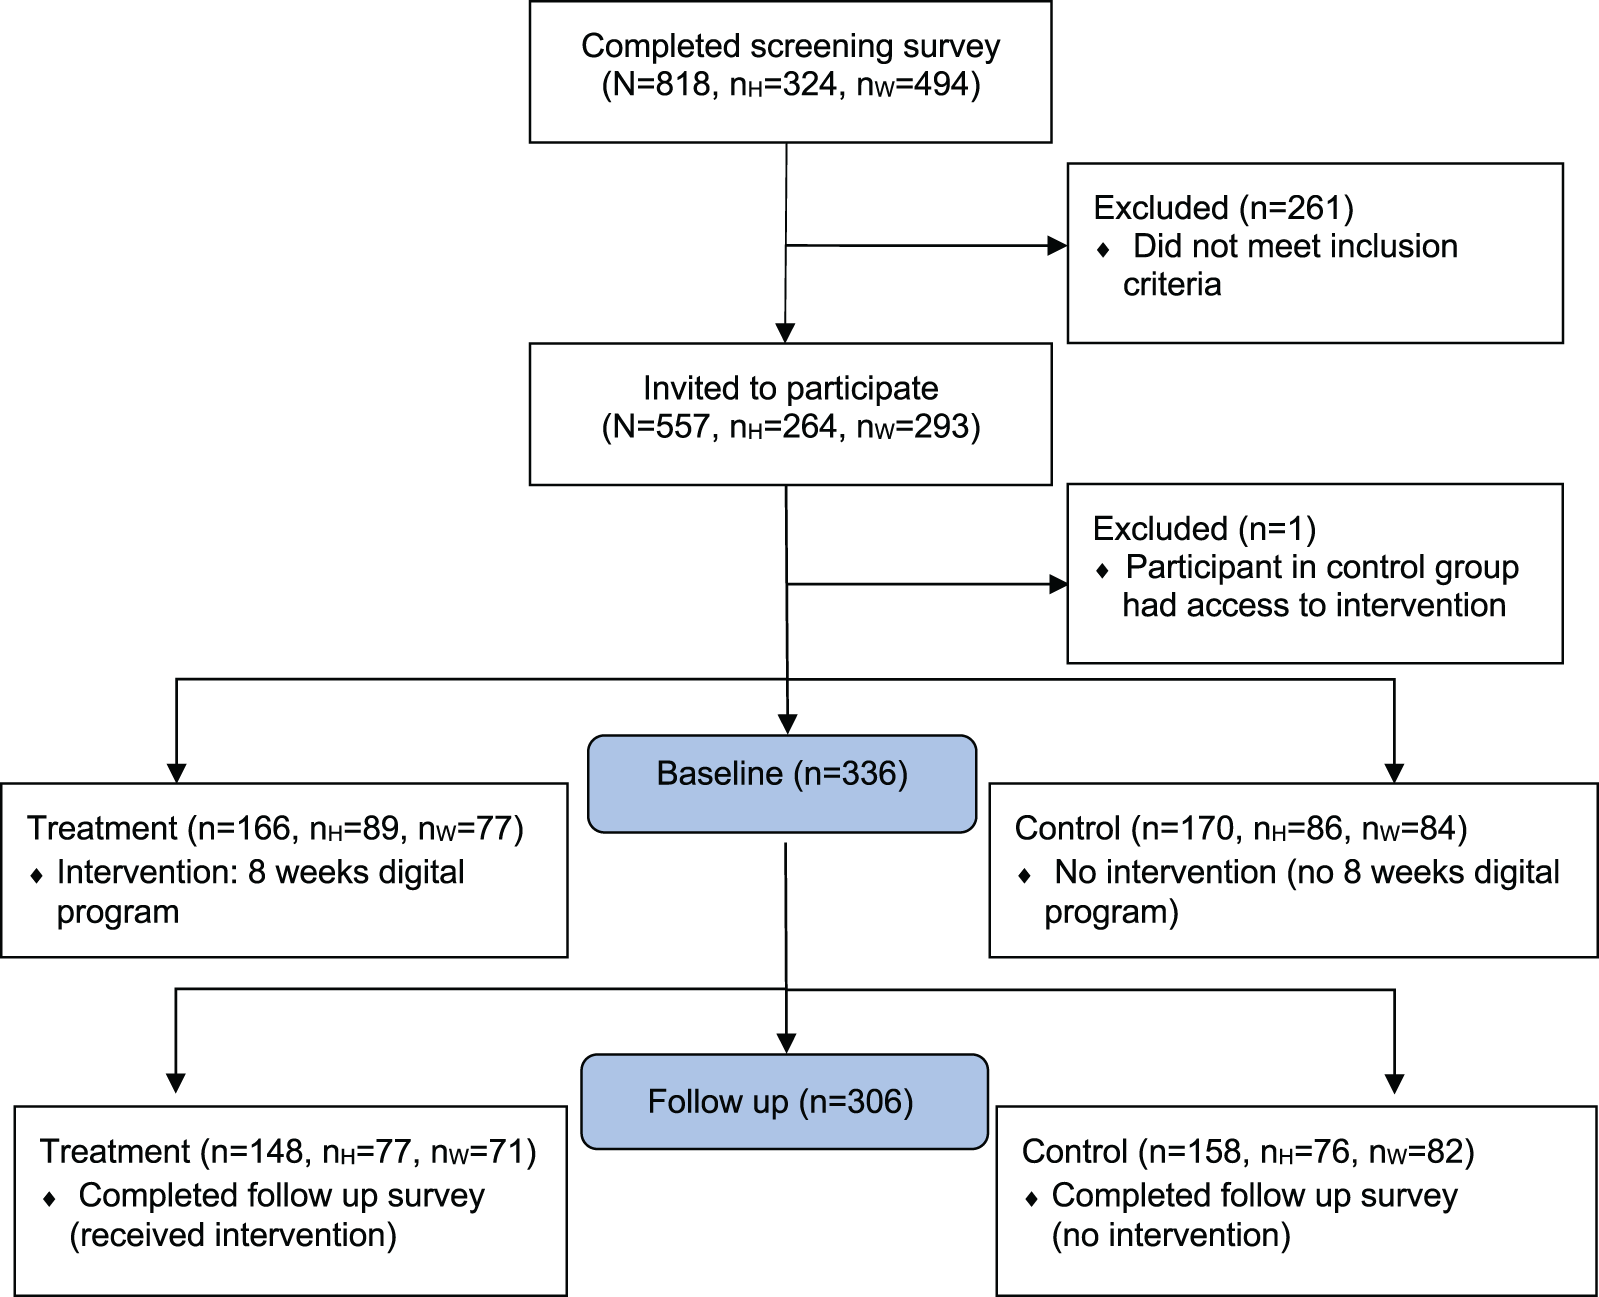
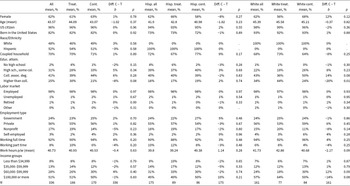
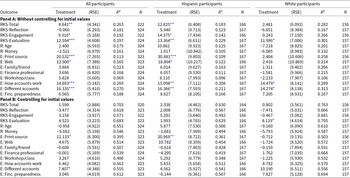
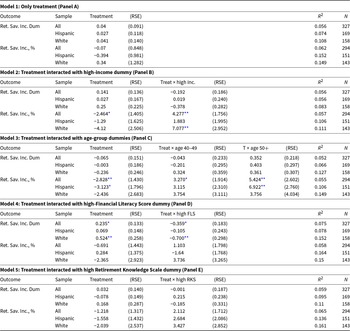
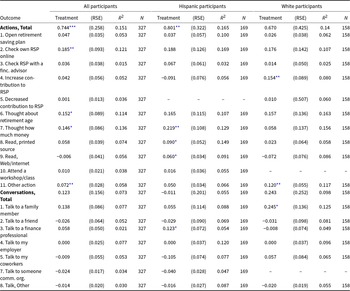
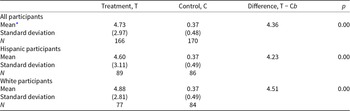
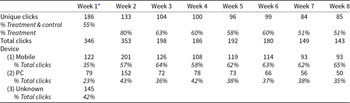
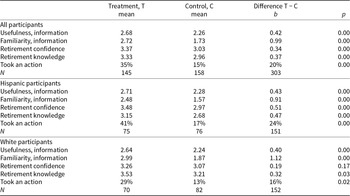
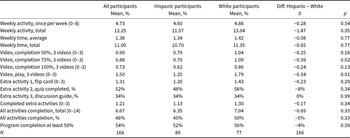
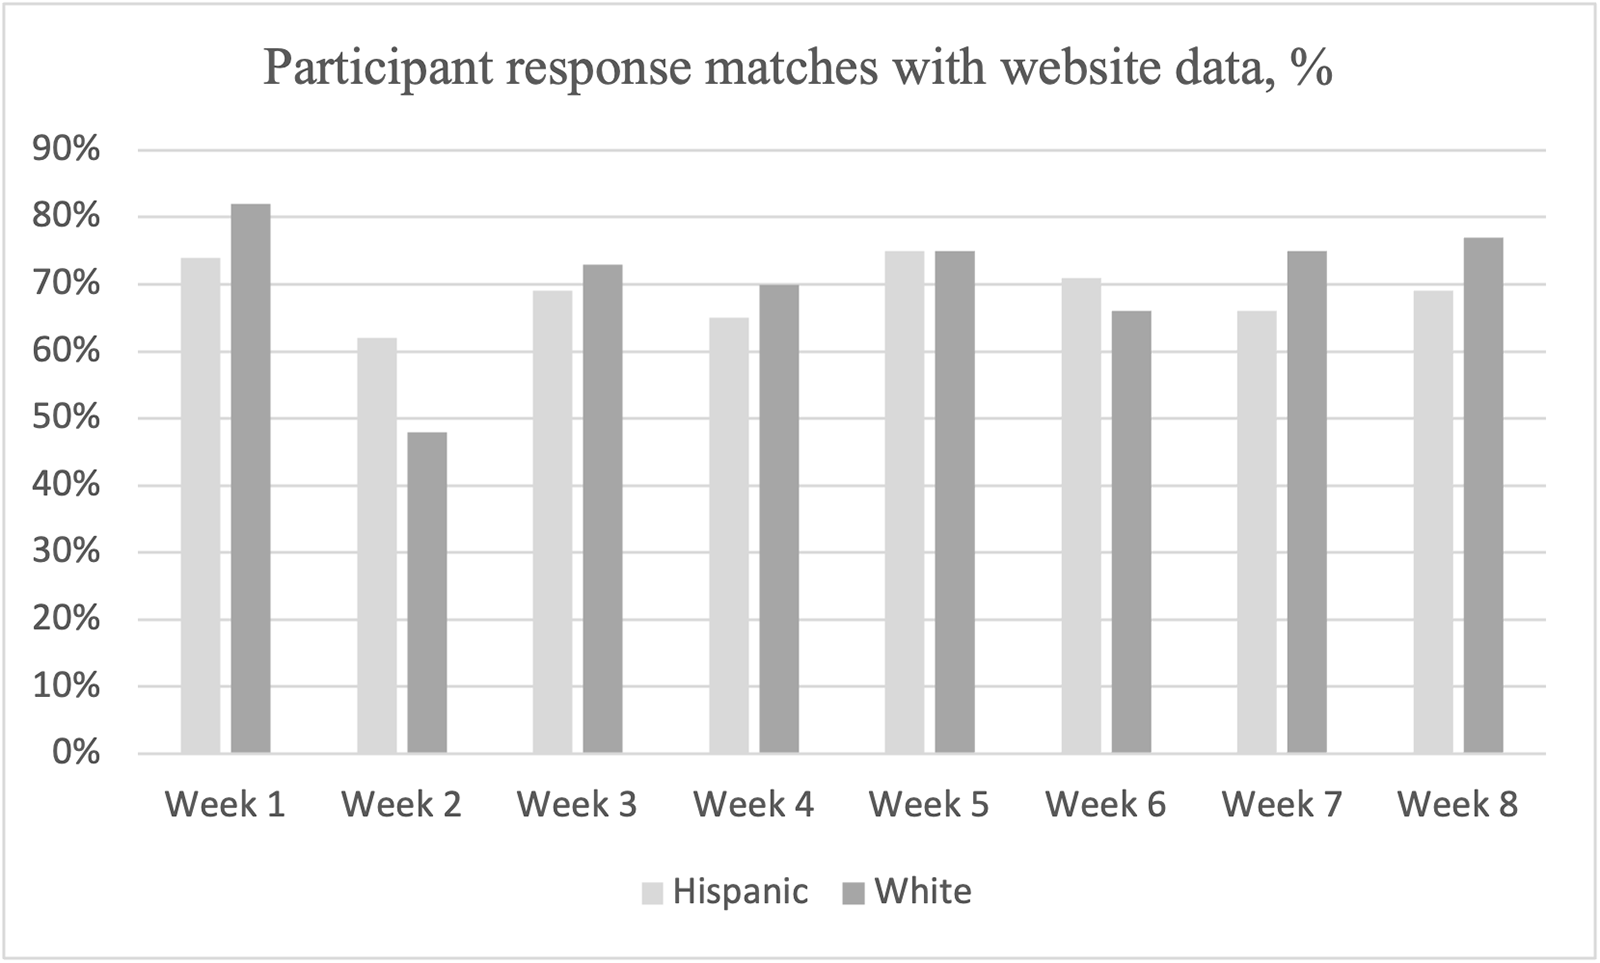
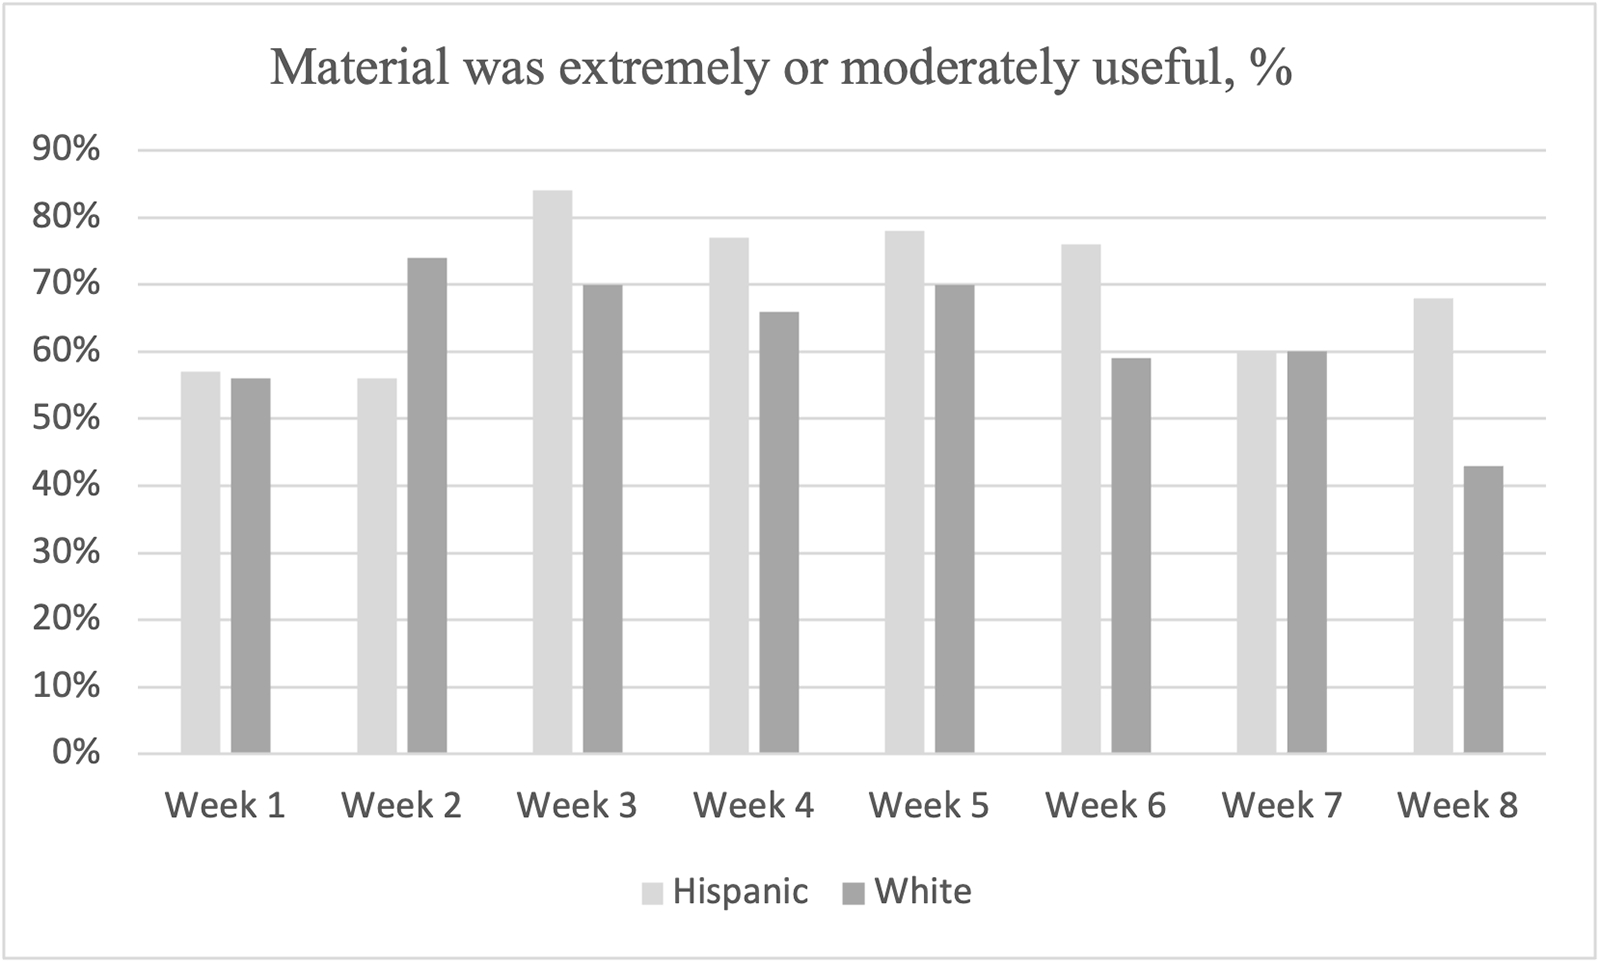


 Open access

