





NOMENCLATURE
- ADS-B
= Automatic Dependent Surveillance–Broadcast
- API
= application programming interface
- EI
= emission index
- EHS
= enhanced surveillance in Mode-S
- FDR
= flight data recorder
- LTO
= landing and take-off
- TAS
= true air speed
- SSR
= secondary surveillance radar
- UHC
= uncombusted hydrocarbons
- ZFW
= zero-fuel weight
- a
= speed of sound
- D
= aerodynamic drag $F_N$
$F_N$= net thrust
- g
= acceleration of gravity
- M
= true Mach number
- n
= number of operating engines
- ${\mathcal R}$
= ideal gas constant
- t
= flight time
- s
= distance travelled/arc length
- $T, T_1$
= air temperatures (absolute scale)
- W
= gross weight
- $W_f$
= design fuel capacity
- $W_{f6}$
= fuel flow per engine
- X
= required range
- $X_{design}$
= design range
- z
= flight altitude
- $\gamma$
= ratio between specific heats


1.0 INTRODUCTION
The prediction of environmental emissions from commercial aircraft is generally performed indirectly without the use of actual flight data. Flight data have always been difficult to gather, despite being available from the Flight Data Recorder (FDR), because of proprietary, commercial and legal issues surrounding the ownership and value of flight records. Furthermore, extracting FDR data can be a time-consuming operation which involves the selection of parameters from a very large set (of several hundred), some of which are stored with different sampling rates. Thus, aircraft tracking has long relied on primary radar detection and more recently secondary radar, wherein the aircraft transmits data upon interrogation. Radar tracking is one of the key systems on which flights and emissions inventories are based.
Estimates of aviation emissions are performed by using ‘inventories’, of which several are now available from multi-national initiatives. The three-dimensional global inventory of aviation  $\mathrm{NO}_x$ ANCAT/EC(Reference Gardner1), which is now nearly 30 years old, was the first example of indirect monitoring of $\mathrm{NO}_x$ emissions at altitude dependent on geographical location, by using Air Traffic Control (ATC) data from a number of cooperating airlines. Direct measurements over the North Atlantic flight corridor were taken in the course of a number of other projects as reported by Schumann(Reference Schumann, Schlager, Arnold, Ovarlez, Kelder, Hov, Hayman, Isaksen, Stahelin and Whitefield2), to investigate, inter alia, the vertical distribution of $\mathrm{NO}_x$, $\mathrm{SO}_x$, $\mathrm{H}_2\mathrm{O}$ and other aviation-related chemical compounds in the atmosphere.
Since then, the market has changed considerably, many of the aircraft flying in the 1990s may no longer be in service, and several low-emissions aircraft have entered the market. Thus, these inventories risk becoming obsolete very rapidly. At least six different  $\mathrm{NO}_x$ emission inventories have been developed and proposed under a variety of national and international projects. Inevitably, there are differences among these datasets, which have been pointed out by a number of separate investigations, for example Refs. (Reference Olsen, Wuebbles and Owen3,Reference Skowron, Lee and De León4). Reference (Reference Skowron, Lee and De León4) also provides a comparison among the different inventories and presents a table with the key characteristics of each system. Notably, most of the air traffic is tracked by radar systems.
Integrated emission models include Aviation Environmental Design Tool (AEDT) with additional air traffic data from a number of electronic data recording sources(Reference Wilkerson, Jacobson, Malwitz, Balasubramanian, Wayson, Fleming, Naiman and Lele5), although it is unclear whether all the flight data are complete and valid. The flights are recorded from radar tracking systems from the Federal Aviation Administration (FAA), air traffic control and others.
The System for assessing Aviation Global Emissions (SAGE) method has been used in conjunction with flight databases to assess the accuracy of environmental predictions(Reference Lee, Waitz, Kim, Fleming, Maurice and Holsclaw6) and enables a detailed sensitivity analysis in  $\mathrm{NO}_x$ predictions, although the baseline data are not available. However, it is argued that there are variations of up to 40% in $\mathrm{NO}_x$ predictions on a flight-by-flight basis.
Eurocontrol maintains a complete database of fuel burn and emissions (Advanced Emission Model, AEM) that uses detailed trajectory data (time and position), and then estimates the fuel burn in each flight segment(Reference Carlier and Smith7). The system uses an aggregation procedure to estimate emissions on a continental scale. Unlike other inventories, AEM is updated annually and is thus useful to track aviation emissions with realistic fleets and traffic patterns.
Data of interest include the overall emissions, the geographical location, the concentration, the vertical distribution, the diffusion processes, the lifetime of the pollutants and their overall effect on weather patterns and climate change (radiative effects). The technical literature (e.g. Refs. (Reference Brasseur, Müller and Granier8,Reference Stevenson, Dohery, Sanderson, Collins, Johnson and Derwent9)) has abundantly demonstrated the importance of aviation  $\mathrm{NO}_x$ at high altitude, and its role in determining the fate of stratospheric ozone and methane. It remains to be established how to best predict these emissions, which depend on several factors that ‘inventories’ do not consider.
Whilst specific fuel consumption has been decreasing over the years,  $\mathrm{NO}_x$ emissions have followed a different trend: initially downwards due to improved combustion efficiency, and then upwards due to increasing overall pressure ratios, which is driven by increases in fuel efficiency. In any case, $\mathrm{NO}_x$ emissions have been regulated for many years, and the Committee for Aviation Emissions Protection (CAEP), working under the directive of the International Civil Aviation Organization (ICAO), has issued increasingly strict emissions guidelines, as displayed in Fig. 1. The symbols represent certified turbofan engines, while the colours refer to the year of certification: darker shades are the oldest engines, and lighter shades are the most recent certifications (selected dates are displayed).


Analysis of Fig. 1 indicates that any emissions inventories based on any given year are unlikely to represent present and future emissions, and especially long-term environmental trends. Thus, there is a need to develop models that represent real-time situations in the aviation world.
In recent years, the number of databases available has increased immensely, as demonstrated by live tracking applications on the internet, which now offer a variety of data to the wider public. These applications provide a large number of details through the ADS-B system. The Automatic Dependent Surveillance–Broadcast (ADS-B) is becoming a key system for air traffic management, situational awareness and traffic data analysis(Reference Strohmeyer, Schäfer, Lenders and Martinovic12). In this paper, it is demonstrated that data from the ADS-B system, alongside other databases, can be extracted and used with a sophisticated flight performance model to predict fuel consumption and exhaust emissions of single aircraft types. The method is equally applicable to fleet-wide emissions. The emissions are evaluated in absolute value and in the vertical direction, and in terms of geographic location. In this paper, there is no specific analysis of emission reductions, as the methods shown are initially developed for analysis, allocation and accounting purposes.
The use of ADS-B is by no means novel. Some software applications, such as continuous measurements of noise around airfields, use flight track information to monitor arriving and departing aircraft at busy airfields, connection schedules, and transponder information with community noise measurement and monitoring. Thus, ADS-B can provide a platform for analysis of all aircraft environmental emissions, as demonstrated in the research presented herein.
2.0 METHODS AND MODELS
Key models and assumptions are summarised in Table 1; most of them have been verified in our previous work. The key advance is the use of the ADS-B flight trajectory that is fully integrated with the FLIGHT program.
Essential elements of this program have been documented in the published literature, for example Refs. (Reference Filippone13-Reference Filippone15). In this instance, we recall that there is a full configuration aerodynamics model built on top of a detailed geometry of the aircraft. The engine model relies on a steady-state one-dimensional analysis of the aero-thermodynamics, and provides all the engine parameters needed for flight mechanics, environmental emissions and acoustic simulations. The flight trajectories are normally self-generated with a flight mechanics module and trim conditions. However, in this case, the flight trajectories are the ADS-B data, through a novel pre-processor.
Key models and assumptions

To begin with, we have data extracted from the live tracking application. This source provides so-called Four-Dimensional (4D) trajectories (time, position and altitude), along with other parameters. Atmospheric conditions are not currently included and instead must be modelled, with assumptions required on air temperature. Aircraft and engine models are part of the FLIGHT software framework, alongside the configuration aerodynamics and the exhaust emissions models. The currently available aircraft/engine database includes about 60 commercial aircraft–engine combinations, corresponding to a total fleet of over 18,000 vehicles which are representative of current technology in commercial and military aviation.
Deterioration effects on the emission index and engine performance (fuel flow, compression rate and temperature corrections) have not been considered, because of insufficient information on the aircraft from the flight databases. However, these features are available on the overall simulation framework(Reference Bojdo, Filippone, Parkes and Clarkson16) and can be applied when additional flight information is shared.
2.1 Dataset description
The OpenSky NetworkFootnote * is a non-profit association which provides open access to real world air traffic control data(Reference Schäfer, Strohmeier, Lenders, Martinovic and Wilhelm19). The Automatic Dependent Surveillance–Broadcast is an aircraft surveillance technology that provides location information for aircraft in flight. The ADS-B provides the longitude, latitude and altitude of an aircraft, alongside its ground speed. Issues with accuracy, resolution and loss of data are discussed by Strohmeier et al. (Reference Strohmeyer, Schäfer, Lenders and Martinovic12)
True airspeed is not available from the ADS-B; therefore, a second dataset (Mode-S) is invoked, although true air speed appears in a number of internet applications that provide real-time flight tracking and flight statistics.
The Mode-S database from OpenSky contains information on the true airspeed and true Mach number, M. The Mode-S data are collected from a Secondary Surveillance Radar (SSR) network which has best coverage over Europe and North America. The SSR radar network is a line-of-sight system and therefore cannot track aircraft over the horizon, nor those blocked by other objects.
Each trajectory consists of a time stamp (in integer seconds), a Global Positioning System (GPS) position (latitude and longitude, with resolution of  $10^{{-}4}$ or $10^{{-}5}$degrees) and a geo-potential altitude (in integer feet, at intervals no smaller than 25 feet). At some time steps, both true air speed and the flight Mach number are available. Time stamps are variable from 1s (climb-out and final descent) to a few hours (in cruise), although this depends on the ADS-B and Mode-S coverage along the flight track.
Aircraft selection
We selected a carrier with hubs in continental Europe, where there is better ADS-B coverage, to demonstrate the methodology. Each aircraft has a unique (24-bit) ICAO24 identifier. For example, the ICAO24 record ‘3c65a8’ corresponds to an Airbus A380-841. The flights refer to the period of January to March 2020. For the same period, we also selected a turboprop aircraft, the ATR72-500, which is operated across Europe by several airlines and provides short-range connectivity.
Data extraction
For a given aircraft, the unique 24-bit ICAO identifier is obtained from the OpenSky database and used to interrogate the ADS-B database within a specific date range to identify flights. The ADS-B provides latitude, longitude, altitude and time at approximately 1-s resolution.
Essentially, the ADS-B data  $\{t, Lon, Lat, z \}$ are mostly complete. The Mode-S $\{t, M, \mbox{TAS}\}$ data are often incomplete; we use the time stamp from both ADS-B and Mode-S to align the TAS/Mach to the Lat/Lon/altitude. Mode-S is collected using radar stations. Their coverage is not complete, nor are they allowed to overlap.
The flight information is subsequently used to interrogate the Mode-S database for true airspeed (TAS) and Mach number. All inquiries are made to the OpenSky database using the Python traffic library(Reference Xavier20). More specifically, the data extraction procedure is as follows:
1. For a given ICAO24 identifier and date range, we use the OpenSky API to query all flights of that ICAO within the given date range. This first step is needed because some flights have multiple call signs that will throw up an error later, thus we need to separate out each call sign–ICAO combination.
2. We remove all the queried flights that contain bad values (‘None’), or depart or return from the same airport.
3. For all the remaining flights, we extract the first and last recorded time stamps of the flight and assign it to each flight. We use the call sign–ICAO combination to extract ADS-B data from the OpenSky history function.
4. We call the OpenSky Impala shell to extract the Mode-S EHS data (enhanced surveillance). The resulting EHS data contain many duplicate time stamps including different combinations of values, for example, two identical time stamps, one with latitude (LAT) and longitude (LON), but the other with AIRSPEED.
5. Therefore, we combine the duplicates together, preserving all data. Using the timestamps, we can calculate the length of the data gaps.
6. We extract out only the columns we are interested in and save to a comma-separated file. Occasionally, a flight will throw an unconventional error, so the whole routine is placed inside a try:except loop so that it moves on to the next flight.
A flowchart of this process is shown in Fig. 2. The yellow box ‘Data aggregation’ has not been addressed, but it can be scaled up to determine an emissions inventory based on real-time flight data – with some caveats, as discussed. In summary, the flight trajectory consists of the following state array:  $S = f\{t, Lat, Lon, z, \mbox{TAS}, M\}$. Everything else is modelled.
Data filtering and anomaly detection
When the trajectory data are acquired, two further operations are required: (1) checking that the trajectory is complete and (2) data filtering and anomaly detection.
The raw data often display inconsistencies, such as impulsive changes of altitude and air speed, with unrealistic climb or descent rates and Not-a-Number (NaN) instance. NaN events are eliminated automatically by the use of a logical filter.
Integration of ADS-B with the FLIGHT program to determine exhaust emissions from real-time flights.

Depending on the flight (continental or intercontinental), up to half of the ADS-B/Mode-S flights had to be discarded because of one of the following reasons: (1) records stopped before aircraft reached cruise altitude, Equation (1); (2) records stopped before flight was completed, Equation (2); (3) records did not cover a sufficient portion (at least 95%) of the flight time; (4) climb-out started at altitudes considerably higher than 3,000 feet above the airfield; (5) descent was cut short. The filters are as follows:
 \begin{equation} X > 500\ \mbox{n-miles} \rightarrow Z_{\rm max} > 30,000\ \mbox{feet}, (\mbox{FL300} ),\end{equation}
 \begin{equation} Z_{end} > 3,000\ \mbox{feet,}\end{equation}
 \begin{equation} t
< 0.95 t_{\rm req},\end{equation}
\begin{equation} t
< 0.95 t_{\rm req},\end{equation}
where the actual flight time t is less than 95% of the time required to fly the complete route,  $t_{\rm req}$. Data at altitudes $z <3,000$ feet are discarded, since there are too few points, the aircraft configuration is unknown, and too much interpolation and extrapolation would be required.
There are cases where cruise data are not stored but the final cruise altitude is available. For example, for an intercontinental flight, there could be a final cruise altitude of 38,000 feet (FL380) but the previous record is 35,000 feet within 30min from take-off. In this case, an intermediate point is added, so that half of the cruise is performed at FL380, as it would be unrealistic from the point of view of fuel economy to have a point at FL380 and start a descent without a cruise at that flight level.
The main reason why many trajectories are incomplete is due to the ADS-B coverage in some parts of the world. The requirement for filters on the raw data is not something new, as this was previously established with FDR data(Reference Filippone15). A complete flight that maintains a realistic schedule is necessary to estimate fuel burn and emissions with sufficient confidence. There are various ways to detect anomalies in the data, but in this case a low-pass smoothing filter is applied to TAS and Mach numbers, whilst the altitude is corrected with checks on the climb/descent rate. An example of raw and filtered trajectories is shown in Fig. 3.
Frankfurt–Munich flight trajectory of an Airbus A380, showing altitude (a) and air speed (b).

2.2 Flight performance models
The datasets thus obtained are by themselves insufficient to carry out a complete flight performance analysis, because critical data are missing. Among these are the gross weight at the start of the flight and key atmospheric conditions (temperature and winds).
For each trajectory, we can compute the actual distance between the origin and destination airport, which is never the great circle distance. This distance is then used to make inferences about the initial weight by assuming an average passenger load factor and the required mission fuel.
Since the exact take-off and landing configuration is unknown from the ADS-B/Mode-S data, we cut the trajectory to altitudes  $z >$ 3,000 feet, and thus leave out the field performance as well as the corresponding landing and take-off emissions (LTO). Calculation of field performance requires a more complete dataset than is currently available. A detailed flight performance analysis that is properly validated is more accurate than relying on partial databases, as demonstrated for $\mathrm{CO}_2$ emissions of commercial aircraft(Reference Filippone18).
Aircraft weight
An estimate of the aircraft’s gross weight is necessary to carry out any environmental calculations, something that is not emphasised enough in much technical literature, for example Refs. (Reference Wilkerson, Jacobson, Malwitz, Balasubramanian, Wayson, Fleming, Naiman and Lele5,Reference Jelinek, Carlier and Smith21). The SAGE system(Reference Lee, Waitz, Kim, Fleming, Maurice and Holsclaw6) uses a notional value of the take-off weight based on stage length, which is elaborated from proprietary databases.
The weight determines the thrust/power requirements by way of total aerodynamic drag, acceleration, and climb and descent rates. When the thrust requirements have been determined, a gas turbine engine model is required to establish the relationship between thrust and the corresponding fuel flow (or the gas turbine speed). The calculation chain is as follows: vehicle’s aerodynamic drag D, flight mechanics leading to net thrust  $F_N$, and engine cycle analysis leading to an engine state that delivers $F_N$ with a fuel flow $W_{f6}$.
Approximation of Equation (4) for the Airbus A380-841.
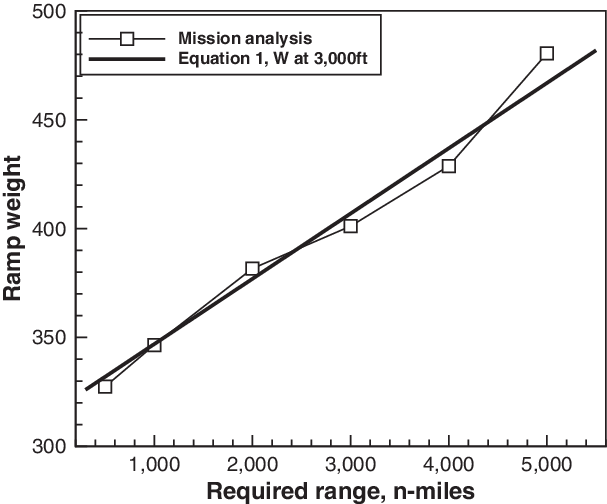
In the present context, the gross weight is estimated by running a payload-fuel mission analysis. To simplify this procedure, we make a first-order estimate of the fuel required by using the following approximation:
 \begin{equation} W = \mbox{ZFW} + \max\left\{W_f\right\} \left(\frac{X}{X_{\rm design}} \right),\end{equation}
where ZFW is the zero-fuel weight,  $\max\{W_f\}$ is the design fuel capacity, X is the actual flight distance and $X_{\rm design}$ is the design range. The ZFW is estimated assuming a 90% passenger load factor and refers to the first time step tracked in the ADS-B trajectory. Thus, it does not take into account any bulk payload (which is unknown), or the fuel burn from the gate to $z =$ 3,000 feet. The load factor is used to infer the loaded weight of passengers, their luggage, the number of cabin crew and all the on-board services. Figure 4 compares the A380-841 weight estimated from Equation (4) with the weight calculated iteratively with a full mission analysis.
Atmospheric temperature
The atmospheric temperature is estimated as follows: First, we estimate the speed of sound at the aircraft position from  $a =\mbox{TAS} \cdot M$. The corresponding air temperature is then
 \begin{equation} T_1 = \frac{a^2}{\gamma {\mathcal R}},\end{equation}
where  ${\mathcal R}$ is the ideal gas constant and $\gamma$ is the ratio between specific heats. We then calculate the air temperature T at the same altitude, assuming a standard atmosphere. The difference $T_1- T$ is used as a measure of the deviation of the actual atmosphere from a standard day, and the corresponding thermodynamic conditions are then calculated (air pressure and density).
The ground speed could be inferred from the change in GPS coordinates with respect to time. However, this can be quite inaccurate due to the limited resolution (four decimal digits) of the GPS coordinates, although some spikes can be eliminated by using central differences around the current position. Likewise, wind speeds are not available from these datasets. For example, using the approximation  $V_g=\mathrm{d}s\mbox{/}\mathrm{d}t$, we could get the wind speed as $V_w = \mbox{TAS} -V_g$. Unfortunately, these equations yield unrealistic and unverified wind speeds at cruise altitude.
Flight mechanics
The aircraft is assumed to be flying along an arc defined by successive GPS points. The net thrust  $F_N$ required at each point is given by
 \begin{equation} F_N = D + \left(\frac{W}{g}\right) \frac{\mathrm{d} V}{\mathrm{d}t} + W \sin \left[{\tan} ^{{-}1} \left(\frac{\mathrm{d}z}{\mathrm{d}t}\right) \right],\end{equation}
where D is the total aerodynamic drag(Reference Filippone14) at air speed V,  $\mathrm{d} V / \mathrm{d}t$ is the acceleration, $\mathrm{d}z/\mathrm{d}t$ is the climb or descent rate. The fuel flow $W_{f6}$ and other engine parameters are then calculated by solving the engine state in reverse.
In Equation (6), the derivative of the true air speed on the filtered data is uncertain. The weight term with the climb/descent rate is critical to the whole procedure. Thus, at this point, another filter is required. The climb rate is calculated on a coarse array with time steps of 20–30s; climb/descent rates  $|v_c| < 100$ feet/min ( $\sim$0.5m/s) are set to zero. One typical result is shown in Fig. 5. Note that this particular trajectory still has spurious climbs in the middle of the cruise.
Filters applied to a climb-out and initial cruise trajectory.

Exhaust emissions
At this point, it is necessary to use external data. These are invariably the emissions data that are found within the ICAO data bank(10), which are published for regulatory purposes. Emission data are only known at four reference points at sea level and static conditions. Therefore, a number of operations are required to establish emission indices for part-load engines.
The FLIGHT program uses a modified version of the fuel flow model(Reference Baughcum, Tritz, Henderson and Pickett22), with a correction on emission index to account for atmospheric effects (temperature, pressure and relative humidity). The fuel flow  $W_{f6}$ is calculated directly from the aero-thermodynamics of the engine at every point in the flight alongside the appropriate trim Equation (6). This approach takes into account the actual thrust/power requirements in flight, with all the aerodynamic effects and engine installation losses. Therefore, the emission d $m_i$ of species i during a time step dt is
 \begin{equation} \mathrm{d}m_i = EI_i \, W_{f6} \, n \mathrm{d}t,\end{equation}
where n is the number of operating engines. The main problem with applying Equation (7) is the determination of the appropriate emission index to use. The database published by the ICAO only refers to static tests and does not account for flight conditions. The ICAO data are themselves worthy of a further comment: they refer to static measurements with one (seldom more), uninstalled engine. For example, the Rolls-Royce Trent 970-84 has three tests on a single engine, and the average  $\mathrm{NO}_x$ emissions across the test points are $49.5 \pm 0.77$g/kN, which implies a 1.5% confidence level around the mean value. However, this is a single, uninstalled new engine, which is not representative of real-life situations.
A number of models have been proposed to overcome the limitation of the data in order to cover actual flight conditions, with the Boeing fuel flow model currently prevailing(Reference Baughcum, Tritz, Henderson and Pickett22). The emission index correction used in our work follows that method, which was also verified with in-flight measurements(Reference Schulte, Schlager, Ziereis, Schumann, Baughcum and Deidewig23) on three aircraft with different turbofan engines. For non-regulatory engines, there are no emission indices available in the public domain, and the statistical method shown in Ref. (Reference Filippone and Bojdo17) is used instead. Emissions are calculated for  $\mathrm{NO}_x$, CO, UHC, $\mathrm{SO}_x$, $\mathrm{H}_2\mathrm{O}$ and smoke number. These emissions can be partitioned among the different phases of flight (taxi, ground, LTO, stratospheric, etc.) by simple accounting procedures.
Reference systems
The aircraft position is given in GPS coordinates; these coordinates are transformed into an absolute reference system where the origin airport (identified from a database of airfields) has coordinates (0, 0). The aircraft follows a trajectory to the destination airport (identified again from the GPS coordinates) along a trajectory defined by [s(t),z(t)], where s(t) is the arc length travelled to time t. Track dispersion and flight altitude dispersions are maintained.
3.0 VALIDATION AND VERIFICATION
The prediction of combustion emissions is carried out with the author’s own computer program FLIGHT, documented in several earlier publications, along with some ancillary models(Reference Filippone13) and previously cited literature.
The prediction of exhaust emissions follows the model described in Ref. (Reference Filippone and Bojdo17). The emissions of carbon dioxide ( $\mathrm{CO}_2$) and water vapour are proportional to the fuel burn. Sulphur oxides ( $\mathrm{SO}_x$) depend on the fuel and are essentially proportional to fuel burn. The CO, $\mathrm{NO}_x$ and UHC depend on the specific engine and the thrust/power output. The emissions that are calculated flying the ADS-B trajectory can be separated between tropospheric and stratospheric ( $z_{\rm tropopause} =$ 11,000m/36,000 feet).
Engine models are verified as much as possible with available datasets. A demonstration of the accuracy of various gas turbine performance characteristics was reported in Refs. (Reference Filippone and Bojdo17,Reference Filippone24) (turboprop PW150 for the Bombardier Dash8 Q400, and the turbofan CF34 for the Embraer E195) and Ref. (Reference Bojdo, Filippone, Parkes and Clarkson16) (Rolls-Royce Trent 900 for the Airbus A380-841). The latter is used in the simulation analysis shown next.
In our previous work(Reference Filippone and Bojdo17), it is demonstrated that the LTO emissions calculated on the basis of the actual flight conditions derived from the FDR are considerably different from estimates that rely on standard ICAO time-in-mode. Therefore, expanding to the complete trajectory, it is necessary to have accurate engine states throughout the flight, something that is attempted by using the ADS-B/Mode-S, since FDR data are not available in real time.
3.1 Results
Emissions analysis based on a single flight is not very instructive because of considerable differences between aircraft, flight procedures, atmospheric conditions, gross take-off weight and other factors.
The ADS-B/Mode-S data processed included 509 flights of the A380-841 (Trent 970-84 engines), 470 flights of the Airbus A330-343 (Rolls-Royce Trent 772 engines), 437 flights of the Airbus A350-900 (Trent XWB-75 engines) and 1,270 flights of the ATR72-500 (PW127M engines) – a grand total of  $\sim$2,500 flights, mostly intercontinental, but also shorter and domestic flights. These flights were operated between January and March 2020.
The data analysis carried out includes: (1) fuel burn analysis by distance and by aircraft type; (2) exhaust emissions ( $\mathrm{NO}_x$, CO and UHC) by aircraft and by type; (3) altitude distribution of $\mathrm{NO}_x$ emissions. Emissions of carbon dioxide ( $\mathrm{CO}_2$), water vapour ( $\mathrm{H}_2\mathrm{O}$) and sulphur oxides ( $\mathrm{SO}_x$) are not shown, as these are proportional to the fuel burn.
Figure 6 shows the predicted fuel burn and the corresponding maximum cruise altitude, as functions of the required range. The data are not differentiated by route or flight direction, something that is done separately. The dashed line at 36,000 feet is the tropopause. Symbols above this line indicate stratospheric flight for at least a portion of the cruise. We observe that is it quite remarkable that there can be a difference of as much as 10,000 feet (10 flight levels) between trajectories for the same origin-destination pair. For the same city pair, there can be differences in flight paths and thus differences in flight times and fuel burn. The dashed lines in Fig. 6 are trends and must not be interpreted as accurate interpolations. For the A380, the records show a short Munich–Frankfurt flight with a low cruise altitude (Figs. 6a, 3).
Predicted fuel burn across the fleet and network. The dash-dot line represents the tropopause.

As mentioned, key assumptions are the gross weight and the atmospheric conditions, which are not part of the available database and would have to be sourced differently; weight effects could be partly responsible for the spread in fuel burn seen in most of these cases, but other causes could include the age and status of the engines, as indicated elsewhere(Reference Lukachko and Waitz25).
A mission analysis carried out for selected stage lengths of the A380-841 (Fig. 4) indicates that the difference in weight between leaving the ramp and reaching 3,000 feet above the airfield is  $\sim$2,000kg, corresponding to a fuel burn of $\sim$1,500kg for taxi-out, $\sim$250 for take-off and the remaining fuel for climb-out in about 3min. This fuel burn is much less that the data spread in Fig. 6.
3.2 Analysis of $\textbf{NO}_{\textbf{\textit{x}}}$ emissions

Emissions of gases such as  $\mathrm{NO}_x$ and CO do not scale with fuel burn. For a complete simulation, we must account for the actual operational conditions (weight, flight altitude, Mach number, thermodynamic conditions in the combustor, etc.). For these emissions, we use additional modelling techniques that allow one to overcome the complexities of the combustion process, whilst maintaining some degree of physics that allows us to make a judgement based on key flight parameters.
Figure 7 shows the results for a mixed fleet of A380, A350 and A330 operating mostly intercontinental flights. Emissions are calculated at each time step and analysed in a number of ways. In this instance,  $\mathrm{NO}_x$ are sorted in the vertical direction into 1,000-feet bins. The results clearly indicate a tendency to concentrate at stratospheric altitudes.
3.3 Analysis of $\textbf{H}_{\textbf{2}}\textbf{O}$ emissions

Water vapour is one of the main components of gas turbine exhaust gases, and a critical contributor to environmental effects in the form of aircraft condensation trails (contrails). Extensive research exists on the effects of cruise altitude on contrail formation (for example, Ref. (Reference Fichter, Marquat, Sausen and Lee26)), with broad agreement that, in the high atmosphere, these emissions could seed cirrus clouds that have short- and medium-term effects. To highlight how the ADS-B/Mode-S/FLIGHT integration operates, Fig. 8 shows the altitude-dependent water vapour emissions for the A380 and A350. The shaded area refers to the range of altitudes that are most critical to the formation of contrails. Assembling large datasets with the models described would allow one to define a more complete assessment of altitude effects on water vapour emissions.
Predicted altitude-dependent  $\text{NO}_{\textit{x}}$ emissions for all aircraft in the fleet.
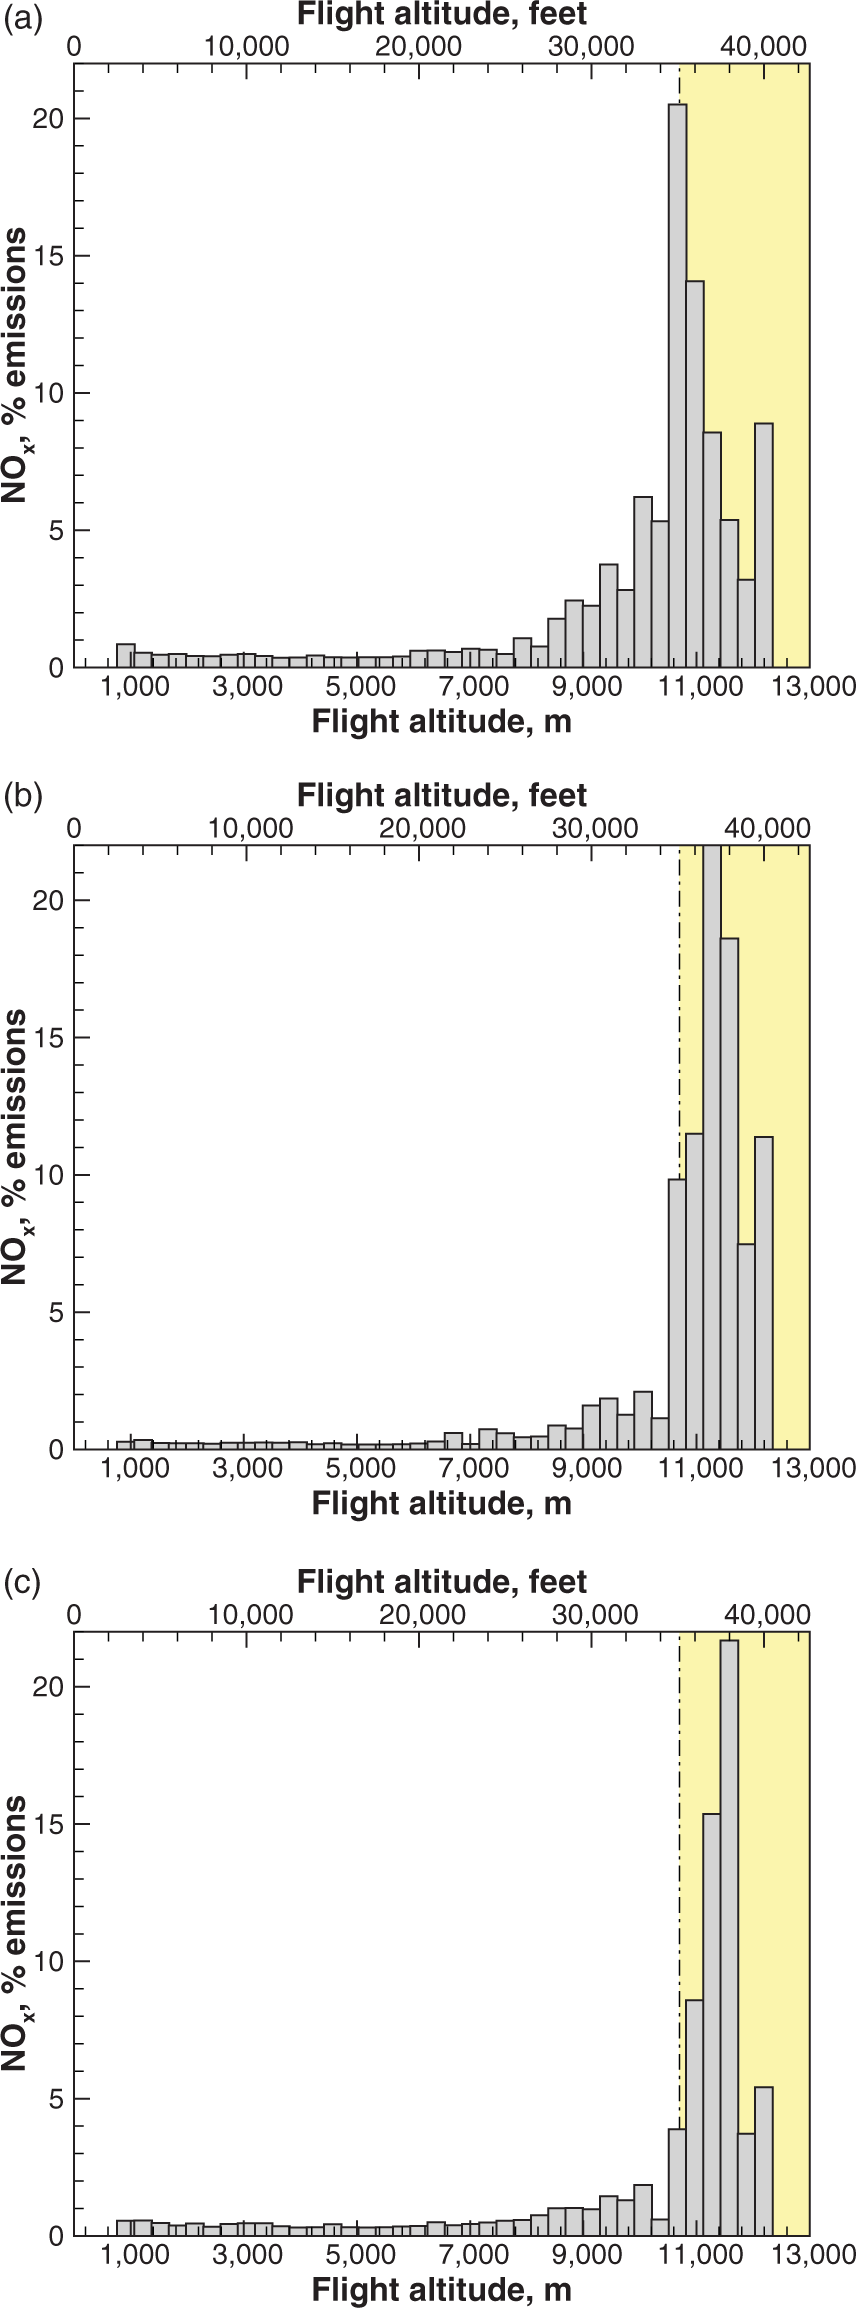
Predicted altitude-dependent  $\text{H}_{\text{2}}\text{O}$ emissions for the A380 (based on 170 flights) and A350 (125 flights).

3.4 Analysis of city-pair emissions
The performance and emission data allow us to identify city pairs served by each aircraft. This has been done for the A380-841 and A350-900, as shown in Figs 9 and 10. In the former case, we analyse the vertical distribution of  $\mathrm{NO}_x$ emissions for two intercontinental flights. There are marked differences between the two aircraft; nevertheless, $\mathrm{NO}_x$ emissions are concentrated in the high troposphere or low stratosphere. A similar analysis can be shown for the CO and other emissions species. There is some variability among different flights, as explained in Section 3.6.
For the A350, Fig. 10 shows a selection of city pairs. In all cases, there are large variations between flights, although it can be inferred that there are differences in emissions between eastbound and westbound flights. Although the former type of variability cannot be assessed from the ADS-B data only, the atmospheric effects must play a role in the emissions of outbound and inbound flights. Again, due to the variability of the data, a large number of complete flights would be needed to provide meaningful averages that can be extrapolated over longer time scales.
Predicted altitude-dependent  $\text{NO}_{\textit{x}}$ emissions on a single city-pair route for the A380 (37 flights between Bangkok and Frankfurt) and A350 (17 flights between Singapore and Munich).
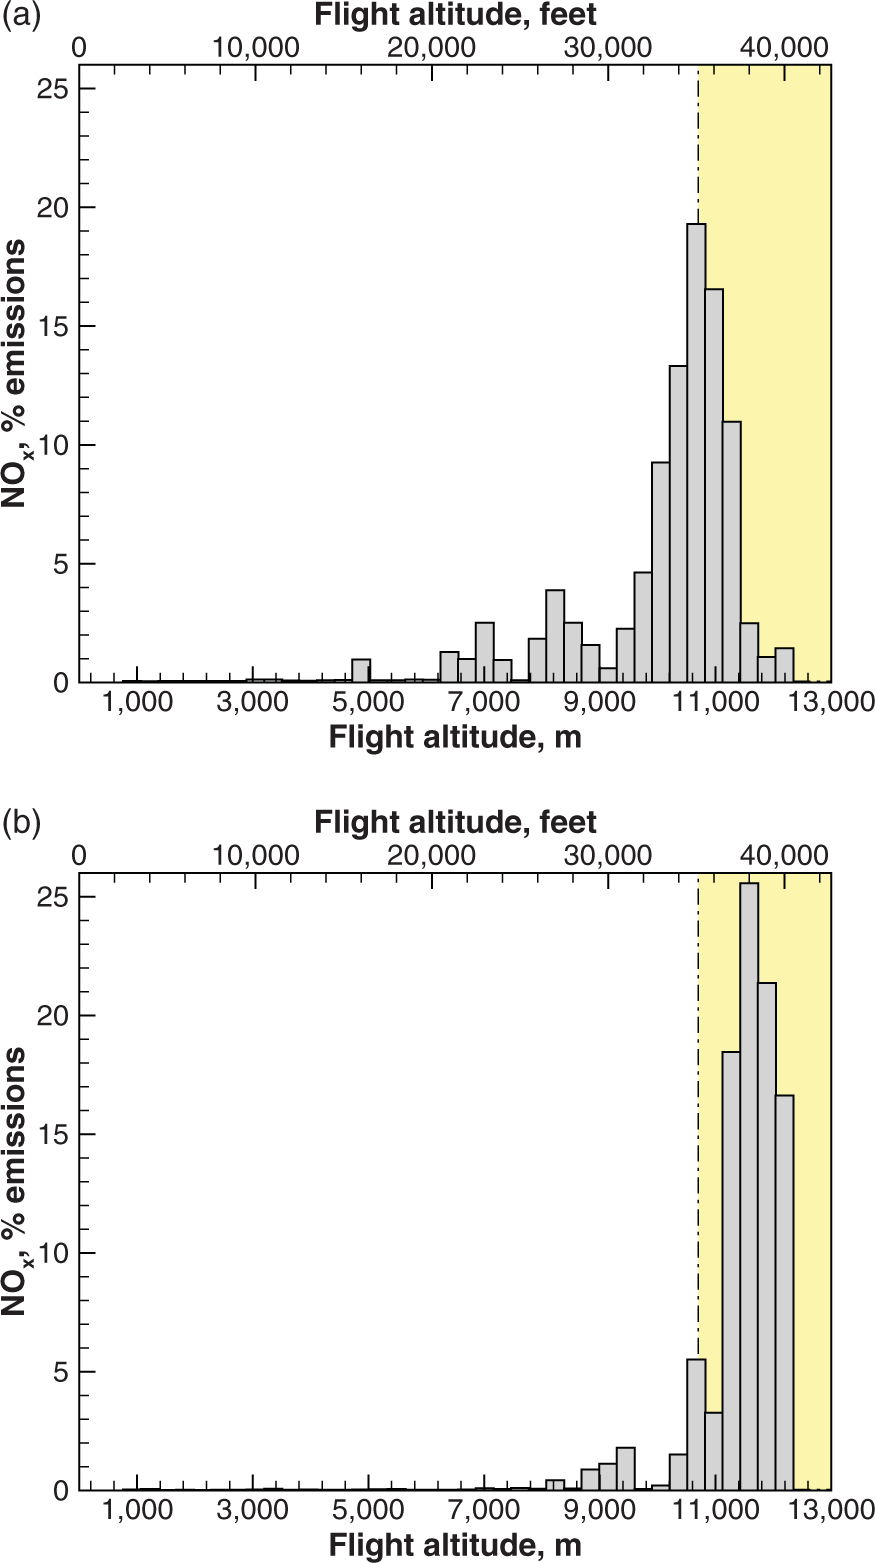
Predicted route-dependent emissions and fuel burn for the Airbus A350; ‘E’ and ‘W’ denote eastbound and westbound flights, respectively, in (a). Identical symbols are as follows: white/coloured for inbound/outbound, respectively.

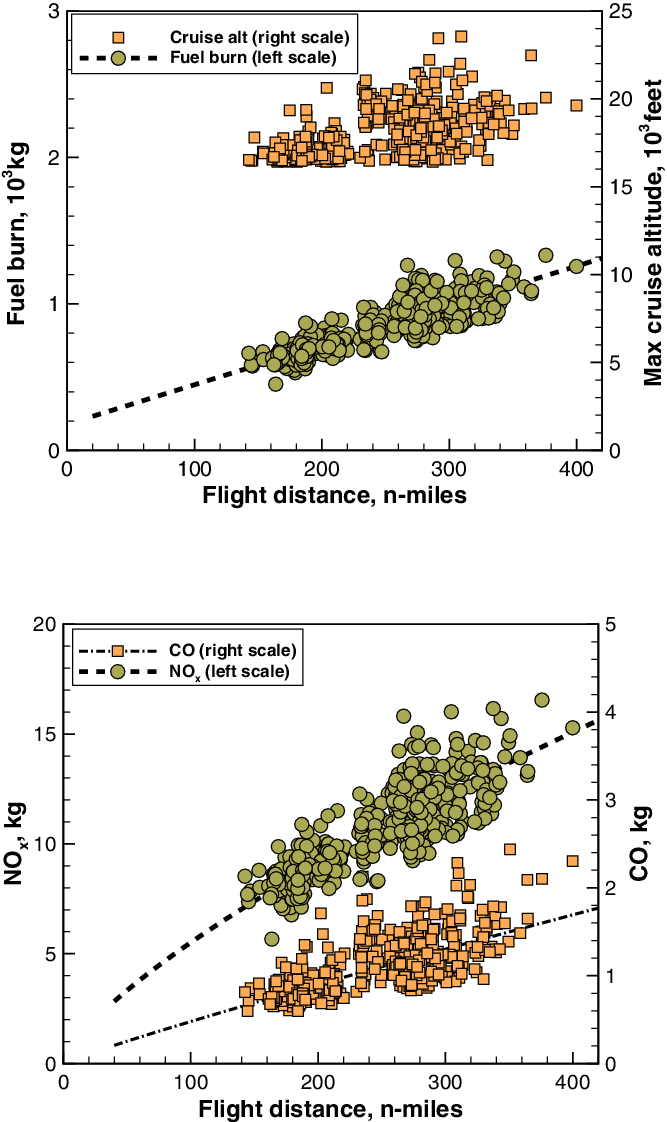
Predicted fuel burn and emissions of an ATR72 turboprop aircraft.
For the same route, there can be differences of hundreds of nautical miles between the actual distance flown and the great circle distance. Outbound and inbound flights may follow different corridors, thus the emissions will be different.
3.5 Turboprop emissions
The emissions models for this type of aircraft have been shown in Ref. (Reference Filippone and Bojdo17). For this class of aircraft, there are no emissions indices available in the public domain. Since turboprop engine emissions are currently unregulated, there is no obligation to provide the public with data that can be used to assess the contribution of this class of aircraft.
Predicted  $\text{NO}_{\textit{x}}$ versus altitude emissions of an ATR72 turboprop aircraft.

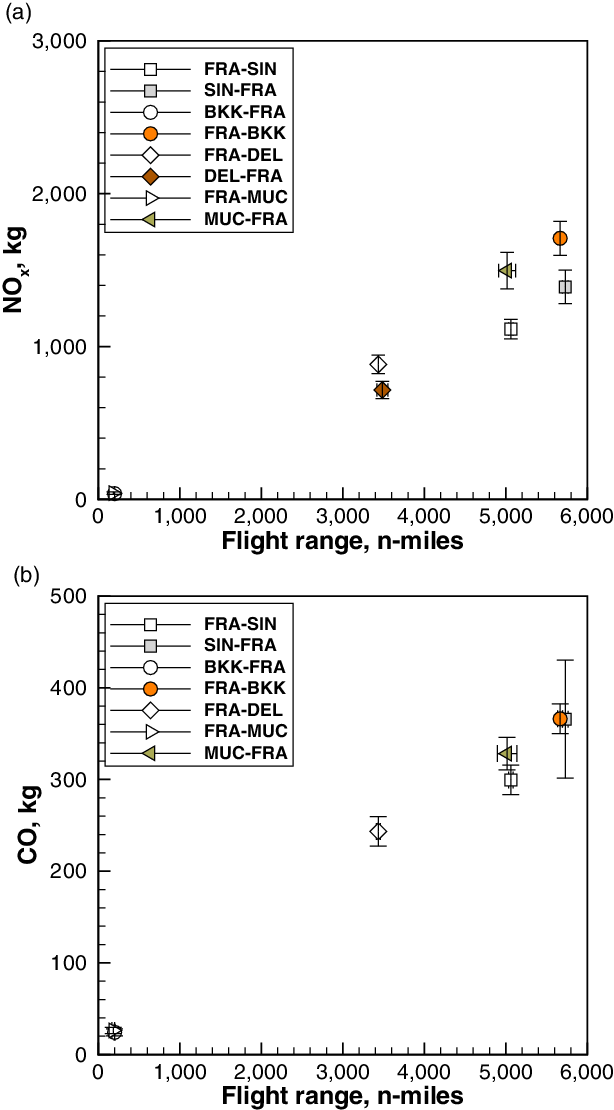
Statistical analysis of  $\text{NO}_{\textit{x}}$ and CO emissions for the Airbus A380 for selected city pairs (outbound/inbound).
Statistical analysis of emissions for the Airbus A380 on the BKK–FRA route. Each symbol represents a flight, the arrows point to mean values; the shaded area represents one standard deviation around the mean.

Flight tracking of a single aircraft over a 2-month period, which can be used to allocate emissions to specific geographical areas.

In this case, we processed over 1,200 flights of the ATR72-500, mostly serving airports such as Dublin, Glasgow and Manchester. Along these routes, there is much better coverage of ADS-B/Mode-S, and only a few flights were discarded from the analysis. A sub-set of the data is shown in Fig. 11 for clarity. The statistical data in Fig. 12 include all flights. In the latter case, we show that  $\mathrm{NO}_x$ emissions are concentrated at considerably lower altitudes, with a peak at 15,000 feet. Ranges are very short, from 140 to 350n-miles, in some cases with reduced time in cruise.
3.6 Sensitivity analysis
Lee et al.(Reference Lee, Waitz, Kim, Fleming, Maurice and Holsclaw6) showed a sensitivity analysis on their SAGE system by using randomised deviations on ten parameters, one of which was the gross weight. They considered one standard deviation around the mean value for cruise speed, altitude and dispersion track. These parameters are not considered here because we use ADS-B data, which are proxies for real flight trajectories. Deviations of fuel flow can be attributed to a number of causes.
A sensitivity analysis is carried out to evaluate the weight effect on the resulting emissions. In this instance, a variation of  $\pm 2\%$ on Equation (4) is assumed, and the aircraft is flown along the prescribed trajectory. It is demonstrated that the required stage length is the key discriminator when it comes to overall emissions, as the actual changes in fuel burn and $\mathrm{NO}_x$ emissions are of the same order of magnitude. For example, for an Airbus A380 on an intercontinental flight, the weight approximation is several metric tons, and there is a 1.9–2.8% variation of $\mathrm{NO}_x$ around the baseline value. This is a smaller variation than inponderable effects on a real-life flight Figs 13 and 14.
Large differences in fuel burn over the same route have been predicted within city pairs, for example Fig. 10. This inevitably causes similarly large variations in emissions. Figure 13 shows a statistical analysis of emissions for a selected case, the Airbus A380. The symbols are the mean values, while the error bars extend one standard deviation above/below the mean value. For the range, there is a horizontal error bar, similarly based on one standard deviation around the mean. The flight data used are the same as in Fig. 6.  $\mathrm{NO}_x$ emissions exhibit extreme variability in a few cases, possibly due to some outliers that have not been identified. In the case of carbon monoxide, it is clear that the flight range is the main discriminator in the overall emissions of this species.
Narrowing down to a single route, viz. the  $\sim$5,000n-mile BKK–FRA intercontinental flight, we obtain the statistical data shown in Fig. 14, where the shaded areas denote one standard deviation around the mean values. The difference in effective flight range is also quite remarkable ( $\pm$100n-miles, or $\pm$2% around the mean value). The initial 2% approximation on the initial weight (attributable to payload or fuel, or both) would be sufficient to account for flight track dispersion.
3.7 Discussion
Current ICAO regulations for  $\mathrm{NO}_x$, CO, UHC and smoke emissions only cover the take-off and landing cycles for rated thrust higher than 26.7kN; these regulations only affect large turbofan engines (e.g. turboprops and most business jets are excluded). For higher altitudes, there is currently no agreed means of verification, and all emissions forecasts proposed are just that. The ICAO emissions data, whilst useful, must be taken with caution, because they refer to static ground measurements, often with new engines. Large variability of emission indices is caused by engine age and maintenance schedule.
The results shown herein indicate that it is indeed possible to extract flight data in the open domain, process the data and provide predictions of aviation emissions at altitude. However, these data are often partial. Thus, a number of operations are required to distil complete and reliable trajectories, and large datasets are needed to provide useful statistics. It is a matter of simple accounting to aggregate these data over entire fleets, elaborate data by week, month, season and year and by geographical location. One example is shown in Fig. 15, where a single aircraft is tracked over time.
It is not known whether models such as Eurocontrol’s AEM include all flights or only a sub-set; equally unknown is how the aircraft gross weight is estimated – this is generally not disclosed by commercial airline operators. AEM’s documentation(Reference Carlier and Smith7,Reference Jelinek, Quesne and Carlier27) does not provide this detail.
The use of the Boeing fuel flow model(Reference Baughcum, Tritz, Henderson and Pickett22) and its derivatives is necessary when a detailed engine model is not available. This model was initially presented as an appendix to a technical report, and has since become an accepted instrument (or ‘de facto standard’) for correcting emissions indices for altitude, temperature and Mach number effects(Reference DuBois and Paynter28). In the Boeing fuel flow model, there is consideration of the actual aero-thermodynamic conditions on the combustor. Previous investigations by other authors demonstrate that the emissions indices depend on two key engine parameters: the combustion temperature and the pressure at the inlet and exit of the compressor. The effects of the temperature of combustion have been evidenced in past research, with more recent research indicating the role of entry temperature, adiabatic flame temperature and overall compression ratio, among others (e.g. Refs. (Reference Lukachko and Waitz25,Reference Tacina29,Reference Tacina, Lee and Wey30)). With incorrect aero-thermodynamic data in the combustor, estimates of the  $\mathrm{NO}_x$ could be at least 30% inaccurate.
In the present instance, we use an aero-thermodynamic model of the engine, which allows a prediction of the fuel flow over the entire flight envelope of the aircraft. All relevant thermodynamic parameters are available, including the entry conditions in the combustor,  $T_3$ and $P_3$, which should allow $\mathrm{NO}_x$ predictions according to the P3–T3 model(Reference Lukachko and Waitz25). However, this model appears to be less reliable than initially thought, because there is no specific correction for other factors, and it would lead to the same emissions for two different engines having similar aero-thermodynamic conditions in the combustor, unless the correct empirical parameters are available for each engine. Discrimination between combustors will have to be done empirically, and this approach is not feasible in the present context. A review of alternative $\mathrm{NO}_x$ prediction models is given in Ref. (Reference Chandrasekaran and Guha31), where it is shown how several different methods produce considerably different answers for the same aero-engine. Emissions on the ground can be measured using a number of techniques(Reference Heland and Schäfer32), and confidence in the data is robust, but for airborne emissions at high altitude, we still rely on modelling rather than measurements, with a few exceptions(Reference Schulte, Schlager, Ziereis, Schumann, Baughcum and Deidewig23).
It must be further noted that actual emissions depend on the carbon content of the fuel, the combustion temperature, the engine conditions, the accurate estimation of the emission indices at the reference points and the air temperature. With regards to the latter point, differences in fuel flow at cruise conditions can be over 5–6% from a cold day to standard day, or from a hot day to a standard day (e.g. the ATR72).
Therefore, there is some variability in emissions due to both external and internal factors. Additional variability has been detected from occasional changes in route, U-turns on final approach and landing, loitering, etc. – all operations that add to the fuel consumption and flight time without adding to the flight distance.
In summary, the approximations involved in the computational chain involve the accuracy of the ADS-B trajectory, the accuracy of the fuel flow, the model for emissions indices in flight, the atmospheric conditions and several unknown externalities (e.g. engine age).
Once the ADS-B flight trajectories are ready, they are parsed and simulated by the FLIGHT program in  $\sim$2min each, meaning that the system (Fig. 2) is capable of processing about 30–40 trajectories per hour, without implementing further savings at various points in the computational chain. For short-range turboprop aircraft, trajectories are processed at the rate of 2/min.
4.0 CONCLUSIONS
ADS-B real-time data can be extracted through a software interface to create databases that can be further integrated into aircraft performance software to predict aviation emissions at altitude. We have demonstrated that these data require distillation and filtering for further analysis. ADS-B/Mode-S do not have uniform cover, and it is possible that some flights are incomplete because they operate to/from areas where there are few receivers. Thus, flights appear incomplete when pre-processing. However, the methods shown are equally valid for commercial aviation, cargo aircraft, general aviation, military aircraft and helicopters, as long as these aircraft are equipped with ADS-B transponders.
The raw ADS-B data still need considerable mathematical handling, including filtering of outliers and smoothing to avoid unrealistic speeds and accelerations. When this initial analysis is carried out, we can generate predictions of fuel burn and exhaust emissions depending on aircraft type, route and direction. These emissions can be further analysed in the vertical direction to produce forecasts for tropospheric and stratospheric  $\mathrm{NO}_x$, CO and UHC emissions.
The geographical location of the emissions has not been investigated. Most aviation emissions inventories do this. However, it is noted that from the GPS coordinates of the aircraft it would be a straightforward step to plot the flight paths on a global map and thus produce heat maps of local emissions.
Once the method is demonstrated to work, emissions can be analysed at a very granular level, down to a single flight or specific city pairs, to spot trends and identify possible decisions on reducing emissions, for example by replacing aircraft on certain routes or reconfiguring the fleet. The software framework can be automated for number-crunching large databases.
The numerical methods can be further expanded to include other routes, within the limitation of ADS-B coverage, over longer periods of time, and therefore they can make up an alternative method for forecasting aviation emissions without relying on indirect inventories or airline-specific data. Key to this approach is the availability of sufficiently validated aircraft performance and emissions models, which have been developed prior to the work presented. Another element that will need to be added is detailed weather forecasting, specifically winds, atmospheric temperature and humidity, all of which are essential in aircraft performance prediction.
ACKNOWLEDGEMENTS
Ben Parkes is the recipient of the Ekpe Research Impact Fellowship in the Department of Mechanical, Aerospace and Civil Engineering at The University of Manchester. Researcher Thomas Kelly is supported by UK NERC Grant NE/L002469/1.


 Open access

