


1. Introduction
Metamorphic inversion, expressed by structurally higher rocks recording higher-pressure and/or higher-temperature conditions than underlying units, is a well-documented feature of many collisional orogens. Such inverted metamorphic sequences are commonly associated with crustal thickening, thrust stacking and syn- to post-collisional exhumation and have been described from a wide range of orogenic systems worldwide. These include classic examples from the Himalaya–Tibet system, the Scandinavian Caledonides and the European Variscides (e.g. Le Fort, Reference Le Fort1975; Gee, Reference Gee1978; Burg et al. Reference Burg, Matte, Leyreloup and Marchand1984; Swapp and Hollister, Reference Swapp and Hollister1991), where inverted metamorphic gradients reflect the tectonic juxtaposition of crustal slices with contrasting pressure–temperature (P–T) histories during continental collision and subsequent reorganization of the orogenic wedge. In these settings, metamorphic inversion is not a singular process but the outcome of multiple mechanisms, including ductile thrusting, underplating, wedge extrusion and late-stage extensional unroofing (e.g. Jamieson et al. Reference Jamieson, Beaumont, Hamilton and Fullsack1996).
In the Western Carpathians, metamorphic inversion within the crystalline basement has long been recognized as a characteristic feature of Variscan tectonometamorphic evolution (e.g. Kahan, Reference Kahan1968; Fritz et al. Reference Fritz, Neubauer, Janák and Putiš1992). The region represents a classical Alpine nappe stack constructed from pre-Alpine basement and cover units during the closure of Neotethyan and Alpine Tethyan oceanic domains (Plašienka et al. Reference Plašienka, Grecula, Putiš, Hovorka, Kováč, Grecula, Hovorka and Putiš1997; Froitzheim et al. Reference Froitzheim, Plasienka, Schuster and T2008; Schmid et al. Reference Schmid, Bernoulli, Fügenschuh, Tischler and Ustaszewski2008, Reference Schmid, Fügenschuh and Kounov2020; Plašienka, Reference Plašienka2018). Even though the Alpine thrust tectonics dominates the Central Western Carpathians (e.g. Lugeon, Reference Lugeon1903; Uhlig, Reference Uhlig1903, Reference Uhlig1907; Andrusov, Reference Andrusov1938, Reference Andrusov1968), the orogen exposes remnants of Variscan basement that were only partially overprinted during Alpine deformation (Janák, Reference Janák1994; Janák et al. Reference Janák, Hurai, Ludhová, O´Brien and Horn1999). This feature offers an exceptional opportunity to investigate older crustal-scale processes. Among these, the Tatric Superunit occupies a key structural position at the base of the Central Western Carpathian nappe system and preserves a well-developed Variscan metamorphic architecture (e.g. Plašienka et al. Reference Plašienka, Grecula, Putiš, Hovorka, Kováč, Grecula, Hovorka and Putiš1997; Froitzheim et al. Reference Froitzheim, Plasienka, Schuster and T2008; Plašienka, Reference Plašienka2018).
The Tatric basement is traditionally subdivided into upper and lower tectonometamorphic units that together form an inverted metamorphic sequence, with high-grade rocks structurally overlying lower-grade assemblages (Janák, Reference Janák1994; Janák et al. Reference Janák, Hurai, Ludhová, O´Brien and Horn1999). This relationship has been interpreted as the result of Variscan thrusting and nappe emplacement, producing a significant pressure discontinuity across the unit boundary (Janák, Reference Janák1994; Janák et al. Reference Janák, Hurai, Ludhová, O´Brien and Horn1999; Moussallam et al. Reference Moussallam, Schneider, Janák, Thöni and Holm2012). While the metamorphic evolution of the upper unit has been constrained by numerous petrological and geochronological studies (e.g. Janák, Reference Janák1994; Janák et al. Reference Janák, O´Brien, Hurai and Reutel1996, Reference Janák, Hurai, Ludhová, O´Brien and Horn1999; Moussallam et al. Reference Moussallam, Schneider, Janák, Thöni and Holm2012, Burda et al. Reference Burda, Klötzli, Majka, Chew, Li, Liu, Gawęda and Wiedenbeck2021), the lower unit remains comparatively poorly quantified in terms of its P–T conditions and timing of metamorphism. As a result, existing tectonometamorphic models for the Tatric Superunit rely on assumptions regarding the pressure contrast, burial depth and thermal structure of the lower crust during Variscan convergence.
This knowledge gap is critical because quantitative constraints from structurally lower units are essential to discriminate between competing models of metamorphic inversion. Numerous case studies demonstrate that similar inverted sequences may form through fundamentally different processes, including syn-convergent thrust stacking, underplating beneath hot nappes or later reactivation during extensional collapse (England and Molnar, Reference England and Molnar1993; Jamieson et al. Reference Jamieson, Beaumont, Hamilton and Fullsack1996; Harrison et al. Reference Harrison, Grove, Lovera and Catlos1998). Without robust P–T–time constraints from both sides of an inverted sequence, it remains difficult to assess whether inversion reflects a single-stage thrust-related process or a more complex, multi-stage tectonothermal evolution.
The research strategy of this paper is therefore focused on providing new quantitative constraints on the metamorphic evolution of the lower unit of the Tatric basement. We apply phase equilibrium modelling to metapelitic rocks to derive internally consistent P–T estimates and combine these results with in situ Th–U–Pb monazite geochronology to directly link metamorphic conditions with absolute timing. To place these data into a broader temporal framework, we also present new ion microprobe U–Pb zircon ages from Variscan granitoids intruding the upper unit, which record the thermal evolution of the structurally higher part of the inverted sequence.
By integrating petrological modelling with high-resolution geochronology, this study aims to refine the pressure–temperature–time (P-T-t) evolution of the Tatric Superunit and to better constrain the tectonothermal mechanisms responsible for Variscan metamorphic inversion in the Western Carpathians. Rather than redefining the existence of metamorphic inversion, our contribution lies in improving its quantitative characterization and assessing its geodynamic significance in the context of Variscan crustal thickening and nappe tectonics.
2. Geological setting
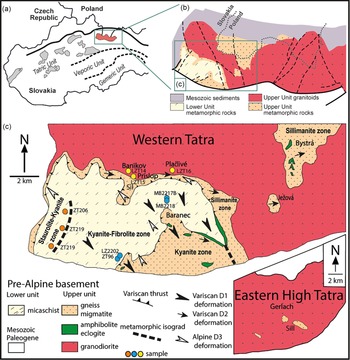
In the Western Tatra Mountains, metamorphic rocks are well exposed and structurally separated by a major tectonic discontinuity, commonly interpreted as a Variscan thrust fault. Kinematic indicators suggest top-to-the-south, south-east thrusting of the upper unit onto the lower unit (Fritz et al. Reference Fritz, Neubauer, Janák and Putiš1992; Janák, Reference Janák1994; Janák et al. Reference Janák, Hurai, Ludhová, O´Brien and Horn1999; Figure 1c). In the eastern, High Tatra segment, metamorphic rocks occur as small, isolated bodies embedded within Variscan granitoids, likely representing the structurally highest portions of the upper unit. Both upper and lower units, as well as their tectonic contact, are exposed in the Western Tatra Mts (Fritz et al. Reference Fritz, Neubauer, Janák and Putiš1992; Janák, Reference Janák1994), the area investigated in this study (Figure 1).
(a) Location of the Tatra Mountains within the Western Carpathians; (b) simplified map of the Tatra Mountains showing the main tectonostratigraphic units; (c) geological map of the study area with the main tectonic units of the Tatra Mountains. Metamorphic zones and isograds, the Variscan thrust separating the upper and lower units, and the shear sense of Variscan and Alpine deformation are indicated. Blue and orange circles mark the locations of samples from the St–Ky and Ky–Fib metamorphic zones, respectively, while yellow circles indicate the magmatic sample. Modified after Janák et al. (Reference Janák, Hurai, Ludhová, O´Brien and Horn1999).

2.a. Lower unit of the Tatra mountains
The lower unit is exposed within a tectonic window and attains an exposed thickness of up to 1000 metres. It consists mainly of mica schists with intercalations of quartz-rich metapsammites and subordinate metapelites. Kahan (Reference Kahan1968) interpreted this assemblage as the metamorphosed equivalent of a flysch-type sedimentary succession. Two distinct metamorphic zones have been identified within the lower unit: (a) staurolite–kyanite (St–Ky) zone in the western part and (b) kyanite-fibrolite (Ky–Fib) zone in the east (Figure 1c; Janák, Reference Janák1994). This transition reflects an increase in metamorphic grade up-structural section towards the major Variscan thrust fault, with estimated peak conditions ranging from ∼570°C to 640°C at pressures of 6–7 kbar (Janák, Reference Janák1994).
Geochronological data for the lower unit are limited. Monazite electron microprobe dating conducted by Moussallam et al. (Reference Moussallam, Schneider, Janák, Thöni and Holm2012) on four mica schist samples yielded two age groups: two samples gave consistent ages of ∼370–372 Ma, whereas two others recorded older ages of ∼418 Ma and ∼479 Ma, although with several analyses clustering near 370 Ma. Based on U-Pb dating, Kohút et al. (Reference Kohút, Poller, Gurk and Todt2008, Reference Kohút, Linnemann, Hofmann, Gärtner and Zieger2022) and Soejono et al. (Reference Soejono, Bukovská, Collett, Novotná, Kohút, Janoušek, Zelinková, Jitka Míková, Schulmann, Hora and Veselovský2024) constrained the maximum depositional ages of detrital zircons from the lower and upper units at approximately 524 and 526 Ma.
2.b. Upper unit of the Tatra mountains
The upper unit consists of a volcano-sedimentary succession characteristic of a former passive continental margin and includes paragneisses, orthogneisses, migmatites, amphibolites with lenses of retrogressed eclogites and granitoids. The base of the upper unit (Figure 1c) marks the transition to kyanite zone, marked by the appearance of kyanite in paragneisses and the development of leucosome segregations indicative of incipient migmatization at P–T conditions of up to 10–12 kbar and 700–735°C (Janák et al. Reference Janák, Hurai, Ludhová, O´Brien and Horn1999). Orthogneisses exhibit mylonitic textures with augen-like K-feldspar porphyroclasts (Janák, Reference Janák1994; Poller et al. Reference Poller, Janák, Kohút and Todt2000). Banded amphibolites display alternating mafic and felsic layers (tonalitic to trondhjemitic) on a millimetre to decimetre scale, and eclogite boudins in banded amphibolites are strongly retrogressed (Janák et al. Reference Janák, O´Brien, Hurai and Reutel1996). Eclogite from the Baranec area in the Western Tatra shows minimum peak-pressure conditions of 15–16 kbar at 670–700°C and overprint upper amphibolite to granulite facies conditions at 10–14 kbar and 700–750°C (Janák et al. Reference Janák, O´Brien, Hurai and Reutel1996). At higher structural levels, in the sillimanite zone, migmatization becomes more pervasive. Index minerals include prismatic sillimanite, garnet, K-feldspar and cordierite (Janák et al. Reference Janák, Hurai, Ludhová, O´Brien and Horn1999; Ludhová and Janák, Reference Ludhová and Janák1999). Thermodynamic modelling of sillimanite-bearing paragneisses and migmatites from the High Tatra yielded P–T conditions of partial melting at 7–8 kbar and 760–770°C (Janák et al. Reference Janák, Petrik, Konečný, Kurylo, Kohút and Madaras2022). Amphibolites from the Bystrá area contain garnet but no relics of eclogite-facies metamorphism. The structurally highest levels of the upper unit are intruded by a sheet-like granitoid body (Gorek, Reference Gorek1959), varying in composition from leucogranite to biotite tonalite and amphibole-bearing diorite (Kohút and Janák, Reference Kohút and Janák1994).
In contrast to the lower unit, the upper unit has been extensively dated. SIMS U–Pb zircon dating of eclogite from Baranec records two metamorphic events: (a) at 367 Ma, interpreted as the minimum age of eclogite-facies metamorphism, and (b) at 349 Ma, recording retrogression under amphibolite-facies conditions (Burda et al. Reference Burda, Klötzli, Majka, Chew, Li, Liu, Gawęda and Wiedenbeck2021). In contrast, Lu–Hf dating of extensively retrogressed eclogite from Bryšno yielded 356 Ma age (Kohút et al. Reference Kohút, Anczkiewicz and Boczkowska2023). Dating of monazite (Th–U–Pb method, Janák et al. Reference Janák, Petrik, Konečný, Kurylo, Kohút and Madaras2022) and garnet (Lu-Hf and Sm-Nd methods, Kohút et al. Reference Kohút, Anczkiewicz and Boczkowska2023) in paragneisses and migmatites from the High Tatra yielded consistent results, constraining high-grade metamorphism and partial melting to 350–345 Ma. Numerous granitoids have been dated by U–Pb zircon geochronology yielding crystallization ages between 350–340 Ma (Poller et al. Reference Poller, Janák, Kohút and Todt2000; Burda et al. Reference Burda, Gawęda and Klötzli2013; Gawęda et al. Reference Gawęda, Burda, Klötzli, Golonka and Szopa2016, Reference Gawęda, Szopa, Chew, O’Sullivan, Burda, Klötzli and Golonka2018; Kohút and Larionov, Reference Kohút and Larionov2021; Broska et al. Reference Broska, Janák, Svojtka, Yi, Konečný, Kubiš and Maraszewska2022; Catlos et al. Reference Catlos, Broska, Kohút, Etzel, Kyle, Stockli, Miggins and Campos2022). 40Ar/39Ar dating of biotite from migmatitic garnet-sillimanite gneiss suggests cooling below closure temperatures of 300–350°C at 330–300 Ma, marking the final exhumation of the upper unit (e.g. Janák and Onstott, Reference Janák and Onstott1993; Janák, Reference Janák1994).
3. Analytical methods
3.a. Electron microprobe analysis
Quantitative chemical analyses of garnet, feldspar, biotite and staurolite, as well as garnet X-ray maps, were carried out using a JEOL SuperProbe JXA-8230 at the AGH University of Krakow, Poland. All analyses were performed at an accelerating voltage of 15 kV, 20nA beam current and beam size between 1 and 5μm depending on mineral. Analytical conditions for X-ray maps of garnet were as follows: 15 kV accelerating voltage, 100 nA beam current, 100 ms dwell time and a step size of 2 μm. All EMP data are provided in the supplementary materials.
Zirconium concentrations in rutile were measured using the JEOL JXA-8530F at the Earth Science Institute of the Slovak Academy of Sciences in Banská Bystrica. Analytical conditions included an accelerating voltage of 15 kV, a probe current of 150 nA and a beam diameter of 3–7 μm depending on grain size. Measurement times were 300 seconds on-peak and 150 seconds on-background. High-sensitivity H- and L-type spectrometers were employed for Zr detection. The detection limit for Zr was 17 ppm, with an analytical uncertainty of 6–2% for concentrations between 200 and 600 ppm, and ≤2% for concentrations ≥1000 ppm.
Quantitative chemical characterization of monazite was performed using wavelength-dispersive X-ray spectroscopy (WDS) on electron microprobes at two laboratories: the Polish Geological Institute – National Research Institute in Warsaw (Cameca SX-100) and the Department of Earth Sciences, Uppsala University (JEOL JXA-8530F). Both instruments were used for point analyses and X-ray mapping of monazite grains. Analytical conditions included a beam current of 40 nA, an accelerating voltage of 15 kV and a focused beam with a diameter of 0.5–1 μm. The dwell time was set to 200 ms per point. X-ray maps were acquired with pixel size adapted to the grain dimensions and targeted Y, Th, Nd and Ca distributions to detect compositional zoning. Elemental calibration was performed using the following standards: jadeite and wollastonite for Si, wollastonite for Ca, orthoclase for K and Al, olivine for Fe, crocoite for Pb, arsenopyrite for As and glasses or pure-element phosphates for U, Th and rare earth elements (REE): YPO4 (Y), SrPO4 (Sr), GdPO4 (Gd), DyPO4 (Dy), SmPO4 (Sm), NdPO4 (Nd), PrPO4 (Pr), CePO4 (Ce) and LaPO4 (La). BaSO4 was used as a standard for S. Data were processed using XMapTools (Lanari et al. Reference Lanari, Vho, Bovay, Airaghi and Centrella2019). All monazite chemistry data can be found in supplementary materials.
3.b. Laser Ablation inductively coupled plasma mass spectrometry (LA-ICP-MS)
In situ Th–U–Pb isotope analysis of monazite was conducted at the Vegacenter, Swedish Museum of Natural History (Stockholm), using a Nu Plasma 3 multi-collector ICP-MS (MC-ICP-MS) coupled with an ESI-New Wave NWR193UC ArF excimer laser ablation system (λ = 193 nm). Ablation was performed for 18 seconds per spot with a repetition rate of 5 Hz, a fluence of ∼3.4 J/cm2 and a spot diameter of 8 μm.
Isotope data were calibrated against the 44069 monazite reference material (age = 424 Ma; Aleinikoff et al. Reference Aleinikoff, Schenck, Plank, Srogi, Fanning, Kamo and Bosbyshell2006). Additional reference materials included Manangotry (555 Ma; Horstwood et al. Reference Horstwood, Foster, Parrish, Noble and Nowell2003) and Skalná (311 Ma; Konečný et al. Reference Konečný, Kusiak and Dunkley2018). Age calculations used iterative 207Pb corrections based on the Stacey and Kramers (Reference Stacey and Kramers1975) crustal Pb isotope evolution model. The 206Pb/238U ages were corrected using 207Pb, whereas 207Pb/206Pb ages were corrected using measured 204Pb. All reported isotope ratios and ages include 2σ analytical uncertainties. All data can be found in supplementary materials.
3.c. Secondary ion mass spectrometry (SIMS)
Secondary ion mass spectrometry (SIMS) U-Pb and oxygen isotope analyses in zircon were performed using a CAMECA IMS1280 large-geometry ion microprobe at the Swedish Museum of Natural History. Separated and hand-picked zircon grains were cast into epoxy mounts together with reference zircon grains and polished to reveal their interiors. Prior to SIMS analysis, a very thin gold coat (<5 nm) was applied, and all grains were imaged using FEI Quanta 650 with an Oxford Instruments Chroma CL2 detector. An additional 25 nm of gold was then added for the SIMS analyses.
Analytical protocols for U-Pb broadly followed those described by Whitehouse and Kamber (Reference Whitehouse and Kamber2005) and references therein. A ca. 10 nA O2- primary beam with 23 kV incident energy (−13kV primary, +10 kV secondary) was generated using an Oregon Physics H201 RF-plasma source and used to sputter zircon. For this study, the primary beam was operated in critically focused (Gaussian) mode with a small raster retained during analysis to flatten the bottom of the ca. 15 μm analytical crater. Presputtering with a 25 μm raster for 60 seconds, centring of the secondary ion beam in the 3000 μm field aperture (FA), mass calibration optimization and optimization of the secondary beam energy distribution were performed automatically for each run, field aperture and energy adjustment using the 90Zr2 16O+ species at nominal mass 196 Da. Mass calibration of all peaks in the monocollection sequence was performed at the start of each session; within-run mass calibration optimization scanned only the 90Zr2 16O+, peak, with small drift corrections applied to all mass stations in each run. A mass resolving power (M/ΔM) of ca. 5400 was used to ensure adequate separation of Pb isotope peaks from nearby HfSi+ species. Ion signals were detected using an axial ion-counting electron multiplier. All analyses were run in fully automated chain sequences. Data reduction followed the protocols described by Jeon and Whitehouse (Reference Jeon and Whitehouse2015) and assume a power law relationship between Pb+/U+ and UO2 +/U+ ratios with an empirically derived slope in order to calculate actual Pb/U ratios based on those in the M257 zircon standard (Nasdala et al. Reference Nasdala, Hofmeister, Norberg, Martinson, Corfu and Dörr2008). U concentrations and Th/U ratio were also referenced to the M257 standard. Common Pb corrections were made only when 204Pb counts statistically exceeded 3x average detector background and assume a 207Pb/206Pb ratio of 0.83 (equivalent to present-day Stacey and Kramers (Reference Stacey and Kramers1975) model terrestrial Pb). Decay constants follow the recommendations of Steiger and Jäger (Reference Steiger and Jager1977). All data can be found in supplementary materials.
3.d. Sampling strategy
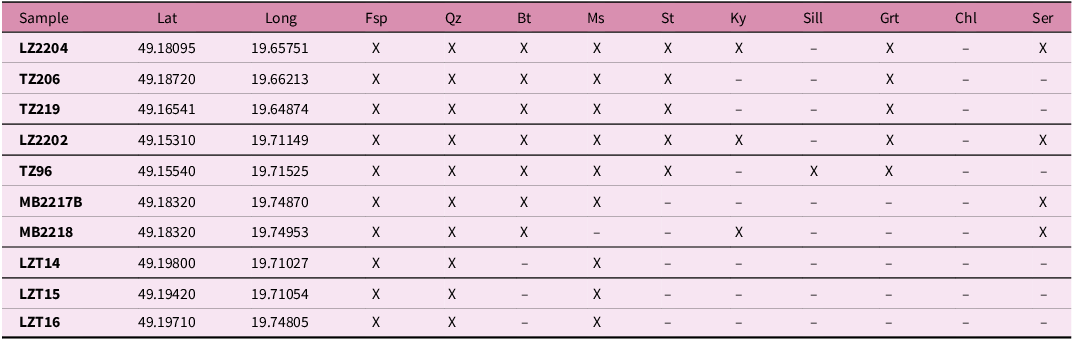
Fifteen metapelite samples were collected from the St–Ky and Ky-Fib metamorphic zones of the lower unit in the Western Tatra Mountains. Sampling was carried out along a north–south transect in the Jalovecká Valley and near the structural boundary between the Lower and upper units in the Žiarska Valley (see Figure 1c, Table 1).
Sample location and mineral assemblages of the studied samples

Seven samples were selected for detailed monazite analysis: three from Jalovecká Valley (LZ2204, ZT206 and ZT219) and four from Žiarska Valley (LZ2202, ZT96, MB2217B and MB2218). Structural measurements indicate that samples from Jalovecká Valley and LZ2202, ZT96 display a penetrative foliation dipping 45–70° to the NW–NNW. In contrast, MB2217B and MB2218, located in the upper Žiarska Valley, show a superimposed foliation parallel to SE–NW-trending fold axes. In addition, three samples of two-mica granite were collected in the upper unit, from the outcrops on Baníkov, Príslop and Plačlivé peaks (Figure 1c). The sampled rocks are coarse to medium grained granodiorites to monzogranites and are composed of quartz, plagioclase, K-feldspar, biotite and muscovite. A more detailed petrography of this granite has been described by Poller et al. (Reference Poller, Janák, Kohút and Todt2000) and is not repeated here. Zircon grains were extracted from crushed and sieved rock using standard mineral separation techniques (washing, panning, magnetic separation and heavy liquids). High-quality, inclusion-free and transparent zircons were hand-picked under a binocular microscope. Selected grains were mounted in 1-inch epoxy resin discs along with zircon reference materials (Qinghu and 91500) and subsequently polished for isotopic analysis.
4. Petrography
4.a. Staurolite–Kyanite zone
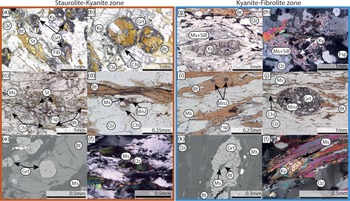
Mica schist samples from the St–Ky zone contain the following major minerals: quartz, plagioclase, biotite, muscovite, kyanite, sillimanite, staurolite, garnet and Fe–Ti oxides. Chlorite, chloritoid and margarite have been interpreted as retrograde phases, partly replacing garnet, staurolite and kyanite (Janák et al. Reference Janák, Kahan and Jančula1988). Accessory phases include zircon, monazite, apatite, tourmaline, rutile and ilmenite. Garnet occurs as euhedral to subhedral porphyroblasts, commonly rimmed by kyanite, plagioclase or staurolite (Figure 2a). Atoll-textured garnets are common, with biotite and chlorite infilling the central core (Figure 2b). Most garnets display inclusion-rich cores and inclusion-free rims (Figure 2a,b,e). Staurolite forms elongated, often poikiloblastic crystals incorporating inclusions of quartz and biotite (Figure 2a,c). Kyanite is present as elongated, bladed grains that coexist with staurolite. The mineral assemblage Grt–Qz–Pl–Fsp–Bt–Ms–Ky–St–Sill–Rt is interpreted to represent peak-pressure metamorphic conditions. Foliation is defined by alternating quartz- and mica-rich layers (Figure 2d,f), with quartz elongation parallel to the alignment of white mica, biotite and kyanite. In high-strain samples (e.g. LZ2204), quartz exhibits undulose extinction and dynamic recrystallization features such as bulging and subgrain rotation (Figure 2f). In contrast, quartz inclusions within garnet and kyanite remain strain-free. Feldspar frequently shows bent twin lamellae, indicative of deformation under ductile conditions, and often contains abundant inclusions in high-strain samples. Biotite is locally replaced by chlorite, while feldspar exhibits variable degrees of sericitization, likely resulting from late-stage fluid infiltration. Euhedral chloritoid occurs in some samples within chlorite-rich domains.
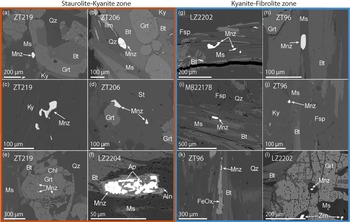
(a-f) Photomicrographs and BSE images of samples from the St-Ky zone. (a) Staurolite and kyanite with garnet inclusions. (b) Atoll garnet with central part composed of biotite and chlorite. (c) Euhedral grains of staurolite surrounded by chloritized biotite. (d) Rounded and slightly elongated grain of monazite in matrix. (e) Garnet in matrix with numerous inclusions in the central part and inclusion-free rim. (f) Dynamically recrystallized quartz grains displaying subgrain rotation and undulose extinction. (g-l) Photomicrographs of samples from the Ky-Fib zone. (g, h) Kyanite partially replaced by sericite and sillimanite. (i) Pleochroic halos around monazite in biotite. (j) Garnet with numerous inclusions, including monazite. The garnet is slightly elongated parallel to the foliation. (k) BSE image of elongated garnet grain in matrix, with Bt and Ms inclusion. (l) Dynamically recrystallized quartz grains.

4.b. Kyanite–fibrolite zone
Metapelitic samples from the Ky-Fib zone are composed of quartz, plagioclase, biotite, muscovite, garnet, kyanite, fibrolitic sillimanite and Fe–Ti oxides. Accessory minerals include zircon, monazite, apatite and tourmaline. The transition into this zone is marked by the disappearance of staurolite and the abundance of kyanite, which occurs as elongate grains aligned parallel to foliation. Kyanite is commonly replaced by fibrolitic sillimanite along grain boundaries (Figure 2g,h). Sillimanite occurs exclusively as fibrolite, either forming thin layers along foliation planes or as intergrowths with muscovite.
Garnet forms euhedral to subhedral porphyroblasts (Figure 2j,k) with inclusion zoning and local signs of resorption. Some grains contain fractures partially filled with chlorite (Figure 2k) and host larger inclusions of quartz, feldspar or biotite. As in the Ky–St zone, the foliation is defined by aligned micas, biotite, kyanite and elongate quartz (Figure 2g,i,l). Evidence for dynamic recrystallization of quartz, such as bulging grain boundaries, is observed in sample LZ2202 (Figure 2l).
Rutile, titanite and ilmenite are present in all samples. Rutile is locally overgrown or replaced by ilmenite. The mineral assemblage Grt–Qz–Pl–Fsp–Bt–Ms–Ky–Sill–Rt is interpreted to represent the peak-pressure metamorphic assemblage.
5. Mineral chemistry
5.a. Staurolite–kyanite zone
Sample ZT206, which preserves a representative assemblage of the St–Ky zone, was selected for P–T estimates. Garnet is observed in two main textural positions: (i) as inclusions within staurolite and kyanite (Figure 2a) and (ii) as isolated porphyroblasts in the matrix (Figure 2e). All garnet grains display homogeneous compositions, with near-flat chemical profiles. Representative garnet compositions are: XPrp = 0.08–0.11, XAlm = 0.77–0.81, XGrs = 0.04–0.07, and XSps = 0.05–0.08 (Fig. S1a–f, Supplementary Table S1). Plagioclase is sodic, with compositions Ab65–75An25–34Or0–1 (Supplementary Table S2). Staurolite exhibits low XMg values between 0.14 and 0.17 (XMg = Mg/[Mg + Fe2+], Supplementary Table S5). Matrix biotite has XMg values between 0.46 and 0.48, with TiO2 contents ranging from 0.09 to 0.11 apfu (Supplementary Table S4). White mica is muscovite, with Si contents from 3.02 to 3.11 apfu and Na = 0.14–0.20 apfu (Supplementary Table S3).
5.b. Kyanite–fibrolite zone
Sample ZT96, exhibiting the least retrogression, was chosen as representative for P–T estimation in the Ky–Fib zone. Garnet is compositionally homogeneous with the following ranges: XPrp = 0.06–0.14, XAlm = 0.65–0.68, XGrs = 0.03–0.04, and XSps = 0.16–0.24 (Fig. S1g-j, Supplementary Table S1). Zoning is observed, with increasing spessartine and decreasing pyrope contents toward the rim (Fig. S1d). Plagioclase is rich in albite with compositions Ab59–75An16–40Or0–3 (Supplementary Table S2). Biotite in the matrix has XMg = 0.52–0.56 and Ti = 0.002–0.118 apfu (Supplementary Table S4). Inclusions of biotite in garnet show slightly higher XMg values of 0.54–0.61 and similarly low Ti contents (0.002–0.118 apfu). White mica compositions range from 3.02 to 3.10 apfu Si (Supplementary Table S3).
6. Pressure-temperature estimates
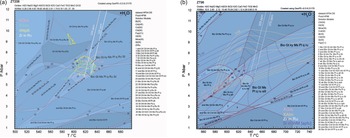
The pressure–temperature (P–T) conditions recorded by metapelitic schists of the lower unit were constrained using a combination of thermodynamic phase equilibria modelling and zirconium-in-rutile geothermometry. P–T pseudosections were calculated for two representative samples: ZT206 from the St–Ky zone and ZT96 from the Ky-Fib zone, using the GeoPS software (Xiang and Connolly, Reference Xiang and Connolly2022). Calculations employed the internally consistent thermodynamic dataset of Holland and Powell (Reference Holland and Powell1998), updated in 2004 (HP04.DS). Bulk compositions (given in mol%), determined from XRF whole-rock analyses, are shown in the respective pseudosection diagrams. Activity–composition models for garnet, white mica, chlorite, cordierite, chloritoid, staurolite (White et al. Reference White, Powell, Holland, Johnson and Green2014) and feldspar (Holland and Powell, Reference Holland and Powell2003) were used in the modelling. Phase diagrams were constructed in the NCKFMMnASTH system (Figure 3), assuming H2O in excess. The modelled P–T ranges were 500–700°C and 1–12 kbar for sample ZT206 and 550–750°C and 1–12 kbar for sample ZT96. In addition, the pressure-dependent Zr-in-rutile thermometer of Tomkins et al. (Reference Tomkins, Powell and Ellis2007) was applied to both samples.
(a) Phase equilibrium diagram of mica schist (ZT206) from the St-Ky zone. (b) Phase equilibrium diagram of mica schist (ZT96) from the Ky-Fib zone.

6.a. Staurolite–Kyanite zone
The peak metamorphic conditions for sample ZT206 were determined using compositional isopleths of garnet (XGrs = 0.05–0.07; XSps = 0.05–0.07) and staurolite (XMg = 0.14–0.17). The intersection of these isopleths defines a P–T field of 6–8 kbar and 600–640°C, within the stability fields of garnet + muscovite + biotite + staurolite ± kyanite + plagioclase + rutile + quartz (Figure 3a), which is consistent with petrographic observations described above.
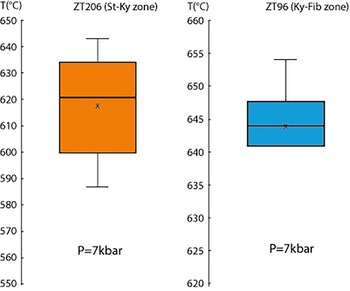
Rutile in sample ZT206 is found both in the matrix, associated with quartz and plagioclase, and as inclusions within garnet, staurolite and kyanite. Zirconium concentrations (15 analyses) range from 155 to 326 ppm, with the lowest values in staurolite-hosted rutile and the highest in kyanite-hosted rutile. The average Zr content (239 ppm) yields a temperature of 618°C at 7 kbar, while the maximum value (326 ppm) corresponds to 643°C (Figure 4a). A pressure of 7 kbar was chosen based on the results of phase equilibrium modelling.
Results of Zr-in-rutile thermometry.

6.b. Kyanite–fibrolite zone
P–T conditions for sample ZT96 were estimated from compositional isopleths of garnet (XGrs = 0.03–0.04; XAlm = 0.65–0.68) and white mica (Si = 3.02–3.06 apfu). These isopleths intersect within the stability field of biotite + garnet + kyanite + muscovite + plagioclase + quartz + rutile, defining P–T conditions of 6.5–8.5 kbar and 650–690°C (Figure 3b).
Rutile occurs both in the matrix (associated with muscovite, quartz and plagioclase) and as inclusions in kyanite. Zr concentrations (10 analyses) range from 274 to 370 ppm, with negligible differences between inclusion- and matrix-hosted rutile. The average Zr content (329 ppm) yields a temperature of 644°C at 7 kbar, and the maximum value (370 ppm) corresponds to 654°C (Figure 4b).
In summary, the combined results indicate peak metamorphic conditions of approximately 600–640°C at 6–8 kbar for the St–Ky zone, and 640–655°C at 6.5–8.5 kbar for the structurally higher Ky-Fib zone. These are consistent with previous P–T estimates based on conventional geothermobarometry (∼570–640°C and 6–7 kbar; Janák, Reference Janák1994).
7. Monazite and its textural position
7.a. Staurolite–kyanite zone
Monazite grains occur predominantly in the matrix (Figures 2d and 5a,b) and less frequently as inclusions in garnet, staurolite, kyanite or Fe–Ti oxides (Figures 5c–e). Grains are typically rounded to slightly elongated, with long axes ranging from ∼20 to 150 μm (average ∼50 μm). Inclusions within garnet are generally smaller (up to 8 μm; Figure 5e). Lower-strain samples (ZT219 and ZT206) contain larger monazite grains compared to the more deformed sample LZ2204. Irregular and jagged grain morphologies are occasionally observed (Figure 5c,d). Matrix-hosted monazite commonly occurs adjacent to biotite, muscovite and quartz, but is also found as inclusions in porphyroblastic feldspar and Fe-oxides. Allanite–apatite coronas around monazite are frequent in LZ2204 and rare in ZT206 and ZT219 (Figure 5f).
BSE images of monazite grains in different mineral assemblages. The left panel (a-f) shows monazite from the St-Ky zone of the lower unit, while the right panel (g-l) shows monazite from the Ky-Fib zone. (a, b) Rounded monazite grains in matrix. (c) Monazite in kyanite. (d) Monazite in staurolite. (e) Monazite in garnet. (f) Matrix monazite surrounded by coronas of allanite and apatite. (g) Irregularly shaped monazite in muscovite. (h, i) Rounded monazite in matrix. (j) Monazite in kyanite. (k) Monazite at the boundary between biotite and FeOx. (l) Garnet with monazite inclusion, garnet also visible in Figure 2h.

7.b. Kyanite–fibrolite zone
Monazite in the Ky-Fib zone is predominantly matrix-hosted (Figure 5g–i), with rare inclusions in garnet and kyanite (Figure 5j,l). Monazite grains are rounded to slightly elongated, ranging from ∼15 to 100 μm (average ∼40 μm). Inclusions within garnet are up to 10 μm in size. As in the Ky–St zone, grain morphologies are variable and include concave or irregular forms (Figure 5g). No clear relationship was observed between the monazite texture (shape, position) and metamorphic grade. The only consistent trend is a decrease in grain size with increasing strain.
7.c. Monazite composition and zoning
Compositional X-ray maps for Y, Nd, Ca and Th were acquired using EMP to evaluate internal zoning patterns in monazite. Representative maps for all dated samples are shown in Figure 6, with compositional trends summarized in Figure 7. Variations in element distribution reflect controls from local bulk chemistry, mineral assemblage, P–T conditions and redox state (e.g. Catlos, Reference Catlos2013).
High-contrast BSE images, Th, Y and Ca elemental maps of representative monazite grains from the lower unit. (a–c) Staurolite-Kyanite zone (St-Ky): Monazite grains exhibit pronounced zonation in Y and Th, with Y typically increasing from core to rim, while Th zonation is patchy. LA-ICP-MS (yellow circles) and EMPA (pink dots) analysis spots are marked. (d–g) Kyanite-Fibrolite zone (Ky-Fib): Monazite grains display similar zonation patterns, with Y-enriched rims and patchy Th distribution. Ca zonation is irregular, with Ca-depleted cores and Ca-rich rims in some grains. Analysis spots are indicated.

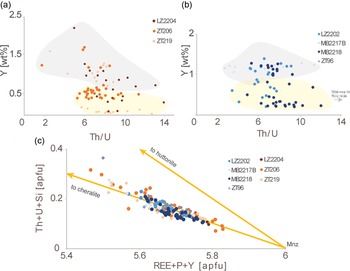
(a, b) Y vs Th/U diagrams. Orange and blue circles refer to the St-Ky zone and Ky-Fib zone, respectively. The background shading indicates whether the analytical spot was located in the core (yellow) or rim (grey) of the monazite. Variation in Y content between the rim and core is visible but there is no correlation with the Th/U content. (c) Monazite compositional vectors showing dominant huttonite and cheralite substitutions.

7.c.1. Staurolite–kyanite zone
Monazite exhibits either pronounced zoning in Y and Th or homogeneous compositions. Yttrium typically increases from core to rim, whereas Th zoning is patchy (Figure 6a–c). In sample LZ2204, zoning is more irregular – likely influenced by fluid infiltration, as evidenced by the presence of secondary allanite–apatite coronas (Figure 5f). Y-poor monazite cores have Y concentrations between 0.03 and 0.70 wt. % and Th/U ratios (wt. %/wt. %) of 5.43–14.27. Y-enriched rims reach up to 0.65 wt. % with Th/U ratios of 1.81–13.42 (wt. %/wt. %). Analyses plot along the monazite–cheralite substitution line (Figure 7). Chondrite-normalized REE patterns show consistent LREE enrichment and a pronounced negative Eu anomaly (Eu/Eu* = 0.04–0.25; Supplementary Table S8).
7.c.2. Kyanite–fibrolite zone
Monazite from this zone displays similar chemical characteristics to grains from the St–Ky zone, typically with Y-poor cores and Y-enriched rims, and patchy Th zoning (Figure 6d–g). In sample MB2217B, monazite shows patchy Th but uniform Y distribution. Notably, chemical zoning in Ca is observed in samples MB2217B and MB2218. In MB2217B, monazite displays Ca-depleted cores and Ca-rich rims; in MB2218, Ca distribution is irregular and does not follow a simple core–rim pattern. As in the Ky–St zone, monazite chemistry does not correlate with textural position. All grains follow the monazite–cheralite substitution trend (Figure 7) and exhibit consistent REE patterns with negative Eu anomalies (Eu/Eu* = 0.02–0.28; Supplementary Table 8). Y contents in monazite cores range from 0.20 to 0.68 wt. % with Th/U ratios of 3.49–12.23 (wt. %/wt. %); rims and homogeneous grains contain 0.75–1.73 wt. % Y and Th/U ratios of 2.78–11.56 (wt. %/wt. %).
8. Monazite geochronology
LA-ICP-MS Th–U–Pb geochronology was applied to date monazite grains and investigate intragranular age zonation revealed by element mapping. The goal was to reconstruct the episodic growth and resorption history of monazite, leveraging the high spatial resolution of the technique. However, not all observed grains could be successfully dated due to their small size or the extremely fine-scale nature of the zoning. In particular, sample LZ2204 was excluded from further interpretation due to pervasive metasomatic alteration of monazite, resulting in strongly scattered ages and pronounced discordance from the Concordia line.
A total of 56 monazite grains from six samples were analysed. Many grains exhibited distinct compositional zoning, with individual zones targeted for analysis, yielding more than 90 spot ages. Analytical uncertainties were propagated from the external reproducibility of the primary reference material (2SD), combined with the internal precision of each individual analysis (2SE). Spot discordance was calculated following the method of Gehrels (Reference Gehrels2011), and analyses with discordance >5% were excluded from age calculations.
The U–Pb data were visualized using Wetherill Concordia diagrams generated in Isoplot 6.2 (Vermeesch, Reference Vermeesch2018) to identify major age populations and assess possible correlations between Y and Th concentrations and monazite age. Despite pronounced compositional zoning, no systematic age differences were observed between monazite cores and rims. Variations in Y, Th and U content do not correlate with age. Within individual grains, age differences between zones were consistently within 2σ analytical uncertainty, indicating that zoning is not associated with distinct metamorphic events. A spatial distinction in monazite age is observed between samples from different metamorphic zones.
8.a. Staurolite–kyanite zone
Monazite in samples from the St–Ky zone yield U–Pb ages ranging from 315 to 338 Ma (Figure 8; Supplementary Table 6). For sample ZT219, the Concordia age of 318.2 ± 5.7 Ma (n = 7; MSWD = 3.6) can be calculated. Sample ZT206 yields no obvious Concordia age. Instead, the monazite age data show rather large spread from 315 to 340 Ma. These results are interpreted to reflect the timing of monazite growth during peak to post-peak metamorphic conditions, likely influenced by fluid infiltration. Textural evidence, such as allanite–apatite intergrowths and coronas around monazite and chemical maps (Figure 6) revealing irregular Y and Th zoning in these monazites, are indicative of compositional modifications during fluid infiltration.
Results of U–Pb monazite geochronology, presented in Wetherill Concordia diagrams. All uncertainties are reported at the 2σ level. The diagrams in the upper row represent monazites from the St–Ky zone, whereas those in the two lower rows represent monazites from the Ky-Fib zone.

8.b. Kyanite–fibrolite zone
Monazite grains from the Ky-Fib zone are consistently older, ranging from 342 to 333 Ma (Figure 8; Supplementary Table 6). Sample LZ2202 produced a Concordia age of 336.8 ± 1.9 Ma (n = 10; MSWD = 1.2), and sample MB2218 yielded a similar age of 332.8 ± 1.9 Ma (n = 12; MSWD = 1.7), both indicating robust and well-constrained age populations. In contrast, sample ZT96 yielded an older Concordia age of 342.3 ± 2.8 Ma (n = 6), but with a higher MSWD of 11, suggesting significant scatter likely due to Pb loss or post-crystallization disturbance. Sample MB2217B gave an age of 335.3 ± 4.0 Ma (MSWD = 5.2), also reflecting some degree of discordance. These results indicate that monazite growth in the Ky-Fib zone predates that in the underlying St–Ky zone, consistent with the observed inverted metamorphic gradient.
9. Zircon geochronology
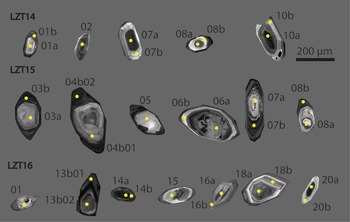
Zircon crystals from granitoids selected for U–Pb SIMS analysis were generally prismatic with well-preserved crystal faces. Cathodoluminescence (CL) imaging revealed distinct internal structures in most grains, including: (1) small, rounded inherited cores present in some grains, (2) bright-CL mantles often with well-developed oscillatory zoning, and (3) darker CL outer rims, also commonly zoned (Figure 9). A total of 76 analytical spots were acquired from 56 zircon crystals (Figure 10; Supplementary Table 7). Inherited cores were often discordant and pre-Variscan in age and were excluded from Concordia age calculations (Figure 10d–f). The analysed zircon rims yielded concordant 206Pb/238U ages that define tight age populations.
Cathodoluminescence images of zircon grains from samples LZT15, LZT14 and LZT16, showing internal zoning patterns and analytical U-Pb spots (yellow dots).

(a–c) U–Pb Concordia diagrams for zircon analyses from granitoids (LZT14, LZT15, LZT16); data-point error ellipses and calculation ellipses represent 2σ uncertainties. Only ages belonging to the group interpreted as representing crystallization are shown; inherited and (minor) Pb-loss–affected analyses are omitted. Reported MSWD values correspond to combined concordance and equivalence (after Ludwig, Reference Ludwig1998). (d–f) wtd. av. (weighted average) age plots; red analyses are included in the weighted average calculation, whereas blue analyses are excluded. MSWD and probability values are shown for each weighted average. All uncertainties are reported at the 2σ level.

Sample LZT14 yielded a concordant age of 353.0 ± 2.3 Ma (n = 19; MSWD = 0.53), with analyses clustering tightly along the Concordia (Figure 10a). Similarly, sample LZT15 produced an age of 346.5 ± 1.8 Ma (n = 19; MSWD = 0.23; Figure 10b), and sample LZT16 gave an age of 345.5 ± 1.6 Ma (n = 25; MSWD = 0.78; Figure 10c). Despite minor scatter in LZT16, all three samples yield well-defined concordant ages consistent with zircon growth in the Late Devonian to early Carboniferous.
10. Tectonometamorphic implications
The Variscan basement exposed in the Tatra Mts. preserves a well-established inverted metamorphic architecture that reflects crustal-scale thrusting during late Palaeozoic continental collision (Figure 11). Our new P–T estimates and in situ monazite geochronology from the lower unit provide critical quantitative constraints on this architecture and allow the timing and mechanics of Variscan nappe stacking to be reassessed in a broader orogenic context.
The monazite dating results reveal a systematic downward-younging pattern within the lower unit, with ages of ca. 342–332 Ma in the kyanite–fibrolite zone and 338–315 Ma in the structurally underlying staurolite–kyanite zone (Figure 11). These ages are consistently younger than those obtained from the overlying upper unit, where high-grade metamorphism, migmatization, and granitoid emplacement occurred between c. 370 and 340 Ma. This temporal relationship indicates that prograde metamorphism in the lower unit postdated peak metamorphism in the structurally higher nappe and overlaps with the waning stages of magmatic and thermal activity in the upper unit.
Such age relationships are characteristic of in-sequence thrusting in collisional orogens, where the hanging wall cools while the footwall experiences renewed burial and heating due to tectonic loading and crustal thickening (e.g. Jamieson et al. Reference Jamieson, Beaumont, Hamilton and Fullsack1996; Thigpen et al. Reference Thigpen, Ashley, Mako, Law and Spencer2021). In the Tatra Mts., this process resulted in a structurally inverted P–T–t configuration, in which younger, medium-grade metamorphism in the lower unit developed beneath an already exhuming high-grade upper unit. Our data thus provide direct temporal evidence that metamorphic inversion in the Tatric basement was maintained and sharpened during progressive Variscan nappe emplacement rather than representing a single, short-lived metamorphic event.
The contrasting P–T–t trajectories of the two units further underscore the role of nappe stacking in producing spatially decoupled thermal histories within thickened continental crust. The upper unit records an earlier high-pressure metamorphic stage followed by near-isothermal decompression, partial melting and syn-orogenic granitoid intrusion, consistent with exhumation from deep crustal levels (Janák et al. Reference Janák, O´Brien, Hurai and Reutel1996, Reference Janák, Hurai, Ludhová, O´Brien and Horn1999). In contrast, the lower unit reached peak pressures of ∼6–8.5 kbar at mid-crustal depths during continued convergence, reflecting tectonic burial beneath the advancing upper unit nappe. The preservation of these distinct metamorphic records implies limited thermal equilibration across the unit boundary and points to efficient mechanical decoupling during thrusting.
Comparable inverted metamorphic sequences have been described from a wide range of collisional orogens, including the Himalaya (e.g. Arita, Reference Arita1983; Swapp and Hollister, Reference Swapp and Hollister1991; Harrison et al. Reference Harrison, Grove, Lovera and Catlos1998; Vannay and Grasemann, Reference Vannay and Grasemann2001; Dasgupta et al. Reference Dasgupta, Ganguly and Neogi2004), the Scandinavian Caledonides (Gee, Reference Gee1978; Andreasson and Lagerblad, Reference Andreasson and Lagerblad1980; Rice et al. Reference Rice, Bevins, Robinson and Roberts1989; Gee et al. Reference Gee, Juhlin, Pascal and Robinson2010) and several segments of the European Variscides (Burg et al. Reference Burg, Matte, Leyreloup and Marchand1984; Kryza and Mazur, Reference Kryza and Mazur1995; Oncken, Reference Oncken1997; Ribeiro et al. Reference Ribeiro, Munhá, Dias, Mateus, Pereira, Ribeiro, Fonseca, Araújo, Oliveira, Romão, Chaminé, Coke and Pedro2007; Pitra et al. Reference Pitra, Ballévre and Ruffet2010). In the Himalaya, models invoking channelized flow of partially molten mid-crust predict younger peak metamorphic ages in the footwall relative to the hanging wall, combined with isothermal decompression and melt crystallization in the upper plate (e.g. Beaumont et al. Reference Beaumont, Jamieson, Nguyen and Lee2001, Reference Beaumont, Jamieson, Nguyen and Medvedev2004; Godin et al. Reference Godin, Grujic, Law and Searle2006; Kohn, Reference Kohn2014; Searle and Cottle, Reference Searle and Cottle2024). Similar age and P–T relationships have been documented in the Scandinavian Caledonides, where high-pressure nappes experienced decompression melting prior to being thrust over units that attained peak metamorphic conditions significantly later (Brueckner and van Roermund, Reference Brueckner and van Roermund2004; Hacker and Gans, Reference Hacker and Gans2005; Gee et al. Reference Gee, Janák, Majka, Robinson and van Roermund2012; Klonowska et al. Reference Klonowska, Janák, Majka, Petrík, Froitzheim, Gee and Sasinková2017). The Variscan belts of the Massif Central, Armorican Massif and Bohemian Massif likewise display inverted metamorphic zonation linked to thrust stacking and syn-convergent thermal reorganization (e.g. Burg et al. Reference Burg, Matte, Leyreloup and Marchand1984; Štípská and Schulmann, Reference Štípská and Schulmann1995; Pitra et al. Reference Pitra, Ballévre and Ruffet2010).
In this context, the Tatra Mountains represent a smaller-scale but well-preserved analogue of these larger systems. Although affected by subsequent Alpine deformation, the Variscan basement retains a coherent mid-crustal record of nappe emplacement, thermal reactivation and partial melting. Our new data place the lower unit firmly within this framework and demonstrate that metamorphic inversion in the Tatric basement reflects prolonged and diachronous tectonothermal evolution rather than a simple juxtaposition of unrelated metamorphic domains.
Taken together, our results provide new constraints on Late Devonian–Carboniferous nappe stacking in the Tatra Mountains (ca. 353–310 Ma) and highlight several broader implications:
-
• Thermal reactivation during thrusting. The downward-younging trend of monazite ages in the lower unit, younger than the granitoids and migmatites of the upper unit, documents footwall heating during nappe emplacement. This pattern is consistent with thrust-driven burial and channelized heat redistribution in thickened crust.
-
• Decoupled crustal evolution. Distinct pressure regimes and P–T–t paths of the upper (15–16 kbar) and lower (6–8.5 kbar) units indicate heterogeneous crustal evolution, comparable to other Variscan and Alpine collisional belts where metamorphic inversion developed through progressive stacking.
-
• Preservation of inverted metamorphic architecture. The persistence of inverted metamorphic zonation in the Tatric basement suggests that nappe stacking not only accommodated shortening but also played a key role in maintaining thermal gradients during convergence.
In summary, this study refines the quantitative framework for Variscan metamorphic inversion in the Western Carpathians by providing robust P–T estimates and geochronological constraints from the previously underconstrained lower unit. Rather than redefining the existence of inversion, our results clarify its timing, depth distribution and tectonothermal significance, placing the Tatra Mts. firmly within the spectrum of well-documented collisional orogens worldwide.
Schematic cross-section of the Western Tatra Mts. with metamorphic zonation across the main Variscan thrust fault. P–T conditions of the lower unit mica schists are from this study and those from the upper unit gneisses, migmatites and eclogites from Janák et al. (Reference Janák, O´Brien, Hurai and Reutel1996, Reference Janák, Hurai, Ludhová, O´Brien and Horn1999, Reference Janák, Petrik, Konečný, Kurylo, Kohút and Madaras2022). Geochronology data for mica schists (this study) and eclogite (Burda et al. Reference Burda, Klötzli, Majka, Chew, Li, Liu, Gawęda and Wiedenbeck2021) are also shown.

Supplementary material
The supplementary material for this article can be found at https://doi.org/10.1017/S0016756826100624
Financial support
This work was supported by the National Science Centre, Poland (Jarosław Majka, grant number 2021/43/B/ST10/02312); the Slovak Research and Development Agency (Marian Janák, grant number APVV-18-0107); and VEGA (Marian Janák, grant number 2/002/24), and by the European Commission – NextGenerationEU, through Momentum CSIC Programme: Develop Your Digital Talent (MMT24-IACT-01; Michał Bukała). NordSIMS-Vegacenter is funded by the Swedish Research Council as a national research infrastructure (Dnr. 2021-00276). This is NordSIMS publication # 817 and Vegacenter publication #095. We thank F. Finger, anonymous reviewer, and handling editor I. Klonowska for constructive reviews.


 Open access